
GREENING INDIA’S WORKFORCE - Council On Energy ...ceew.in/pdf/CEEW NRDC - Greening India's...
16
ISSUE PAPER | JUNE 2017 GREENING INDIA’S WORKFORCE Gearing up for Expansion of Solar and Wind Power in India
Transcript of GREENING INDIA’S WORKFORCE - Council On Energy ...ceew.in/pdf/CEEW NRDC - Greening India's...

I S S U E PA P E R | J U N E 2 0 1 7
GREENING INDIA’S WORKFORCEGearing up for Expansion of Solar and Wind Power in India
2 Greening India’s Workforce: Gearing Up For Expansion of Solar and Wind Power in India
ABOUT THIS REPORT
About Council on Energy, Environment and WaterThe Council on Energy, Environment and Water (CEEW) is one of South Asia’s leading not-for-profit policy research institutions. CEEW addresses pressing global challenges through an integrated and internationally focused approach. It prides itself on the independence of its high-quality research, develops partnerships with public and private institutions, and engages with the wider public. In 2017, CEEW has once again been featured extensively across nine categories in the ‘2016 Global Go To Think Tank Index Report’, including being ranked as South Asia’s top think tank (14th globally) with an annual operating budget of less than $5 million for the fourth year running. In 2016, CEEW was also ranked 2nd in India, 4th outside Europe and North America, and 20th globally out of 240 think tanks as per the ICCG Climate Think Tank’s standardised rankings. In 2013 and 2014, CEEW was rated as India’s top climate change think tank as per the ICCG standardised rankings. (http://ceew.in/) Twitter @CEEWIndia
About Natural Resources Defense Council The Natural Resources Defense Council (NRDC) is an international non-profit environmental organization with more than 2 million members and online activists. Since 1970, our lawyers, scientists, and other environmental specialists have worked to protect the world’s natural resources, public health, and the environment. NRDC’s India Initiative on Climate Change and Clean Energy, launched in 2009, works with partners in India to help build a low-carbon, sus-tainable economy. (www.nrdc.org) Twitter @NRDC_India
Authors and InvestigatorsCEEW Team: Neeraj Kuldeep, Kanika Chawla, Arunabha GhoshNRDC Team: Anjali Jaiswal, Nehmat Kaur, Sameer Kwatra, Karan Chouksey
Acknowledgements The authors of this report thank officials from India’s Ministry of New & Renewable Energy (MNRE) and the Skills Council for Green Jobs (SCGJ). We are further, grateful to the solar developers, wind developers and solar manufacturers, who shared their feedback and helped inform the findings of this report. We would also like to thank the following peer review-ers for their valuable comments: Dr. Praveen Saxena, Tanmay Bishnoi, Akhilesh Magal and Zach Amittay. We sincerely appreciate the valuable contributions by the following NRDC staff: Laasya Bhagavatula, Sayantan Sarkar, Kriti Sehgal, Christina Swanson and Leslie Jones. We thank Dexter Consultancy and Maction Consulting for their assistance in data collection for the jobs surveys. We also thank Boond Engineering & Development, Refex Energy, Indosolar, Gautam Solar, Jackson Power, Minda NexGen Tech, GSES India Sustainable Energy, Sterling and Wilson, Sun Edison, Vikram Solar, Rays Power Experts, Gensol, Azure Power, PLG Pow-er, Welspun Energies, First Solar, Moser Baer Solar, Alpex Solar, Hero Future Energies, Cirus Solar, Clean Max, Aplussolar, Focal Energy, Mahindra EPC, Tata Power Solar, L&T Construc-tion, Solaire Direct, Astonfield Renewables, Belectric, Renew Power, National Institute of Solar Energy, Claro Energy, Su-Kam, PLG Power, Nature Tech Infra, Sunsource Energy, EMC, Gamesa Renewables, Kshema Power Infrastructure, Pioneer Wincon, Enerfra, and Wind World India for participating in our surveys.
The authors would like to thank the funders of our work for their generous support.

3
Table of Contents
Executive Summary 4
1. Introduction 5
2. Scope of the Report: Direct Project-Related Jobs and Manufacturing Jobs 5
3. Methodology and Data Sample: Primary Market Surveys 6 3.1 Methodology 6 3.2 Survey Sample 8 3.2.1 Solar Developers 8 3.2.2 Wind Developers 9 3.2.3 Solar Module Manufacturers 9
4. Analysis: Estimating Job-Years Per MW for Solar and Wind Projects and Solar Manufacturing 10
4.1 Ground-Mounted Solar Projects 10 4.2 Rooftop Solar Projects 11 4.3 Wind Power Projects 11 4.4 Solar Manufacturing 11
5. Discussion and Findings 12
6. Key Policy Recommendations and Conclusion 15
4 Greening India’s Workforce: Gearing Up For Expansion of Solar and Wind Power in India
EXECUTIVE SUMMARYJob creation and skill development are key priorities for the In-dian government. Jobs created from renewable energy offer a significant opportunity to meet the government’s objectives on employment generation. However, credible information on the number of jobs that have been created so far, and those that can be created in future to achieve India’s renewable energy goal of 175 gigawatts (GW) by 2022, has been lacking.1
In an effort to fill this information gap, NRDC and CEEW con-duct annual surveys of India’s solar and wind companies, de-velopers, and manufacturers to collect accurate, market-based information on jobs created, workforce employed, and the skills required to achieve India’s renewable energy goals. This analy-sis builds on our previous reports on clean energy jobs in India. Our earlier analyses focused on renewable energy job creation, short-term and long-term. This report updates and translates those figures into actual full-time employment and workforce requirements.
The key findings of our 2017 analysis are:
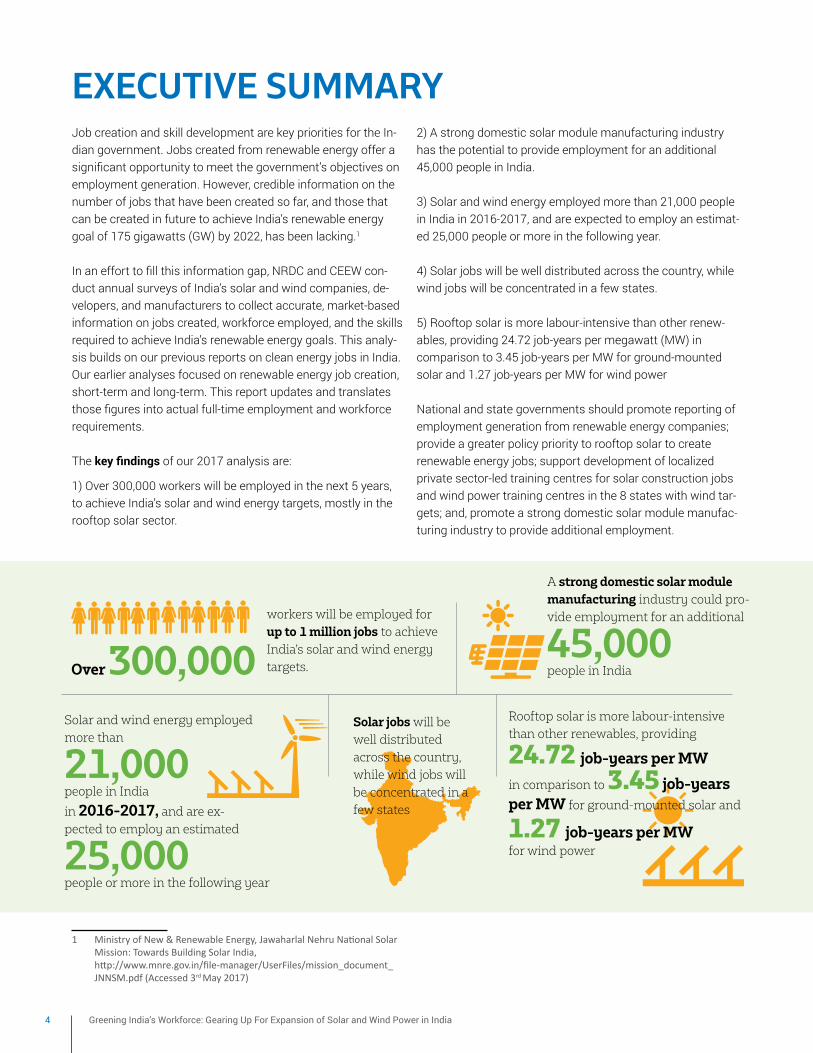
1) Over 300,000 workers will be employed in the next 5 years, to achieve India’s solar and wind energy targets, mostly in the rooftop solar sector.
1 MinistryofNew&RenewableEnergy,JawaharlalNehruNationalSolarMission:TowardsBuildingSolarIndia, http://www.mnre.gov.in/file-manager/UserFiles/mission_document_JNNSM.pdf(Accessed3rd May 2017)
workers will be employed for up to 1 million jobs to achieve India’s solar and wind energy targets.Over 300,000
A strong domestic solar module manufacturing industry could pro-vide employment for an additional
45,000 people in India
Solar and wind energy employed more than
21,000 people in India
in 2016-2017, and are ex-pected to employ an estimated
25,000 people or more in the following year
Solar jobs will be well distributed across the country, while wind jobs will be concentrated in a few states
Rooftop solar is more labour-intensive than other renewables, providing
24.72 job-years per MW
in comparison to 3.45 job-years per MW for ground-mounted solar and
1.27 job-years per MW for wind power
2) A strong domestic solar module manufacturing industry has the potential to provide employment for an additional 45,000 people in India.
3) Solar and wind energy employed more than 21,000 people in India in 2016-2017, and are expected to employ an estimat-ed 25,000 people or more in the following year.
4) Solar jobs will be well distributed across the country, while wind jobs will be concentrated in a few states.
5) Rooftop solar is more labour-intensive than other renew-ables, providing 24.72 job-years per megawatt (MW) in comparison to 3.45 job-years per MW for ground-mounted solar and 1.27 job-years per MW for wind power
National and state governments should promote reporting of employment generation from renewable energy companies; provide a greater policy priority to rooftop solar to create renewable energy jobs; support development of localized private sector-led training centres for solar construction jobs and wind power training centres in the 8 states with wind tar-gets; and, promote a strong domestic solar module manufac-turing industry to provide additional employment.

5
1. Introduction
Major economies around the world, are expanding the share of increasingly cost-competitive renewable energy technolo-gies in their energy mix. These technologies generate critical energy for growth, add new jobs to the economy, and provide livelihoods for millions. The International Renewable Energy Agency estimates that renewable energy, excluding large hydropower, employed 8.3 million people globally, in 2016.2
Renewable energy job creation and skill development is one of the Indian government’s foremost objectives. However, credible information on the number of jobs that have been created so far, and those that can be created in the future to achieve India’s renewable energy goal of 175 GW by 2022, has been lacking.3,4 5
In an effort to fill this information gap, every year for the past three years, NRDC and CEEW have surveyed India’s solar and wind companies, developers, and manufacturers to collect ac-curate, market-based information on jobs created, workforce employed, and the skills required to achieve India’s renewable energy goals.
We have used market information to estimate the workforce that would be required in India at any given time to meet the 2017 – 2022 national goals for annual capacity addition of so-lar and wind (160 GW), including ground-mounted and rooftop solar. We also estimate the number of jobs created by solar module manufacturing, as well as those that can be created if India meets its demand for solar modules domestically.
By estimating the employment impact from clean energy growth, our analysis offers actionable information to support and strengthen national and state-level policy and build sup-port for renewable energy expansion in India.
2 InternationalRenewableEnergyAgency,2017,RenewableEnergyJobs–AnnualReview2017,http://www.irena.org/DocumentDownloads/Publications/IRENA_RE_Jobs_Annual_Review_2017.pdf(Accessed30th May 2017)
3 MinistryofNew&RenewableEnergy,JawaharlalNehruNationalSolarMission:TowardsBuildingSolarIndia,http://www.mnre.gov.in/file-manager/UserFiles/mission_document_JNNSM.pdf(Accessed3rd May 2017)
4 Therenewableenergytargetof175GWincludes100GWofsolar,60GWofwind,10GWofbiomassand5GWofsmallhydro-power.Forthepurposeofthisreport,wehaveconsideredjobscreatedbysolarandwindpower,correspondingtoacumulativetargetof160GWby2022.
5 NRDC-CEEW,RenewableEnergyinIndia:EmploymentPotentialandFinancingSolutionsforSolarandWindEnergy,https://www.nrdc.org/resources/renewable-energy-india-employment-potential-and-financing-solutions-solar-and-wind-energy(Accessed3rd May 2017)
2. Scope of Analysis: Direct Solar & Wind Project-Related Jobs and Solar Manufacturing Jobs
Employment in any industry, including renewables, can be broadly classified in three categories: direct, indirect and induced. For this analysis, we estimate the direct jobs as well as portion of the indirect jobs (manufacturing) created from solar and wind projects in India. This analysis does not include induced jobs and some of the indirect jobs, for example, those in the financing and banking sectors, or those created for data analytics or meter readers in distribution companies, since those jobs may not be specific to the solar or wind sectors.
Estimating Renewable Jobs and Skills Since 2014
Although common practice internationally, companies in India do not always self-report the number of jobs created with each new solar or wind project. Our analyses strive to bridge this information gap. Every year since 2014, NRDC and CEEW have surveyed solar and wind companies to estimate numbers of job created, identify skills required, and make policy recommendations that create conditions favourable for growth of clean energy in India.
This report builds on our previous analyses on job cre-ation, Clean Energy Powers Local Job Growth in India, and Filling the Skill Gap in India’s Clean Energy Market, with an enhanced scope that includes solar rooftop developers and solar module manufacturing companies5. Our previous research estimated that expanding solar and wind energy would add about 1 million cumulative jobs for solar install-ers, maintenance workers, engineers, technicians, and per-formance data monitors while addressing growing energy demands and global climate change.

6 Greening India’s Workforce: Gearing Up For Expansion of Solar and Wind Power in India
For solar manufacturing, we have only considered module manufacturing jobs and not included other components such as inverters, cables and other balance of system components in order to calculate jobs created on account the solar power sector. Specific examples defining direct, indirect and induced jobs are described in the text box below.
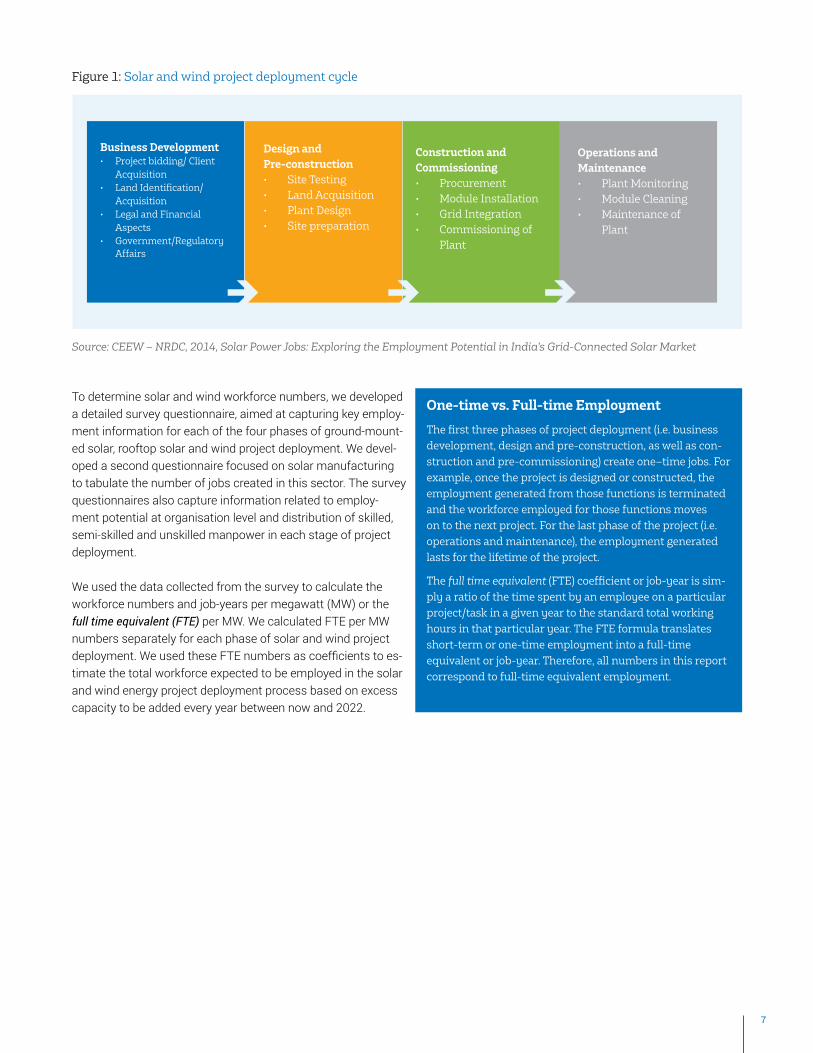
Tasks performed during the project lifecycle are classified as per the following phases of project deployment: business development, design and pre-construction, construction and commissioning and operations and maintenance, as de-scribed in figure 1.6 Each project development phase creates direct, indirect and induced employment.7
6 NRDC-CEEW,2014,SolarPowerJobs:ExploringtheEmploymentPotentialInIndia’sGrid-ConnectedSolarMarket,http://ceew.in/pdf/ceew-nrdc-india-solar-jobs-report-25aug14.pdf(Accessed3rd June 2017)
7 NationalRenewableEnergyLaboratory,2012,PreliminaryAnalysisoftheJobsandEconomicImpactsofRenewableEnergyProjectsSupportedbythe1603TreasuryGrantProgram,http://www.nrel.gov/docs/fy12osti/52739.pdf(Accessedon25thApril,2017)
3. Methodology and Data Sample: Primary Market Surveys
3.1 Methodology
The study estimates workforce required for deployment of ground-mounted and rooftop solar photovoltaic projects, solar photovoltaic module manufacturing and wind projects in India. These estimates represent direct employment in the respective sectors. The estimates are based on primary data collected from multiple organisations engaging in project deployment activities. This includes, solar module and windmill manufacturers, project developers, engineering, procurement and construction (EPC) companies and turnkey solution providers.
Difference Between Direct Jobs, Indirect Jobs and Induced Jobs7
Direct jobs, earnings, and output are the jobs asso-ciated with the design, development, management, construction/installation, and maintenance of projects and project facilities. For example, in installing a PV or large wind system, the direct impacts include the jobs for specialty contrac-tors, construction workers, clean-up crews, truck drivers, and other specialists hired to permit, design, and install the system. It also includes man-agement, business develop-ment and support staff.
Indirect jobs are the jobs associated with the man-ufacturing of equipment and materials used for the facility, the supply chain that provides raw materials and services to these manufac-turers, and the finance and banking sectors that provide services for the construction and operation of a facility. For example, for a wind facility, this would include jobs at
wind turbine manufactur-ing plants and jobs at other manufacturing facilities that fabricate structural hardware, foundations, and electrical components for the wind facility’s systems. It also includes the banker who fi-nances the construction con-tractor, the accountant who keeps the contractor’s books, and the jobs at steel mills and other suppliers that provide the necessary materials.
Induced jobs refer to the jobs created due to the spend-ing of earnings by persons directly and indirectly employed by the projects (workers in the first two cat-egories). For example, during the construction phase of a facility, jobs are induced when the workers hired to in-stall a PV system spend their earnings to purchase food at grocery stores and restau-rants, pay rent, and purchase clothes or other goods to meet their needs.
Jobs vs. Workforce/Manpower: An Explainer
In our 2015 analysis, Clean Energy Powers Local Job Growth in India, we estimated that scaling up grid-connect-ed solar and wind energy would add a cumulative 1 million jobs for solar construction workers, installers, maintenance works, engineers, technicians, and plant operators between 2015 and 2022. These jobs include short-term jobs for business development, design and pre-commissioning, and construction and commissioning, as well as long-term jobs for operation and maintenance and performance monitor-ing.
Jobs created, however, is different from workforce needed. One worker can perform more than one job because some of the jobs are short-term As a hypothetical example, assume the country has an installed capacity of 5 GW that has been deployed with a workforce of 1,500 people. In order to deploy an additional 15 GW in the following year, we would need those 1,500 people who have already been trained to deploy 5 of 15 GW as well as an additional 3,000 people to deploy the remaining 10 GW. The workforce required, therefore, is only the new 3,000 people that would need training. However, the jobs created totals 4,500 for the entire 15 GW of deployment.
In this analysis, we estimate the workforce required, i.e., number of workers needed to perform these 1 million jobs based on the planned capacity addition of grid-connected solar and wind energy between 2017 and 2022.
7
To determine solar and wind workforce numbers, we developed a detailed survey questionnaire, aimed at capturing key employ-ment information for each of the four phases of ground-mount-ed solar, rooftop solar and wind project deployment. We devel-oped a second questionnaire focused on solar manufacturing to tabulate the number of jobs created in this sector. The survey questionnaires also capture information related to employ-ment potential at organisation level and distribution of skilled, semi-skilled and unskilled manpower in each stage of project deployment.
We used the data collected from the survey to calculate the workforce numbers and job-years per megawatt (MW) or the full time equivalent (FTE) per MW. We calculated FTE per MW numbers separately for each phase of solar and wind project deployment. We used these FTE numbers as coefficients to es-timate the total workforce expected to be employed in the solar and wind energy project deployment process based on excess capacity to be added every year between now and 2022.
Figure 1: Solar and wind project deployment cycle
Source: CEEW – NRDC, 2014, Solar Power Jobs: Exploring the Employment Potential in India’s Grid-Connected Solar Market
One-time vs. Full-time Employment
The first three phases of project deployment (i.e. business development, design and pre-construction, as well as con-struction and pre-commissioning) create one–time jobs. For example, once the project is designed or constructed, the employment generated from those functions is terminated and the workforce employed for those functions moves on to the next project. For the last phase of the project (i.e. operations and maintenance), the employment generated lasts for the lifetime of the project.
The full time equivalent (FTE) coefficient or job-year is sim-ply a ratio of the time spent by an employee on a particular project/task in a given year to the standard total working hours in that particular year. The FTE formula translates short-term or one-time employment into a full-time equivalent or job-year. Therefore, all numbers in this report correspond to full-time equivalent employment.
Business Development• Project bidding/ Client
Acquisition• Land Identification/
Acquisition• Legal and Financial
Aspects• Government/Regulatory
Affairs
Design and Pre-construction• Site Testing• Land Acquisition• Plant Design• Site preparation
Construction and Commissioning• Procurement• Module Installation• Grid Integration• Commissioning of
Plant
Operations and Maintenance• Plant Monitoring• Module Cleaning• Maintenance of
Plant
8 Greening India’s Workforce: Gearing Up For Expansion of Solar and Wind Power in India
3.2 Survey Sample
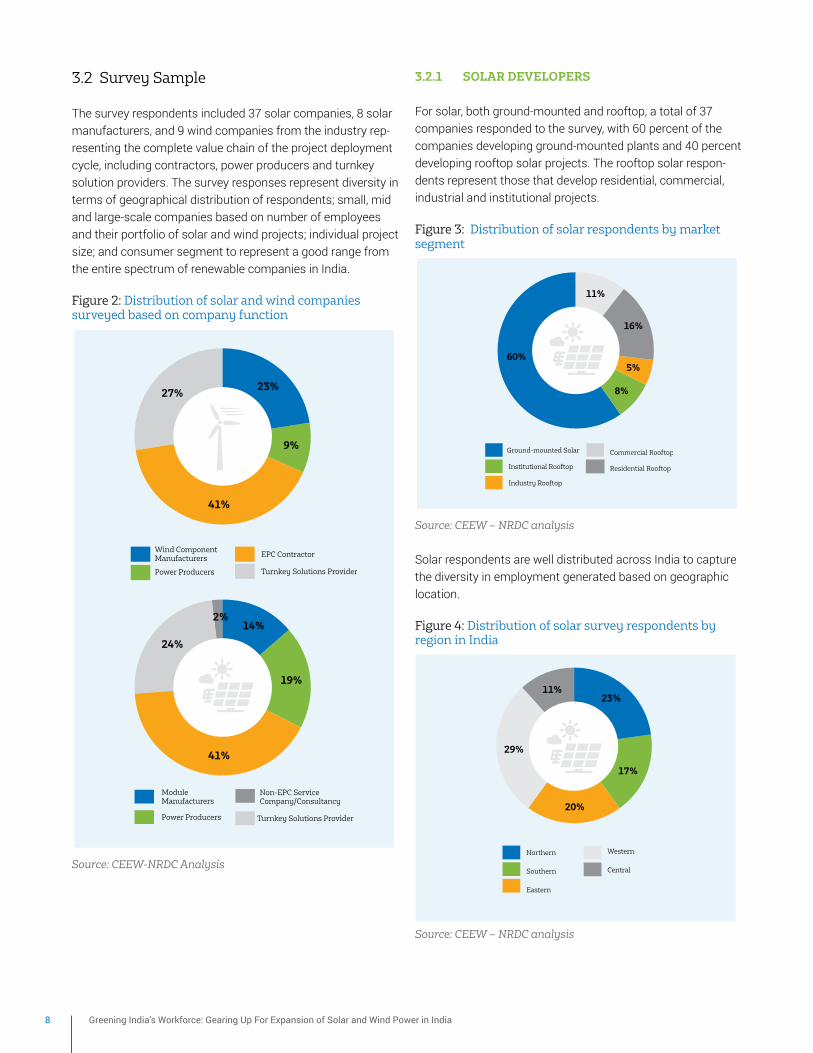
The survey respondents included 37 solar companies, 8 solar manufacturers, and 9 wind companies from the industry rep-resenting the complete value chain of the project deployment cycle, including contractors, power producers and turnkey solution providers. The survey responses represent diversity in terms of geographical distribution of respondents; small, mid and large-scale companies based on number of employees and their portfolio of solar and wind projects; individual project size; and consumer segment to represent a good range from the entire spectrum of renewable companies in India.
Figure 2: Distribution of solar and wind companies surveyed based on company function
Source: CEEW-NRDC Analysis
3.2.1 SOlAR DEvElOPERS
For solar, both ground-mounted and rooftop, a total of 37 companies responded to the survey, with 60 percent of the companies developing ground-mounted plants and 40 percent developing rooftop solar projects. The rooftop solar respon-dents represent those that develop residential, commercial, industrial and institutional projects.
Figure 3: Distribution of solar respondents by market segment
Source: CEEW – NRDC analysis
Solar respondents are well distributed across India to capture the diversity in employment generated based on geographic location.
Figure 4: Distribution of solar survey respondents by region in India
Source: CEEW – NRDC analysis
Turnkey Solutions Provider
EPC Contractor
Power Producers
Wind Component Manufacturers
27%23%
41%
9%
24%
14%2%
41%
19%
Non-EPC Service Company/Consultancy
Turnkey Solutions Provider
EPC Contractor
Power Producers
Module Manufacturers
Ground-mounted Solar
Institutional Rooftop
Industry Rooftop
Commercial Rooftop
Residential Rooftop
60%
11%
16%
5%
8%
Western
Central
Northern
Southern
Eastern
23%
17%
20%
29%
11%

9
The solar respondents represent, small, mid and large-scale companies, based on number of employees and operational solar capacity. For solar power, both ground-mounted and rooftop, about 47 percent of the companies surveyed have between 100 to 250 employees representing a good range of small to large companies. Of the respondents, about 40 percent of the companies have deployed more than 200 MW of solar capacity each and about 40 percent control capacities of less than 50 MW. This highlights the participation of early stage companies in our survey.
Figure 5: Distribution of solar companies surveyed based on number of employees
Source: CEEW – NRDC analysis
Figure 6: Distribution of companies surveyed by operational installed capacity
Source: CEEW-NRDC Analysis
3.2.2 WIND DEvElOPERS
For wind, respondents represent close to 15,000 MW of installed wind capacity – about half the total installed capac-ity in the country. Respondents reflect a fair share of wind
companies involved in different functions throughout the entire lifecycle of a wind energy project, including component manufacturers, power producers, installers and turnkey solu-tions providers.
However, the survey data for wind manufacturing companies is not as granular as that for solar companies. Because of the nature of the wind industry, with many companies taking on multiple functions, segregation by phase and job type to estimate job-years or FTE per MW in the wind manufacturing industry is challenging and complex. Companies perform different tasks, both in terms of project deployment as well as component manufacturing. For example, it becomes difficult to estimate job-years per MW for a company that manufac-tures different wind equipment in different quantities and also does project deployment.
3.2.3 SOlAR MODUlE MANUFACTURERS
Representatives of eight of India’s leading solar module manufacturing companies, eight companies with cumulative production of more than 1,500 MW, responded to our surveys. Respondents include smaller companies with a manufac-turing capacity of about 5 MW per year as well as some of the larger manufactures with upwards of 500 MW of annual production capacity.
Respondents from the solar module manufacturing segment represents small, mid and large-scale companies, based on annual production capacity and total employee strength.
Figure 7: Distribution of companies by annual production capacity and number of employees
Source: CEEW-NRDC Analysis
250 - 500
>500
< 100
100 - 250
22%
47%
17%
14%
200 MW - 500 MW
> 500 MW
< 50 MW
50 MW - 200 MW
40%
17%
23%
20%
0 - 50
50 - 200
> 200
25%
38%
38%
0 - 200
200 - 400
> 400
50%
25%
25%
10 Greening India’s Workforce: Gearing Up For Expansion of Solar and Wind Power in India
4. Analysis: Estimating Job-Years Per MW for Solar and Wind Projects; and Solar Module Manufacturing
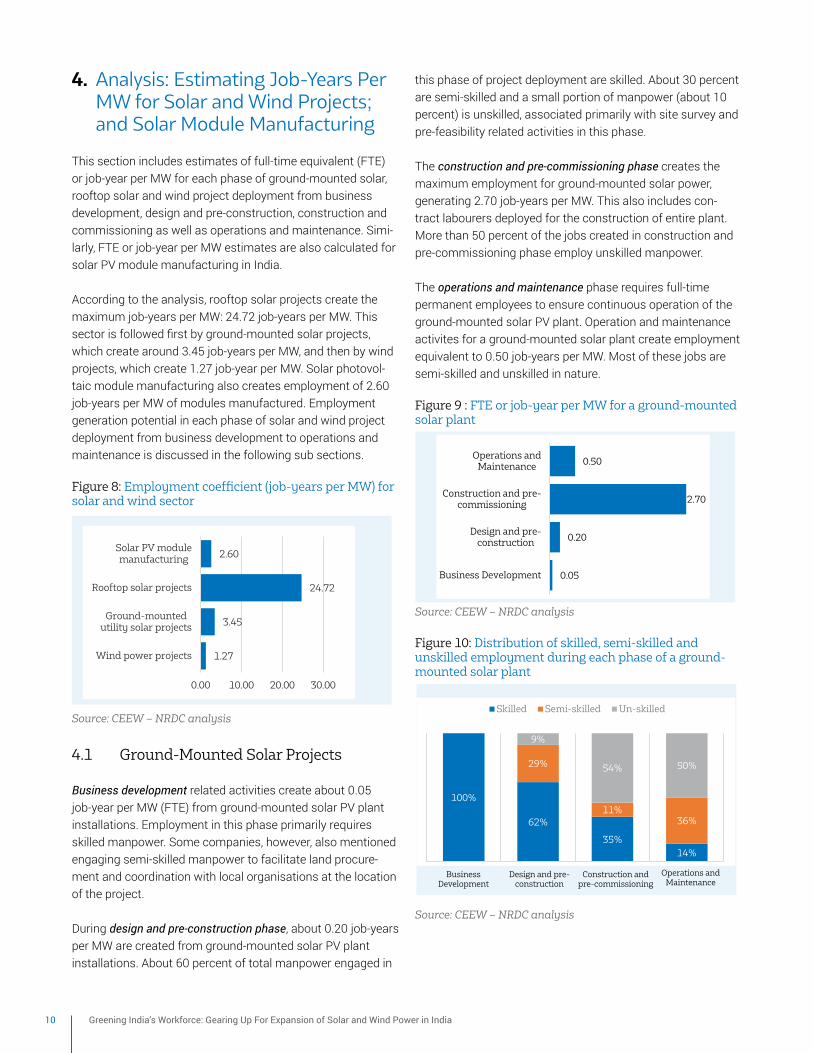
This section includes estimates of full-time equivalent (FTE) or job-year per MW for each phase of ground-mounted solar, rooftop solar and wind project deployment from business development, design and pre-construction, construction and commissioning as well as operations and maintenance. Simi-larly, FTE or job-year per MW estimates are also calculated for solar PV module manufacturing in India.
According to the analysis, rooftop solar projects create the maximum job-years per MW: 24.72 job-years per MW. This sector is followed first by ground-mounted solar projects, which create around 3.45 job-years per MW, and then by wind projects, which create 1.27 job-year per MW. Solar photovol-taic module manufacturing also creates employment of 2.60 job-years per MW of modules manufactured. Employment generation potential in each phase of solar and wind project deployment from business development to operations and maintenance is discussed in the following sub sections.
Figure 8: Employment coefficient (job-years per MW) for solar and wind sector
Source: CEEW – NRDC analysis
4.1 Ground-Mounted Solar Projects
Business development related activities create about 0.05 job-year per MW (FTE) from ground-mounted solar PV plant installations. Employment in this phase primarily requires skilled manpower. Some companies, however, also mentioned engaging semi-skilled manpower to facilitate land procure-ment and coordination with local organisations at the location of the project.
During design and pre-construction phase, about 0.20 job-years per MW are created from ground-mounted solar PV plant installations. About 60 percent of total manpower engaged in
this phase of project deployment are skilled. About 30 percent are semi-skilled and a small portion of manpower (about 10 percent) is unskilled, associated primarily with site survey and pre-feasibility related activities in this phase.
The construction and pre-commissioning phase creates the maximum employment for ground-mounted solar power, generating 2.70 job-years per MW. This also includes con-tract labourers deployed for the construction of entire plant. More than 50 percent of the jobs created in construction and pre-commissioning phase employ unskilled manpower.
The operations and maintenance phase requires full-time permanent employees to ensure continuous operation of the ground-mounted solar PV plant. Operation and maintenance activites for a ground-mounted solar plant create employment equivalent to 0.50 job-years per MW. Most of these jobs are semi-skilled and unskilled in nature.
Figure 9 : FTE or job-year per MW for a ground-mounted solar plant
Source: CEEW – NRDC analysis
Figure 10: Distribution of skilled, semi-skilled and unskilled employment during each phase of a ground-mounted solar plant
Source: CEEW – NRDC analysis
1.27
3.45
24.72
2.60
0.00 10.00 20.00 30.00
Wind power projects
Ground-mountedutility solar projects
Rooftop solar projects
Solar PV modulemanufacturing
FTE
FTE
0.05
0.20
2.70
0.50
Business Development
Design and pre-construction
Construction and pre-commissioning
Operations andMaintenance
100%
62%
35%14%
29%
11%36%
9%
54% 50%
BUSINESS DEVELOPMENT CONSTRUCTION AND PRE-COMMISSIONING
Skilled Semi-skilled Un-skilled
Business Development
Design and pre-construction
Construction and pre-commissioning
Operations and Maintenance
11
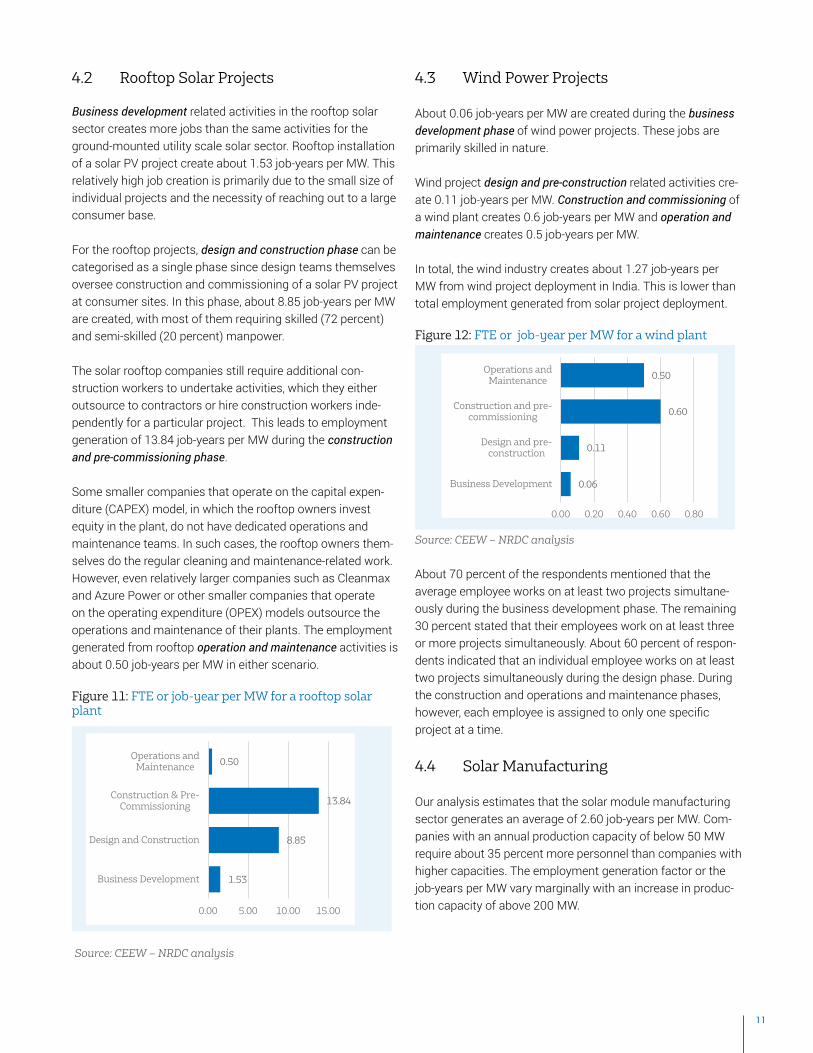
4.2 Rooftop Solar Projects
Business development related activities in the rooftop solar sector creates more jobs than the same activities for the ground-mounted utility scale solar sector. Rooftop installation of a solar PV project create about 1.53 job-years per MW. This relatively high job creation is primarily due to the small size of individual projects and the necessity of reaching out to a large consumer base.
For the rooftop projects, design and construction phase can be categorised as a single phase since design teams themselves oversee construction and commissioning of a solar PV project at consumer sites. In this phase, about 8.85 job-years per MW are created, with most of them requiring skilled (72 percent) and semi-skilled (20 percent) manpower.
The solar rooftop companies still require additional con-struction workers to undertake activities, which they either outsource to contractors or hire construction workers inde-pendently for a particular project. This leads to employment generation of 13.84 job-years per MW during the construction and pre-commissioning phase.
Some smaller companies that operate on the capital expen-diture (CAPEX) model, in which the rooftop owners invest equity in the plant, do not have dedicated operations and maintenance teams. In such cases, the rooftop owners them-selves do the regular cleaning and maintenance-related work. However, even relatively larger companies such as Cleanmax and Azure Power or other smaller companies that operate on the operating expenditure (OPEX) models outsource the operations and maintenance of their plants. The employment generated from rooftop operation and maintenance activities is about 0.50 job-years per MW in either scenario.
Figure 11: FTE or job-year per MW for a rooftop solar plant
Source: CEEW – NRDC analysis
4.3 Wind Power Projects
About 0.06 job-years per MW are created during the business development phase of wind power projects. These jobs are primarily skilled in nature.
Wind project design and pre-construction related activities cre-ate 0.11 job-years per MW. Construction and commissioning of a wind plant creates 0.6 job-years per MW and operation and maintenance creates 0.5 job-years per MW.
In total, the wind industry creates about 1.27 job-years per MW from wind project deployment in India. This is lower than total employment generated from solar project deployment.
Figure 12: FTE or job-year per MW for a wind plant
Source: CEEW – NRDC analysis
About 70 percent of the respondents mentioned that the average employee works on at least two projects simultane-ously during the business development phase. The remaining 30 percent stated that their employees work on at least three or more projects simultaneously. About 60 percent of respon-dents indicated that an individual employee works on at least two projects simultaneously during the design phase. During the construction and operations and maintenance phases, however, each employee is assigned to only one specific project at a time.
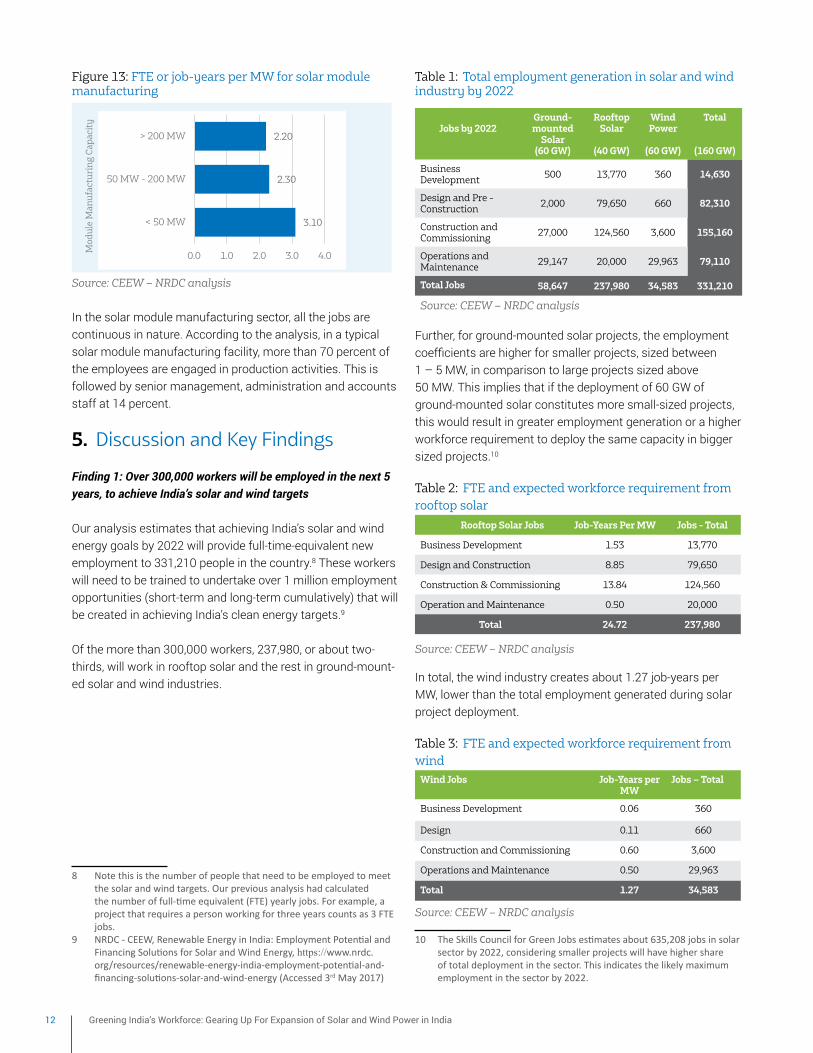
4.4 Solar Manufacturing
Our analysis estimates that the solar module manufacturing sector generates an average of 2.60 job-years per MW. Com-panies with an annual production capacity of below 50 MW require about 35 percent more personnel than companies with higher capacities. The employment generation factor or the job-years per MW vary marginally with an increase in produc-tion capacity of above 200 MW.
1.53
8.85
13.84
0.50
0.00 5.00 10.00 15.00
Business Development
Design and Construction
Construction & Pre-Commissioning
Operations andMaintenance
0.06
0.11
0.60
0.50
0.00 0.20 0.40 0.60 0.80
Business Development
Design and pre-construction
Construction and pre-commissioning
Operations andMaintenance
12 Greening India’s Workforce: Gearing Up For Expansion of Solar and Wind Power in India
Figure 13: FTE or job-years per MW for solar module manufacturing
Source: CEEW – NRDC analysis
In the solar module manufacturing sector, all the jobs are continuous in nature. According to the analysis, in a typical solar module manufacturing facility, more than 70 percent of the employees are engaged in production activities. This is followed by senior management, administration and accounts staff at 14 percent.
5. Discussion and Key Findings
Finding 1: Over 300,000 workers will be employed in the next 5 years, to achieve India’s solar and wind targets
Our analysis estimates that achieving India’s solar and wind energy goals by 2022 will provide full-time-equivalent new employment to 331,210 people in the country.8 These workers will need to be trained to undertake over 1 million employment opportunities (short-term and long-term cumulatively) that will be created in achieving India’s clean energy targets.9 Of the more than 300,000 workers, 237,980, or about two-thirds, will work in rooftop solar and the rest in ground-mount-ed solar and wind industries.
8 Notethisisthenumberofpeoplethatneedtobeemployedtomeetthesolarandwindtargets.Ourpreviousanalysishadcalculatedthenumberoffull-timeequivalent(FTE)yearlyjobs.Forexample,aprojectthatrequiresapersonworkingforthreeyearscountsas3FTEjobs.
9 NRDC-CEEW,RenewableEnergyinIndia:EmploymentPotentialandFinancingSolutionsforSolarandWindEnergy,https://www.nrdc.org/resources/renewable-energy-india-employment-potential-and-financing-solutions-solar-and-wind-energy(Accessed3rd May 2017)
Table 1: Total employment generation in solar and wind industry by 2022
Jobs by 2022Ground- mounted
Solar(60 GW)
Rooftop Solar
(40 GW)
Wind Power
(60 GW)
Total
(160 GW)
Business Development 500 13,770 360 14,630
Design and Pre - Construction 2,000 79,650 660 82,310
Construction and Commissioning 27,000 124,560 3,600 155,160
Operations and Maintenance 29,147 20,000 29,963 79,110
Total Jobs 58,647 237,980 34,583 331,210
Source: CEEW – NRDC analysis
Further, for ground-mounted solar projects, the employment coefficients are higher for smaller projects, sized between 1 – 5 MW, in comparison to large projects sized above 50 MW. This implies that if the deployment of 60 GW of ground-mounted solar constitutes more small-sized projects, this would result in greater employment generation or a higher workforce requirement to deploy the same capacity in bigger sized projects.10 Table 2: FTE and expected workforce requirement from rooftop solar
Rooftop Solar Jobs Job-Years Per MW Jobs - Total
Business Development 1.53 13,770
Design and Construction 8.85 79,650
Construction & Commissioning 13.84 124,560
Operation and Maintenance 0.50 20,000
Total 24.72 237,980
Source: CEEW – NRDC analysis
In total, the wind industry creates about 1.27 job-years per MW, lower than the total employment generated during solar project deployment.
Table 3: FTE and expected workforce requirement from wind
Wind Jobs Job-Years per MW
Jobs – Total
Business Development 0.06 360
Design 0.11 660
Construction and Commissioning 0.60 3,600
Operations and Maintenance 0.50 29,963
Total 1.27 34,583
Source: CEEW – NRDC analysis
10 TheSkillsCouncilforGreenJobsestimatesabout635,208jobsinsolarsectorby2022,consideringsmallerprojectswillhavehighershareoftotaldeploymentinthesector.Thisindicatesthelikelymaximumemploymentinthesectorby2022.
3.10
2.30
2.20
0.0 1.0 2.0 3.0 4.0
< 50 MW
50 MW - 200 MW
> 200 MW
Mod
ule
Man
ufa
ctu
rin
g C
apac
ity
13
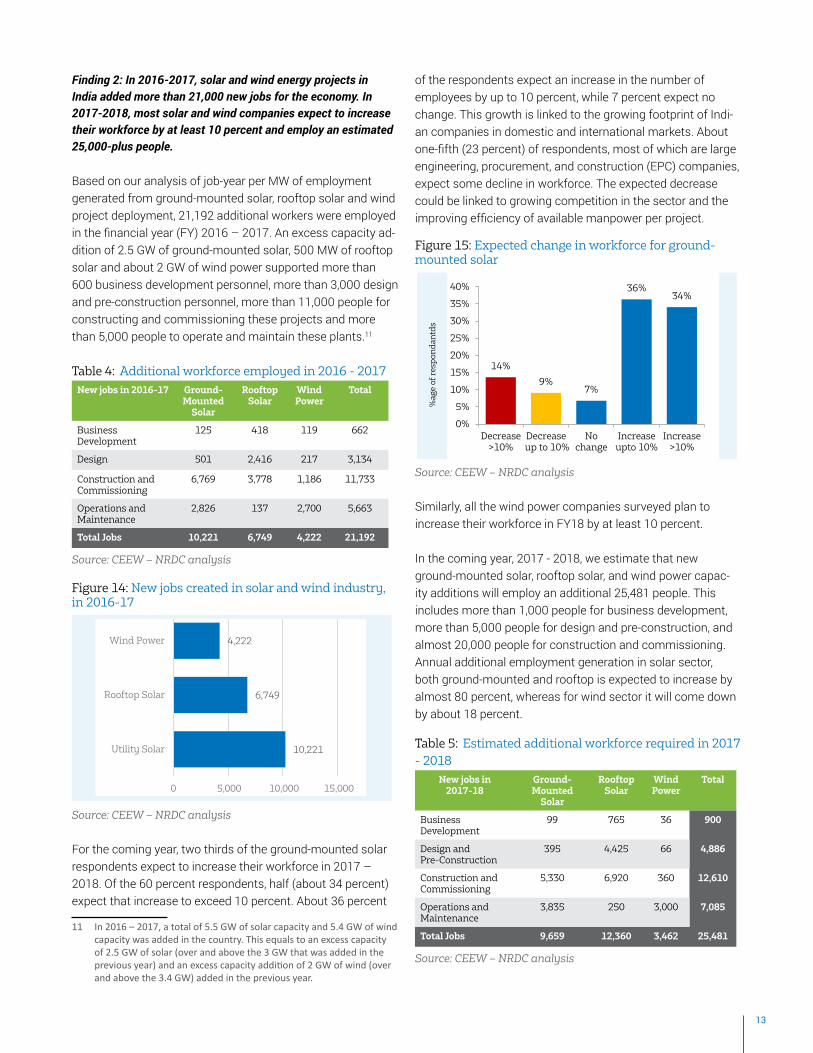
Finding 2: In 2016-2017, solar and wind energy projects in India added more than 21,000 new jobs for the economy. In 2017-2018, most solar and wind companies expect to increase their workforce by at least 10 percent and employ an estimated 25,000-plus people. Based on our analysis of job-year per MW of employment generated from ground-mounted solar, rooftop solar and wind project deployment, 21,192 additional workers were employed in the financial year (FY) 2016 – 2017. An excess capacity ad-dition of 2.5 GW of ground-mounted solar, 500 MW of rooftop solar and about 2 GW of wind power supported more than 600 business development personnel, more than 3,000 design and pre-construction personnel, more than 11,000 people for constructing and commissioning these projects and more than 5,000 people to operate and maintain these plants.11
Table 4: Additional workforce employed in 2016 - 2017 New jobs in 2016-17 Ground-
Mounted Solar
Rooftop Solar
Wind Power
Total
Business Development
125 418 119 662
Design 501 2,416 217 3,134
Construction and Commissioning
6,769 3,778 1,186 11,733
Operations and Maintenance
2,826 137 2,700 5,663
Total Jobs 10,221 6,749 4,222 21,192
Source: CEEW – NRDC analysis
Figure 14: New jobs created in solar and wind industry, in 2016-17
Source: CEEW – NRDC analysis
For the coming year, two thirds of the ground-mounted solar respondents expect to increase their workforce in 2017 – 2018. Of the 60 percent respondents, half (about 34 percent) expect that increase to exceed 10 percent. About 36 percent
11 In2016–2017,atotalof5.5GWofsolarcapacityand5.4GWofwindcapacitywasaddedinthecountry.Thisequalstoanexcesscapacityof2.5GWofsolar(overandabovethe3GWthatwasaddedinthepreviousyear)andanexcesscapacityadditionof2GWofwind(overandabovethe3.4GW)addedinthepreviousyear.
of the respondents expect an increase in the number of employees by up to 10 percent, while 7 percent expect no change. This growth is linked to the growing footprint of Indi-an companies in domestic and international markets. About one-fifth (23 percent) of respondents, most of which are large engineering, procurement, and construction (EPC) companies, expect some decline in workforce. The expected decrease could be linked to growing competition in the sector and the improving efficiency of available manpower per project. Figure 15: Expected change in workforce for ground-mounted solar
Source: CEEW – NRDC analysis
Similarly, all the wind power companies surveyed plan to increase their workforce in FY18 by at least 10 percent.
In the coming year, 2017 - 2018, we estimate that new ground-mounted solar, rooftop solar, and wind power capac-ity additions will employ an additional 25,481 people. This includes more than 1,000 people for business development, more than 5,000 people for design and pre-construction, and almost 20,000 people for construction and commissioning. Annual additional employment generation in solar sector, both ground-mounted and rooftop is expected to increase by almost 80 percent, whereas for wind sector it will come down by about 18 percent.
Table 5: Estimated additional workforce required in 2017 - 2018
New jobs in 2017-18
Ground- Mounted
Solar
Rooftop Solar
Wind Power
Total
Business Development
99 765 36 900
Design and Pre-Construction
395 4,425 66 4,886
Construction and Commissioning
5,330 6,920 360 12,610
Operations and Maintenance
3,835 250 3,000 7,085
Total Jobs 9,659 12,360 3,462 25,481
Source: CEEW – NRDC analysis
10,221
6,749
4,222
Utility Solar
Rooftop Solar
Wind Power
0 5,000 10,000 15,000
14%
9%7%
36%34%
0%
5%
10%
15%
20%
25%
30%
35%
40%
Decrease>10%
Decreaseup to 10%
Nochange
Increaseupto 10%
Increase>10%
%ag
e of
res
pon
dan
tds
Change in workforce in FY18
%ag
e of
res
pon
dan
tds
14 Greening India’s Workforce: Gearing Up For Expansion of Solar and Wind Power in India
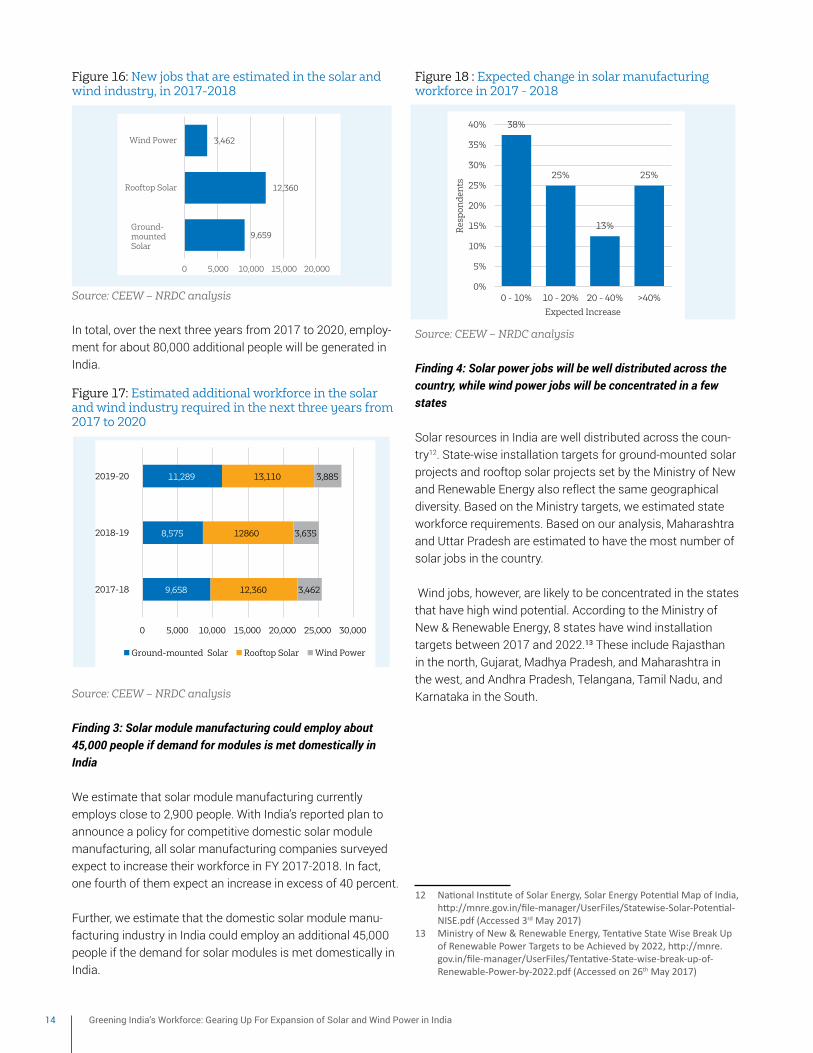
Figure 16: New jobs that are estimated in the solar and wind industry, in 2017-2018
Source: CEEW – NRDC analysis
In total, over the next three years from 2017 to 2020, employ-ment for about 80,000 additional people will be generated in India.
Figure 17: Estimated additional workforce in the solar and wind industry required in the next three years from 2017 to 2020
Source: CEEW – NRDC analysis
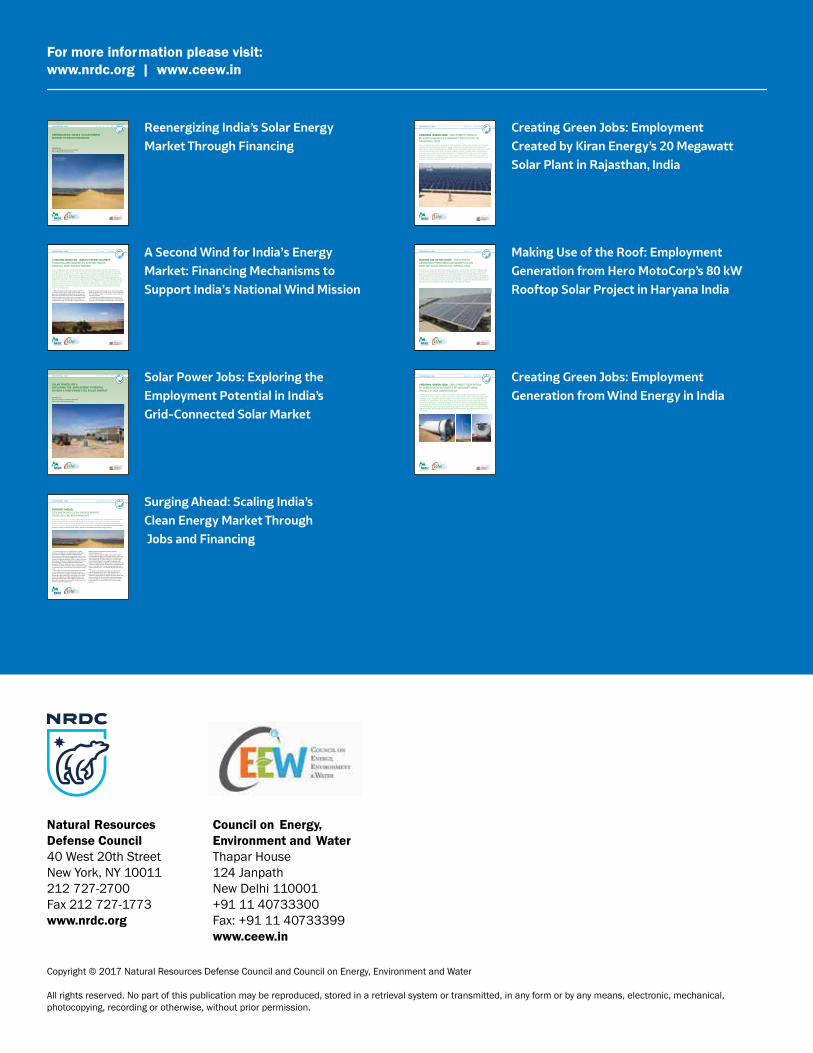
Finding 3: Solar module manufacturing could employ about 45,000 people if demand for modules is met domestically in India
We estimate that solar module manufacturing currently employs close to 2,900 people. With India’s reported plan to announce a policy for competitive domestic solar module manufacturing, all solar manufacturing companies surveyed expect to increase their workforce in FY 2017-2018. In fact, one fourth of them expect an increase in excess of 40 percent.
Further, we estimate that the domestic solar module manu-facturing industry in India could employ an additional 45,000 people if the demand for solar modules is met domestically in India.
Figure 18 : Expected change in solar manufacturing workforce in 2017 - 2018
Source: CEEW – NRDC analysis
Finding 4: Solar power jobs will be well distributed across the country, while wind power jobs will be concentrated in a few states
Solar resources in India are well distributed across the coun-try12. State-wise installation targets for ground-mounted solar projects and rooftop solar projects set by the Ministry of New and Renewable Energy also reflect the same geographical diversity. Based on the Ministry targets, we estimated state workforce requirements. Based on our analysis, Maharashtra and Uttar Pradesh are estimated to have the most number of solar jobs in the country.
Wind jobs, however, are likely to be concentrated in the states that have high wind potential. According to the Ministry of New & Renewable Energy, 8 states have wind installation targets between 2017 and 2022.13 These include Rajasthan in the north, Gujarat, Madhya Pradesh, and Maharashtra in the west, and Andhra Pradesh, Telangana, Tamil Nadu, and Karnataka in the South.
12 NationalInstituteofSolarEnergy,SolarEnergyPotentialMapofIndia,http://mnre.gov.in/file-manager/UserFiles/Statewise-Solar-Potential-NISE.pdf(Accessed3rd May 2017)
13 MinistryofNew&RenewableEnergy,TentativeStateWiseBreakUpofRenewablePowerTargetstobeAchievedby2022,http://mnre.gov.in/file-manager/UserFiles/Tentative-State-wise-break-up-of-Renewable-Power-by-2022.pdf(Accessedon26th May 2017)
9,658
8,575
11,289
12,360
12860
13,110
3,462
3,635
3,885
0 5,000 10,000 15,000 20,000 25,000 30,000
2017-18
2018-19
2019-20
Ground-mounted Solar Rooftop Solar Wind Power
38%
25%
13%
25%
0%
5%
10%
15%
20%
25%
30%
35%
40%
0 - 10% 10 - 20% 20 - 40% >40%
Res
pon
den
ts
Expected Increase
9,659
12,360
3,462
Ground-mounted Solar
Rooftop Solar
Wind Power
0 5,000 10,000 15,000 20,000

15
Figure 19: State-wise employment potential for solar in India
Source: CEEW – NRDC analysis
Finding 5: Rooftop solar is more workforce-intensive than other renewables, providing 24.72 job-years per MW in comparison to 3.45 job-years per MW for ground-mounted solar and 1.27 job-years per MW for wind power
Compared to ground-mounted solar (3.45 job-years per MW) and wind (1.27 job-years per MW), rooftop solar has the most workforce intensive project deployment at 24.72 job-years per MW. This is due to the smaller project sizes compared to ground-mounted solar or wind, which means that more people are required for installations.
Figure 20: Full Time Equivalent (FTE) for ground-mounted solar, rooftop solar, solar manufacturing and wind power projects
Source: CEEW – NRDC analysis
6. Key Policy Recommendations and Conclusion
Our analysis serves to further illustrate wind and solar em-ployment opportunities in India as the nation moves toward its 2022 renewable energy targets, and can be used to design and implement clean energy policies at the state and national levels. The solar manufacturing employment potential high-lighted here can serve to help the industry prepare.
Based on our analysis, national and state governments should focus on job-creation as a key policy area for solar and wind sectors in the country. Specifically, governments can:
a. Encourage reporting of employment generation from renewable energy companies;
b. Provide a greater impetus and policy priority to rooftop solar to create renewable energy jobs and meet the gov-ernment’s employment objectives;
c. Support development of localized training centres led by the private sector to source construction jobs locally since solar jobs are well distributed among states;
d. Develop wind power training centres on the basis of state-specific wind targets in 8 states; and
e. Promote a strong domestic solar module manufacturing industry to provide employment to an additional 45,000 people in India.
1.27
3.45
24.72
2.60
Wind power projects
Ground-mountedutility solar projects
Rooftop solarprojects
Solar PV modulemanufacturing
Natural Resources Defense Council40 West 20th StreetNew York, NY 10011212 727-2700Fax 212 727-1773www.nrdc.org
Council on Energy, Environment and WaterThapar House 124 Janpath New Delhi 110001+91 11 40733300Fax: +91 11 40733399www.ceew.in
SUPPORTED IN PART BY:
REENERGIZING INDIA’S SOLAR ENERGY MARKET TH ROUGH FINANCING
INTERNATIONAL: INDIA AUGUST 2014 REPORT
PREPARED BY:Council on Energy, Environment and WaterNatural Resources Defense Council
© Bhaskar Deol
Solar Panels at a NSM commissioned power plant at Jaisalmer, Rajasthan
SOLAR POWER JOB S: EXPLORING THE EMPLOYMENT POTENTIAL IN INDIA’S GRID-CONNECTED SOLAR MARKET
INTERNATIONAL: INDIA AUGUST 2014 REPORT
PREPARED BY:Council on Energy, Environment and WaterNatural Resources Defense Council
SUPPORTED IN PART BY:
© Bhaskar D
eol
The clean energy sector is providing much needed energy access while also creating enormous employment opportunities for India’s workforce. Highlighting the opportunity a scaled-up clean energy market offers for job creation in India, new analysis by NRDC and the Council on Energy, Environment and Water (CEEW) estimates that solar photovoltaic (PV) projects commissioned in India between 2011 and 2014 created approximately 24,000 full-time equivalent (FTE) jobs. Along with various estimates of job creation in the wind sector, grid-connected renewable energy is estimated to have created nearly 70,000 FTE jobs in India so far.
This analysis also finds that the Indian government and business leaders must overcome financing obstacles to achieve the country’s renewable energy goals and reach the full time growth potential of the clean energy sector. Policy support through innovative financing mechanisms and instruments such as green banks and green bonds could help reduce the high cost of renewable energy and scale the market to help power India’s future.
INDIA’S SOLAR AND WIND ENERGY MARKET EMERGING QUIC KLYIn 2010, as part of its plan to address the country’s urgent and growing demand for energy, India’s Ministry of New and Renewable Energy (MNRE) launched the Jawaharlal Nehru National Solar Mission (NSM or Mission) to promote grid-connected and off-grid solar energy. The administration hopes to establish India as a global leader in solar energy and to deploy 20 gigawatts (GW) of grid-connected installed solar power—equivalent to the energy capacity of 40 mid-sized coal-fired power plants—and 2 GW of off-grid solar power by 2022.
In just four years, India’s solar market has grown more than one hundred fold to achieve more than 2.5 GW of grid-connected installed solar energy (about the same as California), largely driven by national and state policies. With eight years left in the Mission, India is rapidly ramping up its solar installations, presenting an opportunity to increase public support for this potentially transformative energy resource.
SURGING AHEAD: SCALING INDIA’S CLEAN ENERGY MARKET THROUGH JOBS AND FINANCING
INTERNATIONAL: INDIA SEPTEMBER 2014 ISSUE BRIEF
Increasing energy access, clean energy development, and economic livelihoods are national priorities for India Prime Minister Narendra Modi’s new government. As India faces rising fuel prices, threats to energy security, and the impacts of climate change, renewable energy offers a critical solution, which also supports the new government’s agenda. India’s solar and wind programs have catalyzed rapid growth. In just four years, India’s solar market has grown more than one hundred fold. India is also the world’s fifth largest wind energy producer .
© Bhaskar D eol
SUPPORTED IN PART BY:
MAKING USE OF THE ROOF: EMPLOYMENT GENERATION FROM HERO MOTOCORP’S 80 KW ROOFTOP SOLAR PROJECT IN HARYANA INDIA
INTERNATIONAL: INDIA AUGUST 2014 ISSUE PAPER
As prices of solar photovoltaic (PV) electricity approach grid parity with fossil fuels, solar PV is rapidly becoming an economically viable source of electricity. The escalating costs of electricity from coal, gas, or diesel-based generation, coupled with attractive government rooftop solar programs, are motivating leading companies to take advantage of their roofs to generate electricity for industrial and commercial applications. As companies are learning, not only do rooftop solar projects increase reliable energy supply, but they also create much needed jobs. This report takes a close look at clean energy employment generation, using the Hero MotoCorp’s 80 kW rooftop PV project in Haryana, installed by Hero Future Energies, as an illustrative example.
© Bhaskar Deol
SUPPORTED IN PART BY:
CREATING GREEN JOBS: EMPLOYMENT GENERATION BY GAMESA-RENEW POWER’S 85 MEGAWATT WIND PROJECT IN JATH, MAHARASHTRA
INTERNATIONAL: INDIA AUGUST 2014 ISSUE PAPER
Facing rising fuel prices, threats to energy security, and the need to manage economic growth with pragmatic consideration of climate change, renewable energy offers a critical solution to India’s burgeoning energy demand challenges. Further, renewable energy technologies are more labor-intensive than more mechanized fossil fuel technologies, as demonstrated in more mature markets, and can provide a tremendous opportunity to create domestic jobs.1 Wind power, constituting the largest share of India’s installed renewable capacity at 68 percent, is price competitive with conventional thermal power in India. This robust, 30 year old market is expected to be vital to realizing India’s goal of doubling renewable energy capacity in the country by 2017, as outlined in India’s
in the country.
© Bhaskar D
eol
SUPPORTED IN PART BY:
A SECOND WIND FOR INDIA’S E NERGY M ARKET: FINANCING MECHANISMS TO SUPPORT INDIA’S NATIONAL WIND ENERGY MISSION
INTERNATIONAL: INDIA AUGUST 2014 ISSUE PAPER
India is struggling with skyrocketing energy demands, declining energy supplies, and peak load blackouts and shortages that limit energy access.1 The country’s recent economic growth has depended largely on fossil fuels, resulting in greater energy security concerns, higher electricity pricing, and increased pollution. At the same time,
times its current level to achieve the country’s 100 GW wind energy potential.2 To achieve the higher potential, the government announced plans in 2014 to launch a National Wind Energy Mission. Designing strong policies and programs that attract investment is essential to scale wind power to reach 100 GW and to breathe new life into India’s wind energy market.
India’s renewable energy capacity is nearly 13 percent of total generation capacity. Of the total renewable energy generation, wind energy currently makes up the majority with nearly 70 percent. The country’s 100 GW wind energy potential—almost half of India’s total electricity generation capacity in 2013—reveals tremendous opportunities for solving India’s energy crisis through a resurgence in wind
energy installations. Wind energy is also vital to diversifying India’s energy mix and is a viable means to meet demands for clean, affordable energy that creates jobs as discussed in the 12th Five-Year Plan.
Investments in the Indian wind market have fluctuated as have government policies. Financiers invested more than Rs 18,700 crore ($3.9 billion) in wind energy to add 3,200 MW
© Bhaskar D
eol
Wind mills in Jath, Sangli district in Maharashtra, India
SUPPORTED IN PART BY:
CREATING GREEN JOBS: EMPLOYMENT CREATED BY KIRAN ENERGY’S 20 MEGAWATT SOLAR PLANT IN RAJASTHAN, INDIA
INTERNATIONAL: INDIA AUGUST 2014 ISSUE PAPER
India’s rapid growth has resulted in energy demand that consistently outstrips supply. In 2010, as part of its plan to address the urgent and growing demand for energy by advancing clean energy solutions, the Government of India’s Ministry of New and Renewable Energy (MNRE) launched the Jawaharlal Nehru National Solar Mission (NSM) to promote grid-connected and off-grid solar energy. The Mission’s goal is to establish India as a global leader in solar energy through policies that lead to the deployment of 20 gigawatts (GW) of solar power by 2022, enough to meet the peak demand of Delhi—a city of 16 million people—3.5 times over.1 Recognizing the vast potential for employment generation in the Indian renewable energy sector, the central government has also cited job creation as part of its rationale for the Solar Mission.
© Kiran Energy
For more information please visit: www.nrdc.org | www.ceew.in
Reenergizing India’s Solar Energy
Market Through Financing
A Second Wind for India’s Energy
Market: Financing Mechanisms to
Support India’s National Wind Mission
Creating Green Jobs: Employment
Created by Kiran Energy’s 20 Megawatt
Solar Plant in Rajasthan, India
Solar Power Jobs: Exploring the
Employment Potential in India’s
Grid-Connected Solar Market
Surging Ahead: Scaling India’s
Clean Energy Market Through
Jobs and Financing
Making Use of the Roof: Employment
Generation from Hero MotoCorp’s 80 kW
Rooftop Solar Project in Haryana India
Creating Green Jobs: Employment
Generation from Wind Energy in India
Copyright © 2017 Natural Resources Defense Council and Council on Energy, Environment and Water
All rights reserved. No part of this publication may be reproduced, stored in a retrieval system or transmitted, in any form or by any means, electronic, mechanical, photocopying, recording or otherwise, without prior permission.


