Greenhouse Gas Technology Verification Center · Greenhouse Gas Technology Verification Center ....
57
Transcript of Greenhouse Gas Technology Verification Center · Greenhouse Gas Technology Verification Center ....


Greenhouse Gas Technology Verification Center A USEPA Sponsored Environmental Technology Verification (ETV) Organization
Test/QA Plan For A&A Environmental Seals' Seal Assist System (SAS)
Prepared By: Southern Research Institute
Greenhouse Gas Technology Verification Center
For Review By: U. S. EPA Quality Assurance Team
December 18, 1998
Test/QA Plan For A&A Environmental Seals' Seal Assist System (SAS)
Prepared By: Southern Research Institute
Greenhouse Gas Technology Verification Center
For Review By: A&A Environmental Seals, Inc.
Enron Gas Pipeline Group Oil and Gas Industry Stakeholder Group
U. S. EPA Office of Research and Development
December 18, 1998

TABLE OF CONTENTS Page
1.0 BACKGROUND AND INTRODUCTION..................................................................................... 1
2.0 TECHNOLOGY DESCRIPTION AND VERIFICATION APPROACH ..................................... 22.1. SEAL ASSIST SYSTEM DESCRIPTION ................................................................ 22.2. SITE SELECTION, DESCRIPTION, AND SAS INSTALLATION .......................... 4
2.2.1. Site Selection and Description .................................................................... 42.2.2. Seal Assist System Installation and Operation........................................... 7
2.3. VERIFICATION PARAMETERS AND THEIR DETERMINATION....................... 82.3.1. Phase I SAS Evaluation .............................................................................. 9
2.3.1.1. Verify Initial Leak Capture Performance ........................................ 92.3.1.2. Verify Initial Gas Recovery and Use Performance.......................... 92.3.1.3. Verify Initial Methane Emission Reduction .................................. 102.3.1.4. Document Installation and Shakedown Requirements................... 112.3.1.5. Document Capital and Installation Costs ...................................... 11
2.3.2. Phase II SAS Evaluation ........................................................................... 142.3.2.1. Verify Long-term Leak Capture Performance............................... 142.3.2.2. Verify Long-term Gas Recovery and Use Performance................. 142.3.2.3. Estimate Annual Methane Emission Reduction ............................ 152.3.2.4. Document Long-term SAS Operational Requirements.................. 172.3.2.5. Calculate SAS Payback Period ..................................................... 18
2.4. FIELD TEST OVERVIEW ..................................................................................... 192.4.1. High Volume Gas Sampling...................................................................... 222.4.2. In-line Gas Flow and Pressure Measurement .......................................... 232.4.3. Oxygen Concentration in SAS Discharge................................................. 24
2.5. SCHEDULE OF ACTIVITIES................................................................................ 24
3.0 DATA QUALITY OBJECTIVES ................................................................................................ 253.1. PAYBACK PERIOD............................................................................................... 253.2. OXYGEN MONITORING ...................................................................................... 273.3. PRESSURE MONITORING ................................................................................... 273.4. HVS SAMPLING AND LEAK MONITORING ..................................................... 27
4.0 DATA QUALITY INDICATORS ................................................................................................ 28
5.0 SAMPLING AND ANALYTICAL PROCEDURES.................................................................... 295.1. LEAK RATE-HVS MEASUREMENTS ................................................................. 29
5.1.1. Description ................................................................................................ 295.1.2. Test Procedures......................................................................................... 325.1.3. QA/QC Procedures ................................................................................... 35
5.2. FLOW MEASUREMENTS .................................................................................... 365.2.1. Test Procedures......................................................................................... 395.2.2. QA/QC Procedures ................................................................................... 39
5.3. PRESSURE MEASUREMENTS ............................................................................ 395.3.1. Test Procedures......................................................................................... 405.3.2. QA/QC Procedures ................................................................................... 40
5.4. OXYGEN MONITORING ...................................................................................... 405.4.1. Description ................................................................................................ 405.4.2. Test Procedures......................................................................................... 41
i

5.4.3. QA/QC Procedures ................................................................................... 415.4.4. Data Acquisition System ........................................................................... 415.4.5. Description ................................................................................................ 415.4.6. Test Procedures......................................................................................... 425.4.7. QA/QC Procedures ................................................................................... 44
6.0 DATA REDUCTION, VALIDATION, AND REPORTING........................................................ 446.1. DATA REDUCTION .............................................................................................. 446.2. DATA REVIEW AND VALIDATION ................................................................... 456.3. DATA ANALYSIS AND REPORTING ................................................................. 47
7.0 AUDITS ........................................................................................................................................ 48
8.0 CORRECTIVE ACTION............................................................................................................. 48
9.0 PROJECT ORGANIZATION ..................................................................................................... 50
10.0 TEST PROGRAM HEALTH AND SAFETY .............................................................................. 51
11.0 REFERENCES ............................................................................................................................. 51
ii

1.0 BACKGROUND AND INTRODUCTION
The Environmental Technology Verification (ETV) program was established by the United States Environmental Protection Agency (EPA) in response to the belief that there are many viable environmental technologies which are not being used for the lack of credible third-party performance testing. With the performance data developed under the program, technology buyers and permitters in the United States and abroad will be better equipped to make informed environmental technology purchase decisions. In late 1997, EPA selected the Southern Research Institute to manage 1 of 12 ETV verification entities: The Greenhouse Gas Technology Verification Center (the Center). Eleven other ETV entities are currently operating throughout the United States conducting third-party verification in a wide range of environmental media and industries.
In March of 1997, the Center met with members of the Executive Stakeholder Group. In that meeting, it was decided that the oil and gas industries were good candidates for third-party verification of methane mitigation and monitoring technologies. As a consequence, in June 1998, the Center hosted a meeting in Houston, Texas with operators and vendors in the oil and natural gas industries. The objectives of the meeting were to: (1) gauge the need for verification testing in these industries, (2) identify specific technology testing priorities, (3) identify broadly acceptable verification and testing strategies, and (4) recruit industry stakeholders. Industry participants voiced support for the Center’s mission, identified a need for independent third-party verification, and prioritized specific technologies and verification strategies. Since the Houston meeting, a 19 member Oil and Gas Industries Stakeholder Group was formed, vendors of GHG mitigation devices were solicited in several top-rated technology areas, and verification tests of two compressor leak mitigation devices are starting.
In an August 1998 letter to the Oil and Gas Industries Stakeholder Group, plans were outlined for a verification test of compressor rod seal leak capture and utilization systems. One vendor, A&A Environmental Seals, Inc., committed to participate in a long-term independent verification of their technology. A&A's Seal Assist System (SAS) is designed to capture methane from leaking compressor rod seals, and route the captured gas into the compressor engine fuel line for use. With over 13,000 natural gas compressors operating in the United States alone, compressor rod seal leaks represent a major source of methane emissions, and a significant loss of economic and natural resources.
A test of the SAS device is scheduled to begin in January 1999, and will be carried out at a gas transmission station operated by Transwestern Pipeline Company - Enron Gas Pipeline Group (Transwestern). The station is located in northeastern Arizona.
This document is the full test/QA plan for the A&A Seals’ SAS verification test. It contains a detailed rationale for the experimental design and lays out specific test and QA/QC procedures to be implemented. This plan (once approved) meets the requirements of the Center's approved Quality Management Plan (QMP) and thereby satisfies the ETV QMP and conforms with EPA's standard for environmental testing (E-4). This plan has been prepared to guide implementation of the test and to document planned test operations for the purposes of review and audit.
The A&A device will be tested for an 8-month time frame, during which the Center will issue a Phase I Report containing initial installation and measurements data (early 1999) and a Phase II Report containing longer-term technical and economic performance data (late 1999). The specific verification goals associated with the Phase I and Phase II verification efforts are outlined below.
1

• Phase I SAS Evaluation: • Verify initial leak capture performance • Verify initial gas recovery and use performance • Verify initial methane emission reduction • Document installation and shakedown requirements • Document capital and installation costs
• Phase II SAS Evaluation: • Verify long-term leak capture performance • Verify long-term gas recovery and use performance • Estimate annual methane emission reduction • Document long-term SAS operational requirements • Calculate SAS payback period
Phase I goals will be achieved through collection and analysis of direct gas measurements, and the use of site operator logs and vendor supplied cost information. A primary goal of Phase II is determination of the SAS payback period. As a practical matter, the Center cannot conduct direct testing for the several years that would be required to determine payback entirely through direct gas and other measurements. Thus, several Phase II goals will be accomplished through a combination of medium-term measurements (8-months) and data extrapolation techniques. Extrapolation and other assumptions will be transparent in the final report, allowing readers to make alternate assumptions and assessments if they wish.
2.0 TECHNOLOGY DESCRIPTION AND VERIFICATION APPROACH
2.1. SEAL ASSIST SYSTEM DESCRIPTION
The SAS is a secondary containment device designed to prevent rod packing leaks from escaping into the atmosphere. With the SAS system, existing rod packing can continue to leak, but the leaked gas is contained within a secondary containment gland. This allows the contained gas to be collected, re-compressed, and routed into the compressor engine fuel line for use. A key component of the SAS is the Emissions Containment Gland (ECG). The ECG, which is installed over the existing rod and behind the rod packing, is depicted in Figure 1. The figure also shows a doghouse which contains the rod and packing flange over which the ECG will be installed for this study.
2

Figure 1. SAS gland (top) and installation location (bottom).
3

Figure 2 contains a schematic drawing of the SAS system, and shows some of the monitoring and sampling system that will be used in the test. The ECG has an annulus area that is swept with natural gas provided from an on-site gas line. The annulus area normally operates at a slightly negative pressure created by a series of methane jets. The jets operate based on the Coanda effect, which describes the turbulent boundary layer from fluid flow over a curved or inclined surface. The surface adherence phenomenon of the Coanda effect allows the entrained emissions to be delivered to a re-circulation and re-compression system (Croll Reynolds Eductor). Natural gas is circulated from the discharge of the jets to the annulus area to ensure that the annulus is constantly supplied with gas, ensuring a continuous purge of the annulus area. In order to prevent aspiration of air that might occur from negative pressure in the SAS, a tertiary seal is provided that is maintained at a slight positive pressure.
Natural gas captured by the “sweep” gas is discharged through a Croll Reynolds Eductor/Compressor. The Croll Reynolds Eductor/Compressor boosts the captured emissions and motive gas up to sufficient pressure for introduction into the engine fuel supply. The SAS has been engineered to meet site-specific conditions, although the fundamental design and operation of the SAS, as described here, remains unchanged.
2.2. SITE SELECTION, DESCRIPTION, AND SAS INSTALLATION
2.2.1. Site Selection and Description
The natural gas transmission engine/compressor selected to host this evaluation is Unit 401 at Station 4 operated by Transwestern Pipeline Company - Enron Gas Pipeline Group. Station 4 is located near Klagatoh, Arizona, north of Interstate 40, off Exit 333. A photograph of the engine/compressor building, and a simplified floor plan are presented in Figure 3. This station operates 3 Clark gas-fired IC engines (12 cylinder, 4000 Hp), and each is equipped with 3 integral cylinder-type compressors operating in series (4-1/2" rods). Geographic location was not seen as a significant factor in the evaluation, but extremes of environment, very hot or very cold, were avoided.
The engines at Station 4 are not typical of newer high speed engines in use, but the rods and packings have the same basic design and functionality as many reciprocating compressors used now and planned for use in the future. Reciprocating compressors are the dominant types in use, although newer compressor designs, such as screw-type, are beginning to be placed into service. The rod packing system used at this station is typical of those being built or retrofitted within the industry. The rod packing at Station 4 is a dry seal system. Traditionally, wet seals, which use high-pressure oil to form a barrier against escaping gas, have been employed. According to the Natural Gas STAR partners, dry seal systems have come into favor recently because of lower power requirements, improved compressor and pipeline operating efficiency and performance, enhanced compressor reliability, and reduced maintenance. The STAR industry partners report that about 50 percent of new seal replacements consist of dry seals. This is consistent with the experience at Station 4, where wet seals were replaced with dry seals 10 months ago.
4

Figure 2. SAS test system schematic – monitoring locations.
5


Figure 3. Photograph and floor plan for the host gas transmission line compressor station.
Engine 1
(Test Unit)
Engine 2
Engine 3
Engine & Compressor Monitoring
Panel
Compressor and Rod System (rods
enclosed in a vented doghouse)
Locations of the 3 A&A Glands in the Engine 1 Doghouses
6

2.2.2. Seal Assist System Installation and Operation
The SAS will be installed on all three compressor rods of Unit 1. The installation is depicted in Figure 3. It will include 3 glands, 3 gas jet assemblies, pressure and flow monitoring devices, the Croll Reynolds Eductor motive gas system, safety systems (oxygen monitor and pressure relief valves), system and sampling valves, automated data acquisition, and steel and stainless steel tubing. Specifications for several key SAS components are shown on the SAS schematic presented earlier in Figure 2. Specifications for the monitors required to verify the SAS are described later.
During installation of SAS components and monitoring devices, tie-in's to the existing Station 4 data acquisition system will be made. This will allow both Station operators and Center staff to collect, display, record, and assess all monitored SAS variables in real-time. Output signals from each monitoring device shown earlier in Figure 2 will be converted into digital signals and transmitted to the site control room via the control panel shown in Figure 3. These signals will be converted into actual reporting units, and stored in the on-site computer for routine remote download and on-line monitoring. A dedicated and password-protected computer in the Southern Research office in Research Triangle Park, NC, will automatically download data daily.
Monitored rod temperature is an indicator of the amount of sag in the rod, the need to schedule required maintenance/repair, and perhaps, the need to replace the seals. The SAS will be installed where rod temperature was previously monitored, necessitating movement of the temperature probe to a location immediately behind the SAS. Since the SAS generates heat as its seals seat, the temperature sensors during start-up could indicate a sag condition. This may require manual monitoring during start-up of the SAS. In addition, the SAS has a net cooling effect during normal operation (after the SAS seals are seated), necessitating re-evaluation of the appropriate rod temperature set point.
The SAS ECG's were installed on all three compressor rods on November 23. There were no significant increases in rod temperature after startup and, after temperatures stabilized, there was no need to adjust rod temperature set points.
An A&A engineer will provide an operator's manual and on-site training at the time of installation. In addition, efforts to anticipate unplanned site-specific operational events have produced specifications for safe and appropriate operational responses to these events. Although Engine 1 is expected to operate throughout the study period, the unplanned operational events and the resultant actions identified so far are outlined below.
• Units 2 and/or 3 shutdown with or without depressurization. In this case, the SAS continues to operate normally, supplementing the fuel feed to Engine 1.
• Unit 1 shutdown occurs in a pressurized state, and Engines 2 and/or 3 remain operational. In this case, the SAS continues normal operation, capturing natural gas that continues to leak in response to the pressure in the compressor. The fuel is provided to Engines 2 and/or 3.
• Unit 1 shutdown and depressurization occurs. The SAS may be shutdown. (No gas is leaking, so the SAS has nothing to capture.)
• Normal shutdown of all three engines occur, with or without depressurization. The SAS should be shutdown, as there is no place for the
7

captured and motive gasses to be used. In this case, rod emissions will return to their state prior to SAS installation (released to the atmosphere).
• An emergency or remote shutdown of all three units occurs. The SAS is designed to shutdown automatically in this instance.
• A catastrophic rod failure occurs on Engine 1. The SAS should be shutdown to the compressor experiencing the failure (assuming it depressurizes). If the non-damaged compressors remain pressurized, the SAS serving each should remain operational, and the other engines will use the collected gas.
The SAS designed for Station 4 has an upper limit of about 35 scfm of leaking gas that can be recovered (total of all 3 glands). When the SAS is operating above the normal recovery rate (which can be varied up to the recovery rate limitation), this will be indicated by a positive pressure developing in the SAS gland. The system will continue to capture leaking gas, up to a limit, although some gas may begin to leak through the SAS tertiary seal as the pressure in the SAS continues to increase. To avoid potential damage to the SAS, it is designed with a pressure relief device set at 20 psig. If the SAS is checked and found to be operating properly, this will be an indicator of a major leak having developed in the primary rod seal, perhaps necessitating repair.
Specific operational parameters to be monitored and logged in the verification testing are described later in Section 2.
2.3. VERIFICATION PARAMETERS AND THEIR DETERMINATION
Verification testing of the SAS is scheduled to begin at Transwestern Compressor Station 4 in January 1999, and will continue for an 8-month period. After initial testing is complete, the Center will issue a Phase I Report, containing installation and initial verification measurements data (early 1999). After all testing is complete, a Phase II Report will be issued which contains longer-term technical and economic performance verification data (late 1999). The specific verification parameters associated with the Phase 1 and Phase II efforts are listed below. Each parameter is discussed separately in the Sections that follow.
• Phase I SAS Evaluation: • Verify initial leak capture performance • Verify initial gas recovery and use performance • Verify initial methane emission reduction • Document installation and shakedown requirements • Document capital and installation costs
• Phase II SAS Evaluation: • Verify long-term leak capture performance • Verify long-term gas recovery and use performance • Estimate annual methane emission reduction • Document long-term SAS operational requirements • Calculate SAS payback period
Phase I verification parameters will be determined through the collection and analyses of direct measurements, and use of site operator logs and vendor-supplied cost information. A primary
8

goal of Phase II is to determine the SAS payback period. Unfortunately, the Center is unable to conduct multi-year testing in an effort to determine payback using direct measurements only. Thus, several Phase II verification parameters will be determined through a combination of medium-term measurements (8-months) and data extrapolation techniques.
2.3.1. Phase I SAS Evaluation
2.3.1.1. Verify Initial Leak Capture Performance
Unless unusually large leaks develop on a compressor rod seal, the SAS is designed to completely capture all of the leak (up to about 35 scfm total). The SAS glands and auxiliary systems installed at Station 4 were designed to accommodate the leaks anticipated there, and as normal increases in leak rates occur, operators will perform system adjustments to optimize SAS performance, and ensure full gas containment.
Leak capture performance will be measured directly using a customized High Volume Sampler (HVS). The HVS will verify ECG integrity by drawing gas samples from each of the three doghouse vents. The integrity of the following system components will be tested with soap solution and the HVS: fittings, valves, joints, and any other components that could develop a leak. For the first three weeks of operation, these leak check tests will be performed weekly. Thereafter, they will be performed bi-monthly for the SAS glands, and monthly for all other components.
The HVS's design, performance, and operational specifications are described in more detail in Section 2.4 and Section 5. The HVS provides sufficient suction to draw the entire leak from a single component into the device for real-time methane leak rate quantification. The HVS can quantify leaks of up to about 50 cfm of natural gas. Gas composition is measured with a Bascom-Turner hydrocarbon analyzer calibrated specifically to methane (range 300 ppm to 100%). Flow through the HVS is provided by a compressed air driven venturi, and is metered by an internal vane anemometer located in a long, straight pipe.
2.3.1.2. Verify Initial Gas Recovery and Use Performance
The amount of gas recovered by the SAS and routed to the engines for use is a critical parameter in determining economic performance. Initial gas recovery will be determined, and reported in the Phase I Report, after at least three weeks of continuous monitoring data have been collected and analyzed. Gas recovery data will be reported as a series of hourly, daily, and weekly averages. The strategy for determining these values is discussed below.
Earlier in Figure 2, the locations of eight in-line gas flow measuring devices were identified. Six of these devices will be used to measure the gas flow immediately upstream and downstream from each of the three SAS glands installed on Engine 1. The remaining two meters will be used to measure the combined flow upstream and downstream of the three SAS glands. With this configuration, it will be possible to continuously monitor the gas recovery associated with each gland, and as an independent check, to continuously monitor the total gas recovery. If the sum of the recoveries from each gland does not agree with the total recovery determined from the
9

independent check, an effort to identify and rectify the disagreement will be conducted in the early stages of the program.
The flow measurement device planned for use is the mass flow meter. The design, performance, and operational specifications for the meters are outlined in described in Section 2.4. Specific operational procedures are given in Section 5.2. These meters will provide accurate and stable flow measurement under the conditions expected, and will transmit data to the local data acquisition system for near real-time quantification and monitoring. SAS gland pressures and system line pressures will also be monitored to provide additional data on system performance, and early warning on system problems to site operators. These pressures will be monitored continuously and recorded at the same intervals as the flow data, and will be stored on the site’s data acquisition system.
To verify that atmospheric air is not entrained in the system, monitoring for oxygen in the recycled fuel flow will be conducted as shown earlier in Figure 2. If air is present in significant quantities, this monitor will alarm, allowing corrective action to be taken.
Rod emissions are expected to increase over time as seals wear normally or suffer damage. Among other uses, the gland-specific gas recovery measurements will allow emission anomalies associated with individual rod seals to be identified and quantified. If one seal experiences an uncharacteristically large and rapid increase in emissions, it can be detected and taken into account when assessing overall SAS system performance and payback. This feature is most important for the longer-term Phase II evaluations discussed later. These data will also be used to assess the representativness of the Engine 1 rod seal emissions relative to industry averages.
2.3.1.3. Verify Initial Methane Emission Reduction
It is possible that a distinction must be made between the amount of gas recovered by the SAS (described in the previous Section), and the atmospheric emissions reduced by the SAS (described in this Section). If installation of the SAS does not alter rod seal leak rates, and if entrained air is not present within the SAS; then the initial methane emission reduction should be equal to the initial gas recovery measured as described in the previous Section. On the other hand, if rod seal leak rates either increase or decrease due to SAS installation, or significant entrained air is present, then emission reductions and gas recovery values will differ. For example, if the SAS reduces leak rates after installation, then the measured leak rate would understate actual SAS emission reductions (i.e., use recovered gas measurements to represent emission reductions).
Since the SAS gland is designed to operate near ambient pressure, it is unlikely it will significantly increase or decrease rod seal leak rates. However, this will be verified by disabling the SAS soon after installation, then independently monitoring rod seal leak rates for comparison with the gas recovery rates described earlier. If the SAS does not impact leak rates, these values should be the same. The SAS will be disabled by stopping the flow of motive gas, and opening the valve downstream from each SAS gland to expose the gland's annulus area to normal ambient conditions (conditions experienced when the gland is not present). This will allow the HVS to measure the rod seal leak rate directly as it flows from the sample port at the open valve. This measured leak rate will be compared with HVS data collected just before the SAS installation, and with gas flow measurements collected by the mass flow meters immediately after installation. If little or no difference is observed between the gas recovery measurements and the leak rate
10

experienced with the SAS disabled, then the continuous mass flow meter data will be used to characterize initial emission reductions.
If differences are found, a decision on how to measure and characterize the differences will be made and implemented early in the program. A continuation of the HVS measurement process is the most likely option, but if the differences are large, alternate strategies may be more appropriate. In any event, initial emission reductions, corrected using the HVS data if necessary, will be determined and reported in the Phase I Report after at least three weeks of continuous monitoring data have been collected and analyzed, and after the HVS data collection effort described above have been completed.
The SAS is designed to be air tight, but if air intrusion does occur, the data from the oxygen monitor will be used to identify this condition and quantify the volume of air present in the system. In all likelyhood, the leak will be repaired quickly, and the data where significant air is present, will be ignored.
2.3.1.4. Document Installation and Shakedown Requirements
A&A has prepared installation instructions for the SAS system. These instructions are outlined in Table 1. The SAS will be installed by a Transwestern approved contractor, with supervision and guidance provided by A&A engineers. The contractors will also conduct leak checks on the complete system, and correct loose fittings or valves. Center personnel will be on-site throughout the installation and shakedown process, and will document any modifications made or difficulties encountered. The Center will also document key decisions made regarding placement of equipment or adjustments made for site-specific conditions.
A&A will provide an Operator’s Manual which provides instructions on start-up activities and routine monitoring and maintenance requirements. For the start-up instructions, the manual lists step-by-step procedures for: initiating SAS gland start-up, obtaining design re-circulation rate and pressure, initiating jet manifold pressure and flow rates, initiating Croll Reynolds Eductor and checking for it’s design discharge pressure and flow rate, and verifying functionality of monitoring sensors and data recording equipment. The Center will document any problems encountered or changes made to the start-up and shakedown activities, and report the final procedures in the Verification Report.
2.3.1.5. Document Capital and Installation Costs
To determine technology payback period, it will be necessary to accurately document SAS capital and installation costs. Table 2 is a listing of the capital equipment required to assemble and install all SAS equipment. It also includes preliminary cost data, and identifies where final data will be obtained. The list is specific to the conditions encountered at Station 4 (e.g., fuel line distances), with the exception of the SAS gland and the Croll Reynolds Eductor. The contractors retained to perform the installation will provide the piping, valves, and fittings. Although the list is believed to be complete, the contractors may add or delete items necessary to accommodate site specific conditions. The Center will obtain the "as-built" equipment list from the contractors and A&A after installation is complete, and will document total equipment and installation costs based on contractor’s invoices and labor logs. The Center will multiply the logged hours by the hourly rates charged by all participating contractors to calculate total installation cost. The sum of the capital equipment costs and installation costs will represent the net SAS initial cost. This cost will not include the flow monitors and other devices required for the verification test.
11

Table 1. Preliminary installation instructions for the SAS system.
SAS Gland: 1 Lay out all parts. 2 Note that the gaskets are on the split lines of the gland, carrier, and carrier housing. 3 Make sure that the existing seal gland is tight and aligned with the shaft. 4 Take the gasket, place it around the shaft (behind the Emission Containment Gland- ECG)
with the flats of the gasket. 5 Take the two parts of the ECG, install the carbon alignment halves into the ECG. 6 Place the two halves around the shaft, install the bolts, do not tighten (leave ¼” gap
between halves). 7 Bolt the gland and gasket on to the existing seal gland (leave the nuts loose). 8 Place the U- cups around the shaft. Both with the “U” facing the stuffing box. 9 Place the two halves of the split alignment busing, into the split carrier (middle groove). 10 Bolt carrier together with the “A” face towards the stuffing box using bolts around the
shaft so that the U-cup seals fit into the grooves. Tighten. Note – seal carrier has two faces “A” and “B”. The holes in the O.D. are closest to “A” face.
11 Install the split O-rings into the side grooves of the carrier. 12 Slide the carrier with seals up into the cavity of the ECG. 13 Bolt the carrier housing together around the shaft with bolts. Tighten. 14 Cut the O-Ring and press into carrier housing groove all the way around until ends meet,
cut off excess. 15 Bolt housing to the ECG on one side only using 4 bolts. 16 Tighten evenly the two bolts drawing the ECG together. 17 Install the other 4 bolts. 18 Tighten the ECG to the existing packing gland.
Piping and Manifold System: 1 Mount the jet manifold. 2 Connect the suction of the jet to the ECG (port S to port 2 of the ECG) using the ½” SS
tubing. 3 Connect the recycle of the jet to the ECG (port R to port 1 of the ECG) using the ½” SS
tubing. This step requires installation of the vacuum gauge, ball valve and the rising stem valve in this line. Note: Rising stem valve should be between the jet and the vacuum gauge. Ball valve just below vacuum gauge. Parts needed include one ½” rising stem valve, one ½” x ¼” reducing tee, one vacuum gauge, and one ¼” ball valve.
4 Install motive gas line. Use a reducing union tee here and the regulator with gauge (for purge). Additional parts needed: two ¼” x ¼”male connectors. Note: motive gas line should always be at least ½”.
5 Connect ¼” purge line from regulator to the ECG using ¼” SS tubing. 6 Connect the discharge of the jet to the Croll Reynolds Eductor.
12

Table 2. Documentation of initial capital and installation costs.
Description Units Required Price/Unit Source of Data
Capital Equipment Costs:
SAS Gland Apparatus 3 $4,500 A&A Seals Croll Reynolds #22 Eductor 1 $3,000 A&A Seals Piping, Valves, Fittings (stainless steel) 1" Tubing Cross 1 $127.10 1" Tubing T 3 $100.10 1/2"Tx1" Tube Red. 6 $18.10 1/2"T x 3/8" MNPT 12 $10.20 1/2" Tube BV 9 $156.50 1/2" Tube T 14 $31.20 1/2" Tube Plug 6 $6.40 Obtained From 45 Degree Male Elbow (1”) 2 $104.00 Transwestern 2” x 1” Pipe Adapter 1 $133.80 Approved 45 Degree Male Elbow (1/2”) 1 $37.70 Contractor 1/2" T x 1/2" T MNPT 2 $11.30 Logs 1/2" T x 1/8” T MNPT 3 $12.10 2” TD Ball Valve 1 $501.50 1” TD Ball Valve 1 $268.30 1” Pipe T 1 $107.90 1/2" T x 1” MNPT 1 $28.40
1/2" Tubing 40 feet/rod (est.) $2.50 1” Tubing 60 feet/rod (est.) $7.50
1/8” Headers 30 feet (est.) $1.75 1/2" Headers 30 feet (est.) $2.50 1" Headers 30 feet (est.) $3.50 2" Pipe 6 feet (est.) $9.00
Installation Costs:
SAS Gland Assembly Installation Obtained From (includes time required to remove cover 2 hours/gland $45 - $65 Station 4 plates; remove/install studs, gasket, SAS (est.) Operator Gland, thermocouple; and tightening the Logs system) Piping Installation Obtained From (includes time required to install all tubing, 100 hours (est.) $45 - $65 Transwestern valves, headers, and sensors; system checks Approved for leaks; and start-up/shake-down activities) Contractor
Logs
13

2.3.2. Phase II SAS Evaluation
2.3.2.1. Verify Long-term Leak Capture Performance
Long-term leak capture performance will be measured directly using the HVS and the sampling strategy discussed earlier in Section 2.3.1.1 (Verify Initial Leak Capture Performance). After the initial leak capture determinations are complete, testing will be performed bi-monthly for the SAS glands, and monthly for all other components. If leaks are discovered over the duration of the testing program, either the site operators or A&A Seals will be given the option of repairing the leak. If repairs are made, the level of effort required will be recorded and included in the payback cost analysis, and the dates of repair will be recorded.
2.3.2.2. Verify Long-term Gas Recovery and Use Performance
The basic strategy used to measure and record gas recovery performance was described earlier in Section 2.3.1.2 (Verify Initial Gas Recovery and Use Performance). The same methods will be used to measure long-term gas recovery, and will not be repeated here. Using these methods, gas recovery will be measured continuously throughout the 8-month measurement period. However, to calculate the payback period for the SAS, estimates of gas recovery over periods longer than 8months will be needed. This necessitates the use of gas recovery extrapolation/projection techniques, and mandates that the assumptions used in those extrapolations are reasonable and available for evaluation. Based on preliminary cost estimates and industry average leak rates, a rough approximation of the Station 4 payback period was estimated for planning purposes. A payback of about 2 years was estimated, so it is assumed that measurements and extrapolations will be needed covering at least a two year period.
It is recognized within the industry that rod seal leaks increase over time as they wear, and that seals generally remain functional for several years after replacement. The rod seals on Engine 1 were replaced about ten months ago, and station operators expect the seals to remain functional for at least three-years. Figure 4 presents a hypothetical leak profile for all of the Engine 1 rod seals over the anticipated study period. As the figure shows, leak rates are low immediately after installation, then gradually increase over time as the packing wears. This is a hypothetical example, and it is recognized that leaks may increase more steeply, due to a catastrophic seal failure, or less steeply, due to early failure of the packing.
Figure 4 shows that monitoring will be conducted over about 1/3 of the anticipated study period. Thus, projections of the amount of gas recovered after the measurements are complete must be estimated. Furthermore, the SAS device will likely be installed on existing compressors at the same time as rod seals are replaced, so the payback associated with installing the SAS during packing replacement is of interest. Given this, the potential gas recovered from the point of seal replacement to the beginning of the measurement period must also be projected.
Strategies for projecting gas recovery both before and after the measurement period have been developed for use. Each are outlined separately below, and both contain a "conservative case" and a "likely case" projection strategy.
Projected gas recovery after the measurement period. Figure 4 shows that leak rates may increase rapidly after the measurement period is complete. Thus, significant uncertainty could result if projected leak rates in this steep region of the curve are inaccurate. As a result, two projection
14

techniques will be used, one conservative and one based on straightforward data extrapolation. The conservative technique is illustrated in the top portion of Figure 4. With this technique, it is considered unlikely that leak rates will decrease after measurements have concluded. This allows the assumption that a minimum recovery would occur if the leak rate monitored at the end of the study continued until device payback was achieved. The second technique is illustrated in the lower portion of Figure 4, and is referred to as the likely case. This technique is based on extrapolating the leak recovery data collected over the 8-month measurement period. It produces a shorter payback than the conservative method because continued increases in leak rates are permitted after the study is concluded. Both techniques will be used to determine gas recovery and payback estimates for the post measurement period.
Projected gas recovery before the measurement period. Unfortunately, the data available to project pre-measurement leak rates are more limited than the data available to project postmeasurement leak rates. To project from the point of packing replacement to the start of the measurements, two projection techniques will be applied. The first technique makes the conservative assumption that a low industry average (e.g., about 0.1 scfm/rod) occurs immediately after packing replacement, and that leak rates will increase linearly from this value to the value measured at the beginning of the study.
The projected pre-measurement gas recovery associated with this conservative assumption will be combined with the conservative post-measurement recovery estimate described above, yielding a conservative recovery projection for all periods in which monitoring was not conducted. In the second technique, an initial leak rate equal to a normal industry average (e.g., about 0.4 scfm/rod) will be assumed and allowed to increase linearly to the value measured at the beginning of this study. Again, this projected gas recovery will be combined with the gas recovery associated with the likely case post-measurement recovery estimate, to yield a likely case projected recovery for all periods in which monitoring was not conducted. The specific industry average leak rates to be used will be determined based on data and consultations with EPA STAR partners and other rod leak measurement experts.
For the purpose of reporting long-term gas recovery and payback periods, the projected gas recovery before and after the study period will be added to the recovery measured continuously during the study. This will represent the total long-term gas recovery for the SAS. Two recovery values will be reported: the "conservative case" and the "likely case" scenarios described above. Gas which is not collected or not used (e.g., is vented or leaked), will not be included in these estimates.
2.3.2.3. Estimate Annual Methane Emission Reduction
As described earlier, it is possible that a distinction must be made between the amount of gas recovered by the SAS, and the atmospheric emissions reduced by the SAS. If installation of the SAS does not alter rod seal leak rates, and if entrained air is not present within the SAS; then methane emission reductions should be equal to the gas recovery estimates described in the previous Section. If rod seal leak rates either increase or decrease due to SAS installation, or significant entrained air is present, then emission reductions and gas recovery values will differ. If this occurs, the methods described earlier in Section 2.3.1.3 will be used to correct the long-term gas recoveries determined as described in the previous Sections. If the HVS method described there is used to quantify the degree of difference, manual monitoring will be conducted at least monthly (perhaps more if the difference is significant).
15

Figure 4. Long-term gas recovery measurement and projection estimate.
0
2
4
6
8
1 0
1 2
0 1 2
Y e a r s
Minimum Recovery When Payback is Achieved
Payback Period Assuming Minimum Recovery is Achieved
Conservative Case
Study Period
0
2
4
6
8
1 0
1 2
Projected Recovery When Payback is Achieved
Payback Period Assuming Projected Recovery is Achieved
Likely Case
Payback Period Start Point: Last Seal Replacement
Study Period
Gas
Rec
over
ed (
scfm
) G
as R
ecov
ered
(sc
fm)
0 1 2
Y e a r s
16

Annual average methane emission reductions will be calculated for each year and will be included in the gas recovery calculations (i.e., from initial installation until payback is achieved). Monthly and weekly emission reductions will also be reported to allow readers to assess the trends observed and use alternate assumptions and data interpretations, if desired.
2.3.2.4. Document Long-term SAS Operational Requirements
Based on the manufacturer’s claims, the SAS does not require frequent operational intervention or maintenance, and should not adversely effect other compressor operation and maintenance (O&M) activities. The main operation requirements for the SAS are start-up, shutdown, periodic checks on gland pressures, and adjustment of the SAS jet flow and recycle balance valves to accommodate leak rate increases.
To determine objectively the level of O&M, complete O&M logs on both the SAS and the compressor will be maintained. This will include selected monitored parameters for the engine/compressor system, and manual logs of key O&M activities. Table 3 lists the operational parameters that will be collected.
Table 3. Operational and maintenance data to be collected during testing.
Description Source of Data
SAS, Compressor, and Engine Operating Parameters Logged: Static pressures in the following SAS systems: glands (3), recycle line, suction line, and jet manifold
Site DAS1 (being installed)
Oxygen content in the SAS system Site DAS (being installed) Compressor rod temperature (all 3 rods on Engine 1) Actual engine rpm (Engines 1, 2, & 3)
Site DAS (Channels 58, 59, 60) Site DAS (Channel 102)
Engine fuel line static pressure and fuel flow rate Site DAS (Channel 64, 97) Crosshead temperature Site DAS (Channels 61, 62, 63) Compressor and SAS operating problems/adjustments (3) Operator O&M logs/SAS log Station suction pressure and temperature Site DAS (Channels 108, 29) Station discharge pressure and temperature Site DAS (Channels 107, 30)
Maintenance Requirements Logged: Labor required to start/stop the system, conduct routine leak checking on the entire SAS assembly, repair leaks, respond to alarms, and perform SAS adjustments (e.g., jets) Equipment replacement or repair costs for failed units
Operator logs and/or Transwestern approved contractor logs
Labor required to replace or repair failed units Compressor/Engine downtime costs caused by failures in the SAS apparatus
1. Data Acquisition System (DAS)
17

Periodic checks on gland pressures and adjustment of the SAS jet flow and recycle balance valves may be required as leak rates increase and the glands become pressurized. After initial measurements are complete, the site operators will perform routine SAS system leak checks and if significant leaks are present, the Operator's Manual will be followed to determine appropriate action. The time required to conduct these activities will be logged. In the event that any of the SAS components fail and need repair or replacement, Enron site personnel or Enron approved site contractors will log the purchase cost of each component, and the time and materials expended in installing and checking the new components. Although unlikely, if failure in the SAS system causes malfunctioning of the compressor or the engine, Enron site operators will be consulted to help quantify the costs associated with the failure.
At the conclusion of the test period, the Center will calculate net O&M costs by adding the capital costs of all equipment replaced, multiplying Transwestern's actual labor rates by the total number of hours spent performing new equipment installation and routine monitoring and other activities.
2.3.2.5. Calculate SAS Payback Period
A primary objective of the verification test is to calculate the payback period for the SAS. Payback occurs when the total cost of the SAS (amortized capital, amortized installation, and operation and maintenance) equals the savings that the system provides (in this case, the gas recovered as fuel).
The SAS is capable of capturing leaking gas at any time, including when compressors are not operating (i.e., the SAS recovers gas during all operational and stand-by periods). During compressor stand-by mode, gas leaks may increase which allow the SAS to recover additional gas. In such cases, the economics for the SAS can be enhanced if the recovered gas can be used as engine fuel. At the host site, the recovered gas will be used as engine fuel, but when none of the three engines are running, gas can be recovered but not used. In this case, the recovered gas will not be counted in determining the payback period.
To calculate payback, two computational procedures will be executed, as shown below.
1. Total cost will be determined by adding the SAS capital costs, installation costs, and O&M costs determined as outlined in Sections 2.3.1.5 and 2.3.2.4. Capital costs will be amortized over the pay period assuming a discount rate of return of 10%. To achieve payback on these amortized costs, the following equation must hold true.
Costs Total = (GP) Saved) Gas (Total
Where: Total Costs = sum of amortized capital, amortized installation, and O&M costs ($) Total Gas Saved = net volume of methane (SCF) required to achieve payback
(see Step 2) GP = gas price ($2/MCF)
2. Assuming that an operator will install the SAS at the time of rod seal replacement, extrapolation of the measured gas recovery data is required because the 8-month measurement period does not allow full characterization of total gas recovered before and after the measurement period. Sections 2.3.1.2 and 2.3.2.2 describe how these extrapolations will be accomplished, and the equation below shows the math that will be applied. Recall
18

from Section 2.3.1.2 , that two methods will be used to estimate the gas recovered before and
Saved Gas Total = Saved Gas Test + Saved Gas Est
after the measurement; a conservative case estimate and a projected or likely case estimate.
Saved|Test
measurement period, SCF Gas Est
and after the measurement period, SCF
Case ve Conservati :
Ø(GRTs LIA - To) (Ts - ) T œ
øSaved Gas Est = Œ o + [GRT Back (Pay - ) T ]f f
º 2 ß
LikelyCase:
Ø(GRTs ) NIA - (Ts - ) T œ
ø T = Back Pay
To
Saved Gas Est = Œ o + �f(GR,T) = º 2 ß T T f
Where: To = low industry average leak rate (~0.1 SCFM/rod) after packing is replaced, NIATo
scfm GR = leak rate at the beginning of the measurement period, measured by in-line
devices, GRTf = leak rate at the end of the measurement period, measured by in-line devices, scfm To = time at which rod seals were installed, HR (To = 0) Ts = measurement period start time, HR Tf = measurement period finish time, HR Pay Back = time at which payback is achieved, HR f(GR, T) = function that characterizes gas recovery profile for period after measurements
end, SCF, determined statistically
2.4. FIELD TEST OVERVIEW
The previous Section identifies the verification parameters to be characterized. It describes the strategies for quantifying each parameter, the monitoring equipment needed to execute those strategies, the monitoring frequencies and durations planned, and data analysis and interpretation approaches. Table 4 presents a summary matrix of the verification plans described in the previous Section.
The previous Section provides few details on the equipment and procedures planned for the field study. Thus, the following Sections provide an overview of the primary measurement systems planned for use at Station 4 (more detailed specifications and field procedures are provided in Section 5). Table 5 summarizes specifications for the key devices planned for use.
19

Table 4. Verification testing matrix.
SAS Verification Approach Method Frequency/Duration Parameter (number/weeks)
Phase I Evaluation: Verify initial leak Check for and quantify High Volume Sampler Gland: weekly/3 weeks capture performance system leaks (HVS) Other components: same Verify initial gas Monitor gas flow within 8 Mass flow meters Continuous/3 weeks recovery & use the system performance Verify initial Monitor gas flow within 8 Mass flow metersa Continuous/3 weeks a
methane emission the system a
reduction Document Observe and document Visual inspection, installation and installation process at the contractor interviews shakedown site and logs requirements Document initial Obtain site-specific cost Vendor input, capital and inputs from various contractor logs, other installation costs sources sources
Phase II Evaluation: Verify long-term leak Check for and quantify High Volume Sampler Gland: bi-monthly/7 capture performance system leaks (HVS) months
Other components: monthly /7 months
Verify long-term gas Monitor gas flow within 8 Mass flow meters Continuous/8-months recovery and use the system performance Verify long-term Monitor gas flow within 8 Mass flow meters a Continuous/8-months a
emission reduction the system a
Document long-term Log resources required, Log sheets Continuous/8-months operation problems encountered, requirements etc. Calculate SAS See Section 2.3.2.5 See Section 2.3.2.5 payback period a. The HVS will be used to verify that the SAS does not perturb leak rates from the seals, and the oxygen
monitor will verify that no increase in oxygen content occurs in the system. If perturbations are observed, HVS monitoring will likely be conducted on at least a monthly basis.
20
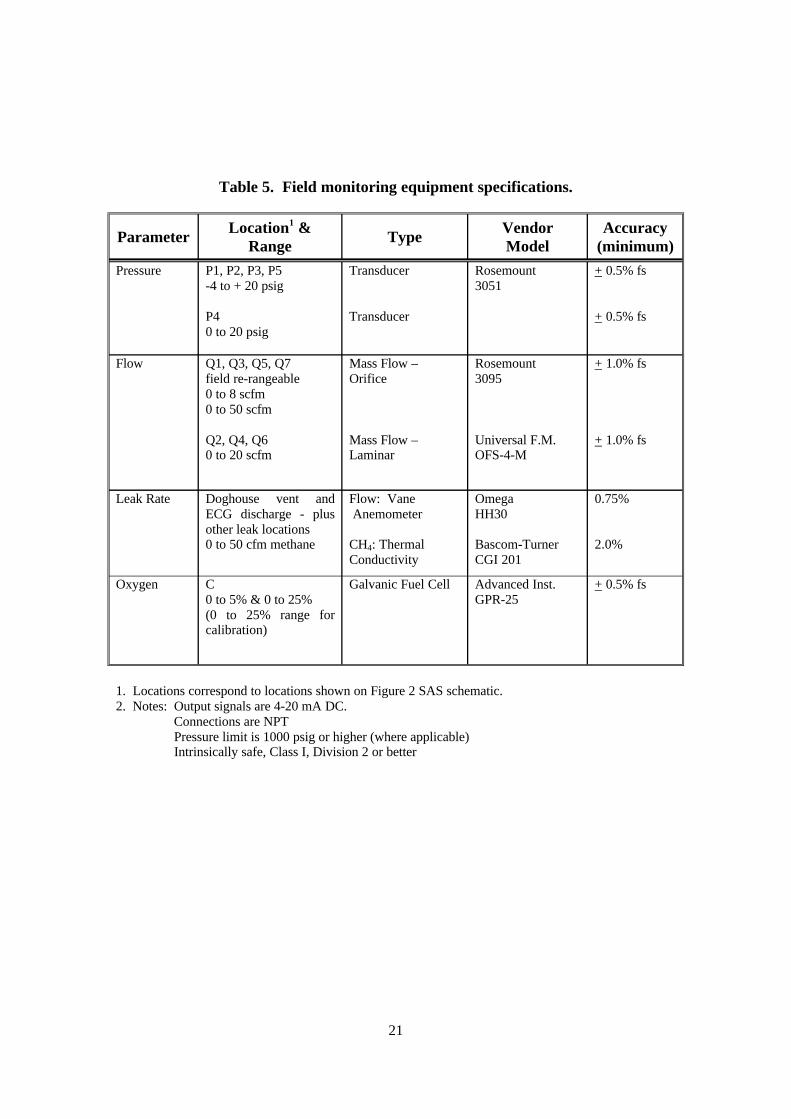
Table 5. Field monitoring equipment specifications.
Parameter Location1 &
Range Type
Vendor Model
Accuracy (minimum)
Pressure P1, P2, P3, P5 -4 to + 20 psig
Transducer Rosemount 3051
+ 0.5% fs
P4 0 to 20 psig
Transducer + 0.5% fs
Flow Q1, Q3, Q5, Q7 field re-rangeable
Mass Flow – Orifice
Rosemount 3095
+ 1.0% fs
0 to 8 scfm 0 to 50 scfm
Q2, Q4, Q6 0 to 20 scfm
Mass Flow – Laminar
Universal F.M. OFS-4-M
+ 1.0% fs
Leak Rate Doghouse vent and ECG discharge - plus other leak locations
Flow: Vane Anemometer
Omega HH30
0.75%
0 to 50 cfm methane CH4: Thermal Bascom-Turner 2.0% Conductivity CGI 201
Oxygen C 0 to 5% & 0 to 25%
Galvanic Fuel Cell Advanced Inst. GPR-25
+ 0.5% fs
(0 to 25% range for calibration)
1. Locations correspond to locations shown on Figure 2 SAS schematic. 2. Notes: Output signals are 4-20 mA DC.
Connections are NPT Pressure limit is 1000 psig or higher (where applicable)
Intrinsically safe, Class I, Division 2 or better
21
2.4.1. High Volume Gas Sampling
In general, the HVS provides sufficient suction to capture the entire leak from a single component into the device for real-time methane leak rate quantification. Gas composition is measured with a Bascom-Turner hydrocarbon analyzer calibrated specifically to methane (range 300 ppm to 100%), and flow through the HVS is provided by a compressed air driven venturi. A precision internal vane anemometer located inside a long, straight run of pipe measures flow rate.
The high flow principal utilized by the HVS has been used for quantifying leaks from valves, flanges, open-ended lines, etc. in natural gas production facilities, processing facilities, and transmission facilities. There are currently two devices that have been constructed and used for this type of measurement. The first device is called the High Volume Collection System (HVCS). The second is the Gas Research Institute Hi-FlowTM System. The HVCS was the subject of a successful EPA-sponsored verification study comparing its performance against EPA approved methods (SRI, 1995). The Hi-Flow system has been the subject of recent development and testing by GRI (Lott et. al., 1995). During the pre-test site survey at Station 4, an attempt was made to quantify emissions using both devices. It was concluded that increased flow capacity may be needed to address a wide range of potentially different testing configurations. For this reason, the HVS was developed and will be independently tested for accuracy and stability initially, and verified at several intervals during the study. These results will be included in the Phase II Report. Both the HVCS and GRI instruments are identical in principle to the device planned for use in this study, but the specific technique used for inducing and measuring flow differs (see specifications in Table 5).
Currently emissions from the rod packing are released primarily from the doghouse vent, and potentially, the doghouse oil drain. All gas leaking from the primary seal must enter the doghouse, and the doghouse is vented only at these two points. This is the case for all three rodseals to be tested.
Emissions may be captured by pulling a sufficient volume of gas through the vent, and allowing ambient air to enter through the drain and replace the gas removed from the doghouse. The leak rate may be accurately quantified by metering the sampling rate (cfm) and analyzing the gas (methane) concentration (%) in the metered flow after equilibrium is established. The product of these two values gives the methane leak rate (in cfm).
This procedure requires disconnecting manifold piping used to vent the doghouse vents. It is recognized that ambient air will be used as the dilution gas, and that this air will contain some low levels of methane. For the leak rates expected, this would be insignificant, even at fairly high ambient methane levels. However, background methane levels will be monitored during all high volume sampling, and a correction applied if background levels are significant (see Section 5.1.2).
Prior to installing the SAS, the doghouse vent will be sampled with the HVS to determine uncontrolled emissions from each rod. After installation, HVS sampling will be conducted in two configurations. The first configuration is identical to the pre-installation testing, except that now the SAS is operating and the measurement is of the fugitive emissions not captured by the SAS. The second configuration measures the gas emitted through the SAS gland with the gland disconnected from the SAS purge gas supply. This measures the rod packing leak rate without any potential influence of the SAS system.
22

During high volume sampling, it is possible that the diluted methane in the sample stream could reach the lower or upper explosive limits. HVS electrical components are intrinsically safe (the methane analyzer and anamometer readout) and HVS moving parts (the anemometer vane) pose no spark hazard. Nonetheless, methane concentrations in the high volume sample will be monitored carefully during measurements to avoid explosive conditions. When sampling to confirm zero or near-zero leak rate from the SAS gland, methane concentrations in the sample flow are expected to be low; however, concentrations may be higher at first as accumulated methane is removed from the doghouse. It is possible that the methane concentration would remain briefly within explosive limits during this initial purge. Once concentrations have stabilized, high volume flow will be adjusted to keep the methane concentration below 2.5 percent or one-half the lower explosive limit.
The second purpose of the high volume sampling is to provide an independent check on the leak rate with the SAS gland disabled. In this case, methane concentration in the sample flow will be high. To avoid reaching the upper explosive limit, sample flow will be started low and the methane concentration monitored continuously as the flow is increased. The methane concentration in the sample stream will not be allowed at any time to go below 30 percent – or twice the upper explosive limit.
2.4.2. In-line Gas Flow and Pressure Measurement
Emissions from the SAS gland installed on each of the three compressor rods will be discharged to a Croll-Reynolds Eductor/Compressor (CREC) where the pressure will be increased to 80 psig to enter the fuel manifold. The total gas recovery from the SAS is the difference between the SAS motive gas used and the total gas recovered from the system. This total gas recovery will be determined by measuring both gas flow rates continuously at these two locations (see Figure 2 locations Q7 and Q8) using accurate mass flow meters. The flow metering devices will:
• provide minimal pressure drop in order not to disrupt the system;
• provide precision and accuracy sufficient to satisfy data quality objectives;
• meet Transwestern piping and pressure surge standards; and
• be rugged and reliable to withstand field use and provide good data capture efficiency.
The contribution to total gas recovery from each SAS gland will also be measured directly (see earlier Figure 2 locations Q1 through Q6). The contribution from each rod is being quantified individually because measurements conducted during the site survey suggest there may be considerable variability in the leak rates from the three rods. The rod-specific gas recoveries will be determined using similar instrumentation to that described above for total system flow, and these data will be used to assess SAS performance for varying leak rates.
Figure 2, presented earlier, shows all pressure monitoring locations and indicates how total gas recovery and individual rod gas recovery values will be calculated from the direct measurements. In order to reduce the burden on local operators and increase data capture, the local data acquisition system (DAS) will be used to acquire data from the flow meters, oxygen monitor, and
23

pressure transducers. Hourly averaged flow and pressure data will be collected over the duration of the study. These data will be automatically downloaded to the SRI remote computer and reviewed daily.
2.4.3. Oxygen Concentration in SAS Discharge
Given that the SAS is handling near pure methane, significant quantities of air in-leakage would be required to approach the upper explosive limit of natural gas and air within the system. To address the concern that the SAS could produce an explosion or fire hazard, the SAS has design features that minimize this possibility. First, the SAS normally operates at or near (-10 inch water) atmospheric pressure, minimizing the chances that significant quantities of ambient air would enter the system rapidly. In addition, a natural gas purge is applied, and a positive pressure is maintained in the outer sealing ring of the SAS gland. This helps ensure that any gas aspirated into the system is natural gas only.
To evaluate the ability of the SAS to prevent air entrainment, oxygen will be monitored continuously in the total gas recovery flow just prior to entering the Croll Reynolds Eductor (see Figure 2). In order to indicate the presence of ambient air entrainment well before a safety hazard develops, it is necessary to reliably detect a low concentration of oxygen (at least 0.1%). With the location selected, low levels of air in-leakage could be detected within 1.25 seconds of inleakage onset.
Oxygen values will be monitored continuously using a galvanic fuel cell-based instrument provided by Advanced Instruments. This instrument is capable of detecting oxygen at concentrations of 0.03% or less. These data will be transmitted to the DAS and reviewed daily. In addition, the oxygen level will be provided with an alarm to alert operators to the development of a potentially unsafe condition.
2.5. SCHEDULE OF ACTIVITIES
Figure 5 outlines the tentative schedule of activities for the verification test. Several activities identified in the figure have already been completed including site selection, strategy development, and initial equipment fabrication. Field and laboratory testing are scheduled to begin in January of 1999, but the exact date of start-up is uncertain, and will depend on the availability of certain equipment and the extent to which difficulties are encountered during startup and shakedown. Uncertainty in the start-up date may impact the dates for the subsequent activities in the schedule.
If testing begins in early January 1999, all field activity should be completed by September 1999. Allowing time for data analysis to be completed, a draft Phase I Report should be available for review in April 1999. Figure 5 illustrates the schedule and sequencing of the various reviews planned, including the vendor and host site review, the EPA quality assurance review, and the external peer review (i.e., Stakeholder review). A draft Phase II Report should be available in November 1999, and the same sequence of review will begin at that point. If all goes according to plan, a final Phase I Report should be available for distribution in June 1999, and a final Phase II Report should be available for distribution in December 1999.
24

This test is a complex undertaking, involving participants from three separate organizations, and evaluation of a technology never before used at natural gas compressor stations. Complications are likely to occur, and some of these complications may impact the schedule. As schedule changes become necessary, the schedule presented in Figure 5 will be updated, and copies of the revised schedule will be made available upon request.
3.0 DATA QUALITY OBJECTIVES
Data quality objectives state the values of key data quality indicators that must be achieved in order to draw conclusions from the measurements with the desired level of confidence. The process of establishing data quality objectives for measurements starts with determining the desired level of confidence in the primary verification parameters (e.g., confidence level in the verified payback period). The next step is to identify all measured variables impacting the primary verification parameters, and determine the error allowed in each using error propagation. With error propagation, the cumulative effect of all measured variables on the primary data quality objective can be determined. This allows individual measurement methods to be chosen which perform well enough to satisfy the data quality objective for the primary verification parameter.
3.1. PAYBACK PERIOD
The primary quantitative objective for this study is to establish the payback period associated with installation and use of the SAS. Inherent in this objective is documentation of the SAS's gas recovery and use performance. Based on meetings with the Stakeholders, a payback period of three years would represent acceptable performance. An error in this value of about +/- 3 to 4 months, or about 10 percent, is used to determine the data quality requirements.
Payback occurs when the total cost of the SAS (amortized capital and installation costs, and operation and maintenance costs) equals the savings that the system provides (gas recovery as fuel). For the field test, the costs will be based on actual costs and the errors are zero. Gas recovery will be measured directly during the study, then projected for the periods immediately before and after the test is done. Data quality objectives address the error in the direct measurements only; however, a discussion of the errors in the projections is also provided below.
As previously discussed, the total recovered gas flow from all three rods and from each rod individually will be measured directly using mass flow meters. The propagation of errors is straightforward. The cumulative gas collected over the 8-month study period is the integral under the curve of flow measured over time; which is very closely approximated as the sum of the hourly flow measurements over the duration of the test. The data quality objective specifies a maximum desirable error in the payback period of 10 percent, so the flow meters would have to be accurate to within +/- 10 percent IF they were used to monitor the gas recovery over the entire payback period. Of course they will not, and a substantial portion of the total gas recovery over the payback period will be based on projections of these data, so it is desirable to make the direct measurements as accurate as possible. Accordingly, mass flow meters accurate to within + 1 percent will be used.
25

Figure 5. Tentative schedule.
ID Task Name 1 Compressor Leak Capture Verification (A&A)
2 Site Selection & Strategy Development
3 Test Plan Development & Review
4 Equipment Fabrication, Installiation, Shakedown
5 Field and Laboratory Testing
6 Data Analysis and Validation
7 Verification Report & Statement (Phase 1)
8 Draft Development (Phase 1)
9 Final Development (Phase 1)
10 Vendor Review
11 EPA QA and Peer Review
12 Final EPA Review (B.W. & Blair)
13 Distribution of Results
14 Verification Report & Statement (Phase 2)
15 Draft Development (Phase 2)
16 Final Development (Phase 2)
17 Vendor Review
18 EPA QA and Peer Review
19 Final EPA Review (B.W. & Blair)
20 Distribution of Results
Sep Oct Nov Dec Jan Feb Mar Apr May Jun Jul Aug Sep Oct Nov Dec Jan Feb Qtr 4, 1998 Qtr 1, 1999 Qtr 2, 1999 Qtr 3, 1999 Qtr 4, 1999 Qtr 1, 2000
26

To project emissions outside the range of the test period, measured flows and other data will be used to approximate leak rate changes expected to occur on rod seals. In general, there are two projection scenarios that will be considered; the conservative case projection and the likely case projection (see Section 2.3.2.2). Each will yield the same total gas recovery estimate, although over different time periods, but each will contain significantly different degrees of uncertainty. With the conservative case, projected recovery rates in the post-study time frame will be fixed at the value measured at the end of the study. This value will be based on mass flow rate measurements, and it is improbably that the post-study recovery would be below this value. As a result, confidence in the conservative payback estimate should be high. Although the pre-study recovery projection will contain greater percent uncertainty than the post-study projection, it's influence on the total recovery is expected to be relatively small (about 20 % of total recovery), thus, it's impact on overall uncertainty will be relatively small. With the conservative case, we should be able to state with high confidence that estimated payback will not exceed the reported value.
Projections associated with the likely case scenario will contain greater uncertainty than the conservative case, primarily because of the greater uncertainty associated with the post-study projection. This projection will be based on curve fitting to the measured data, and will be buffered by a consideration of operational parameters (e.g., rod temperature, gland specific performance, system pressures, observations during the test, etc.). As a practical matter, it will not be possible to completely characterize the error in this projection, so the analysis approach will strive to constrain errors within reasonable bounds. These constraints will be developed as the data are analyzed and the specific processes and emission relationships are better understood.
3.2. OXYGEN MONITORING
Oxygen concentration will be monitored at the SAS system discharge in order to confirm that the SAS does not introduce ambient air into the system. As discussed in Section 2.5.3, the sensor must be capable of measuring 0.1 percent oxygen or less in order to provide adequate safety. It is unlikely that this measured parameter will impact the quality of the payback period estimates because if oxygen is detected in the system, the source of the leak will be quickly identified and repaired. Nevertheless, high quality and accurate readings will be collected to ensure high confidence in this critical safety check.
3.3. PRESSURE MONITORING
Pressures will be monitored at various locations throughout the SAS system. These are diagnostic measurements to be used for evaluating SAS performance characteristics and are not expected to play a quantitative role in determining the payback period. The pressure transducers selected for this study are accurate to 0.5 percent full scale. As with the oxygen monitoring, it is unlikely that this measured parameter will impact the quality of the payback period estimates. Nevertheless, high quality and accurate readings will be collected to ensure high confidence in the diagnostic utility of monitoring pressures.
3.4. HVS SAMPLING AND LEAK MONITORING
One of the purposes of the high volume sampling will be to measure any residual leaks produced by the SAS components after installation. As such, the minimum detectable leak rate for the
27

system is the key data quality indicator of interest for this measurement. The methane analyzer used in the high volume system can detect concentrations as low as 300 ppm +/- 100 ppm. A value of 1000 ppm or 0.1 percent methane is a practical lower quantifiable limit. The lowest quantifiable flow through the high volume sampler is about 4 cfm (better than +/- 1 percent). At this minimum concentration and flow, a leak rate of less than 0.01 cfm (1 percent of 1 cfm) would be reliably detected with an error of +/- 11 percent in the leak rate. Note that this error (+/- 11 percent) is at the lower quantifiable limit. Over most of its range, the high volume sampler should be accurate to within about 3 to 6 percent (based on the errors in the flow and concentration measurements).
The second use of the high volume sampler is to provide an independent check on the leak rate before the SAS is installed and, after installation, with the SAS disabled. In this case, the sampler will be operating well above the minimum detectable levels and the precision and accuracy of the leak rate should remain within 3 to 6 percent of the actual leak rate.
4.0 DATA QUALITY INDICATORS
Table 6 summarizes data quality indicators for all measurements and briefly indicates how those indicators will be determined or verified. A detailed description of sampling and analytical procedures - including calibrations and QC checks used to derive measured data quality indicators can be found in Section 5.
Table 6. Data quality indicators.
Measurement Method Precision/ Accuracy
How Verified/ Determined
Fugitive Leak Rate High Volume
3% - (4 to 100 percent methane) 6% (5000 ppm to 4 percent methane) 11 % (< 5000 ppm methane)
Propagated from Flow and Concentration
Flow Vane Anemometer
1% of reading Checked against Manometer
Concentration (4% to 100% methane) CGI-201 2% FS Zero/span checks Concentration (0.5% to to 4% methane) CGI-201 5 % of reading Zero/span checks
Concentration (1000 to 5000 ppm) CGI-201 10 % of reading Zero/span checks
Flow Check Digital Manometer
0.2% FS Performance Checks (a)
SAS Flows 0 to 8 and 0 to 50 scfm Q1,Q3,Q5,Q7 Mass Flow -Orifice
1% FS Performance Checks
SAS Flows 0 to 20 scfm Q2,Q4,Q6,Q8 Mass Flow -Laminar
1% FS Performance Checks
SAS Pressures -4 to + 20 psig P1-P3, P5 Transducer 0.5% FS Performance Checks SAS Pressures 0 to 20 psig P4 Transducer 0.5% FS Performance Checks
O2 Concentration Galvanic Fuel Cell
0.5% FS Performance Checks / Single Point Calibration
a. Note: Performance checks as a means of verification implies that we will use the manufacturer’s specification for precision/accuracy unless a check of sensor performance indicates a problem. Specific performance checks are given in the sampling and analytical procedures of the final test plan.
28

5.0 SAMPLING AND ANALYTICAL PROCEDURES
5.1. LEAK RATE-HVS MEASUREMENTS
5.1.1. Description
The rationale and design principles for the high volume sampler to be used in this test have been discussed above (Section 2.4.1). This Section provides details on the construction and acceptance testing, operating procedures, and QA/QC procedures.
Apparatus A high volume sampler was specially constructed for this test. Air flow is provided by a compressed air driven venturi air amplifier and metered by a vane anemometer fitted within a 30 inch long, 3" ID straight pipe. Sample concentration is determined using a Bascom-Turner model CGA-201 hydrocarbon analyzer calibrated specific to methane. The analytical range of this device is 300 ppm to ~100%. Since the vane anemometer is sensitive and could be damaged, the system is also fitted with a removable orifice plate that is used to periodically check the performance of the anemoneter by measuring the pressure differential across the orifice.
The complete system will quantify leak rates from near zero to over 50 cfm and is designed to be sufficiently accurate and precise over this entire range (see data quality objective Section 3.4). Verification of HVS accuracy and precision is discussed below (Section 5.1.3). Figure 6 is a diagram of the apparatus.
Figure 6. High volume sampler.
Hi l l
i l i l i f ii
i n l1/
SiAi l y
i
l
1 l iifi ly
Hi
g h Vo u m e Sa m p e r
VaneAnemometer (2.75" ID,0 -7800 fpm)
VACCON CDF 1000 Var ab e A r Amp er:
0 to145 sc fm at 80 ps (9 c fm) . 1 .25” NPT at et
4 ” NPT feed
te Compressed r Supp
(~90 ps , up to 9 scfm)
B-T CG A-201 HC Ana
” IDSamp eL ne Or ceAssemb
gh
yze r Manometer Anemometer 300 ppm to ~100% methane
Readout Readout
29

Sampling Locations and Numbers
Figure 7 shows the high volume sampling configurations that will be used in the test. Prior to installing the SAS, the first configuration will be used. It measures the rod packing leak rate through the doghouse vent and drain. During the test, high volume sampling will be conducted in two locations. The first configuration is identical to the pre-installation testing, except that now the SAS is operating and the measurement is of the fugitive emissions not captured by the SAS. The second configuration samples the ECG discharge with the SAS disabled and isolated from the system. This measures the rod packing leak rate without influence of the SAS system. The rod packing leak rate and SAS fugitives will be determined weekly for 3 weeks after installation and then twice per month for the duration of the test. These data will be used for determining the rod packing emissions profile and for quantifying the capture efficiency of the SAS.
Figure 7. High volume sampling configurations.
High Volume Sampling Configurations
i ii i lli
i i
i ii l
in
Conf gurat on 1 Used pr or to nsta ng SAS and dur ng test w th SAS Enab
Conf gurat on 2 SAS D sab ed
Doghouse
Dra
Vent
led
Sampling Method
The following discussion presents the rationale for the sampling method in each of the configurations (ECG and doghouse sampling). Step be step procedures are given in Section 5.1.2.
Sampling the ECG. Sampling the ECG is a straightforward application of the basic high volume sampling method that has been widely used to quantify leak rates in the oil, gas, and petrochemical industries (see Section 2.4.1). The ECG is isolated from the system and a sampling port is opened on the discharge side. The rod packing leak is captured by the ECG and directed to the sampling port. The leak rate equilibrates fairly rapidly due to the small volume of piping between the sampling port and the emissions annulus. Figure 8 shows a special HVS inlet constructed for this application. The inlet uses a "T" connection to mix dilution air and gas sampled from the ECG port. The ratio of dilution air to sampled gas can be adjusted using an
30

adjustable orifice at the dilution air inlet. The dilution air inlet can be fitted with a hose if necessary to ensure a supply of clean air. Background methane is measured at the dilution air inlet. A pressure tap is used to ensure that a slightly negative pressure is maintained at the HVS inlet, indicating that the flow is sufficient to capture all of the leaking gas.
Figure 8. HVS inlet for ECG sampling.
Sampling the Doghouse. Without the SAS, there are normally two emissions points for rod packing leaks – the doghouse vent and oil drain. The leak rate may be determined by capturing the leaking methane gas in a known volume of dilution air and determining the percentage methane in the sample. The leak rate (in cfm) is the product of the sample flow rate (in cfm) and the percentage methane.
Under normal circumstances, the doghouse starts out filled with ambient air (e.g., immediately after startup or following maintenance). Over time, the air in the doghouse is replaced with methane from the rod packing leak so that the doghouse becomes filled with near 100 percent methane. Once equilibrium is established, excess methane is vented from the doghouse at the same rate as the rod packing leak.
Ideally, the leak rate could be determined exactly as for the ECG by capturing the gas leaving the doghouse vent pipe in a metered volume of dilution air and determining the leak rate as described above. In practice, however, high volume sampling at the vent pipe tends to draw in accumulated methane from within the doghouse as well as the leaking gas (over-sampling) and give a reading in excess of the actual leak rate. During this process, ambient air enters the doghouse to replace the methane withdrawn (through the drain pipe). To get an accurate determination of the leak rate, it is then necessary to continue sampling until the accumulated methane has been withdrawn from the doghouse and the leaking methane is well mixed and in equilibrium with the dilution air in the sample.
31

This equilibrium may be accomplished more rapidly and effectively, by opening the drain pipe to the atmosphere and allowing ambient air to enter through the drain, replacing the accumulated methane. This procedure requires disconnecting manifold piping used to vent and drain the doghouse (procedure approved by host site).
Background Methane
Ambient air is used as the dilution gas in the method described above. Since the air inside the engine room may contain methane, the effect of this on the measurements must be considered.
The difference between the measured leak rate and the “actual” leak rate is simply the volume of background methane that is sampled. This depends on the concentration of methane in the background and the sampled volume of ambient air.
The concentration of methane in the background (k) is given by:
k = B/(B+A)
where B is the sampled background methane volume (cfm) and A is the sampled volume of ambient air (cfm). This yields the following expression for the background volume:
B = kA / (1-k)
Recall that 1000 ppm is the lowest quantifiable methane concentration for the HVS and the lowest measureable flow is about 4 cfm. This gives a lowest quantifiable leak rate of 0.004 cfm. If B is lower than this, it is not detectable. That is, if the background is less than 1000 ppm, it will add no more than this lower detectable limit to the result. Since the Bascom Turner analyzer will detect 1000 ppm (+/- 100ppm), it can be used to measure the background at the start of sampling. A background correction is necessary only when the background concentration exceeds 1000 ppm.
5.1.2. Test Procedures
A blank field data sheet is provided at the end of this Section (Figure 9). All references in the following procedure to recording data refer to this data sheet.
SETUP AND CHECKOUT
• Conduct setup and checkout procedures prior to each set of measurements (leak rates on 3 rods)
• Verify that the Bascom-Turner methane analyzer has been calibrated within the last 60 days. The calibration date will be written on a label attached to the analyzer - initialed by the calibrating technician. Record date of analyzer calibration. If the analyzer calibration is older than 60 days, check the box on the field data sheet, perform measurements, then ship analyzer for recalibration (see below).
32

Send analyzer to:Southern Research Institute6320 Quadrangle DriveSuite 100Chapel Hill, NC 27514(919) 403-0282
• Zero the methane analyzer by setting the selector switch to "zero" position and allowing the analyzer to complete it's zero checks. This must be done away from the engine room in a location that is free from methane levels in excess of normal atmospheric background.
• Check the anemometer against the 1" orifice plate (see Table ___ later in this Section). This procedure will be done for three consecutive sets of measurements, and then periodically thereafter (this will be determined during shakedown). See Section 5.1.3 for procedure. Record check results on data sheet. The 1" orifice plate can remain in the HVS during sampling.
PROCEDURE FOR SAMPLING CONFIGURATION 1, FUGITIVE LEAK RATE
This procedure measures the leak rate through the doghouse and is repeated for each rod.
• Record start time for sampling.
• Measure and record background methane concentration in the vicinity of the HVS inlet (the doghouse drain).
• Connect sample tube from the methane analyzer to the sampling port on the HVS.
• Disconnect doghouse vent pipe, drain pipe, and open to the atmosphere.
• Attach sample hose to doghouse vent pipe. Use duct tape to seal sample hose to vent pipe.
• Connect air supply (if not already connected) and adjust flow to at least 1000 fpm on anemometer readout.
• Verify that dilution air is entering drain pipe (use a strip of paper as an indicator). Increase flow if necessary. Verify a negative pressure of –5 to – 15 inches water at the HVS inlet
• Wait for flow reading to stabilize, and then record anemometer reading (fpm).
• The methane analyzer reading should begin declining as gas is vented from the doghouse. Depending on the flow and the leak rate, it may take 15 to 30 minutes to completely stabilize. Once the reading has stabilized, record the methane concentration. If the concentration falls below about 5000 ppm (0.5 percent), then decrease the flow and allow reading to stabilize again. Be sure to allow sufficient time for stabilization. An early reading may be biased significantly high.
33

• Once a reading is obtained, repeat the measurement at a decreased flow - at least 20 percent less than starting flow. The methane reading should increase proportionately. Record the second set of stable flow and concentration readings.
• The inside diameter of the of the anemometer duct is 2.75 inches. This gives an area of 0.04125 square feet. This factor multiplied by the anemometer reading (fpm) gives the total sample flow. The sample flow multiplied by the percent concentration gives the methane leak rate in CFM. For example, if the anemometer reading is 1200 fpm, this indicates a flow of 49.5 cfm (1200 X 0.04125). If the methane concentration is 2 percent, then the methane leak rate is 0.99 cfm (49.5 X 0.02).
• Record barometric pressure and temperature.
• Record sampling end time
• Repeat for second and third compressors.
PROCEDURE FOR SAMPLING CONFIGURATION 2, LEAK RATE MEASURED THROUGH ECG
This procedure measures the leak rate through the SAS gland with the system disabled. The procedure is repeated for each of the three SAS emissions containment glands.
• Record start time for sampling.
• Measure and record background methane concentration in the vicinity of the HVS inlet.
• Connect sample tube from the methane analyzer to the sampling port on the HVS.
• Shut down gas recovery through the SAS ECG by closing the shutoff valves on the suction and discharge sides of the ECG.
• Open the sample port and allow time for leak rate to stabilize. If the leak is a small leak, a few minutes may be needed. A larger leak will stabilize quickly.
• Attach high volume sampler inlet to ECG sample port.
• Adjust air/sample ratio to the starting set point for the rod (to be determined during shakedown).
• Start with a relatively small HVS sample flow (about 500 fpm anemometer reading or 20 cfm). Allow methane reading to stabilize and then adjust sampling rate so that the methane concentration is within analyzer range.
• Check sample inlet pressure with zero to 20 inch digital manometer. An inlet pressure of minus 5 to 15 inches water is good. If inlet pressure is too high (5 to 0 inches water), then decrease air flow to compensate. If the pressure is too low (less than -15 inches water), then increase air flow to compensate.
• If necessary, re-adjust HVS sample flow rate.
34

• Wait for flow reading to stabilize, and then record anemometer reading (fpm).
• The methane analyzer reading should stabilize rapidly as there is not a large volume of accumulated gas to purge. Once the reading has stabilized, record the methane concentration. If the concentration falls below about 5000 ppm (0.5 percent), then decrease the flow and allow reading to stabilize again. Be sure to allow sufficient time for stabilization.
• Once a reading is obtained, repeat the measurement at a decreased flow - at least 20 percent less than starting flow. The methane reading should increase proportionately. Record the second set of stable flow and concentration readings.
• Record barometric pressure and temperature.
• The inside diameter of the of the anemometer duct is 2.75 inches. This gives an area of 0.04125 square feet. This factor multiplied by the anemometer reading (fpm) gives the total sample flow. The sample flow multiplied by the percent concentration gives the methane leak rate in CFM. For example, if the anemometer reading is 1200 fpm, this indicates a flow of 49.5 cfm (1200 X 0.04125). If the methane concentration is 2 percent, then the methane leak rate is 0.99 cfm (49.5 X 0.02).
5.1.3. QA/QC Procedures
The following QA/QC procedures are to be conducted as specified - in addition to the checks conducted as part of the sampling procedure.
Analyzer Calibration
The Bascom Turner methane analyzer calibration should remain stable for up to 90 days. Each 60 days, the analyzer should be returned to Southern at the address given above for re-calibration. Calibration will be performed according to manufacturer's specifications and using a certified gas mixture and calibration apparatus provided by the manufacturer (Part numbers MC-105 and PCA001).
Calibrations will be performed and the analyzer shipped to arrive back on site within two weeks after receipt.
Anemometer check procedure
• Verify that 1" orifice plate is installed. Remove 3” PVC coupling at suction end of HVS. The orifice plate is a 1/4" plexiglass disk. If the plate is not installed, remove the split PVC retainer with fingers, install the orifice plate and replace the retainer and PVC coupling.
• Connect the digital differential manometer. Verify that the high pressure tube (marked "high") is connected to the nipple marked "high" on the manometer.
• Zero manometer using thumbwheel.
35

• Connect anemometer signal cable and turn on anemometer readout. Set to fpm scale.
• The sample hose should also be connected for this check.
• Connect air supply line to the quick-disconnect on the venturi and adjust flow to around 500 fpm. The flow adjust is not precise, so adjust to an approximate value. Record differential pressure.
• Similarly, adjust flow to approximately 1000, 1500, and 2000 fpm. Record differential pressures. Refer to the lookup table on the anemometer check data form (Figure 10). Find nearest pressure differential in the table. If the corresponding velocity is within the range defined by the table entries immediately above and below the velocity, the check passes. Note that the allowable percentage error is larger for small flows. The average table error is 5 percent.
Independent Verification of the HVS
The designed performance of the HVS is being experimentally verified by a third party. The tests will provide a total system calibration of known methane leak rate against HVS measured leak rate over a range of system flow rates.
5.2. FLOW MEASUREMENTS
SAS gas recovery is determined using pairs of mass flow meters upstream and downstream of each ECG, and upstream and downstream of the SAS gas recovery system. This provides gas recovery values for each rod and for the system as a whole. The sum of the individual ECG recoveries should be the same as the total system recovery (flow balance check). This provides an overall operational check on the flow metering system. Figure 2 (see Section 2.1) identifies flow metering points and specifies how gas recovery is determined from each pair of measurements.
Two types of mass flow meters are being used: laminar flow element and orifice meters. The laminar flow element meters are fixed range. The orifice meters can be field re-ranged by replacing the orifice plate and making adjustments to the transmitter software. This versatility is needed given the range of rod packing leak rates that might be encountered. When the SAS glands were installed , the leak rate for rod 3 increased dramatically (to over 30 scfm) for a period of several days, before subsiding.
Both types of flow meters are temperature and pressure compensated, providing mass flow output at standard conditions. The flow meters are sized according to the flow range expected at each location (an internal memo dated 12/8/98 documents sizing calculations). The flow range, accuracy and precision for each meter are given in Table 5 (see Section 2.4). The response time is 1 second. Each meter is fitted with a transmitter providing 4 to 20 mA output over the meter's range. This output is wired to an A/D module attached to the site's monitoring and control system. This allows data to be acquired and stored on the local data acquisition system and transmitted daily to SRI for screening and archival.
36

Figure 9. HVS testing - field data sheet. Setup and Checkout - Complete for each set of measurements.
Date of last methane analyzer calibration: _____ / ______ /______.
Date of last anemometer check: _____ / _____ / _____.
Zero check pass (Y/N)
Barometric Pressure _______"Hg Temp _______ deg. C Date
Configuration 1 -Doghouse Sampling Rod 1 Rod 2 Rod 3
Start time
Background methane
Velocity 1 (fpm)
CH4 1 (%)
Leak Rate 1 (acfm)
Leak Rate 1 (scfm)
CH4 2 (%)
Velocity 2 (fpm)
Leak Rate 2 (acfm)
Leak Rate 2 (scfm)
Note 1: To calculate leak rate (acfm). Leak rate (acfm) Note 2: To correct to standard conditions. = anemometer reading (fpm) * 0.04125 * %CH4/100 scfm = acfm * P/Pstd * Tstd/T.
Configuration 2 - ECG Sampling Rod 1 Rod 2 Rod 3
Start time
Background methane
Inlet Pressure (in H2O)
Velocity 1 (fpm)
CH4 1 (%)
Leak Rate 1 (acfm)
Leak Rate 1 (scfm)
CH4 2 (%)
Inlet Pressure (in H2O)
Velocity 2 (fpm)
Leak Rate 2 (acfm)
Leak Rate 2 (scfm)
37

Figure 10. Anemometer check data form.
Table check values delta_p anemometer low high inches H2O (fpm) (fpm) (fpm) Pass?
1 (~500 fpm) Y/N
2 (~1000 fpm) Y/N
3 (~1500 fpm) Y/N
Lookup Table for Manometer Check of the HVS Vane Anemometer
delta_p fpm delta_p fpm delta_p fpm delta_p fpm delta_p fpm 0.1 210 2.1 1030 4.1 1460 6.1 1790 8.1 2080 0.2 300 2.2 1050 4.2 1470 6.2 1810 8.2 2090 0.3 370 2.3 1080 4.3 1490 6.3 1820 8.3 2100 0.4 430 2.4 1100 4.4 1510 6.4 1840 8.4 2120 0.5 490 2.5 1130 4.5 1530 6.5 1850 8.5 2130 0.6 540 2.6 1150 4.6 1550 6.6 1870 8.6 2140 0.7 580 2.7 1170 4.7 1560 6.7 1880 8.7 2150 0.8 620 2.8 1190 4.8 1580 6.8 1900 8.8 2170 0.9 660 2.9 1220 4.9 1600 6.9 1910 8.9 2180
1 700 3 1240 5 1610 7 1920 9 2190 1.1 730 3.1 1260 5.1 1630 7.1 1940 9.1 2210 1.2 770 3.2 1280 5.2 1650 7.2 1950 9.2 2220 1.3 800 3.3 1300 5.3 1660 7.3 1970 9.3 2230 1.4 830 3.4 1320 5.4 1680 7.4 1980 9.4 2240 1.5 860 3.5 1340 5.5 1700 7.5 1990 9.5 2260 1.6 890 3.6 1360 5.6 1710 7.6 2010 9.6 2270 1.7 920 3.7 1380 5.7 1730 7.7 2020 9.7 2280 1.8 950 3.8 1400 5.8 1740 7.8 2040 9.8 2290 1.9 980 3.9 1420 5.9 1760 7.9 2050 9.9 2300
2 1000 4 1440 6 1780 8 2060 10 2320
This Table was generated from data collected with the HVS constructed for the test.The table is traceable to calculations contained in the file "manometer check.xls" - see project records.
38

The digital output for each meter is scaled over a range of 0 to 100 with resolution of 4096 increments (12 bit). To obtain the meter reading in engineering units (scfm), it is necessary to scale the output to the full scale range of the meter.
5.2.1. Test Procedures
The flow meters operate unattended continuously after installation. Configuration testing will be completed during the intitial SAS shakedown. This will include the following:
• manufacturer's startup checks • sensor function check - reasonableness and flow balance checks
Once the system is operational, hourly flow data averaged from 15-minute readings will be reviewed daily. The daily review will include reasonableness checks and flow balance as well as emissions trends and changes that could indicate system problems.
5.2.2. QA/QC Procedures
The manufacturer is providing a calibration certificate for each of the flow meters. The meters should not require re-calibration over the duration of the test. Any sensor failure within the meter is reported with an out of range signal. The overall function of the meters will be assessed during the daily data review using reasonableness and flow balance checks.
5.3. PRESSURE MEASUREMENTS
SAS system pressures will be monitored continuously to provide an ongoing indication of overall system function. There are five pressure monitoring points in the system (P1 - P5, see Figure 2). P1 through P3 monitor the individual ECG pressures. The ECG's should normally operate slightly below atmospheric (about minus 10 inches water). Pressure above atmospheric indicates an increased leak rate for the rod. P4 monitors the recycle manifold pressure and also indicates the SAS discharge pressure. P4 also indicates whether the SAS is producing sufficient operational pressure for the CREC. P5 monitors the SAS suction manifold pressure. A pressure increase in P5 indicates an increased leak rate from one or more ECGs. P5 is used to set an alarm level for gland pressure. The alarm level will initially be set at plus 5 psi. This alarm does not require immediate action, but indicates a need to assess the source of the increased pressure, and possibly adjust the SAS jet flow and recirculation.
All pressures are monitored using Rosemount model 3051 “smart” pressure transmitters which have a very high degree of stability over time (0.25% in five years). All pressure sensors transmit a 4 to 20 mA linear signal over the range and with the accuracy given in Table 5. These sensors have no significant bias or hysteresis (outside of the precision limits). The response time is very fast (> 20 Hz). In the data acquisition system, the digital output for each pressure transmitter is arbitrarily scaled over a range of 0 to 100 with resolution of 4096 increments (12 bit). To obtain the meter reading in engineering units (psi or inches water), it is necessary only to scale the output to the full scale range of the meter.
39

5.3.1. Test Procedures
The pressure transmitters are designed to operate continuously and unattended. Configuration testing will be completed during the intitial SAS shakedown. This will include the following:
• manufacturer's startup checks • sensor function check - reasonableness checks
Once the system is operational, hourly aggregated flow data will be reviewed daily for trends, spikes or any changes in normal, stable operation.
5.3.2. QA/QC Procedures
The manufacturer is performing laboratory calibrations on each sensor and providing calibration certificates. Routine quality control consists of daily checks for reasonableness, trends, spikes, or other changes in operation that could indicate a system problem. Any sensor malfunction is reported as an out of range signal.
5.4. OXYGEN MONITORING
5.4.1. Description
Since the SAS operates at a slight negative pressure, there is a concern that ambient air could enter the gas recovered by the SAS producing an explosion or fire hazard. The SAS design addresses this by providing a natural gas purge pressure to the tertiary seal area so that, in the event that gas does enter the emissions annulus from the tertiary seal area, only natural gas and not air will be introduced.
The safety and effectiveness of this system will be evaluated by continuously monitoring oxygen levels in the total gas recovery flow (at the SAS jet manifold discharge). Since the SAS discharge is normally nearly pure methane, a large volume of air would have to be introduced to dilute the gas stream down to the upper explosive limit. An explosive condition would occur only when 80 to 85 percent of the gas stream had been replaced with air. The oxygen concentration at the upper explosive limit would be 17 to 18 percent. Since any entrained air could be an indication that a hazardous condition is developing, the oxygen monitor to be used for the test is sensitive to concentrations as low as 25 ppm (0.0025 percent).
The pipeline gas normally contains trace amounts of oxygen (<0.1%). An alarm will be set at three times 0.1%. An automatic shutdown will be triggered if the oxygen sensors sees more than 2 percent oxygen.
Typical analysis of the pipeline gas includes the following major constituents (>0.1%):
• Methane 96.6% • Carbon Dioxide 1.5% • Ethane 1.1% • Nitrogen 0.5% • Propane 0.2%
40

In addition to oxygen, other trace (<0.1%) constituents include butane, pentane, and C+.
The oxygen sensor is a galvanic fuel cell which is a type of electrochemical cell with long life, high sensitivity, and fast response. The sampler draws a small sample from the SAS disharge manifold using system pressure. The reading is insensitive to changes in pressure. The range, and accuracy of the oxygen sensor is given in Table 5. The response time to 90 percent full scale is 9 seconds; however, the sensor will show a marked response to an increase in oxygen concentration almost immediately (within 1 to 2 seconds). The sensor life is normally 32 months which exceeds the duration of the test.
The transmitter provides a 4 to 20 mA linear output from 0 to 5 percent oxygen. The digital output for each A/D module is arbitrarily scaled over a range of 0 to 100 with resolution of 4096 increments (12 bit). To obtain the meter reading in engineering units (psi or inches water), it is necessary to scale the output to the full scale range of the meter. The sensor response gives oxygen concentration by volume. It is not necessary to correct to standard conditions since the sensor is being used only as a safety device.
Hourly oxygen data will be downloaded and reviewed daily.
5.4.2. Test Procedures
The oxygen sensor and transmitter are designed to continuously operate unattended. Configuration testing will be completed during the intitial SAS shakedown. This will include the following:
• manufacturer's startup checks • sensor function check - reasonableness checks
Once the system is operational, hourly aggregated concentration data will be reviewed daily for trends, spikes or any changes in normal, stable operation. The sensor electronics provide an out of range signal in the event of sensor failure.
5.4.3. QA/QC Procedures
Every 90 to 120 days, the sensor requires a span check. This is accomplished by selecting the 0 to 25 percent scale, sampling ambient air, and adjusting the span as needed. The sensor will produce an out of range signal in the event of failure. Routine quality control consists of daily checks for reasonableness, trends, spikes, or other changes in operation that could indicate a system problem.
5.4.4. Data Acquisition System
5.4.5. Description
Each sensor is fitted with a signal conditioner/transmitter that produces a 4 to 20 mA linear output over the full scale range of the sensor. Each signal is transmitted to a dedicated 4 to 20 mA, 12 bit analog to digital (A/D) conversion module which is integrated into the station monitoring and control system. The station control software reads the data from each module every 15 minutes
41

and provides aggregation of sampled data into hourly values. Hourly values are stored in delimited ASCII data records on the station computer's hard drive. A dedicated data storage directory is assigned to store the SAS sensor data, as well as engine and compressor operational parameters that relate to the test. Table 7 lists all parameters that will be collected and stored and their purpose.
5.4.6. Test Procedures
All data will be downloaded daily and summary statistics and trend plots will be generated to check for unusual or changing conditions. Details of the daily review are given in Section 6. A dedicated computer located at Southern's Chapel Hill office will automatically receive data from the station computer each midnight and generate summary statistics and plots for review at the start of each work day. On weekends and holidays, the data will be accessed and reviewed remotely.
Alarms are set in the station monitoring and control software for the oxygen sensor (at 3X normal O2 level) and for the SAS suction manifold pressure (sensor P5). In addition, SAS automatic shutoff is triggered when the oxygen level reaches 2 percent.
The station uses a commercially available communications package called "ReachOut Enterprise" for remote data acquisition and related communications. This software has been tested at the station and is suitable for this test. Prior to starting this test, this same software will be installed on Southern's remote data acquisition computer and dial-up, security pass, and download will be verified.
A storage directory will be assigned on the station computer which will contain a delimited ASCII file containing fields for each of the parameters of interest. This file will contain a rolling 5 day data record for all sensors and station parameters. Each day, the file will be downloaded to the Southern project computer, a central database updated with new records, and summary statistics and plots prepared for review. This process will be automated so that the daily review can take place efficiently.
42

Table 7. ASCII data record contents, purpose, and significance. CONTINUOUS DATA TO BE COLLECTED FOR SAS EVALUATION PARAMETER PURPOSE* SIGNIFICANCE
Date D Documentation/comparison Time D Documentation/comparison Analog Input Point.P1.Value P SAS system parameter - pressure Analog Input Point.P2.Value P SAS system parameter - pressure Analog Input Point.P3.Value P SAS system parameter - pressure Analog Input Point.P4.Value P SAS system parameter - pressure Analog Input Point.P5.Value P SAS system parameter - pressure Spare N/A As/if needed Analog Input Point.Q1.Value P SAS system parameter - flow Analog Input Point.Q2.Value P SAS system parameter - flow Analog Input Point.Q3.Value P SAS system parameter - flow Analog Input Point.Q4.Value P SAS system parameter - flow Analog Input Point.Q5.Value P SAS system parameter - flow Analog Input Point.Q6.Value P SAS system parameter - flow Analog Input Point.Q7.Value P SAS system parameter - flow Analog Input Point.Q8.Value P SAS system parameter - flow
P Oxygen monitor-system operation & safety Float.RPM_ENGINE (ACTUAL) D Determines unit on/off status Float.HP_FUEL D/S Diagnostic Analog Input Point .COMPRESSOR_ROD_TEMP#1.V alue
D/S May indicate seal leak rate change
Analog Input Point .COMPRESSOR_ROD_TEMP#2.V alue
D/S May indicate seal leak rate change
Analog Input Point .COMPRESSOR_ROD_TEMP#3.V alue
D/S May indicate seal leak rate change
Analog Input Point
lue
D/S Motive pressure available for jets
Analog Input Point
alue
D/S Increases may explain an increased leak rate
Analog Input Point D/S Temperature of motive gas to jets
Analog Input Point .#1_COMP._CYL._TEMP.Value
D/S May indicate potential rod/seal degradation
Analog Input Point .#2_COMP._CYL._TEMP.Value
D/S May indicate potential rod/seal degradation
Analog Input Point #3_COMP._CYL._TEMP.Valve
D/S May indicate potential rod/seal degradation
Analog Input Point
alue
D/S May indicate potential rod/seal degradation
Analog Input Point.O.Value
.COMPRESSOR_SUCT_PRESS.Va
.COMPRESSOR_DISCH_PRESS.V
.SUCTION TEMPERATURE.Value
.DISCHARGE_TEMPERATURE.V
* D = Documentation/Diagnostic P = Primary Value – Data points routinely evaluated C = Unit Operating Parameter S = Secondary Value – Used as needed to assess apparent anomalies
43

Configuration testing will be conducted during SAS setup/shakedown. All sensor readings will be examined for reasonableness, stability, and appropriate responses to changes in SAS operating parameters as part of the adjustment process. Remote data transfer will also be tested.
5.4.7. QA/QC Procedures
Once the system is setup and is running properly, daily review of monitoring data will be used as an overall system check which includes the proper operation of the data acquisition system.
6.0 DATA REDUCTION, VALIDATION, AND REPORTING
6.1. DATA REDUCTION
This Section documents calculations that will be used to obtain final results from rawmeasurements.
The following quantities will be calculated:
Sensor engineering units (flow, pressure and oxygen concentration)
The digital records for each sensor are arbitrarily scaled from 0 to 100 with 12 bit resolution.Sensor readings (in engineering units) are obtained as follows:
For P1-P3 and P5, the range is minus 4 to 20 inches psig. The pressure value (psig) is obtained as follows:
Gauge Pressure (psig) = 24/100 * (Reading – 4)
For P4, the range is 0 to 20 psig. The pressure (in psig) is obtained as follows:
Gauge Pressure (in psi) = 20/100 * Reading
For Q2, Q4, Q6, and Q8 the range is 0 to 20 scfm (mass flow). The flow (in scfm) is obtained as follows:
Flow (scfm) = 20/100 * Reading
For Q1, Q3, Q5 and Q7, the high range is 0 to 50 scfm (mass flow). The flow is obtained as follows:
Flow (scfm) = 50/100 * Reading
Q1, Q3, and Q5 can also be operated in a low range (0 to 8 scfm) in order to obtain sufficient precision for small leak rates. In this case, the flow is obtained as follows:
Flow (scfm) = 8/100 * Reading
For O2, the range is 0 to 5 percent by volume. The concentration (in % oxygen by volume) is obtained as follows:
Oxygen Concentration = 5/100 * Reading
44

HVS leak rate
The HVCS leak rate is the product of the flow (cfm) and the concentration (percent by volume). The leak rate (cfm) is obtained by multiplying the flow velocity obtained by the vane anemometer (fpm) by the cross Section area of the anemometer duct (0.04125 square feet). To correct to standard conditions (1 atmosphere and 278 degrees Kelvin), the temperature and absolute pressure of the sampled gas must be measured. The correction factor is given by:
Gas Pressure (absolute - in atmospheres) / 1 Atm. * 278 deg. K / Gas Temperature (K)
The HVS is being independently calibrated. The calibration curve will be used to correct the final data.
Gas recovery
Total Gas Recovery is obtained in two ways: (1) as the sum of the recoveries for each ECG, and (2) from the total differential flow readings at Q7 and Q8. That is,
Total Gas Recovery = (1) (Q1 - Q2) + (Q3 - Q4) + (Q5 - Q6) (2) Q7 - Q8
The total gas recovery values from (1) and (2) should agree within the propogated error of the quantities.
Payback period
Formulae for calculating the payback period have been given elsewhere in this plan (see Section 2.3).
Unit Conversions
Engineering units in common use at the test site and within the host industry will be used for reporting and summarizing results. For pressure, the units are psi or inches water column. For flow, the units are cfm and scfm (1 atmosphere, 278 K). For gas velocity, the units are fpm. For concentration, percentage by volume or ppm are used.
6.2. DATA REVIEW AND VALIDATION
Calibrations and quality control checks for each measurement are described in Section 5 -Sampling and Analytical Procedures. Upon review, all data collected will be classed as either valid, suspect or invalid. In general, valid results are based on measurements meeting data quality objectives. All data are considered valid unless a specific performance limit is exceeded or operational check is failed.
45

It is often the case that anomalous data are identified in the process of data review. All outlying or unusual values will be investigated as fully as possible using test records and logs. Anomalous data may be considered suspect if no specific operational cause to invalidate the data are found. All data, valid, invalid, and suspect will be included in the final report. However, report conclusions will be based on valid data only. The reasons for excluding any data will be justified in the report. Suspect data must be included in the analyses, but may be given special treatment as specifically indicated.
Table 8. Summary calibration and operation checks.
Response to Check Expected or Failure or Out of
Measurement Cal/QC Check Allowable Result Control Condition High Volume Sampling Independent System Verification Overall system (Leak Rate) (Mike Hartman) calibration Apply calibration curve
Methane Analyzer Auto Zero Analyzer diagnostics (Each measurement) successful Return analyzer for repair. Methane Analyzer Span Check (2.5 percent, 60 days) +/- 0.1 percent Return analyzer for repair. Anemometer Check (pressure diff. Across 1" orifice), each measurement Per Figure 10 Return HVS for repair. Replicate measurements at +/- greater of 0.2 cfm or Troubleshoot sampling different flow. 6 percent technique, call SRI support
SAS System Flows "Normal" Operation Based on shakedown data System analysis Within propagated
Total vs. Summed Flows precision of meters System analysis Contact manufacturer,
Sensor Diagnostics Pass repair/replace sensor
SAS System Pressures "Normal" Operation Based on shakedown data System analysis
Contact manufacturer, Sensor Diagnostics Pass repair/replace sensor
Oxygen Sensor "Normal" Operation Based on shakedown data System analysis
Contact manufacturer, Sensor Diagnostics Pass repair/replace sensor
All sensor data will be reviewed on a daily basis. All anomalous or outlying values will be identified and immediately investigated to find a cause for the unusual condition. Table 9 lists summary statistics and plots that will be generated and reviewed on a daily basis.
46

Table 9. Summary statistics and charts for daily review.
Summary Statistics Daily gas recovery – average and standard deviation - for each rod, and summed and measured totals Gas recovery to date – cumulative gas recovery, average and standard deviation of cumulative data - for each rod, and summed and measured totals Daily pressures (P1 – P5) - average and standard deviation Daily oxygen – average and standard deviation
Time Series Charts Daily gas recovery Cumulative Gas recovery since start of test Daily pressures Pressures since start of test
6.3. DATA ANALYSIS AND REPORTING
After data reduction, review and validation, the primary phase 1 data analyses will include the following:
• Initial Leak Capture Performance
Leak capture performance is based on the HVS measurements conducted to measure the fugitive leak rate (if any) with the SAS installed and operating. If the SAS leak capture is 100 percent, then the HVS should measure zero fugitive emissions.
• Initial Gas Recovery and Use Performance
Gas recovery is based on the paired flow measurements for each ECG and for the system as a whole. Use performance is determined by how much of the recovered gas was able to be used in the engine fuel during actual system operations. SAS system and plant operational parameters will be evaluated to determine their effect on gas recovery.
• Initial Methane Emission Reduction
Nominally, the methane emission reduction is equal to the total gas use. In addition, it is possible that the ECG may act as a secondary seal and prevent some gas from leaking and being recovered by the system. The existence and magnitude of any secondary sealing will be determined from the periodic HVS measurements of the rod packing leak rate with the SAS disabled. The total emission reduction will be determined from the total gas recovery less gas recovered that may be vented due to operational problems and plus any secondary sealing effect.
47

• Installation and Shakedown Requirements
This is a broad assessment of effort and costs required to install the SAS and ensure that it is operating properly. Any problems encountered during installation and shakedown - and their resolutions will be described.
• Initial Capital and Installation Costs
This will be based on the actual installed cost for the system. For the test, a number of sensors are being installed that might not be installed in a normal situation. Once the system is operational, host site personnel will be interviewed to determine which sensors they would consider necessary in a pernmanent installation. The cost of these sensors only will be applied to the total installed cost.
• Data Quality Assessment
Values of each of the data quality indicators for each measurement will be determined and reported based on calibrations and QC checks as described in Section 5.
The following is a preliminary outline of the content of the phase 1 verification report.
The Phase II report will include key data from the Phase I report. The Phase II report will incorporate the results from the entire evaluation process, and will focus upon the evaluation parameters from Section 3 of the Phase I report.
7.0 AUDITS
An internal systems audit is planned for this test. The audit will be conducted by Southern’s independently managed QA staff. This will include field verification, procedural, and documentation components using this plan as the basis for the audit. An external audit may be performed at EPA's discretion by EPA QA staff or a qualified contractor. A performance audit on sensors used in the study is not considered necessary due to the ruggedness and reliability of the devices to be used. An internal audit of data quality will be conducted once data collection and analyses are complete. The final report will contain a summary of results from all audits.
8.0 CORRECTIVE ACTION
Table 8 in Section 6.2 lists allowable values for each of the calibrations and quality control checks and also indicates actions to be taken in response to an out of control condition. Other issues may arise that require corrective actions or plan changes to ensure that data quality objectives are met. Southern's quality management plan provides general procedures for corrective action that will be followed in all such instances.
48

Preliminary Outline A&A Environmental Seals’ Seal Assist System
Phase I Verification Report
Verification Statement Section 1 Executive Summary
ETV Overview Verification Objectives Technology Description Verification Approach Verification Results and Performance Evaluation
Initial Leak Capture Performance Initial Gas Recovery and Use Performance Initial Methane Emission Reduction Installation and Shakedown Requirements Initial Capital and Installation Costs
Data Quality Assessment
Section 2 Verification Test Design and Description Seal Assist System Description Site Selection, Description, and SAS Installation Verification Parameters and Their Determination
Initial Leak Capture Performance Initial Gas Recovery and Use Performance Initial Methane Emission Reduction Installation and Shakedown Requirements Initial Capital and Installation Costs
Sampling and Analytical Procedures High Volume Gas Sampling Flow Measurements Gas Composition Data Acquisition System
Quality Assurance and Quality Control Measures Calibration Procedures Quality Control Checks, Audits, and Corrective Actions Data Reduction Data Validation Data Analysis and Reporting
Section 3 Phase I Verification Results and Evaluation Initial Leak Capture Performance Initial Gas Recovery and Use Performance Initial Methane Emission Reduction Installation and Shakedown Requirements Initial Capital and Installation Costs Data Quality Assessment
Section 4 Additional Technical and Performance Data From A&A Seals, Inc.
References
49

9.0 PROJECT ORGANIZATION
This Section formally defines project organization and responsibilities.
Southern Research Institute's Greenhouse Gas Technology Verification Center has overall responsibility for planning and ensuring successful implementation of the verification test. A&A seals is providing the Seal Assist System technology, equipment, and engineering for the test installation. Southern is coordinating closely with A&A to integrate special sensing and data acquisition equipment that will be used in the test, but would not necessarily be part of a normal installation. Enron Crop. and their affiliate, Transwestern are providing access to the host site, and logistical and manpower assistance in the installation and operation of the SAS, and in conducting the test. Informally, good working relationships have been established between the Center, A&A, and Enron which have proved invaluable in the planning up to this stage. All parties have signed a formal agreement (documented in the Letter of Commitment and associated documents) specifying details of financial, technical, and managerial responsibilities.
EPA's APPCD is the sponsor of the ETV Greenhouse Gas Pilot and is providing broad oversight and QA support for the project. The project organization is presented in Figure 11.
In addition to the parties listed in the organizational chart, Southern has contracted with Faust & Bursom (Farmington, NM) to install the piping, conduit and sensor connections for the A&A seals system at Station 4. Faust & Bursom is an approved and certified Enron contractor.
Figure 11. Project organization.
50

10.0 TEST PROGRAM HEALTH AND SAFETY
This Section applies to Center personnel only. Other organizations involved in the project have their own health and safety plans - specific to their roles in the project.
Since the site is part of a pipeline facility, Enron Corporation's safety policies are regulated, in part by the US Department of Transportation. The Center provided a scope of work to the National Compliance Management Service Company, which is the managing company for Enron's compliance and safety program. Their assessment is that the Center's on-site job function is not covered by the Research and Special Programs Administration, DOT pipeline safety regulations covered by 49 CFR Parts 192, 193, and 195. If the scope of work changes, this determination would be re-evaluated.
Southern staff will comply with all Enron, state/local and Federal regulations relating to safety at Transwestern's compressor Station 4. This includes use of personal protective gear (flame resistant clothing, safety glasses, hearing protection, safety toe shoes) as required and completion of site safety orientation (site hazard awareness, alarms and signals, etc.).
Other than normal industrial hazards, the most significant hazard at Station 4 is the potential for explosive concentrations of natural gas. During HVS testing, there is the potential to produce hazardous gas concentrations. HVS operational procedures (see Section 5.1) explicitly address this issue.
11.0 REFERENCES
Southern Research Institute (SRI), Evaluation of the High Volume Collection System (HVCS) for Quantifying Fugitive Organic Vapor Leaks, US EPA, EPA/600/SR-95/167, 1995.
Lott, Robert A., Touche Howard, and Michael Webb. "New Technology for Measuring Leak Rates." American Gas Association Operating Proceedings, 1995.
Lott, Robert A. "A Profitable Approach to Dealing with Fugitive Methane Emissions." Presented at IGT's Environmental Management in the Natural Gas Industry. January 27, 1998. Orlando, Florida.
Taylor, John R., An Introduction to Error Analysis, second Edition. University Science Books, Sausalito, California, 1997.
51