Greenhouse Gas Mitigation through Energy Crops in the ...
24
CARD Working Papers CARD Reports and Working Papers 9-2001 Greenhouse Gas Mitigation through Energy Crops in the United States with Implications for Asian- Pacific Countries Uwe A. Schneider Iowa State University Bruce A. McCarl Texas A&M University Follow this and additional works at: hp://lib.dr.iastate.edu/card_workingpapers Part of the Agricultural and Resource Economics Commons , Agricultural Economics Commons , Environmental Health and Protection Commons , International Economics Commons , and the Oil, Gas, and Energy Commons is Article is brought to you for free and open access by the CARD Reports and Working Papers at Iowa State University Digital Repository. It has been accepted for inclusion in CARD Working Papers by an authorized administrator of Iowa State University Digital Repository. For more information, please contact [email protected]. Recommended Citation Schneider, Uwe A. and McCarl, Bruce A., "Greenhouse Gas Mitigation through Energy Crops in the United States with Implications for Asian-Pacific Countries" (2001). CARD Working Papers. 303. hp://lib.dr.iastate.edu/card_workingpapers/303
Transcript of Greenhouse Gas Mitigation through Energy Crops in the ...

CARD Working Papers CARD Reports and Working Papers
9-2001
Greenhouse Gas Mitigation through Energy Cropsin the United States with Implications for Asian-Pacific CountriesUwe A. SchneiderIowa State University
Bruce A. McCarlTexas A&M University
Follow this and additional works at: http://lib.dr.iastate.edu/card_workingpapers
Part of the Agricultural and Resource Economics Commons, Agricultural Economics Commons,Environmental Health and Protection Commons, International Economics Commons, and the Oil,Gas, and Energy Commons
This Article is brought to you for free and open access by the CARD Reports and Working Papers at Iowa State University Digital Repository. It hasbeen accepted for inclusion in CARD Working Papers by an authorized administrator of Iowa State University Digital Repository. For moreinformation, please contact [email protected].
Recommended CitationSchneider, Uwe A. and McCarl, Bruce A., "Greenhouse Gas Mitigation through Energy Crops in the United States with Implicationsfor Asian-Pacific Countries" (2001). CARD Working Papers. 303.http://lib.dr.iastate.edu/card_workingpapers/303

Greenhouse Gas Mitigation through Energy Crops in the United Stateswith Implications for Asian-Pacific Countries
DisciplinesAgricultural and Resource Economics | Agricultural Economics | Environmental Health and Protection |International Economics | Oil, Gas, and Energy
This article is available at Iowa State University Digital Repository: http://lib.dr.iastate.edu/card_workingpapers/303

Greenhouse Gas Mitigation through Energy Crops in the United States with Implications for Asian-Pacific Countries
Uwe A. Schneider and Bruce A. McCarl
Working Paper 01-WP 274 September 2001
Center for Agricultural and Rural Development Iowa State University
Ames, Iowa 50011-1070 www.card.iastate.edu
Uwe A. Schneider is a postdoctoral research associate at the Center for Agricultural and Rural Development, Iowa State University. Bruce A. McCarl is a professor in the Department of Agricultural Economics at Texas A&M University. Seniority of authorship is shared. This publication is available online on the CARD website: www.card.iastate.edu. Permission is granted to reproduce this information with appropriate attribution to the authors and the Center for Agricultural and Rural Development, Iowa State University, Ames, Iowa 50011-1070. For questions or comments about the contents of this paper, please contact Uwe A. Schneider, 575 Heady Hall, Iowa State University, Ames, IA 50011-1070; Phone: 515-294-6173; Fax: 515-294-6336; E-mail: [email protected]. Iowa State University does not discriminate on the basis of race, color, age, religion, national origin, sexual orientation, sex, marital status, disability, or status as a U.S. Vietnam Era Veteran. Any persons having inquiries concerning this may contact the Director of Affirmative Action, 318 Beardshear Hall, 515-294-7612.
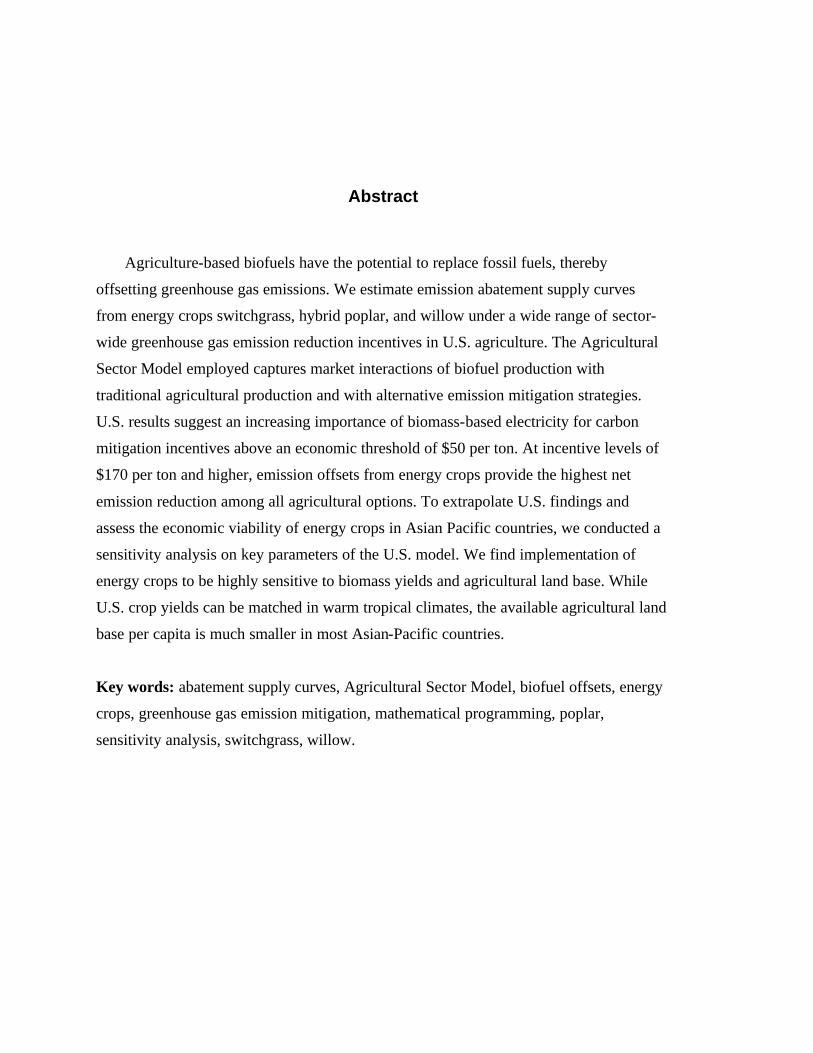
Abstract
Agriculture-based biofuels have the potential to replace fossil fuels, thereby
offsetting greenhouse gas emissions. We estimate emission abatement supply curves
from energy crops switchgrass, hybrid poplar, and willow under a wide range of sector-
wide greenhouse gas emission reduction incentives in U.S. agriculture. The Agricultural
Sector Model employed captures market interactions of biofuel production with
traditional agricultural production and with alternative emission mitigation strategies.
U.S. results suggest an increasing importance of biomass-based electricity for carbon
mitigation incentives above an economic threshold of $50 per ton. At incentive levels of
$170 per ton and higher, emission offsets from energy crops provide the highest net
emission reduction among all agricultural options. To extrapolate U.S. findings and
assess the economic viability of energy crops in Asian Pacific countries, we conducted a
sensitivity analysis on key parameters of the U.S. model. We find implementation of
energy crops to be highly sensitive to biomass yields and agricultural land base. While
U.S. crop yields can be matched in warm tropical climates, the available agricultural land
base per capita is much smaller in most Asian-Pacific countries.
Key words: abatement supply curves, Agricultural Sector Model, biofuel offsets, energy
crops, greenhouse gas emission mitigation, mathematical programming, poplar,
sensitivity analysis, switchgrass, willow.

GREENHOUSE GAS MITIGATION THROUGH ENERGY CROPS IN THE UNITED STATES WITH IMPLICATIONS
FOR ASIAN-PACIFIC COUNTRIES
Demand for agricultural participation in greenhouse gas (GHG) emission mitigation
efforts has increased in recent years. While the original text of the Kyoto Protocol only
considered carbon changes from deforestation, reforestation, and afforestation, subsequent
efforts were made to determine agriculture’s contribution in a broader spectrum (IPCC).
Discussion now focuses on how rather than whether to involve agriculture.
Planting energy crops is one of many agricultural options under consideration. Crops
such as switchgrass, short rotation woody trees, eucalyptus, and a variety of ethanol-
generating plants can generate alternative biomass based energy and thus reduce the
amount of fossil-fuel-based GHG-emission-intensive energy. While other agricultural
options such as switching tillage systems or planting permanent trees saturate over time,
GHG emission offsets from energy crops can be supplied continuously. Furthermore,
emission offsets from energy crops are generally easier to implement than other
agricultural emission abatement methods. For example, if a carbon market or a
government institution prices one ton of carbon emissions at $50, all fossil fuel input
going into energy crop production will most likely carry this price through increased
purchasing cost, and all energy output will receive revenue based on the amount of fossil
fuel energy offset. The net effect to the energy producer is the difference between
increased revenue and increased cost.
Substantial research has been conducted in the United States and Canada on energy
crops (Walsh et al.; Mann and Spath; Wang, Saricks, and Santini; Samson and Duxbury).
These studies, however, did not account for trade-offs between the production of energy
crops and other agricultural mitigation strategies. This analysis estimates the economic
feasibility of energy crops in the United States in an environment where all major
agricultural mitigation strategies are incorporated simultaneously.
2 / Schneider and McCarl
Greenhouse gas emissions constitute a global problem that is not limited to the
United States; it involves countries in the Asian-Pacific as well. In contrast to the United
States and Canada, however, research on energy crops has been very limited in many
Asian-Pacific countries. Here, the authors try to extrapolate results from the U.S. model
to these countries. To reflect Asian-Pacific characteristics, a sensitivity analysis is
conducted on key parameters of the U.S. model, which might differ between the United
States and Asian-Pacific countries.
Background
Energy crops have been explored in the United States since 1978, almost 20 years
before the Kyoto Protocol was established (U.S. DOE 2001). Major initial objectives
involved reducing the dependency on foreign petroleum reserves and providing clean
burning fuels. The potential to mitigate emissions of clean gases such as carbon dioxide
was not emphasized until the 1990s when countries started to seriously negotiate
greenhouse gas emission reduction programs.
Almost all energy crops produced in the United States today are still subsidized.
Ethanol suppliers receive, on average, a $0.54 per gallon subsidy, which is even greater
than the 1998-99 wholesale price of gasoline of $0.46 per gallon (Yacobucci and
Womach). Governmental incentives to promote biomass power include project co-
funding, various tax credits, deductions and exemptions, and direct subsidy payments
(Badin and Kirschner).
Greenhouse gas emission mitigation efforts could improve the economics of energy
crop production. If a market or governmental institution values carbon emission savings,
energy crops would yield additional revenues equal to the carbon price times net
emission savings relative to an energy equivalent amount of fossil fuel. The question then
becomes, What carbon price level is needed to make energy crops economically feasible?
In answering this question, one must analyze both energy crop possibilities and
traditional agricultural production (Schneider) for two reasons:
1. Large-scale production of energy crops reduces the amount of land devoted to
food production. As a consequence, aggregate food production is likely to fall,

Greenhouse Gas Mitigation through Energy Crops / 3
causing food prices to rise and land values to increase. This effect may cause a
negative feedback to energy crop production.
2. General mitigation incentives will promote a variety of agricultural strategies.
McCarl and Schneider (1999, 2000) grouped agricultural GHG mitigation op-
tions into three broad categories: (a) reductions in agricultural-based emissions,
for example, through diminished use of fossil fuels, fossil fuel intensive inputs,
or livestock herd size reductions; (b) enlargements of agricultural based sinks,
for example, through afforestation or tillage changes; and (c) increased produc-
tion of commodities such as energy crops, which offsets emissions in other
sectors of the economy.
Some agriculture mitigation strategies are mutually exclusive, some are complemen-
tary, and most interfere with traditional agricultural production. Hence, an independent
analysis of a large-scale production of energy crops would most likely overestimate the
economic potential.
U.S. Agricultural Sector Model
For this analysis we used a new version of the U.S. Agricultural Sector Model
(ASM) (McCarl et al.). The ASM was first developed in the mid-1970s and has been
used in many economic appraisals of environmental policies in the United States (see
Chang et al. for references). Schneider modifies the ASM to include GHG emission
accounting and mitigation possibilities. This new version is employed for this analysis
and will hereafter be referred to as ASMGHG.
Scope of ASMGHG
The ASMGHG depicts production in 63 U.S. agricultural subregions, endogenizing
crop choice, crop management, livestock numbers, and livestock management.
Commodity coverage is broad: more than 30 commodities are considered, including the
major U.S. feed and food grains, oilseeds, fiber, hay, silage, sweetener, cattle, sheep,
poultry, dairy, and hog commodities. Production of eight major internationally traded
commodities in 27 rest-of-the-world regions is included with detailed international
trade depiction for those commodities. Trade and consumption of more than 50 other
commodities are modeled at a more aggregate level. Production is gathered together

4 / Schneider and McCarl
into ten U.S. marketing regions and shipped on to processing, consumption, or
international markets.
The ASMGHG solutions provide projections of land use and commodity production
within the 63 U.S. areas, commodity production in the rest of the world, international
trade, crop and livestock commodity prices, processed commodity prices, agricultural
commodity consumption, producer income effects, consumer welfare effects, and various
environmental impacts.
Greenhouse Gas Features in ASMGHG
The ASMGHG jointly incorporates all major GHG emission mitigation options
available to agriculture for which reasonable data are available. For this study we
considered only feasible potential strategies. Other strategies may become profitable in
the near future as technology advances. However, we did not want to speculate as to
when this might happen. Engineers are often overly optimistic about new technologies,
not taking economics into account. Currently included strategies are listed below. For a
detailed technical description of how these strategies are implemented in ASMGHG,
see Schneider.
The ASMGHG mitigation strategies through the agricultural sector include
• afforestation;
• production of energy crops for use in electrical power plants;
• production of ethanol to replace fossil-fuel-based gasoline;
• soil carbon sequestration through tillage and crop choice and through conversion
of arable land into permanent grassland;
• reduction in crop management emissions through alternative crop mix, fertilizer,
irrigation, and tillage intensities;
• methane reductions through livestock herd size reduction, livestock, manure
system improvements, enteric fermentation changes, and rice acreage reduction;
and
• reduction in nitrous oxide emissions from livestock herd size reductions, and
alternative fertilization, crop, and tillage choices.

Greenhouse Gas Mitigation through Energy Crops / 5
Each individual emission and emission reduction category is individually accounted
for but also aggregated into a measure of total carbon equivalents. To place different
gases on an equal footing, methane and nitrous oxide are converted to carbon equivalents
based on the Intergovernmental Panel on Climate Change (IPCC) 100-year global
warming potentials (GWP): 21 for methane, 310 for nitrous oxide, and 44/12 for carbon.
The ASMGHG can examine the impact of various mitigation policies on the
agricultural sector. At each incentive level, it identifies the optimal choice of mitigation
strategy. In addition, impacts on the traditional agricultural sector are reported.
Economic Feasibility of Energy Crops in the United States
Competitive feasibility of major GHG emission mitigation strategies was simulated
by running the ASMGHG under a wide range of carbon equivalent prices imposed on net
emissions from agriculture. For emissions of non-carbon GHGs, prices were adjusted
based on the GWP of the affected GHG relative to carbon. In addition, carbon credits
from soil carbon sequestration and afforestation were value-discounted to reflect the
saturating nature of these carbon sinks. McCarl and Murray provide a detailed description
along with examination of many alternative setups. We chose an average setup leading to
a 25 percent value discount for sequestered tree carbon and a 50 percent value discount
for sequestered soil carbon (Schneider and McCarl). Thus, at a hypothetical carbon price
of $20 per ton of carbon equivalent (TCE), land owners would receive $20 for each ton
of offset carbon emissions, $10 for each ton of sequestered soil carbon, and $15 for each
ton of carbon sequestered through afforestation and they would pay each ton emitted with
$20 for carbon, $114.55 for methane, and $1,690.91 for nitrous oxide.
Major Impacts of Agricultural Greenhouse Gas Emission Mitigation Incentives
Figure 1 displays the resultant levels of emission abatement from agricultural
mitigation strategies (see also Table 1). Unsubsidized energy crops as identified by
current technologies are not competitive at zero carbon prices. Economic feasibility of
biofuel crops begins at carbon prices above $50 per ton of carbon equivalent. Energy
crops used as electrical power plant feedstock are more competitive than crops processed
into gasoline substitutes such as ethanol.

6 / Schneider and McCarl
0
50
100
150
200
250
300
0 20 40 60 80 100 120 140 160
Car
bon
Pric
e in
Dol
lars
per
TC
E
Emission Reduction in MMT of Carbon Equivalents
Animal CH4+N2OCrop CH4+N2O
AfforestationSoil Sequestration
Biomass Offsets
FIGURE 1. Role of major agricultural strategies to greenhouse gas mitigation at selected carbon equivalent prices
Under low carbon prices, agricultural management changes (e.g., tillage changes) are the
preferred option. Above carbon incentives of $170 per ton of carbon equivalent, emission
offsets from bioelectricity-generating crops dominate all agricultural mitigation
strategies. At such high carbon prices the model favors mitigation options with the
highest carbon saving potential per acre, outweighing higher operation and
implementation costs of these strategies.
The results (Table 1) also show that large-scale bioelectricity production diverts
farmland, reduces food supply, increases pressure to manage traditional agricultural
products more intensively, increases food prices, and changes agricultural welfare
distribution, with producers likely to gain and consumers likely to loose.
Economic versus Technical Potential
An important concept when regarding biofuel production involves the potential to
mitigate GHG emissions. Physical scientists often quote very large estimates of potential,
but these estimates typically neglect the cost of achieving that potential. We used ASMGHG
under three settings to derive alternative measures of potential. The first represents technical

Greenhouse Gas Mitigation through Energy Crops / 7
TABLE 1. Mitigation summary from the U.S. agricultural sector Category Unit 10 20 50 100 200 500
Major Ag-Mitigation Strategy Soil carbon
sequestration MMTCE 30,413 45,391 63,529 57,881 50,932 47,298
Afforestation MMTCE 4,028 13,445 20,619 61,939 128,046 133,380 Bioelectricity MMTCE 0 0 0 62,008 141,198 193,208 Subsidized corn- ethanol
MMTCE 2,893 2,893 2,893 2,893 2,893 2,893
Fossil fuel ag-inputs MMTCE 1,540 2,941 5,771 7,118 9,315 11,567 Livestock technologies MMTCE 184 908 1,622 5,547 8,570 14,304 Crop non-carbon GHG MMTCE 1,314 1,461 1,750 2,721 4,426 5,782
Agricultural Production Irrigation Percentage 18.95 17.89 16.57 19.84 22.03 26.55 Acreage Mill Acres 333.4 332.2 329.3 298.4 248.4 215.7 Reduced tillage Percentage 62.22 73.56 82.10 83.86 85.62 84.11 Nitrogen fertilizer 1,000 Tons 9,662 9,604 9,462 8,869 7,722 6,948 Farmers’ welfare Billion $ 0.42 0.93 2.59 9.62 18.47 60.70
Agricultural Market Effects Production Fisher Index 99.80 99.33 97.91 91.08 77.85 67.47 Prices Fisher Index 100.50 101.08 103.93 118.67 153.03 254.64 Ag-sector welfare Billion $ -0.10 -0.32 -0.83 -5.72 -21.20 -40.62 Net exports Fisher Index 99.33 97.85 94.12 73.52 35.51 23.41
Net Emission Reduction Carbon dioxide MMTCO2 132 227 330 684 1188 1385 Methane MMTCH4 0.04 0.14 0.25 1.22 2.22 3.32 Nitrous oxide MMTN2O 0.02 0.02 0.02 0.04 0.07 0.1 Total carbon
equivalents MMTCE 37.5 64.2 93.3 197.2 342.5 405.5
Non-GHG Externalities from Crop Production (Excluding Trees andPerennial Energy Crops)
Nitrogen % Change -0.9 -1.1 -0.7 -5.4 -26.6 -40.3 Phosphorous % Change -22.9 -36.1 -48.9 -52.2 -61.9 -66.2 Erosion % Change -13.2 -26.0 -40.0 -46.6 -58.4 -65.5
8 / Schneider and McCarl
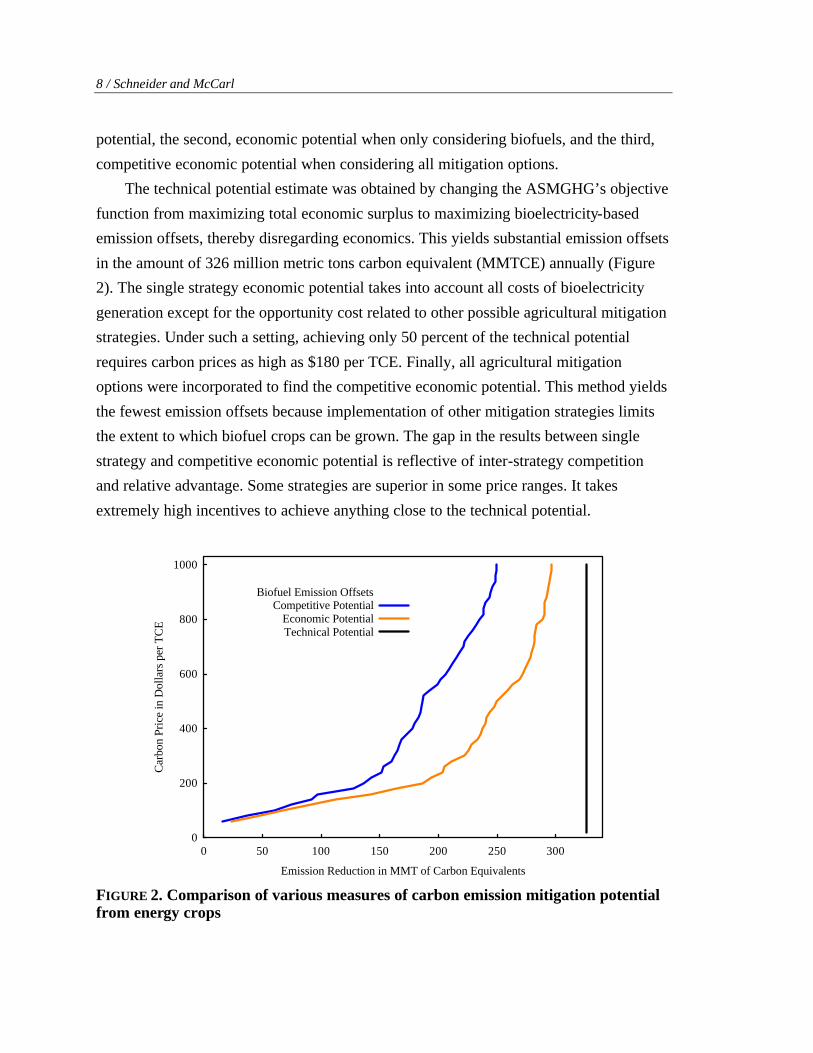
potential, the second, economic potential when only considering biofuels, and the third,
competitive economic potential when considering all mitigation options.
The technical potential estimate was obtained by changing the ASMGHG’s objective
function from maximizing total economic surplus to maximizing bioelectricity-based
emission offsets, thereby disregarding economics. This yields substantial emission offsets
in the amount of 326 million metric tons carbon equivalent (MMTCE) annually (Figure
2). The single strategy economic potential takes into account all costs of bioelectricity
generation except for the opportunity cost related to other possible agricultural mitigation
strategies. Under such a setting, achieving only 50 percent of the technical potential
requires carbon prices as high as $180 per TCE. Finally, all agricultural mitigation
options were incorporated to find the competitive economic potential. This method yields
the fewest emission offsets because implementation of other mitigation strategies limits
the extent to which biofuel crops can be grown. The gap in the results between single
strategy and competitive economic potential is reflective of inter-strategy competition
and relative advantage. Some strategies are superior in some price ranges. It takes
extremely high incentives to achieve anything close to the technical potential.
0
200
400
600
800
1000
0 50 100 150 200 250 300
Car
bon
Pric
e in
Dol
lars
per
TC
E
Emission Reduction in MMT of Carbon Equivalents
Biofuel Emission OffsetsCompetitive Potential
Economic PotentialTechnical Potential
FIGURE 2. Comparison of various measures of carbon emission mitigation potential from energy crops

Greenhouse Gas Mitigation through Energy Crops / 9
Sensitivity Analysis on Key Parameters of the U.S. Model
Agriculture in the United States is certainly very different from agriculture in Asian-
Pacific countries. Differences exist with respect to soil, climate, culture-based
preferences, per capita land availability, technology, and international market competition
(FAO). To illustrate these differences, we conducted a sensitivity analysis on a few
decisive model parameters of the U.S. agricultural sector model.
Biomass Yield
The competitiveness of energy crops depends on many technological parameters. We
chose to examine alternative energy crop yields ranging from 50 to 200 percent of current
U.S. yield estimates. Asian-Pacific biomass producers in moist tropical regions may
benefit from generally higher plant productivity compared to the United States but could
also experience lower productivity due to production conditions and altered input mixes.
Duke, for example, reports U.S. comparable or higher biomass yields in Asian-Pacific
countries for eucalyptus and panicum (Table 2).
TABLE 2. Energy crop yield comparison between the United States and Asian-Pacific countries
Species Country Yield Indicator
MT/ha/yr Reference Australia 12-13 (ADM) Duke
India 33 (ADM) Duke Eucalyptus
USA 10–32.5 (ADM) Harwood
Leucaena leucocephala (Giant Ipil-Ipil)
Philippines 16-24 (NPP) Durst
Hybrid Poplar USA 3.5-5.25 (ADM) Walsh et al.
Willow USA 3.15-5.77 (ADM) Walsh et al.
Sri Lanka 4-7 (NPP) Taiwan 14-24 (NPP)
Thailand 20 (NPP)
Panicum maximum (Guineagrass/ Hamilgrass) India 1-40 (NPP)
Duke
Panicum virgatum (Switchgrass)
USA 3-7 (ADM) 9 (NPP)
Walsh et al. Duke
Notes: ADM = Average Dry Mass, NPP = Net Primary Productivity.

10 / Schneider and McCarl
Results show a strong impact of energy crop yields on supply of emission offsets
(Figure 3). In most cases, increased yield leads to more than proportional increases in
biomass emission offsets. For example, at a carbon price of $100 per TCE, energy crops
offset about 58 MMTCE per year. A 50 percent yield increase leads to a 269 percent
increase in emission offsets. In interpreting Figure 3, one should keep in mind that all
yield increases were implemented without changing crop input parameters. If higher
yields were based on higher input use, the effects would be less significant.
The results from yield scenarios are not limited to crop yield differences. They can
be applied to all technological improvements, from farming to generation of bio-energy,
that increase the emission-input/energy-output ratio.
Energy Price
There are two sources of revenues for producers of energy crops: (a) revenue from
selling energy and (b) potential revenue from carbon emission offsets associated with
0
50
100
150
200
250
300
0 100 200 300 400 500
Car
bon
Pric
e in
Dol
lars
per
TC
E
Emission Reduction in MMT of Carbon Equivalents
Biomass Yield AssumptionU.S. Biomass Yields * 1/2U.S. Biomass Yields * 2/3
U.S. Biomass YieldsU.S. Biomass Yields * 3/2
U.S. Biomass Yields * 2
FIGURE 3. Changes in amount of emission offsets generated by energy crops when energy crop yields are altered

Greenhouse Gas Mitigation through Energy Crops / 11
emissions-market-based income source. If the country is a major energy importer, then its
electricity price is determined by the international energy market price.
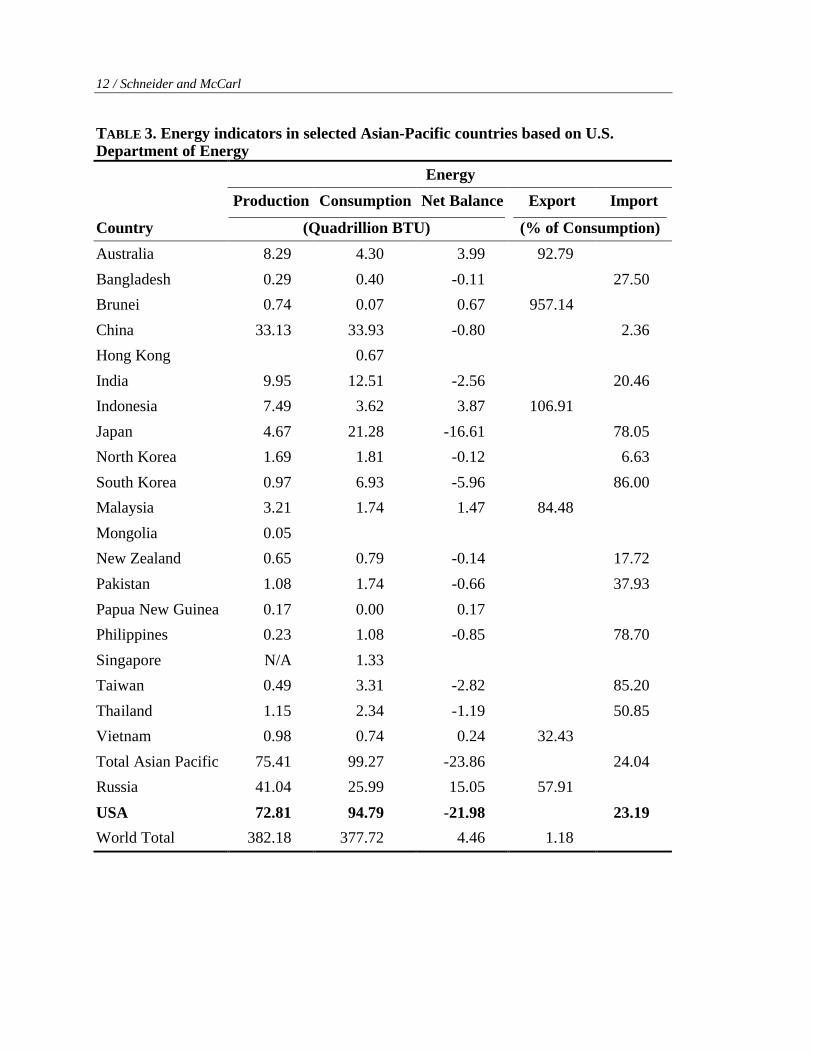
Many Asian-Pacific countries, for example, Japan, South Korea, the Philippines,
Taiwan, and Thailand, import substantial amounts of energy (Table 3). Because currency
values differ between countries, the international market price may cause different
incentives to grow biomass. For example, agricultural producers in energy-importing
countries with a relatively low domestic currency value would earn a higher relative
revenue from selling electricity than would U.S. biomass producers. Similarly, revenues
would be low if conventional energy is cheap (energy-exporting countries or countries
with high currency value). In this study we examine alternative prices for conventional
electricity ranging from 50 to 200 percent of the current U.S. market price.
The effect of energy price changes on the amount of bioelectricity emission offsets is
depicted in Figure 4. Note that a 100 percent energy price increase results in much less
additional emission offsets than does a 100 percent yield increase. This occurs because
selling electricity is only one profit source besides revenues from supplying carbon
offsets. If, for example, selling electricity contributes 25 percent to total profits, then a 20
percent energy price increase results only in a 5 percent total profit gain.1 As the carbon
price increases, the electricity revenue becomes relatively less important, and energy
price changes have less effect on the amount of emission offsets supplied. For example, a
doubling of the energy price increases carbon offsets by 88 percent at $100 per TCE but
only by 43 percent at $200 per TCE (Figure 4).
The results on energy price sensitivity are useful beyond extrapolation of U.S. results
to foreign countries. They indicate how the energy crop’s competitiveness changes as
fossil fuel prices fluctuate in general. If the recent trend of increased fossil fuel prices
continues, energy crop farming may soon be on the rise in the United States.
Furthermore, the results also indicate how higher or lower costs of energy crop strategies
would affect their competitiveness because higher energy prices are equivalent to lower
production and processing costs.
Demand Elasticities
Energy crop production on agricultural land takes away land from traditional
agricultural operations. As a consequence, traditional agricultural production, that is, food
12 / Schneider and McCarl
TABLE 3. Energy indicators in selected Asian-Pacific countries based on U.S. Department of Energy
Energy
Production Consumption Net Balance Export Import
Country (Quadrillion BTU) (% of Consumption)
Australia 8.29 4.30 3.99 92.79
Bangladesh 0.29 0.40 -0.11 27.50
Brunei 0.74 0.07 0.67 957.14
China 33.13 33.93 -0.80 2.36
Hong Kong 0.67
India 9.95 12.51 -2.56 20.46
Indonesia 7.49 3.62 3.87 106.91
Japan 4.67 21.28 -16.61 78.05
North Korea 1.69 1.81 -0.12 6.63
South Korea 0.97 6.93 -5.96 86.00
Malaysia 3.21 1.74 1.47 84.48
Mongolia 0.05
New Zealand 0.65 0.79 -0.14 17.72
Pakistan 1.08 1.74 -0.66 37.93
Papua New Guinea 0.17 0.00 0.17
Philippines 0.23 1.08 -0.85 78.70
Singapore N/A 1.33
Taiwan 0.49 3.31 -2.82 85.20
Thailand 1.15 2.34 -1.19 50.85
Vietnam 0.98 0.74 0.24 32.43
Total Asian Pacific 75.41 99.27 -23.86 24.04
Russia 41.04 25.99 15.05 57.91
USA 72.81 94.79 -21.98 23.19
World Total 382.18 377.72 4.46 1.18

Greenhouse Gas Mitigation through Energy Crops / 13
0
50
100
150
200
250
300
0 50 100 150 200
Car
bon
Pric
e in
Dol
lars
per
TC
E
Emission Reduction in MMT of Carbon Equivalents
Energy Price AssumptionU.S. Energy Price * 1/2
U.S. Energy PriceU.S. Energy Price * 2
FIGURE 4. Changes in amount of emission offsets generated by energy crops when electricity prices are altered production, will decrease, raising prices. The extent to which prices increase may depend
on the elasticity of demand. ASMGHG explicitly defines demand curves for 48 primary
agricultural products and more than 50 processed products. Demand curves are specified
as constant elasticity functions. To assess the effect of higher or lower elasticities, we
changed demand elasticities across all primary agricultural products to (a) 50 percent and
(b) 200 percent of the original value.
Modifications of demand elasticity assumptions did not significantly affect the
amount of emission offsets supplied from energy crops. Figure 5 shows that different
domestic demand elasticities have almost no effect on supply of bioelectricity. Similar
results were obtained when altering export and import elasticities for traded agricultural
commodities. Note that elasticities were equally modified across all commodities. In
reality, elasticities in foreign countries may be higher or lower depending on the
commodity in question.
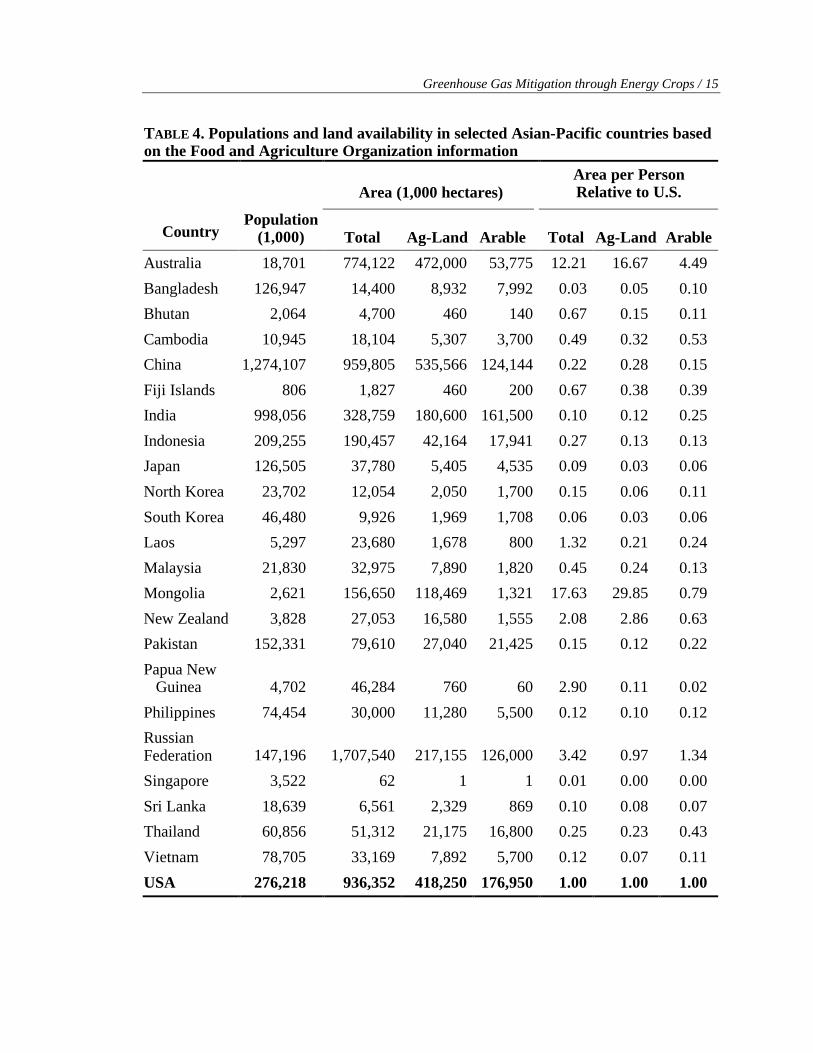
Land Availability
The United States has a large agricultural land base relative to its population (Table 4).
Therefore, taking food cropland away for the production of energy crops may be cheaper in
the United States but more expensive in densely populated countries, which heavily depend

14 / Schneider and McCarl
0
50
100
150
200
250
300
0 20 40 60 80 100 120 140 160
Car
bon
Pric
e in
Dol
lars
per
TC
E
Emission Reduction in MMT of Carbon Equivalents
Demand Elasticity AssumptionU.S. Elasticities * 1/2
U.S. ElasticitiesU.S. Elasticities * 2
FIGURE 5. Changes in amount of emission offsets generated by energy crops when domestic agricultural demand elasticities are altered
on domestic food production. To illustrate such differences we modified the available
agricultural land base in the United States to between 50 to 200 percent of its original value.
Figure 6 shows the supply of bioelectricity emission offsets for different assump-
tions about the amount of available agricultural land. Not surprisingly, we find energy
crops to be very sensitive to land availability. If the U.S. agricultural land base were cut
in half, energy crops would not become profitable below carbon prices of $260 per
TCE (Figure 6). These results indicate the importance of opportunity costs of farmland
for the economic feasibility of energy crops. Less land implies less production, higher
commodity prices, and thus higher revenues in the traditional agricultural sector.
Consequently, farmers have to give up more by growing energy crops. Limited
availability of agricultural land may be a major obstacle to growing energy crops in the
Asian-Pacific area.
Greenhouse Gas Mitigation through Energy Crops / 15
TABLE 4. Populations and land availability in selected Asian-Pacific countries based on the Food and Agriculture Organization information
Area (1,000 hectares) Area per Person Relative to U.S.
Country Population
(1,000)
Total
Ag-Land
Arable
Total
Ag-Land
Arable
Australia 18,701 774,122 472,000 53,775 12.21 16.67 4.49
Bangladesh 126,947 14,400 8,932 7,992 0.03 0.05 0.10
Bhutan 2,064 4,700 460 140 0.67 0.15 0.11
Cambodia 10,945 18,104 5,307 3,700 0.49 0.32 0.53
China 1,274,107 959,805 535,566 124,144 0.22 0.28 0.15
Fiji Islands 806 1,827 460 200 0.67 0.38 0.39
India 998,056 328,759 180,600 161,500 0.10 0.12 0.25
Indonesia 209,255 190,457 42,164 17,941 0.27 0.13 0.13
Japan 126,505 37,780 5,405 4,535 0.09 0.03 0.06
North Korea 23,702 12,054 2,050 1,700 0.15 0.06 0.11
South Korea 46,480 9,926 1,969 1,708 0.06 0.03 0.06
Laos 5,297 23,680 1,678 800 1.32 0.21 0.24
Malaysia 21,830 32,975 7,890 1,820 0.45 0.24 0.13
Mongolia 2,621 156,650 118,469 1,321 17.63 29.85 0.79
New Zealand 3,828 27,053 16,580 1,555 2.08 2.86 0.63
Pakistan 152,331 79,610 27,040 21,425 0.15 0.12 0.22
Papua New Guinea 4,702 46,284 760 60 2.90 0.11 0.02
Philippines 74,454 30,000 11,280 5,500 0.12 0.10 0.12
Russian Federation 147,196 1,707,540 217,155 126,000 3.42 0.97 1.34
Singapore 3,522 62 1 1 0.01 0.00 0.00
Sri Lanka 18,639 6,561 2,329 869 0.10 0.08 0.07
Thailand 60,856 51,312 21,175 16,800 0.25 0.23 0.43
Vietnam 78,705 33,169 7,892 5,700 0.12 0.07 0.11
USA 276,218 936,352 418,250 176,950 1.00 1.00 1.00

16 / Schneider and McCarl
0
50
100
150
200
250
300
0 50 100 150 200 250 300 350 400 450
Car
bon
Pric
e in
Dol
lars
per
TC
E
Emission Reduction in MMT of Carbon Equivalents
Land Availability AssumptionU.S. Land Supply * 1/2U.S. Land Supply * 2/3
U.S. Land SupplyU.S. Land Supply * 3/2
U.S. Land Supply * 2
FIGURE 6. Changes in amount of emission offsets generated by energy crops when land availability is altered
Conclusions
Energy crops supply fossil fuel alternatives and therefore have the potential to reduce
greenhouse gas emissions. Economic feasibility implies that the energy output has to be
greater than the energy input; otherwise—in the absence of subsidies—growers could not
yield a profit. The attractiveness of energy crops relative to fossil fuels depends on the net
emission balance and the value of carbon offsets. In addition, growing energy crops must
be economically superior to other possible land use strategies.
Assessments of energy crops in the U.S. agricultural sector show that biomass-based
electricity (based on switchgrass or short rotation woody crops), while expensive, has
considerable potential to offset carbon emissions. Emission offsets range between 1 and 2
metric tons per acre per year. However, a financial support of at least $60 per ton of
carbon equivalent (about $30 per dry ton) is needed to make them economically feasible.
Paying less than $60 per ton of carbon offset induces other agricultural mitigation options,
for example, changes in tillage, fertilization, and irrigation. Ethanol-generating energy
crops turned out to be an inferior strategy over the whole range of carbon prices.

Greenhouse Gas Mitigation through Energy Crops / 17
We also tried to generalize U.S. results through a sensitivity analysis on key
parameters and to infer for Asian-Pacific countries. Results indicate that implementa-
tion of energy crops in the United States is highly sensitive to yields, land availability,
and the price of energy but relatively insensitive to demand elasticities of traditional
agricultural commodities. With the exception of Australia and Russia, most of the
Asian-Pacific countries have far less arable land per capita than has the United States
(FAO). Allocation of currently cultivated land to energy crops in those countries would
imply less land available to produce food. Shortages in domestic food supply, however,
could only be offset through increased food imports. Thus, energy crops in most Asian-
Pacific countries may not be economically feasible unless food imports are cheaper
than energy imports.

Endnote
1. Suppose p = e + c, where p represents total profit, e represents energy revenue, and c represents
carbon offset revenue and that the ratio of carbon revenue to energy revenue is known, i.e., c/e = r.
Substitution yields the following identity: p = e + er = (1 + r)e. If the energy revenue is increased by a
factor f, the new profit (np) can be calculated as np = te + c = te + er = (t + r)e. Thus, np/p = (t + r)/(1
+ r). Setting r = 3, a 20 percent energy revenue increase (t = 2) implies a total profit increase of 5
percent.

References
Badin, J., and J. Kirschner. 1998. “Biomass Greens U.S. Power Production.” Renewable Energy World 1(3) November: 40-45.
Chang, C.C., B.A. McCarl, J.W. Mjelde, and J.W. Richardson. 1992. “Sectoral Implications of Farm Program Modifications.” American Journal of Agricultural Economics 74(1): 38-49.
Duke, J.A. 1983. “Handbook of Energy Crops.” Unpublished [Online]. http://www.hort.purdue.edu/newcrop/duke_energy/dukeindex.html (January 2001).
Food and Agriculture Organization of the United Nations (FAO). FAOSTAT Statistics Database [Online]. http://apps.fao.org (January 2001).
Intergovernmental Panel on Climate Change (IPCC). 2000. Land Use, Land-Use Change, and Forestry. Special Report of the Intergovernmental Panel on Climate Change, Geneva Switzerland. Edited by R.T. Watson, I.R. Noble, B. Bolin, N.H. Ravindranath, D.J. Verardo, and D.J. Dokken. Cambridge: Cambridge University Press, p. 375.
Mann, M.K., and P.L. Spath. 1997. Life Cycle Assessment of a Biomass Gasification Combined-Cycle Power System. National Renewable Energy Laboratory, Golden, CO, TP-430-23076.
McCarl, B.A., and B.C. Murray. 2001. “Harvesting the Greenhouse: Comparing Biological Sequestration with Emissions Offsets.” Department of Agricultural Economics, Texas A&M University [Online]. http://ageco.tamu.edu/faculty/mccarl/papers/885.pdf.
McCarl, B.A., and U.A.Schneider. 1999. “Curbing Greenhouse Gases: Agriculture’s Role.” Choices, First Quarter, pp. 9-12.
———. 2000. “U.S. Agriculture’s Role in a Greenhouse Gas Mitigation World: An Economic Perspective.” Review of Agricultural Economics 22(1): 134-59.
McCarl, B.A., C.C. Chang, J.D. Atwood, and W.I. Nayda. 2001. “Documentation of ASM: The U.S. Agricultural Sector Model.” Unpublished Report, Texas A&M University [Online]. http://ageco.tamu.edu/faculty/mccarl/asm.htm.
Samson, R., and P. Duxbury. 2000. “Assessment of Pelletized Biofuels.” Research report, Resource Efficient Agricultural Production-Canada (REAP), Quebec [Online]. http://www.reap.ca/Reports/pelletaug2000.html (April 2000).
Schneider, U.A. 2000. Agricultural Sector Analysis on Greenhouse Gas Emission Mitigation in the U.S. PhD dissertation, Department of Agricultural Economics, Texas A&M University, December.
Schneider, U.A., and B.A. McCarl. 2001. “Economic Potential of Biomass Based Fuels for Greenhouse Gas Emission Mitigation.” Special Issue of Environmental and Resource Economics, in press.

20 / Schneider and McCarl
United Nations, Framework Convention on Climate Change. Kyoto Protocol. Climate Change Secretariat (UNFCCC), New York. [Online]. http://www.unfccc.de/resource/convkp.html (March 1998).
U.S. Department of Energy, Energy Information Administration (U.S. DOE). 2000. Annual Energy Review 1999, Washington, D.C. [Online]. http://www.eia.doe.gov/emeu/aer/ (January 2001).
U.S. Department of Energy, Energy Information Administration, Office of Coal, Nuclear, Electric and Alternate Fuels (U.S. DOE). 2001. “Renewable Energy 2000: Issues and Trends.” Washington, D.C. [Online]. http://www.eia.doe.gov/cneaf/solar.renewables/rea_issues/ (January 2001).
Walsh, M.E., D. de la Torre Ugarte, S. Slinsky, R.L. Graham, H. Shapouri, and D. Ray. 1998. “Economic Analysis of Energy Crop Production in the U.S.—Location, Quantities, Price and Impacts on the Traditional Agricultural Crops.” In proceedings of Bioenergy ’98, Expanding Bioenergy Partnerships, October 4-8, Madison, WI. Great Lakes Regional Biomass Energy Program, Chicago, IL.
Wang, W., C. Saricks, and D. Santini. 1999. Effects of Fuel Ethanol Use on Fuel-Cycle Energy and Greenhouse Gas Emissions. Center for Transportation Research, Argonne National Laboratory, ANL/ESD-38, Argonne, IL, January.
Yacobucci, B.D., and J. Womach. 2000. “RL30369: Fuel Ethanol: Background and Public Policy Issues.” The National Council for Science and the Environment, Washington, D.C. [Online]. http://www.cnie.org/nle/eng-59.html (March 2000).