GREENHOUSE GAS EMISSIONS PER UNIT OF VALUE...
36
Version 29 March 2012 Accepted for publication in Energy Policy Special issue on Frontiers of Sustainability in 2012 GREENHOUSE GAS EMISSIONS PER UNIT OF VALUE ADDED (“GEVA”) - A CORPORATE GUIDE TO VOLUNTARY CLIMATE ACTION Jorgen Randers Norwegian Business School BI 0442 Oslo Norway [email protected] Abstract How much must I reduce my greenhouse gas (GHG) emissions if I want to do my fair share to contribute towards the global effort to keep global warming below a 2°C rise in average temperature over preindustrial times? This paper suggests an answer for nations and corporations that want to move ahead of legislation on a voluntary basis. If all nations reduce their “GHG emissions per unit of GDP” by 5% per year, global GHG emissions will be 50% lower in 2050 than in 2010 as long as the global economy continues to grow at its historical rate of 3.5% per year. The suggested 5% per year decline can be translated into a corporate resolution to reduce corporate “GHG emissions per unit of value added” (GEVA) by 5% per year. If all corporations cut their GEVA by 5% per year, the same global result will be achieved. The suggested 5% per year decline can be used as a guideline for responsible action on a voluntary basis. The guideline is unlikely to be made mandatory soon, but compulsory publication of the necessary emissions and productivity data by nations and corporations could help civil society highlight top performers. Keywords Corporate climate policy, intensity indicators, fair share 1
Transcript of GREENHOUSE GAS EMISSIONS PER UNIT OF VALUE...

Version 29 March 2012 Accepted for publication in Energy Policy
Special issue on Frontiers of Sustainability in 2012
GREENHOUSE GAS EMISSIONS PER UNIT OF VALUE ADDED (“GEVA”) - A CORPORATE GUIDE TO VOLUNTARY CLIMATE ACTION Jorgen Randers Norwegian Business School BI 0442 Oslo Norway [email protected] Abstract How much must I reduce my greenhouse gas (GHG) emissions if I want to do my fair share to contribute towards the global effort to keep global warming below a 2°C rise in average temperature over preindustrial times? This paper suggests an answer for nations and corporations that want to move ahead of legislation on a voluntary basis. If all nations reduce their “GHG emissions per unit of GDP” by 5% per year, global GHG emissions will be 50% lower in 2050 than in 2010 as long as the global economy continues to grow at its historical rate of 3.5% per year. The suggested 5% per year decline can be translated into a corporate resolution to reduce corporate “GHG emissions per unit of value added” (GEVA) by 5% per year. If all corporations cut their GEVA by 5% per year, the same global result will be achieved. The suggested 5% per year decline can be used as a guideline for responsible action on a voluntary basis. The guideline is unlikely to be made mandatory soon, but compulsory publication of the necessary emissions and productivity data by nations and corporations could help civil society highlight top performers. Keywords Corporate climate policy, intensity indicators, fair share
1

GREENHOUSE GAS EMISSIONS PER UNIT OF VALUE ADDED (“GEVA”) - A CORPORATE GUIDE TO VOLUNTARY CLIMATE ACTION Jorgen Randers Norwegian Business School BI 0442 Oslo Norway THE RESEARCH QUESTION
Fair share in voluntary climate action
This paper suggests an answer to the question: How much must I reduce my
greenhouse gas (GHG) emissions if I am to do my fair share to contribute towards the
global effort to keep global warming below a 2°C rise in average temperature over
preindustrial times. The answer is provided both for nations and for corporations that
want to move ahead of international agreements and national legislation on a voluntary
basis.
The first part of the paper presents the logic behind the suggested answer, which is to
cut “GHG emissions per unit of GDP” at the national level and “GHG emissions per
unit of value added” at the corporate level, both by 5 % per year. The second part of the
paper discusses the concepts involved and provides some illustrative data for national
and corporate performance. The third and final part of the paper discusses issues related
to practical use of the two indicators.
Global goals for climate stabilization and poverty alleviation
The world has been debating the challenge of sustainable development since the term
was coined by the Brundtland Commission in 1987. The exact content of the challenge
2
has remained unclear, but there is emerging international consensus that the global
endeavour for a more sustainable world includes two main ambitions: the desire to
alleviate world poverty; and the desire to avoid dangerous climate change. The world
increasingly agrees on its main tool in the endeavour to fight poverty—namely
continued economic growth. Similarly, the chosen tool in the effort to avoid dangerous
climate change is general reduction in global emissions of GHG.
The world has furthermore agreed on quantitative goals for this dual effort. These tools
are summarized in the United Nations (UN) Millennium Development Goals, which
seeks poverty alleviation (UN, 2012a), and the UN Framework Convention for Climate
Change, which seeks to keep man-made global warming below a danger threshold.
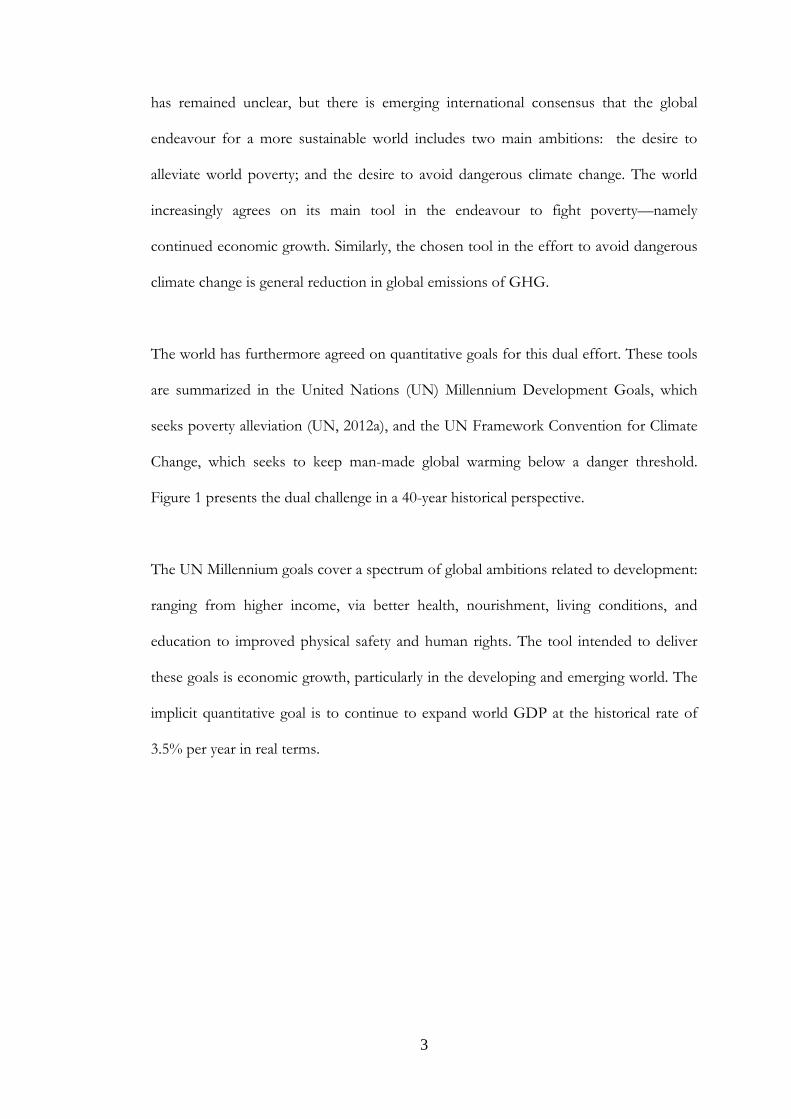
Figure 1 presents the dual challenge in a 40-year historical perspective.
The UN Millennium goals cover a spectrum of global ambitions related to development:
ranging from higher income, via better health, nourishment, living conditions, and
education to improved physical safety and human rights. The tool intended to deliver
these goals is economic growth, particularly in the developing and emerging world. The
implicit quantitative goal is to continue to expand world GDP at the historical rate of
3.5% per year in real terms.
3

0,00
0,50
1,00
1,50
2,00
2,50
3,00
3,50
4,00
4,50
1970 1975 1980 1985 1990 1995 2000 2005 2010
GDP
CO2
CO2/GDP
Figure 1: Gross domestic product (GDP), emissions of CO2, and the ratio CO2 emissions per unit GDP (Index values, 1970 = 1), World 1970 - 2010a a Based on data from Penn World Tables and BP Statistical Review of World Energy
On the climate side, the Kyoto Protocol in 1997 represented the first step on the way
toward reduced GHG emissions. The Kyoto Protocol outlined common, yet
differentiated responsibilities for the world’s nations to cut GHG emissions by 5% from
1990 to 2008-12. Later, in 2009, the danger threshold was agreed to be 2°C above
average global temperatures in preindustrial times. The UN Intergovernmental Panel on
Climate Change has also concluded that keeping below plus 2°C will require a reduction
in global GHG emissions of 50-80 % by 2050. I choose the lower number in this range,
accepting that this increases the risk of not staying below plus 2°C. As a rough
summary, the world ambition is to cut GHG emissions by 50 % by 2050, while
maintaining economic growth at historical rates of 3.5 % per year.
Global tools for climate stabilization and poverty alleviation
Economic growth is pursued in various ways, based on theoretical considerations and
experience from the last century of active effort to increase global growth rates. The
4

establishment of a stable institutional framework has played an important role, as has
liberalisation and trade. One major recent success is the economic expansion of China,
and there are signs of acceleration in a number of emerging economies. Long-term
growth rates in the rich industrialised countries have been below the world average,
around 2.5 % per year since 1970. Corporations—private or public—play an important
role as the central vehicle of growth in all economies.
Reduction of GHG emissions are achieved in various ways. Some cuts have occurred
simply because they were profitable at current prices. After the year 2000, more
reductions have become profitable as a result of higher prices for fossil energy (coal, oil
and gas—the main sources of man-made CO2 emissions). Higher prices have made it
commercially attractive to cut the use of fossil energy, and thereby GHG emissions,
throughout the economy.
Additional efforts have been made to accelerate the reduction of GHG emissions.
Three important tools are (a) pricing of GHG emissions; (b) new legislation to reduce
emissions: and (c) voluntary activities to limit emissions from corporations,
organisations, or local communities.
Pricing has attracted the most interest. After an initial focus on carbon taxes on coal, oil
and gas—levied at the mine face or at different places in the economy—recent efforts
have sought to establish effective cap and trade systems for corporate emission rights.
The European Union’s Emission Trading System (ETS) is the most advanced system,
but even this ETS has not been able to establish a stable, high and motivating quota
price. Concerning legislation, examples include emission standards, mandatory
requirements for the use of renewable electricity and heat, and reduced deforestation.
An uncommon example of broader legislation is the United Kingdom Climate Act1
5

which commits the country to reducing its national emissions at a predetermined rate up
to a total cut of 80 % by 2050. In addition to pricing and legislation, there are, of course,
voluntary cuts beyond what is profitable and compulsory. These can be substantial and
often constitute an element in corporate social responsibility (CSR) strategies or in
citizen’s initiatives at the city, local or even household level.
This far, neither pricing, nor legislation, nor voluntary action has been put in place at a
rate which is sufficient to mitigate the impacts of climate change. Calculations show that
the sum of national commitments as of 2011 will lead to a temperature increase of plus
2.5°C by 2050, and much higher in the second part of the century (Climate Interactive,
2011). Much deeper cuts need to be agreed to, and this is the ambition of the ongoing
climate negotiations.
Thus the question remains how the world could cut GHG emissions by 50% by 2050,
while maintaining economic growth at historical rates of 3.5% per year.
Three strategies for cutting GHG emissions
There are three ways of splitting the task of cutting GHG emissions among the world’s
emitters:
1. Proportional cuts through legislation
The simplest way to cut emissions is to ask “everyone” to cut 50% by 2050, which
amounts to a reduction of 1.7% per year. If all nations, cities, corporations, and
households cut at this rate, global warming would be kept below 2°C. Each emitter
could use their current emissions as the basis for calculating their proportional part of
the total effort. If everyone cut their emissions by 1.7% per year, irrespective of how
6

fast they grew economically, this reduction would solve the global problem. . This
strategy could be translated into milestones on a suitable time horizon, like “minus 20%
by 2020.” I call this strategy “proportional cuts.”
The main argument against proportional cuts is that it is neither cost efficient nor fair. It
is much simpler and cheaper to cut GHG emissions in some places than others. For
example it is much cheaper (in euros per ton of CO2 avoided) to reduce emissions by
stopping the harvest of northern forests than by introducing electric cars. But, the
simple proportional cut strategy is also seen as blatantly unfair by the less industrialized
countries. Most of the current man-made CO2 in the atmosphere has been emitted by
the rich industrialised countries since preindustrial times. It is therefore argued that the
poorer nations should be allowed to emit more GHG during their endeavour to
overcome poverty.
2. Pricing of emissions through quota trading
In order to make the cut strategy more cost effective it is commonly proposed to base
the cuts on a system of “quota trading.” This strategy involves establishing a cap and
trade system, which automatically picks the cheapest reduction projects and ensures that
capital flows to these projects from the participants in the system. The cap equals the
total number of emission rights allowed by the system at the beginning of each year.
Trade occurs when each participant in the system is obliged to hand in enough emission
rights every year to cover their emissions.
The issue of fairness—the historical equity problem—can be solved by allowing some
nations to operate outside the trading system (i.e., without the obligation to buy
emission rights to cover their emissions). For example, one could agree that developing
7

countries should not be required to participate before their per capita emissions have
reached the same level as per capita emissions in the rich world.
But it has proved difficult to establish effective quota trading. The main problem has
been political opposition—both from industry and labour—against making the cap
sufficiently tight, for fear that this would threaten economic growth, employment, and
poverty alleviation. The result has been so generous caps (i.e., so high ceilings) that the
price of an emission right (i.e., the quota price) has remained too low to make important
climate projects profitable. As an example, the quota price in the EU Emissions Trading
System is expected to deliver a quota price around 20€/tCO2e in 2020 (KLIF, 2010).
This amount is below what is necessary to make wind power, electric cars, and carbon
capture and storage economically competitive.
3. Voluntary reductions
The third possible strategy to cut GHG emissions is through voluntary action. This is
what responsible and conscientious global players (nations, cities, corporations, and
households) might choose to do even though it is neither profitable nor mandatory.
There are many reasons why emitters would take on such commitments despite the cost
and the hassle. First, they may believe that proactive reductions will improve their
position in the long run. Corporations may draw competitive advantage from practical
experience with new technologies, and nations may reduce future costs by subsidizing
early shifts to green technologies. Second, emitters may think that voluntary action will
improve their general reputation, and specifically help them retain attractive staff or
citizens. Thirdly emitters may cut simply because they believe this is the right thing to
do.
8
But how far should they go? How much should they cut? This is a relevant question if
the emitter is willing to move ahead of established policy. It is also the central question
asked in this paper. How much must a corporation cut if it voluntarily wants to do its fair
share of the global effort to keep global warming below 2°C? Similarly, at the national
level: How much must a nation cut if the nation wants to do its fair share of the global
effort—even if there is no international agreement that divides the task among the
nations?
How much is enough at the national level?
As mentioned above, the dual global ambition is to halve global GHG emissions over
the next forty years, while maintaining the same growth rate in world GDP as during the
last forty years.
In quantitative terms this means reducing GHG emissions by 50% from 2010 to 2050
(which is equivalent to a decline of 1.7% per year) , while keeping the world economy
growing at 3.5% per year in real terms. In sum, this implies a reduction of “GHG
emissions per unit of GDP” by 5% per year.
This quantitative result is obtained as follows: If global GHG emissions in 2010 is
defined as 1, and global GDP in 2010 is also defined as 1, the dual ambition is that
GHG emissions in 2050 shall be 0.5 and that GDP in 2050 shall be 4.0 (the result of
growing at the historical rate of 3.5% per year for forty years). The ratio “GHG per unit
of GDP” will thereby decline from 1/1 = 1 in 2010 to 0.5/4 = 0.125 in 2050. The latter
is equivalent to an annual decline of 5% per year for forty years.
9

Thus, it is simple to tell what is “enough” at the national level. If all nations pursue
economic growth as they have done historically, with the same success rate, and at the
same time reduce their GHG emissions per unit of GDP by 5% per year, then GHG
emissions in 2050 will be 50% below current levels and the world economy 400% of
current levels (four times as big as today). This could be enough to eliminate poverty
and avoid dangerous global warming.
In summary, the world would make a major step towards climate stabilization and
poverty alleviation if all nations voluntarily committed to reducing their GHG emissions
per unit of GDP by 5% per year, while keeping economic growth at traditional rates.
Therefore cutting by 5% per year would constitute a reasonable ambition if the nation’s
goal was to do its fair share of the global effort.
But, although the suggested decline rate of 5% per year would suffice, there are many
reasons why nations would insist on differentiated responsibilities, as I will discuss in a
later section.
How much is enough at the corporate level?
The national ambition to cut 5% per year can be translated into a resolution at the
corporate level, since the nation’s GDP is the sum of the value added of all of its
corporations.
The corporate contribution to GDP is technically named the corporate “value added,”
and is defined as “total revenues less all purchases of goods and services from external
suppliers.” Thus the nation’s GDP will grow by 3.5 % per year if all of its corporations
increase their value added by 3.5 % per year. Similarly, a nation’s GHG emission is the
10

sum of the emissions of all of its corporations. Thus the nation’s emissions would
decline by 1.7% per year if all its corporations—and all its households—cut their
emissions by 1.7% per year.
Notice that, for the sake of brevity, I use the word “corporation” to denote any entity
(private or public, for profit or not) involved in economic activity. Thus the word
“corporation” includes not only businesses, but also hospitals and universities, NGOs,
and governmental agencies. Notice also that I need to include explicitly the emissions
from “households” (the nation’s final consumers), since they do not add to the GDP or
to corporate value added, according to standard definitions.
In summary, the nation would succeed in reducing its GHG emissions per unit of GDP
by 5% per year, if all its corporations reduced their GEVA by 5% per year (and all
households reduced their emissions by 1.7% per year). Therefore cutting GEVA by 5%
per year would constitute a reasonable ambition if the corporation’s goal is to do its fair
share of the global effort.
But although the suggested decline of 5% per year would suffice, there are many reasons
why corporations could argue for differentiated responsibilities, as I will discuss in a
later section.
CONCEPTS, MEASUREMENT AND DATA
At the national level—the GHG/GDP ratio
The concept of GHG emissions and GDP are well defined and commonly used at the
national level. Most nations provide annual data on their GDP according to procedures
11

developed since World War II. Many nations measure the annual GHG emissions from
their territory, using procedures developed and negotiated by the UNFCCC (UNFCCC,
2012). By dividing the two numbers, one obtains GHG emissions per unit of GDP. By
following the GHG/GDP ratio over time, one can judge whether it declines at the
suggested decline rate of 5% per year.
1. Longitudinal data
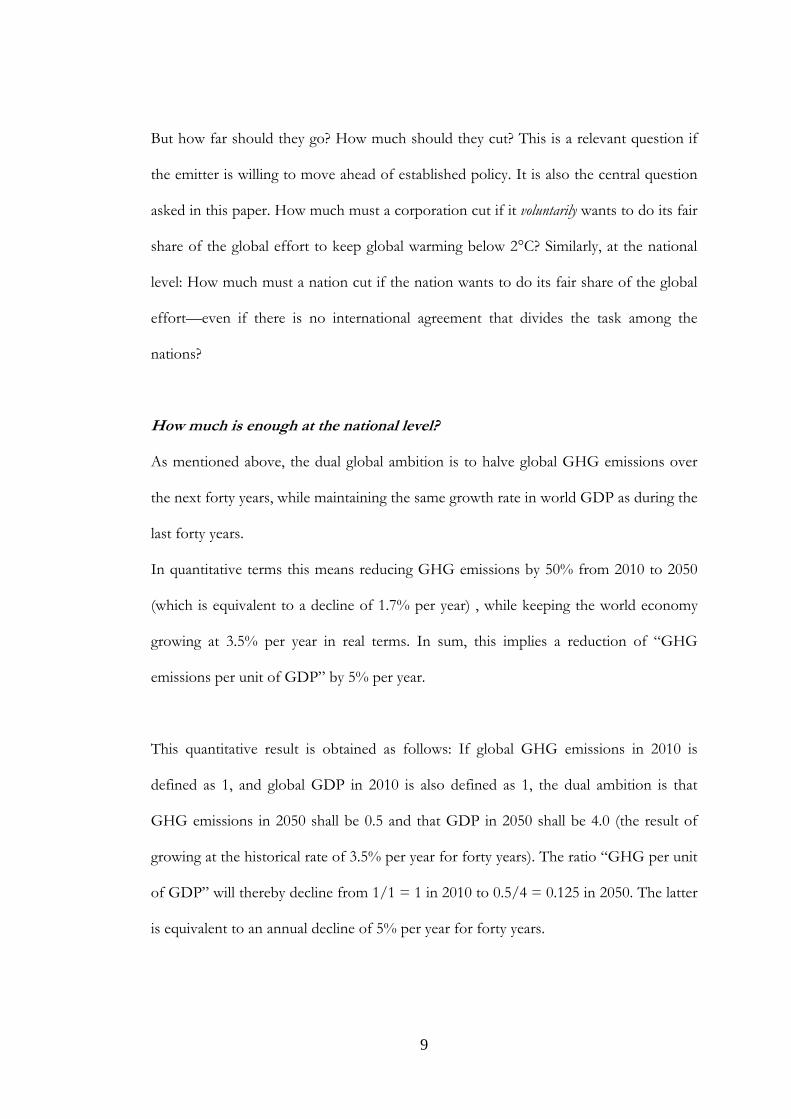
Figure 2 shows how the ratio has developed over the last forty years for five regions of
the world, plus for the world total. Notice that the figure is limited to one greenhouse
gas, namely CO2, because data is lacking on most of the other 5 Kyoto-gases. But CO2 is
a reasonably good measure, since it represents some 80 % of total man-made GHG
emissions.
0,000
0,500
1,000
1,500
2,000
2,500
1970 1975 1980 1985 1990 1995 2000 2005 2010
CHINA
BRISE
WORLD
US
ROW
OECD‐less‐US
Figure 2: GHG emissions per unit of GDP (in kgCO2 per 2010-USD), five regions and the world total, 1970 - 2010b
bBased on data from Penn World Tables and BP Statistical Review of World Energy
12

The numbers underlying Figure 2 are highlighted in the table below, which shows that
the GHG emissions per unit of GDP for the world as a total declined at 1.7 % per year.
Table 1: GHG per GDP in 2010, and rate of decline in GHG per GDP from 1970 - 2010
Region GHG per GDP in 2010 in kgCO2 per 2010-USD
Rate of decline in GHG per GDP from 1970 to 2010 in % per year
U.S. 0.45 -2.1
OECD (less U.S.) 0.31 -1.8
CHINA 0.74 -2.7
BRISE 0.49 -2.8
REST OF WORLD 0.36 -0.8
SUM WORLD 0.44 -1.7
The regions varied in their performance. The industrial world reduced its GHG/GDP
ratio by some 2% per year. China and BRISE (Brazil, Russia, India, South Africa and
the ten biggest Emerging economies) made the fastest cuts, at around 2.8% per year.
But all were far below the suggested decline rate of 5% per year.
2. A real challenge
Although it is simple to calculate the path of the GHG/GDP ratio at the national level,
no region has been able to make it decline by 5% per year over the last forty years. But
the goal may still be attainable. For example, the EU has committed to cut its GHG
emissions by 20% from 2010 to 2020. During these ten years the EU economy would
grow by 25% if past growth rates were continued. Thus, if the EU reached both goals,
its GHG/GDP ratio would fall from 1/1=1 in 2010 to 0.8/1.25 = 0.62 in 2020. This
13
amounts to an annual decline of 4.4% per year, and is not far from what would be the
EU’s “fair share” of a global effort.
3. Common boundaries
It is important to use the same boundary for the calculation of GHG emissions and
GDP. The emissions data should cover the emissions from all production involved in
the gross domestic product. Emissions from tourism abroad should not be included,
while emissions from visiting tourists should be. Emissions from the production of an
imported car should not be included, but emissions from domestic car productions
should, even if the car is exported. Absorption through photosynthesis in domestic
forests should be credited to the nation. The emissions from use of the wood is (slightly
illogical, but by convention) debited to the country that cut the tree.
4. Stable growth rate at global level
The global ambition of a 50% cut in GHG emissions will be achieved if all nations cut
their GHG/GDP ratio by 5% per year, as long as the world economy grows at 3.5% per
year. Notice the presumption that the growth rates of the individual nations will add up
to a stable long-term growth rate of the world economy of 3.5% per year—in the future
as in the past. Some nations will indeed grow faster, but others will grow slower than
desired and planned. In the past this mixture of success led to an expansion of the
world economy at 3.5% per year. If we assume the same degree of average success
during the next forty years, the world economy will continue to expand at 3.5% per
year. In that case, if all nations reduce their GHG/GDP ratio by 5% per year over these
forty years, total GHG emissions will be 50% lower in 2050.
5. Robust decline rate
14

The number 5% per year is relatively robust against variations in the assumptions made.
If the GDP growth rate is varied within the range from 2.5 to 4.5% per year, and the
GHG reduction varied within the range from 0.2 to 0.8, the suggested decline rate in the
GHG/GDP ratio varies within the range from 3.0 to 8.5% per year. Thus 5% might
serve as a reasonable average guideline for voluntary action.
6. The distributional issue
Finally, there is the question of whether it makes sense to ask all nations to cut their
GHG/GDP ratio at the same rate. The answer is obviously no. Most of the GHG in
the current atmosphere was put there by the current rich industrialised countries, and
many argue that these countries should take the lead in the effort to reduce man-made
GHG emissions. The industrialised countries could do so by requiring their
GHG/GDP ratio to drop faster than 5% per year. They could achieve this goal either
by deeper cuts in domestic emissions or by paying for cuts abroad and including these
reductions in the numerator of the GHG/GDP ratio.
There are many ways to differentiate the responsibilities among nations. For example, it
has been suggested that the industrialised countries should cut their emissions by 80%
by 2050, not by the 50% which I have assumed this far. In the 80% scenario, the
industrialised countries would have to reduce their GHG/GDP ratio to (1 – 0.8)/4 =
0.05 by 2050, if we continue to assume an economic growth rate of 3.5 % per year.. This
would require a decline rate of 7% per year. Thus, one solution to the distributional
issue would be for the industrialised countries to cut by 7 % per year and the other
nations by 3% per year so that the average remains at the suggested decline rate of 5%
per year. In order to manage long-term changes in wealth, one could agree to shift
15

countries from the poor to the rich category when their GDP per person exceeds a
certain threshold (for example the expected GDP per person in China in 2020).
Before concluding on what is fundamentally a political question of equity, it is important
to be aware of the distributional effect of using the 5% per year decline rate for all
countries. This effect is easily seen if starting from the observation that emerging
economies tend to grow faster than the industrialised countries. The difference is
significant. In the long run the GDP expands by around 7% per year in emerging
economies and around 2% per year in the industrialised world. If both regions reduce
their GHG/GDP ratio by the same 5% per year, the result is a decline in absolute
emissions by 3% per year in the industrial world versus an increase in emissions by 2%
per year in the emerging world. One could argue that this automatic shift in the global
distribution of the emission of GHG is sufficient to counter the historical inequity.
Obviously, the discussion about how much the rich should cut is a controversial
question. But there is useful guidance in the fact that if all nations cut their GHG/GDP
ratio by 5% per year, global CO2 emissions in 2050 would be 50% lower, assuming
continuation of the historical GDP growth.
A totally different approach to differentiated responsibilities is based on GHG
emissions per person, rather than per unit of GDP. This line of thought starts from the
presumption that each person has the same right to emit greenhouse gases. Thus the
long-term target should be equal per capita emissions in all nations. To get there, the
“leading” nations with the highest per capita emissions would start the effort by cutting
their emissions. Over the years they would gradually lower their per capita emissions,
towards the level of the (still rising) per capita emissions in the rest of the world. The
16

only obligation of those other countries would be to start cutting once their per capita
emissions starts to exceed the (now falling) per capita emissions in the leading nations
(Holtsmark & Randers, 2008).
At the corporate level - GEVA
It is harder to find data for GHG emissions per unit of value added at the corporate
level.
1. Corporate greenhouse gas emissions
GHG emissions (in tons of CO2 equivalents per year) are published by the Carbon
Disclosure Project (CDP) for a large number of corporations (CDP, 2010). But CDP
only provide data for a few recent years, so it is near impossible to find the long time
series illustrated in Figure 1 and 2 at the national level. CDP provides emissions from
within three sets of corporate boundaries. “Scope 1” emissions are direct emissions
from operations controlled by the corporation. “Scope 2” emissions are mainly the
emissions from the electricity purchased by the corporation from external suppliers.
Finally, “Scope 3” emissions are all upstream and downstream emissions not included in
Scopes 1 and 22. Ideally the data should cover all 6 Kyoto-gases, but are often limited to
CO2.
So, when calculating the GEVA for a corporation, one should only include its Scope 1
emissions, since these are the emissions that emanate from the creation of value in the
corporation.
2. Corporate value added
17

The corporate contribution to the nation’s GDP is not commonly calculated or made
available, although it can be derived from the annual financial statements. The challenge
is that the corporate accounts do not traditionally focus on value added, but on other
measures of profitability. Economic value added is defined as the difference in
economic value between the outputs and the inputs of the corporation. In accounting
terms “value added” equals “sales revenue less the cost of goods and services purchased
from external suppliers.” This concept is approximated by the term “Gross Profit” in
US accounting, which is often directly available in the annual financial statement. In
European accounting, value added can be calculated from basic data in the financial
statements. Economic value added is approximately equal to “operating profit, i.e.,
earnings before interest and depreciation (EBITDA)” plus all “personnel costs.”
Personnel costs should include payment to management and board members. The
approximation is good as long as there are no payments to external suppliers included in
the final estimate of value added.
The value added of corporations that do not sell their output (for example public
hospitals or NGOs) is normally measured as the sum of all costs, less payments to
external suppliers. As an example, the value added in an elderly persons’ nursing home
is dominated by labour and lodging costs, and typically shows little change from year to
year beyond the real rise in wage costs. The direct GHG emissions are dominated by
heating, cooling and transport emissions.
Long time series for the economic value added in corporations are also uncommon, but
can be obtained from historical accounts, although there are problems arising from
changes in the reporting boundary, which should be the same for measurement of both
GHG emissions and value added.
18

Using value added as the denominator in GEVA (rather than for example sales)
allocates responsibility for climate cuts in an unambiguous manner among corporations
and organisations and avoids the problem of double counting.
3. GEVA
In those cases where data for GHG emissions (in tons of CO2e per year) and for value
added (in USD million per year) are available, it is possible to calculate GEVA—the
GHG emissions per unit of value added (in kg of CO2e per USD).
Figure 3 shows GEVA for a number of US corporations in 2008, but once more limited
to CO2 emissions. The numbers vary greatly between industries, as would be expected,
and within industries. The utilities sector produce little economic value per ton of CO2,
and have high GEVAs. The reason is that the large emissions from the production of
electricity from coal and gas are counted, correctly, as Scope 1 emissions from this
sector. At the other end of the spectrum, telecommunications, financial institutions, and
IT have low emissions, arising largely from office operations and travel in company cars
(and jets). They create much economic value per ton of Scope 1 GHG emissions. They
are more carbon efficient—with smaller GEVAs.
19

Company Name CDP Sector Gross Profit
(million $ per year)Scope 1 Scope 2 Company
averageAmerican Tower Telecommunications 431 193 465 1 204 0,000Qwest Communications Intl Telecommunications 168 467 1 204 160 8 890 0,019Sprint Nextel Telecommunications 68 057 2 015 217 18 889 0,004AT&T Telecommunications 129 985 450 770 74 133 0,002Verizon Communications Telecommunications 527 802 5 742 912 58 347 0,009 0,007Simon Property Group Financials 26 068 689 914 3 327 0,008 0,008Cisco Systems Information Technology 51 620 546 762 25 484 0,002Hewlett‐Packard Information Technology 303 844 2 145 534 28 443 0,011Advanced Micro Devices Information Technology 84 719 354 784 2 320 0,037EMC Information Technology 35 850 335 770 8 222 0,004Intel Information Technology 1 000 000 2 500 000 20 844 0,048 0,020Allergan Health Care 45 643 58 567 3 642 0,013Schering‐Plough Health Care 446 987 557 157 11 195 0,040Biogen Idec Health Care 49 459 47 438 3 696 0,013Johnson & Johnson Health Care 356 729 970 543 45 236 0,008Bristol‐Myers Squibb Health Care 377 825 454 310 14 201 0,027Pfizer Health Care 1 017 810 1 000 959 40 184 0,025 0,021Wal‐Mart Stores Consumer Staples 5 566 006 15 500 950 99 449 0,056Dean Foods Consumer Staples 884 448 765 605 2 945 0,300Colgate‐Palmolive Consumer Staples 271 599 429 992 8 626 0,031H.J. Heinz Consumer Staples 524 606 338 526 3 681 0,143Estee Lauder Consumer Staples 36 600 91 400 5 914 0,006Molson Coors Brewing Consumer Staples 680 831 437 805 1 934 0,352 0,148Boeing* Industrials 575 000 1 104 000 12 985 0,044Burlington Northern Santa Fe Industrials 14 889 927 323 267 11 242 1,324Eaton Industrials 122 000 726 000 4 185 0,029United Parcel Service Industrials 12 148 866 1 105 134 39 608 0,307United Technologies Corp Industrials 968 080 1 113 827 16 120 0,060 0,353Chevron Energy 62 978 970 5 216 351 80 813 0,779Spectra Energy Energy 9 614 164 1 421 690 3 488 2,756Hess Energy 10 714 780 574 092 9 698 1,105Anadarko Petroleum Energy 8 284 413 641 458 13 266 0,624Transocean Energy 2 148 208 4 762 7 319 0,294 0,353Carnival Consumer Discretionary 10 247 517 50 748 5 607 1,828News Corporation Consumer Discretionary 108 931 527 343 5 381 0,020Stanley Works Consumer Discretionary 50 746 162 190 1 671 0,030Limited Brands Consumer Discretionary 31 631 353 377 3 542 0,009Darden Restaurants Consumer Discretionary 324 835 750 388 1 488 0,218Johnson Controls Consumer Discretionary 458 324 1 256 307 5 526 0,083 0,365Praxair Materials 3 695 830 9 732 516 4 301 0,859PPG Industries Materials 4 442 743 1 805 521 5 694 0,780E.I. du Pont de Nemours Materials 9 336 753 4 002 807 7 753 1,204Air Products & Chemicals Materials 12 300 000 8 900 000 2 721 4,520Newmont Mining Materials 4 138 189 1 187 354 3 055 1,355 1,744PG&E Utilities 1 903 901 1 535 505 8 113 0,235Public Service Enterprise Group Utilities 24 287 856 1 851 103 6 027 4,030Pepco Holdings Utilities 2 959 112 79 756 2 411 1,227Xcel Energy Utilities 62 650 466 59 397 4 401 14,234DTE Energy Utilities 41 800 000 445 000 5 023 8,322 5,610
Overall average 0,968
CO2 emissions
(tons CO2 per year)
GEVA = Scope 1 Emissions over Gross Profit(kg CO2 per $)
Sector
Figure 3: Greenhouse gas emissions per unit of value added (in kg CO2 per USD), US Corporations 2008c
c Thanks to Rich Baltimore of ClearCarbon Consulting Inc for having provided this data.
20

It is very difficult to find longitudinal data on GEVA for time periods that are long
enough to establish a trend. I have only succeeded in obtaining indicative data from a
random sample of progressive firms. Figure 4 shows the GEVA of BT—the British
telecommunications giant—from 1997 to 2008. BT is widely seen as a leader in the
sustainability field and did reduce its GEVA by 28% over these 11 years. This is
equivalent to a decline of 2.9% per year, which is short of BT’s “fair share” and which
would have required a decline of 5% per year.
0,000
0,010
0,020
0,030
0,040
1997 2000 2003 2006
GEVA (Scope 1) Minus 5 % per year
Figure 4: Greenhouse gas emissions per unit of value added (in kgCO2e per 2010-£), British Telecom, Scope 1, 1997 - 2008d
d Thanks to Chris Tuppen of Advancing Sustainability LLP who undertook the big effort of collecting the data in figures 4, 6 and 7 in 2008 while Chief Sustainability Officer of BT.
Figure 5 shows the GEVA for SABMiller—the multinational brewery—from 2005-10.
SABMiller appears to have done its “fair share,” albeit over a shorter time period, and
perhaps from a advantageous starting point.
21
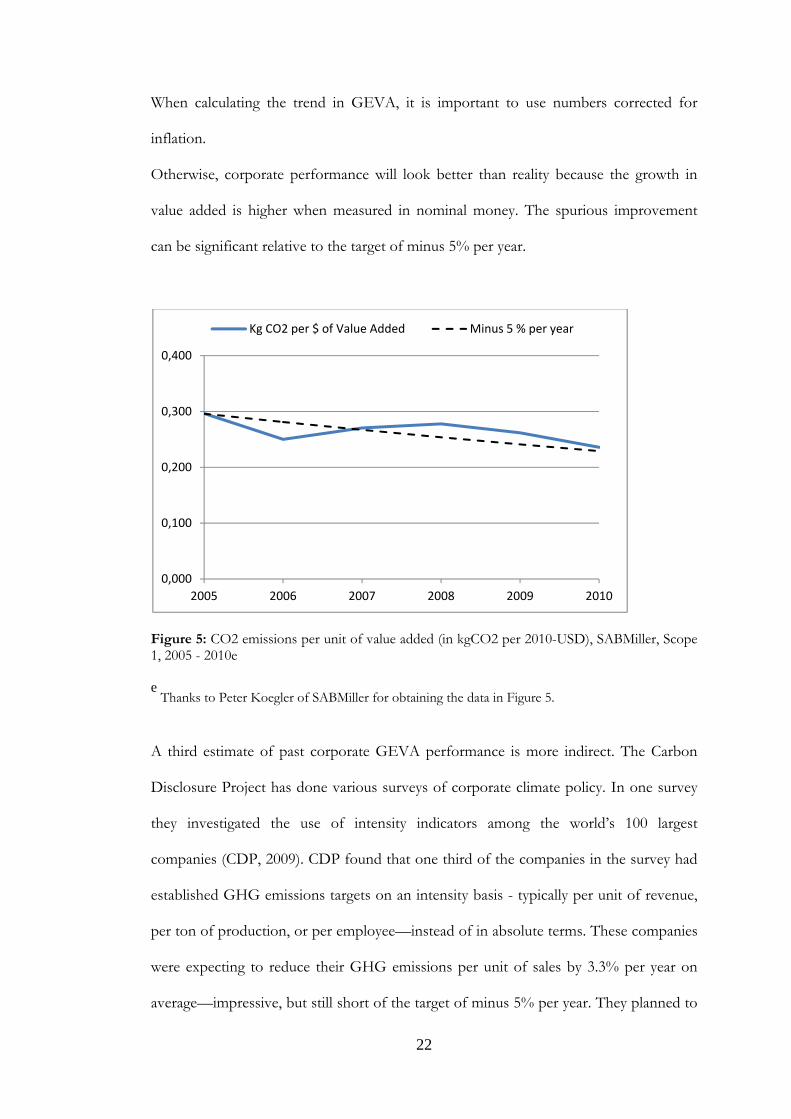
When calculating the trend in GEVA, it is important to use numbers corrected for
inflation.
Otherwise, corporate performance will look better than reality because the growth in
value added is higher when measured in nominal money. The spurious improvement
can be significant relative to the target of minus 5% per year.
0,000
0,100
0,200
0,300
0,400
2005 2006 2007 2008 2009 2010
Kg CO2 per $ of Value Added Minus 5 % per year
Figure 5: CO2 emissions per unit of value added (in kgCO2 per 2010-USD), SABMiller, Scope 1, 2005 - 2010e e
Thanks to Peter Koegler of SABMiller for obtaining the data in Figure 5.
A third estimate of past corporate GEVA performance is more indirect. The Carbon
Disclosure Project has done various surveys of corporate climate policy. In one survey
they investigated the use of intensity indicators among the world’s 100 largest
companies (CDP, 2009). CDP found that one third of the companies in the survey had
established GHG emissions targets on an intensity basis - typically per unit of revenue,
per ton of production, or per employee—instead of in absolute terms. These companies
were expecting to reduce their GHG emissions per unit of sales by 3.3% per year on
average—impressive, but still short of the target of minus 5% per year. They planned to
22

achieve their 3.3% per year through future growth rates (in sales) of 2.6% per year and
absolute reductions of 0.7% per year.
DISCUSSION
GEVA is well defined and can be measured at the corporate level, but this in not yet
commonly done. Below we discuss a number of issues related to the use of GEVA as a
corporate guide to voluntary climate action.
1. Scope 1 avoids double counting
The main reason to focus solely on Scope 1 emissions when calculating GEVA is that
Scope 1 emissions of all corporations add up to national emissions. One avoids double
counting—for example of the double counting of the emissions from the energy sector
if the users of the energy also include their Scope 2 emissions in their report. It is
important to notice, again, that one must include separately the GHG emissions from
final consumers—those that do not create value, but still burns fossil fuels or emit
GHG in other ways.
If Scope 2 emissions were included in GEVA, the emissions from the nation’s utilities
would be counted twice. This problem could be avoided by excluding all utilities from
the GEVA reporting requirement, and ask all other corporations to report on the sum
of Scope 1 and Scope 2 emissions. But then it would become unclear what denominator
to use when establishing the national target for the GHG/GDP ratio. The
recommended decline rate would depend on whether one used “GDP” or “GDP less
GDP of utility sector” in the denominator.
23

So, focusing on “Scope 1 emissions” is intellectually rigorous and avoids double
counting, but has another drawback. Using GEVA based on Scope 1 would most likely
reduce the corporate incentive to cut Scope 2 emissions. A “political” compromise
might be to ask everyone to report on Scope 1+2 emissions per unit of value added and
keep the desired decline rate of 5% per year. This would be slightly illogical, but still
provide a corporate guide for voluntary climate action.
Figure 6 shows a modified GEVA based on Scope 1+2 for BT from 1997 to 2008. The
modified GEVA declines faster than GEVA based on Scope 1 in Figure 4. The reason
is BT’s huge shift towards low-carbon energy during the measurement period. As a
consequence BT did succeed in cutting the modified GEVA by the desired decline rate
of 5% per year.
0,000
0,025
0,050
0,075
0,100
0,125
1997 2000 2003 2006
GEVA (Scope 1+2) Minus 5 % per year
Figure 6: Greenhouse gas emissions per unit of value added (in kg CO2e per 2010-£), British Telecom, Scope 1 + 2, 1997 - 2008
24

2. Value added is rarely used
This paper focuses on value added because the nation’s GDP is the sum of the value
added of all its corporations. Although value added is the central concept in GDP, value
added is surprisingly unknown in the corporate world and among business economists.
Few seem to be aware that “gross profit” in US accounts is the same as value added. It
will take time to make value added as familiar as other denominators like “per sales,”
“per ton of production,” or “per USD of operating profit.” A slightly illogical
compromise would be to use data for “emissions per unit of revenue” or “emissions per
unit of operating profit.”
3. Long time series are required
Value added is always less than revenue (by the amount paid for goods and services
purchased for external suppliers). Value added can be seen as a fraction of revenue, and
may fluctuate from year to year. Emissions, on the other hand, are rooted in the
corporate technology and proportional to slowly changing production rates.
As a consequence, GEVA may show spurious variation from year to year. Data from
several years may be necessary to establish a clear trend. Figure 7 illustrates this
phenomenon for BT. There is a clear trend3, but the annual values of GEVA deviate
from the trend. The fluctuation is not excessive, but still the annual variation might
make GEVA unsuitable as a basis for management compensation. Compensation might
better be based on the long-term trend.
25

9 000
10 000
11 000
12 000
13 000
14 000
1997 2000 2003 2006
Value added in 2010 prices Linear (Value added in 2010 prices)
Figure 7: Economic value added (in 2010-£ per year), British Telecom, 1997 - 2008
4. Suggests a definition of fair share
Any corporation that cut its GEVA by 5% per year can argue it is doing its “fair share”
of the global effort to stabilize the climate and help solve world poverty.
Still, the critic will make the point that absolute emissions from a corporation will
increase if it grows by more than 3.5% per year. If the company succeeds in reducing its
GEVA by 5% per year, but grows at 7% per year in the process, its GHG emissions will
increase by 2% per year
This does not invalidate the conclusion of this paper, because corporations on average will
only grow at 3.5% per year. It is true that some corporations will grow faster then 3.5%
per year and increase their absolute emissions. But others will grow less fast, or even
decline, and reduce their absolute emissions. The total value added of all corporations
will, per my central assumption, increase by 3.5% per year
26

5. Gives room for corporate growth
It is simpler for a corporation to commit to reduction of an intensity measure like
GEVA, than to commit to absolute emission cuts. This is because the intensity measure
gives the corporation room for future growth, be it endogenously or through mergers
and acquisitions. When a company grows, its emissions normally grow. And since most
corporations seek to expand, most corporations are worried about committing to
constant emissions and—even worse—to declining emissions. It is much simpler to
commit to declining intensities, like for example a decline in GEVA. The corporation
can commit to the suggested decline rate of 5% per year in GEVA, argue it is doing its
fair share, and proceed to grow as fast as desirable.
This flexibility increases the likelihood that corporations will commit to measure
GEVA, seek to reduce its value by minus 5% per year, and report on performance. This
conclusion is supported by the fact that numerous firms already report on corporate
intensity performance—albeit with sales in the denominator—in CDP’s Global 500
Carbon Disclosure Leadership Index (CDP, 2010).
6. No need to adjust the target
A consequence of the preceding point is that the corporation does not need to adjust its
target for GHG reduction even if it happens to grow faster than anticipated. The target
to achieve a certain decline rate in GEVA—for example 5% per year—can be
maintained. This makes it simpler for corporations to commit to reducing GEVA than
to promise absolute cuts in GHG emissions. GEVA is an intensity indicator that does
not need to be revised even if the company grows.
27

If the company prefers to decide on and communicate an absolute emission cut, this
absolute goal can easily be translated into a commitment to reduce its GEVA. For
example, if the company wants to cut emissions by 20 % from 2010 to 2020 (i.e., by
minus 2% per year), and expects to double its value added in the same period (i.e., by
plus 7% per year), it implicitly commits to a decline rate in GEVA of 9% per year.
7. Guides investors toward low-carbon corporations
GEVA tells how much economic value the corporation creates for every ton of GHG
emitted.
Thus GEVA is a useful indicator in a carbon-constrained world, where it will be
important to create as much value as possible for each ton of GHG emitted.
A corporation which creates more value per ton of GHG can be argued to be more
sustainable, in the sense that it utilizes a limited resource in a more efficient way. Thus a
corporation with a low GEVA—both absolute and relative to competitors—is likely to
be more sustainable (or at least less unsustainable). Thus GEVA numbers may be a
useful guide for long-term investors seeking both more climate friendly and more
sustainable operations.4
For the investor it is furthermore helpful to use value added as the denominator in an
indicator, rather than using the more common denominator of sales. Using value added
as the denominator helps allocate the responsibility for climate cuts (or other impacts)
to its proper place in the value chain. Using value added as the foundation leads to an
unambiguous distribution of “guilt” among the corporations and organisations, and
avoids the problem of double counting. The principle is the same as when computing
the value added tax.
28

Corporations could further guide investors toward sustainability by publishing other
impacts (water use, oil consumption, mercury emissions, etc) per unit of value added, as
illustrated by Tomra of Norway (Tomra, 2010).
8. Not cost efficient
Notice that GEVA does not provide a guide toward cost efficient climate action.
GEVA indicates where one is getting most economic value created for each ton of
GHG emitted. It does not point towards the cheapest projects if the goal is to reduce
emissions in a cost efficient manner. For this latter purpose, one needs to know the cost
of reducing emissions in various ways. Many such lists exist—expressing the reduction
cost in USD per ton of CO2e. McKinsey & Co. (2010) is a good example.
9. Potential for differentiation
Finally, there is the question of whether to use the same suggested decline rate for all
the world’s corporations. The answer is deeply political and the logic as in the discussion
of national differentiation earlier in the paper.
It is of course possible to argue in favour of stricter requirements for particular
corporations. For example for the big, or for the multinationals, or for those owned by
rich country investors, or for those headquartered in rich countries, and so on. But any
such differentiation is difficult, because it invites evasion.
Before deciding on differentiation it is important to consider the automatic effect on
distribution effect of applying the same 5% per year decline rate in GEVA to all
corporations. The (intended) effect is to allow fast growing firms to increase their
29

absolute emissions, while requiring slow growing firms to reduce theirs. This amounts,
in turn, to enabling a shift from dying to growing industries—even when total emissions
decline. It also amounts to shifting GHG emissions to regions with many fast growing
firms—exemplified by the emerging regions discussed earlier in the paper.
In summary it appears difficult to differentiate and GEVA may well be best suited as a
guide voluntary action in progressive firms who want to do more than required by
legislation.
IMPLEMENTATION
1. Voluntary action
The original intention of the work reported in this paper was to develop a corporate
indicator that could be used as a guide by progressive firms that wanted to decide on the
appropriate target for their voluntary climate policy. The intention was to assist
corporations who wanted to move ahead of a potential binding international climate
framework and potential national legislation. Such progressive firms often asked: What
is a reasonable target? What would be our fair share of the global effort? How much do
we need to burden ourselves in order to be able to say we have done our bit?
The suggested answer, namely to reduce the corporate GEVA by 5% per year, was
discussed in the preceding pages. The corporate answer was supplemented by a
guideline for voluntary action at the national level, namely a suggested decline in the
GHG/GDP ratio of 5% per year.
30

The presumption was that the use of GEVA and the GHG/GDP ratio would take the
form of voluntary measurement and public reporting. At the end of each year,
progressive corporations would measure their Scope 1 emissions and their value added
during the year. They would calculate their GEVA for the year and add it to the history
of earlier GEVA values in their non-financial reports. Once the time series was
sufficiently long to define a trend in GEVA, they would calculate its slope and compare
the decline rate with the corporate target, for example minus 5% per year, and report on
the result. Similarly the national statistical office each year would collect data for
national GHG emissions and national GDP during the last year, divide the two, add it
to earlier values of the GHG/GDP ratio, establish a trend and report on the decline rate
of this trend in the statistical yearbook.
There does not exist much incentive to do all this work, beyond the rare corporate and
national desire to be progressive and forward looking for one reason or the other, as
detailed earlier in this paper. As a consequence, such reporting is not yet common
practice. At the national level, the underlying data sometimes exist, but is not yet
routinely combined into time series of the GHG/GDP ratio.
2. Current examples
At the corporate level, the numbers are harder to obtain, and very few corporations
have chosen to report on its impacts (including GHG emissions) per unit of value
added. This is in spite of the intellectual rigor involved in such reporting, the
unambiguous distribution of blame along the value chain, and the flexibility it provides
for the growth oriented manager.
31
There seem to be a few exceptions. UK’s BT plc, which publishes its “climate
stabilization index,” defined as Scope 1+2+3 emissions divided by its economic value
added defined as EBITDA plus salary costs. BT furthermore has established goals for
this index (BT, 2010). Tomra of Norway has presented its environmental impacts
(including Scope 1+2 emissions) per unit of value added for a number of years (Tomra,
2010). Autodesk Inc in California compares its annual Scope 1+2+3 emissions per unit
of value added with the decline rate necessary to reach its corporate climate goal for
2050. This decline rate proves to be minus 9% per year. This high target is partly
explained by the fact that Autodesk does not correct its sales for inflation (Stewart &
Deodhar, 2009).
3. Engaging civil society
If the necessary data were publicly available, civil society and others could use the data
to highlight whether a nation or corporation is doing its fair share.
One way to increase the corporate and national incentive to measure and report GEVA
and GHG/GDP ratio would be to copy the success of the Carbon Disclosure Project in
coercing well-known corporations to measure and report on their climate gas emissions.
CDP simply asks the largest corporations in the world to provide their emission
numbers, and then proceeds to publish the response. If a corporation does not respond,
this is conspicuously highlighted in the CDP annual report. As a consequence of this
public blaming tactics, it did not take many years before most respectable corporations
did indeed measure and report their climate gas emissions. This action, in turn, made it
possible for CDP to up the pressure by highlighting corporations with growing
emissions.
32

One expansion on this technique might be to have the CDP publish GEVA numbers
along with the emission numbers. And after some years, calculate the trend, compare it
to the suggested decline rate of 5% per year, and publicise the result. This would only
require one more box in the CDP questionnaire, asking for the corporation’s economic
value added in the reporting year. CDP has hesitated for fear that the extra burden
would stop corporations from supplying the emissions data. But CDP or other civil
society activists could dramatically increase the motivation of corporations to measure
and report their GEVA. A third party beneficiary would be the investor community
who could use the GEVA listings to pick companies that produce much economic value
per ton of GHG emissions.
A similar tactic would be to try to include GEVA in the Global Reporting Initiative's
core set of indicators. This is, however, a much longer uphill struggle, because of the
consensus nature of GRI decision making. Or one could try to make GEVA reporting
part of the charter of the UN Global Compact, but again this is probably impossible
because it breaks with the general nature of the charter.
4. Passing legislation
The most direct route would be to establish new legislation which made it mandatory to
report on GEVA as part of mandatory non-financial reporting—and obligatory to
publish the GHG/GDP ratio routinely in national statistics. But since there are few
short term advantages for anyone in this amount of “increased bureaucracy,” I believe
such initiatives would fail. This is even more so for legislation that would require
corporations to reduce their GEVA by 5% per year, and with penalties if they do not.
33

CONCLUSION
It is unlikely that legislation for mandatory measurement and reporting of corporate
GEVA and the national GHG/GDP ratio will come forth over the next decade.
The practical utility of GEVA is therefore likely to remain as a corporate guide to
calibrate voluntary action in progressive firms that want to move ahead of current
legislation. In such cases GEVA can act as a rational basis for the corporation’s climate
policy. The absolute value of the corporation’s GEVA and its development over time
will also help guide investors to identify corporations that are likely to do well in a
carbon-constrained future.
The suggestion to cut the national GHG/GDP ratio by 5% per year can similarly be
used to calibrate national climate policy. But since it is unlikely that international
agreement will be reached to this end anytime soon, the GHG/GDP ratio is likely to
remain as a guide to the voluntary climate policy of progressive nations that want to
move ahead of international agreements.
It certainly would accelerate implementation if civil society chose GEVA and the
GHG/GDP ratio as their standard metric to evaluate the climate policy of corporations
and nations, respectively, gradually making them known in the public and gradually
making it less acceptable for emitters to escape routine reporting of these performance
indicators
Acknowledgements
34

Thanks to Rich Baltimore, Aniruddha Deodhar, Paul Dickinson, Peter Koegler, Atle
Midttun, Alexander Mortensen, Nick Robbins, Simon Thomas, Chris Tuppen, Geir
Vollsæter and Peter Willis who all provided comments or data to this paper.
35

36
References BT - British Telecom, 2010. BT’s 2010 Sustainability report. Accessed March 20, 2012 from http://www.btplc.com/Responsiblebusiness/Ourstory/Sustainabilityreport/PDF/2010/2010_Sustainability_report.htm CDP - Carbon Disclosure Project, 2010. Global 500 Report. Accessed January 16, 2012 from https://www.cdproject.net/CDPResults/CDP-2010-G500.pdf CDP - Carbon Disclosure Project, 2009. The Carbon Chasm. Accessed January 16, 2012 from https://www.cdproject.net/CDPResults/65_329_219_CDP-The-Carbon-Chasm-Final.pdf Climate Interactive, 2011. The Climate Scoreboard. Accessed March 20, 2012 from http://climateinteractive.org/scoreboard Holtsmark, B., Randers, J., 2008. Et forslag til byrdefordeling i Post-Kyoto-avtalen. Klima 6/2008, s. 14-15. KLIF, 2010. Klimakur 2020 – Tiltak og virkemidler for å nå norske klimamål mot 2020. TA 2590/2010. Accessed February 10, 2012 from http://www.klif.no/publikasjoner/2590/ta2590.pdf McKinsey & Company, 2010. Pathways to a low-carbon economy. Accessed February 20, 2012 from http://www.mckinsey.com/Client_Service/Sustainability/Latest_thinking/Pathways_to_a_low_carbon_economy Tomra (2010). Tomra’s Annual Report 2009. Accessed March 20, 2012 from http://www.e-magin.se/v5/viewer/files/viewer_s.aspx?gIssue=1&gTitle=&gYear=2010&gKey=r78021h3&gAvailWidth=1014&gAvailHeight=733&gInitPage=1&gHotspot=0 . Stewart, E., Deodhar, A. , 2010. “A Corporate Finance Approach to Climate-stabilizing Targets (“C-FACT”)”, November 2009 UN, 2012a. Millenium Development Goals - A Gateway to the UN System’s Work on the MDG. Available from http://www.un.org/millenniumgoals/ UNFCCC , 2012. National reports. Accessed March 20, 2012 from http://unfccc.int/national_reports/items/1408.php 1 The UK Climate Change Act 2008 is available at
http://www.legislation.gov.uk/ukpga/2008/27/contents
2 These concepts are defined in the Greenhouse Gas Protocol available at
www.ghgprotocol.org/files/ghg-protocol-revised.pdf
3 It is interesting that the value added of BT declined over this decade, but not surprising given the huge
divestitures during the period.
4 Others have suggested other indicators to guide investors toward higher societal value, see for instance
Simon Thomas et al, “Integrated environmental and financial performance indicators”, Corporate
Governance, Vol 3 No 15, page 421, 2009


![Greenhouse Gas Emissions and Emissions Trading in North … · 2020. 2. 23. · 2002] Stephenson-Greenhouse Gas Emissions, Kyoto and U.S. Response 45 greenhouse gas molecules. This](https://static.fdocuments.net/doc/165x107/60facf56e286b02f9b10de99/greenhouse-gas-emissions-and-emissions-trading-in-north-2020-2-23-2002-stephenson-greenhouse.jpg)