Greenhouse gas calculations using BIM (Building ... · assembly. The greenhouse gas cost is stored...
38
Greenhouse gas calculations using BIM (Building Information Modelling) Report from a BuildingBIM project, a cooperationbetween Statsbygg, Skanska, NOIS and Civitas
Transcript of Greenhouse gas calculations using BIM (Building ... · assembly. The greenhouse gas cost is stored...

Greenhouse gas calculationsusing BIM(Building Information Modelling)
Report from a BuildingBIM project, a cooperationbetween Statsbygg, Skanska, NOIS and Civitas

buildingSMART

Page 1
Foreword The issue of the climate is on the lips of politicians and business executives daily, the world over. They make statement after statement along the lines of: “the financial crisis will pass but our climate crisis can only worsen. We have to find answers to the problems so we can help stop the change in climate and diminish the impact of those climate changes already here.” Reductions in emissions are essential if we are to prevent major and, in part, extreme climate changes in the long term. A number of adaptations will have to be made if we are to avert catastrophic consequences for both nature and society, brought about by the way in which our present and past actions have changed the climate. The building industry plays a key role in our attempts to find answers to the climate crisis. These answers involve both reductions in greenhouse gas emissions and adapting modern society to the climate changes. The BuildingBIM project, a cooperation between Statsbygg, Skanska, NOIS and Civitas, centres on expertise and methods for the analysis of how our choice of building materials has an influence on greenhouse gas emissions during a building’s life cycle. The main aspect of the BuildingBIM project has been methods for integrating greenhouse gas emissions from materials into building information modelling (BIM). BIM is the information carrier and tool for the future – facilitating advanced cost control and interdisciplinary flow of information for building projects. The project involves comparison of two calculation tools; the web site for greenhouse gas accounting www.klimagassregnskap.no and Calcus with a climate module. Both tools (models) allow the analysis of how the choice of buildings materials affects a building’s footprint in terms of greenhouse gas emissions throughout a life cycle. The models are different and both have individual strengths and weaknesses. Calcus with its climate module, developed by NOIS, is an extension of the calculation/engineering tool which now includes greenhouse gas emissions from material use, in addition to costs. The web site, www.klimagassregnskap.no, developed by Statsbygg together with Civitas, is a calculation tool which analyses the totality of a building project’s environmental footprint. It comprises four sub-modules which calculate emissions from materials, energy consumption for operation, transport for operation and the construction phase. The BuildingBIM project has only utilised the material module.

Page 2
The comparison made between these two tools has provided an important contribution to the quality assurance process for both tools. The project has confirmed that the tools generate almost equal results and has produced input as to which parts of the calculations require improvement and where simplifications can be made. The project work has provided an important contribution towards advancing our knowledge of and methods for analysing the potential to make greenhouse gas reductions. The BuildingBIM project is an integral element for innovation within the building industry regarding answers to the climate crisis. The people behind the project are as follows: Rupert Hanna, Skanska, assisted by a working group comprising Kai Haakon Kristensen, Trine Kvåle Hervik, Keneth Seim, all from Skanska; Øyvind Jensen, NOIS; Eivind Selvig, Civitas; Zdena Cervenka and Diderik Haug, Statsbygg. Statsbygg, Skanska, NOIS and Civitas hope that this project has provided important input towards innovation, expertise and methods for identifying good and forward-looking solutions to the climate crisis. We are confident that Building Information Modelling – BIM – now enhanced with information on greenhouse gas emissions from materials, will play an important role in the years to come. Eiving Selvig, Civitas June 2009

Page 3
Table of contents 1. Background ...............................................................................................................................4 2. Definitions.................................................................................................................................4 3. Project objective, method and tools............................................................................................5 4. Prerequisites/delimitations .........................................................................................................6
4.1. Scope of greenhouse gas calculations..................................................................................6 4.2. Greenhouse gas emissions for building materials ................................................................7 4.3. Model used for testing ........................................................................................................8 4.4. Standards/transfer format....................................................................................................9
5. The Calcus process ....................................................................................................................9 5.1. Standardisation - the BIM Object Library and Calcus Element Register............................10 5.2. BuildingBIM Element Register.........................................................................................10 5.3. Calcus results....................................................................................................................10 5.4. Sources of error ................................................................................................................12
6. The greenhouse gas accounts ...................................................................................................13 6.1. Input to the greenhouse gas accounts ................................................................................13 6.2. Volume take-off from Revit models..................................................................................14 6.3. Deficiencies and inaccuracies in Revit Material Take-off..................................................16 6.4. Results from greenhouse gas accounts ..............................................................................17
7. Comparison of the results from Calcus and KGR.....................................................................18 8. Conclusion...............................................................................................................................19 9. Future initiatives......................................................................................................................20
9.1. Theoretical and factual greenhouse gas impact for buildings.............................................20 9.2. Further development of the generic greenhouse gas impact database.................................22 9.3. Generic greenhouse gas figures directly from BIM?..........................................................23 9.4. Criteria and requirements from the authorities ..................................................................23 9.5. Suggested improvements to the tools ................................................................................24
10. References ...........................................................................................................................26 11. Appendices ..........................................................................................................................26
1. Calcus summary report for models 1 and 2 2. Cicero summary report on greenhouse gas emissions from production of building
materials

Page 4
1. Background The global building industry represents one of the major sources of greenhouse gas emissions worldwide. A report compiled by Statsbygg regarding strategies to reduce greenhouse gas emissions from the company’s activities states that the operation of buildings in Norway represents approximately 40% of the country’s total greenhouse gas emissions. The actual materials in new buildings represent a lesser but still significant share of Norway’s greenhouse gas emissions. In the Netherlands, research projects by the ECN (Energy Research Foundation) have proven that greenhouse gas emissions from material production in the building industry represent 8-12% of greenhouse gas emissions in Western Europe. It is estimated that a corresponding figure can be applied in Norway for greenhouse gas emissions from materials utilised in buildings. There are several methods of reducing the environmental impact of buildings. One of these is the choice of materials. Possible initiatives include salvaging and recycling of materials and increasing the quality of materials to provide a longer lifetime. What is paramount here is to learn more about where we can make the highest gains environmentally when selecting materials. This process will focus on greenhouse gas emissions from materials. It will require linking greenhouse gas emissions with models utilised for modelling buildings. This project centres around how a BIM could also include information on greenhouse gas emissions from materials.
2. Definitions Greenhouse gas Gas which generates global warming when emitted to the
atmosphere. For this project, emissions from material production for the following greenhouse gases have been summarised (see summary of Cicero report in Appendix): Carbon dioxide – CO2, Methane – CH4 Laughing gas – N2O, Hydrofluorcarbons – HFK, Perfluorcarbons – PFK, Sulphur hexafluoride – SF6
Greenhouse gas emissions Emissions of greenhouse gases. For this project, in connection with the production of building materials.
CO2 equivalent The different greenhouse gases have varying levels of impact on global warming. CO2 has a relatively low impact but a high volume in relation to other greenhouse gases in the atmosphere and in emission volumes. The level of impact of the other gases is defined as factors of the CO2 impact (see Appendix 1 Cicero report).

Page 5
BIM Building Information Modelling. BIM models of buildings are 3D geometrical models comprising objects with relevant data (for example U values, fire classification). A model compiled according to the BIM method can also be described as a “BIM”.
Generic BIM A BIM which comprises generic objects. Product-specific BIM A BIM comprising objects which correspond with available
products. Data related to the objects in a product-specific BIM shall be genuine values for the products utilised in a building.
Building element A component of a building. Building elements are listed in hierarchic order based on the element’s function in a building. The table for building elements (Norwegian Standard NS3451) contains a complete list of building elements.
Object Building element in the BIM model. A model comprises many objects. An object corresponds to a component in a building.
Element A building component in Calcus. BIM objects are connected to Calcus elements by importing an IFC model to Calcus. The elements are saved in the Calcus ElementRegister.
Price line Elements in Calcus most commonly comprise several sub-components, for example a wall with several layers. Each layer has a price and the prices are stored as price lines under the element, which is the wall. Elements also contain price lines for the element assembly. The greenhouse gas cost is stored on the price lines for materials.
EPD Environmental Product Declaration. “An EPD is a brief document which summarises the environmental profile of a component, a finished product or a service in a standardised and objective manner,” (quotation from EPD Norge). An EPD should contain greenhouse gas data for a product.
3. Project objective, method and tools The project objective is to test a BIM’s calculation of greenhouse gas footprints made by materials in a building. The methods utilised were governed by the tools and how they receive data. Two calculation tools for greenhouse gas impact from building materials in buildings have been used for the project: Calcus from NOIS and the greenhouse gas accounting system (KGR) developed by Civitas together with Statsbygg. The data set for greenhouse gas emissions from a range of building materials entered in both KGR and Calcus come from the same source, i.e. data on greenhouse gas consumption collected by Cicero. The data from Cicero was then arranged into a database table by the building analysis. One weakness in the project was that both tools used the same data set for greenhouse gas emissions from material production. If Calcus and KGR had used data sets from different sources, the project would have been able to quality assure greenhouse gas impact data for building materials by comparing results. The project has therefore centred on testing the methods for use of BIM technology in terms of reducing greenhouse gas emissions. The tools differ in their methods for input of building data. The greenhouse gas accounting tool is available on the Internet, where data on material volumes can be entered manually. Data for material consumption in a building can be entered in two ways; either as “Basic materials” (figures for total material consumption specified as number of tons concrete, wood, glass etc.) or “per building

Page 6
element” i.e. internal walls, external walls, windows, slabs etc. which are composed of a number of basic materials. The method is based on estimates of material volumes or the use of a more detailed calculation tool (engineering tool). Calcus is a tool for the evaluation and calculation of building projects. The program is very flexible and can be utilised for cost control of projects at the concept/drawing, pilot project and project detail stages. With Calcus, users can quickly replace elements of a designed building to immediately see the impact of the change on project costs. NOIS has added a module for pricing greenhouse gas emissions which utilises the same price calculation engine with the same flexibility as for financial costs. Users can enter building information in two ways; either as manual input regarding building type, construction method, area and number of floors etc. or from a BIM model in IFC format. The IFC method was applied for the project, as Statsbygg requires that BIM transactions shall always utilise open, international exchange formats for transfer of BIM models and related information between applications. Greenhouse gas calculations were executed using both tools for two BIM models. The results produced by Calcus and KGR were compared to check and quality assure the systems in comparison. As previously mentioned, Calcus and KGR made use of the same basic data set for greenhouse gas emissions from production of basic materials in building elements in an erected building. The comparison of the results from the two tools is, in reality, a comparison of the internal calculation methods in both applications. With Calcus, a demonstration was also carried out by replacing objects in the model to view how the price and greenhouse gas impact changed for the building.
4. Prerequisites/delimitations
4.1. Scope of greenhouse gas calculations At the time of writing, builders and contractors are not subject to criteria or requirements regarding reports of and limitation of greenhouse gas emissions during building projects. Statsbygg has compiled a report entitled “Climate-related challenges for Statsbygg” in which they propose a number of measures to reduce greenhouse gas emissions from building activities. These measures include a requirement for environmental product declarations (EPD) which contain information such as indicators of greenhouse gas emissions from materials, for the materials utilised in a construction. Greenhouse gas emissions from building work can have several sources. The following sources have been discussed during the ClimateBIM project meetings:
1. Material selection and volume 2. Transport to the building site 3. Rigging and operation 4. Groundwork 5. Operation of building after completion
a. Energy for heating and operation b. Building’s lifetime c. Transport to and from the building for users (geographical location) d. Any rehabilitation and upgrade of the building and its contents

Page 7
As the goal of ClimateBIM is to display how BIM can be utilised in connection with the calculation of a building’s greenhouse gas footprint, only item 1 above has been included in the greenhouse gas impact calculations. The other items are more related to planning and procurement and are therefore treated as subjects for possible processing and development. The greenhouse gas accounts (KGR) include modules which calculate emissions for items 2 to 5. The greenhouse gas impact of items 2 to 5 can also be calculated using historical figures. For example, the energy consumption for a building in operation can be simulated by using other tools, but this is not covered by the scope of the ClimateBIM project.
4.2. Greenhouse gas emissions for building materials The processing of materials requires energy which, on a global scale, mainly originates from burning fossil fuels, thereby generating greenhouse gas emissions. The data set for greenhouse gas emissions from production of building materials includes all energy consumption as if created by burning of fossil fuels. The data set does not include greenhouse gas emissions from electricity utilised for production of materials. KGR allows users to enter emissions from electricity consumption while Calcus does not have this option at the time of writing. For the purpose of the project, we operated with zero greenhouse gas emissions from electricity consumption for material production, in order to facilitate comparison of the results. The production of a building element often involves a number of processes. This can complicate the calculation of greenhouse gas emissions for a building element. Greenhouse gas emissions from transport of building materials and raw materials can be particularly difficult to calculate as there are often primary and secondary production locations involved, with a number of transport stages in between. A window, for example, comprises several components and materials; glass, aluminium, wood and small plastic parts, steel and rubber. The flow chart below displays the typical links in the chain of production and transport for a window, from raw materials until the window is delivered to the building site. Phases in the production of building components which generate greenhouse gas emissions
Figure 1

Page 8
For production of a window, it is probable that the actual production stages (extraction, primary and secondary) have relatively similar energy consumption levels and greenhouse gas emissions, as the industrialised processes are standardised on a global scale. However, the transport stages between the different steps for production may vary greatly. Cicero’s data for greenhouse gas impact includes extraction of raw materials, transport to production site and production, and the data reflects European production (generic data). The transport stages between primary and any secondary production sites and to the building site are not included in the greenhouse gas emissions calculated for this project. In the future, greenhouse gas emissions for building materials will be better documented for composite products, so that only the last transport stages to the building site will vary from project to project. The data set utilised in both KGR and Calcus can therefore be considered as a generic data set for European production of materials. In other words, it does not take into account variations in energy sources utilised during production or geographical location of the production sites. The results from the ClimateBIM project therefore represent a generic greenhouse gas impact for a building. In order to actually identify the size of a building’s greenhouse gas footprint, documented greenhouse emissions have to be provided for all the materials in the building, taking into account production processes, choice of energy sources, transport etc. This type of product-specific BIM would also allow the inclusion of greenhouse gas emissions for all the objects in the model and to include the last transport stages from supplier to building site, by entering factors for distance from supplier to building site. Please note that an accurate greenhouse gas footprint for a product-specific BIM will not be available in the immediate future due to the current lack of greenhouse gas declarations for building materials and products, and the complexity of the transport stages from all suppliers to a building site.
4.3. Model used for testing
Figure 2: BuildingBIM model

Page 9
When the project started, Statsbygg initially aimed to utilise the HIBO model. However, due to the size and complexity of the HIBO model, a decision was reached to use a new, simplified model. The model was created in-house by Skanska, for use in the ClimateBIM and BuildingBIM eCommerce projects. The modelling tool used is Revit Architecture. As the model was only to be used for collection of volumes for further processing in Calcus and KGR, it was not seen as necessary to model in other subjects than Architect. The building modelled is a four-storey apartment block with four apartments on each floor on the first, second and third floors and a parking garage on the ground floor. The building only has a limited number of basic objects to avoid excessive time spent on processing data from the model. Two variants of the BuildingBIM model were created. The differences between the models lie in the external walls and the load-bearing construction. Both models only contain ARCHITECTURE subjects.
• Model 1 – External walls in concrete. Load-bearing construction in external walls. This model is used in both Calcus and KGR and the results compared.
• Model 2 – Climate walls (light external walls comprising several layers; boards, wind and moisture proofing and insulation). This model is intended to represent a typical method of construction with load-bearing construction of steel and hollow-core slabs. The load-bearing steel construction was not modelled to save time but was included in Calcus. Model 2 was used to demonstrate how price and greenhouse gas emissions change when objects are replaced.
4.4. Standards/transfer format It is of principal importance for Statsbygg, as a governmental contractor, that the exchange of BIM models and information takes place on an open, international standard for transfer format. Reliance upon specific suppliers and proprietary formats is unacceptable for Statsbygg. We therefore make use of IFC as transfer format between model and Calcus. KGR currently does not have the capacity for direct import of BIM formats and therefore relies on the export of volume take-off to non-Revit formats (such as Excel) taking place without the loss of information.
5. The Calcus process With the ClimateBIM project, Calcus was utilised to calculate the greenhouse gas footprint for the model via IFC import to Calcus. In this process, an IFC model carries the information regarding volumes to Calcus. This functions as follows:
1. The BIM is exported as IFC model. 2. The IFC model is imported to an empty Calcus project. 3. Calcus recognises the IFC objects in the model and calculates volumes based on the
volumes and objects in the IFC model. 4. Any manual adjustments after import are made.

Page 10
5. The calculation results can be analysed and exported in a number of formats and degrees of detail.
One of the advantages with Calcus is that users can quickly replace elements in the calculation to view how these changes impact on project costs. A number of solutions for different building components can be evaluated and compared. In the Calcus CO2 module, different building solutions can be compared in terms of both costs and greenhouse gases. Calcus is based on a database which contains tables for building elements, prices and NS codes. Calcus elements comprise one or more price lines collected from a price line register in Calcus. NOIS has compiled a standard database with standard elements and price lines, but the users are able to define their own elements and price lines.
5.1. Standardisation - the BIM Object Library and Calcus Element Register
When an IFC model is imported to a Calcus project, Calcus searches the model for IFC objects which it recognises. Recognition takes place when Calcus finds an object with an IFC name (IFC_Name) which is the same as the Calcus element name. Users can opt to link IFC objects with Calcus elements manually, but this is time consuming and unpractical with larger models which may contains several hundred different objects. Automatic recognition and linking of IFC objects and Calcus elements has to be pre-configured by giving the Calcus elements the same name as the IFC objects. This requires homogenous naming of objects in the model and that the element names in Calcus are spelt in the same way. Calcus element register has therefore to be standardised with elements which correspond to the objects in the object library. Each object in the library must have a corresponding element in Calcus. The creation of Calcus elements should therefore be a part of the object creation process for new objects in the library.
5.2. BuildingBIM Element Register An element register for BuildingBIM was created in order to achieve automatic recognition of IFC objects when imported to Calcus during the project. The elements in this register were named according to the object names in the BuildingBIM model. The objects in the BuildingBIM model are standard objects from Skanska’s BIM object library. The price lines used in the BuildingBIM element register are taken from standard price line register in Calcus, as it is currently only these which contain greenhouse gas emissions for materials in addition to price.
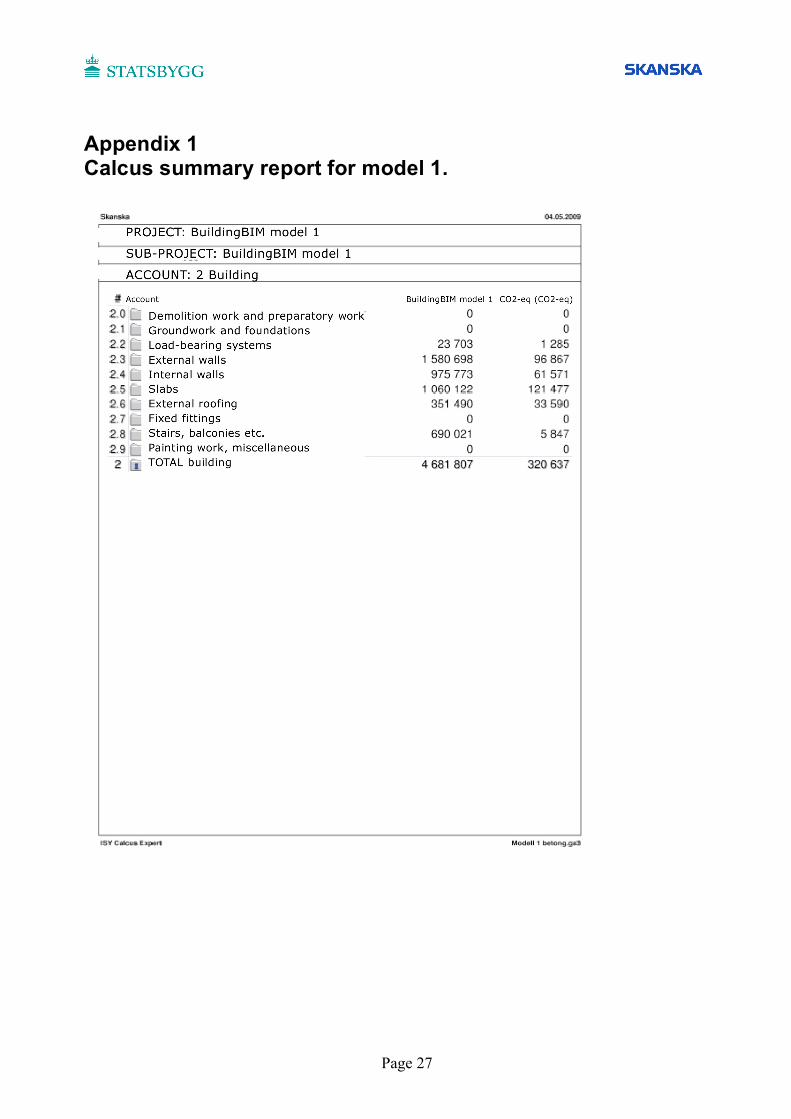
5.3. Calcus results After import to Calcus and a re-examination of the connection between objects and elements and several manual connections, Calcus returned the following results:

Page 11
TOTAL calculation Model 1 Concrete walls Model 2 Climate walls Cost (NOK million) 4.68 5.84 Greenhouse gas cost (ton CO2 equivalent) 320.6 325.4
Table 1 Calcus results When summarising a Calcus project, the costs are divided per main division of the building (according to the table of building elements). This is displayed in the screen below. By replacing the load-bearing concrete walls in model 1 with light external walls, you can see that the greenhouse gas impact for the external walls is reduced in Model 2 while the cost increases. In Model 2, load-bearing steel is not modelled, but the volumes for this were calculated in Calcus based on the BTA in the model. This comparison indicates that the BuildingBIM model with load-bearing concrete walls is both cheaper to build and generates less greenhouse gas emissions than the same building with load-bearing steel construction. Please note that it would be erroneous to conclude from this project that buildings with load-bearing concrete external walls are in general less expensive and generate less greenhouse gas emissions than buildings with load-bearing steel constructions.

Page 12
Figure 3 Comparison of Calcus summary for BuildingBIM models 1 & 2
5.4. Sources of error The Calcus process contains several potential sources of error. These are:
1. Incorrect automatic recognition of objects. 2. Faults and defects in the Calcus elements in relation to the BIM objects. 3. Lack of or faulty content in Calcus standard price line register. 4. Any faults in the greenhouse gas impact data for materials.
During the project, we rectified errors under item 1 above by manually connecting IFC objects to Calcus elements. Errors under item 2 above were solved by quality assuring the Calcus element content against the BIM objects in the Revit model. Type 3 errors were ignored as the only items missing from the price line register were minor details with a very insignificant contribution to the total greenhouse gas impact. Any errors in the greenhouse gas data from materials were also ignored. These data will be improved in time. For the purpose of the project, the focus was placed upon testing and comparing tools, and not the accuracy of the greenhouse gas data or the quality of modelling. For actual projects, errors type 1, 2 and 3 will be handled by the standardisation work on the BIM object library and Calcus element register. Rectification of errors in the greenhouse gas impact figures for materials relies on updates from NOIS for the greenhouse gas data set.
Page 13
6. The greenhouse gas accounts
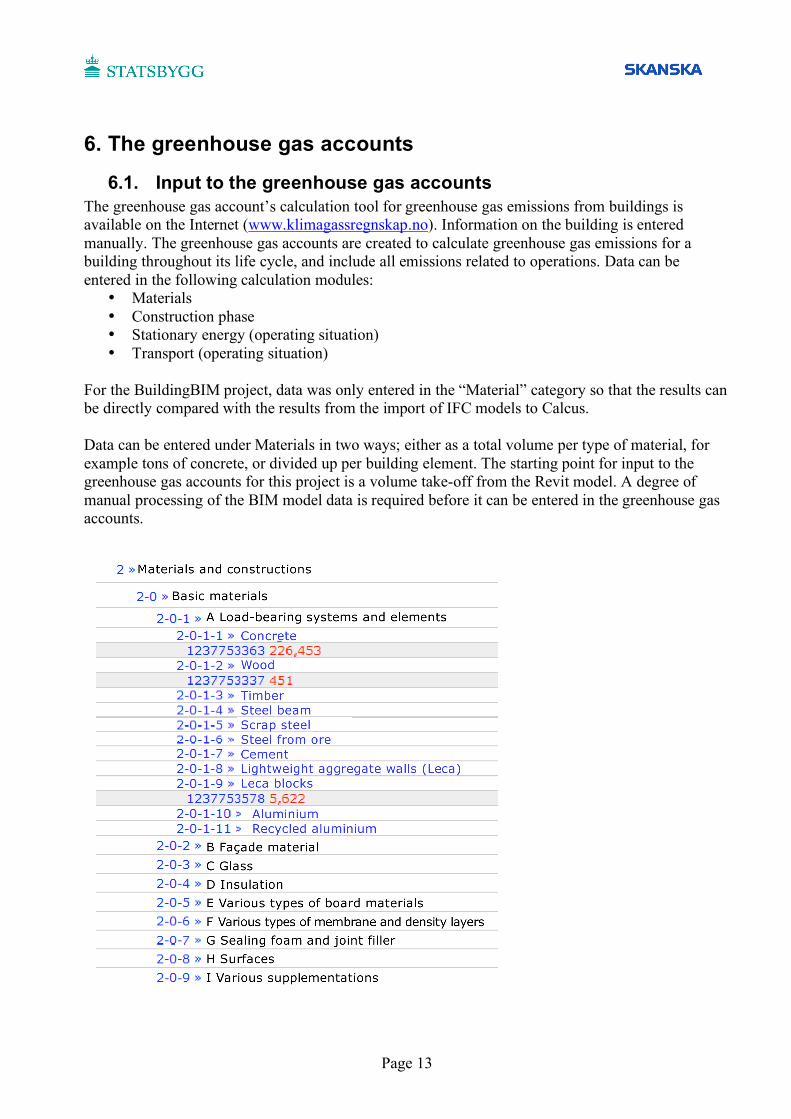
6.1. Input to the greenhouse gas accounts The greenhouse gas account’s calculation tool for greenhouse gas emissions from buildings is available on the Internet (www.klimagassregnskap.no). Information on the building is entered manually. The greenhouse gas accounts are created to calculate greenhouse gas emissions for a building throughout its life cycle, and include all emissions related to operations. Data can be entered in the following calculation modules:
• Materials • Construction phase • Stationary energy (operating situation) • Transport (operating situation)
For the BuildingBIM project, data was only entered in the “Material” category so that the results can be directly compared with the results from the import of IFC models to Calcus. Data can be entered under Materials in two ways; either as a total volume per type of material, for example tons of concrete, or divided up per building element. The starting point for input to the greenhouse gas accounts for this project is a volume take-off from the Revit model. A degree of manual processing of the BIM model data is required before it can be entered in the greenhouse gas accounts.

Page 14
Figure 4 Division of Basic material in KGR. The red figures show input under 2-0-1 “Load-bearing systems and elements”
6.2. Volume take-off from Revit models All sub-objects in Revit which represent a physical object have a material parameter. For a wall which comprises several layers, each layer has a material type as displayed in the figure below:
Figure 5 Revit wall object with layers
Figure 6. Revit dialogue box for editing of wall structure

Page 15
Each layer has a thickness defined in the structure of the wall object. Based on the length and height of the wall, the area and volume for each material in the wall can be calculated. Any openings in the wall for windows and doors will be subtracted by Revit. A material take-off from a Revit model (or MTO) comprises a volume take-off for all objects in the model. The material take-off in Revit is listed internally in Revit in a table (a Revit “Multi-Category Schedule”). The table can be formatted in many ways. In order to arrive at the total weight of materials utilised in the BuildingBIM model, the following properties are necessary:
• Family (Revit object group) • Type (Revit name for BIM object) • Material: Name (material describes what object consists of) • Material: Area (area of e.g. layer of specific material in a wall) • Material: Volume • Assembly code • Assembly description
Several properties are included to simplify identification. An example of Revit volume take-off for an object:
Figure 7. Part of a Revit MTO.
The list in figure 7 displays the total material area and volume utilised in all occurrences of object OW-250-GMG-steel. The total area of all occurrences of this object in the model is 493.96 m2. The material EU_Gypsum has double this area because there are two layers of gypsum in the wall. The volume take-off is exported from Revit to Excel for further processing. In Excel, all materials are added up so that the user can view the total volume per material volume and thereby calculate weight. The result is as follows:
Table 2: Basic materials from Revit MTO from Model 1 after processing in Excel

Page 16
Summary of material take-off to Excel After exporting the material take-off from Revit to Excel, the following stages are carried out manually in Excel:
1. Import to Excel – listed as volumes (area and volume) per object. 2. Pivot table function for listing materials per building element. 3. Row for material type entered manually. 4. Row for volume factors entered. 5. Row for actual volumes after factorisation entered. 6. Material volumes for Basic materials summed up.
a. Summing up of volumes of material types b. Volumes converted to weight
7. Material volumes per building element summed up. a. Separate summing up of volumes of material types per building
element b. Volumes converted to weight
Summing up in Excel required a good deal of manual work due to:
• The Revit template used by Skanska contains several materials for each building material. Insulation for example is listed as “EU_Stud insulated”, EU_Therm.Layer or EU_Core Insulated.
• Factors had to be entered for certain materials to correct for materials which occupy less than 100% of the volume. Examples of such materials are “EU_furring” and “EU_Wood Board V”.
6.3. Deficiencies and inaccuracies in Revit Material Take-off In Revit, walls are modelled as objects with several layers. The volume occupied by a layer is defined by the area of the wall and the layer thickness. As previously mentioned, certain layers will not occupy the entire volume allocated by Revit when the building is erected (for example furring and concrete floors with hollow-core slabs). In order to correct the volumes of such layers and objects, factors have to be entered. These factors were entered manually in Excel for the project. However, for future reference, this job should be done in Revit. Yet another problem encountered with volumes from Revit walls is that Revit does not model wall studs in light walls or climate walls. This means that these are not included in the volume take-off from Revit. The material type in the wall core specifics the core contents. For example, “EU_Stud Insulated” tells us that the core contains insulation and steel wall studs as construction. However, for this project, it was only accounted as insulation because it fills the largest part of the wall core. Once again, this can be managed in the future by entering factors for material types in Revit so that certain material types are divided into several different materials in the material take-off. One example is a wall core with Revit material “EU_Stud Insulated”. In the material take-off, this could be translated to 80% mineral wool and 20% wooden wall studs.

Page 17
6.4. Results from greenhouse gas accounts Three projects were created in KGR (1261, 1262 and 1240) to which the material volumes were entered in two different ways; “basic materials” (1261 and 1262) and “building components/elements” (1240). In project numbers 1261 and 1262, the material volumes shown in table 2 were entered as “Basic materials”, while for project number 1240, the material volumes were entered according to the building components/elements. This allows comparison of the results from the two different methods of entering data, while the latter method in KGR provides the best basis for comparison of the KGR results with the Calcus results for the same BuildingBIM model 1. This also allows a more detailed analysis of the differences in the results in terms of building elements. The following results were produced in KGR for BuildingBIM models 1 and 2: Input to greenhouse gas accounts
Greenhouse gas accounts project no.
BuildingBIM model Result tons CO2 (eq)
Basic materials 1261 Model 1 (concrete walls) 318.54 Basic materials 1262 Model 2 (light external wall) 309.48 Building elements 1240 Model 1 (concrete walls) 311.51
Table 3: The results from KGR for BuildingBIM model 1 and 2 The results available under “Summary” in the KGR gateway for the project. These can also be exported to Excel:
Figure 8: Greenhouse gas account summary with result for Basic materials, Model 1

Page 18
The result for ClimateBIM model 1 calculated when using the “Calcus method”, “KGR basic material method” and “KGR building element method” concur well with approximately 320, 319 and 312 tons CO2 eq. respectively, a deviation of only 3 tons CO2 eq. or just under 3%. A more detailed comparison is provided in chapter 7.
7. Comparison of the results from Calcus and KGR Tool Greenhouse gas emissions
(ton CO2 eq.) Greenhouse gas emissions with emission factors for electricity during material production (tons CO2 eq.)
Calcus 320.60 Emission factor for electricity consumption during material production cannot be changed throughout the project.
Greenhouse gas account (KGR project 1261 – input as basic materials)
318.54 467.89
Greenhouse gas account (KGR project 1240 – input as building elements)
311.51 504.99
Table 4: Comparison of the results for Model 1 For the project, the greenhouse gas footprint was calculated for two models, while the results from Calcus and KGR were compared for one of the models. Model 1 (apartment block with concrete external walls) generated results which concurred within a limit of 3%. This indicates that the two different methods for calculation of greenhouse gas emissions can provide results which concur closely. Please note that the tools share the same underlying data set in terms of emission factors for production of basic materials, so they are not entirely inter-independent. The difference in the methods is the way in which the material volumes are summed up and factorised. From a quality assurance point of view, the similarity in the results from Calcus and KGR indicates that the volume take-off from Revit and the volume calculation in Calcus are in accordance with each other. Electrical consumption during material production is not included in the comparison specification because Calcus still lacks a function to calculate such consumption throughout the project. In order to calculate these emissions in Calcus, a new function is required. In table 4, where the comparison of the KGR and Calcus results is displayed, a column has been added to indicate the increase in greenhouse gas emissions when electrical consumption during material production is calculated in KGR. The emission factor for electricity utilised is the average figure for OECD Europe, 0.357 kg CO2/kWh. The results including electricity show a significant increase in greenhouse gas emissions when a mix of electricity from different sources is included. The user is able to define the value of the variable for the emission factor for electricity during material production in KGR, based on the mix of electricity sources which are expected to be used for the materials in the building. Please note that, in such an event, this emission factor applies for the entire building and it is not possible to vary the factor for materials produced with other electricity emission factors. Comparison of Calcus with KGR methods (Basic materials) is only possible at the top level for the time being. Calcus’ summary report indicates greenhouse gas impact per building element (main

Page 19
division). At the time of writing, Calcus does not have the capacity to report costs or greenhouse gas emissions per material. KGR greenhouse gas emissions calculated with basic materials are divided per material and do not allow direct comparison with Calcus division. The minor differences in the results are most probably due to the lack of wall studs (wall studs are not modelled in Revit) in Revit MTO and therefore also the lack of input to KGR. These wall studs are taken into account in the price lines in Calcus. The elements in Calcus may also contain price lines for other materials which are modelled in BIM (for example, glue, joint filler, moisture and wind proofing etc.). Once again, this indicates a requirement for a standardised method of reporting material volumes which allow direct comparison. Comparison of Calcus with KGR (Building elements) is available with the main division in the table of building elements. The table below shows this comparison, and we can note that the concurrence for total greenhouse gas emissions is relatively good but that there are several variations within the main divisions. The greatest variation is between greenhouse gas emissions divided per building element which is for internal walls and which most probably is due to the lack of wall studs in the Revit model. Other variations are thought to be derived from the different methods of converting volumes used by the two tools. Method Calcus KGR (Building elements) Building element (tons CO2 eq.) (tons CO2 eq.) 2.2 Load-bearing systems 1.28 0.42 2.3 External walls 96.87 95.18 2.4 Internal walls 61.57 53.35 2.5 Slabs 121.48 122.31 2.6 External roofing 33.59 34.44 2.7 Fixed fittings (not modelled) 0.00 0.00 2.8 Stairs balconies etc. 5.85 5.82 Total 320.64 311.52
Table 5: Comparison of the results for Model 1 divided per building element
8. Conclusion The project succeeded in showing that both tools are capable of calculating greenhouse gas impact from a BIM with generic objects and materials. The results from the two methods concur within a margin which is acceptable. The project also shows that both methods are ready for use now, with relatively minor investments required. An element register has to be established and maintained for Calcus, which contains elements which concur with BIM objects in the model. In order to standardise the use of KGR in terms of BIM, the material take-off from the BIM modelling tools has to be standardised so that the material volume data for input to KGR is more easily available. The Calcus CO2 module is scheduled for commercial launch in June 2009. The greenhouse gas accounts are currently available as a free Internet service, but are to be considered as a research & development project. Potential users have to apply for access via email.

Page 20
It is difficult to compare these two tools without evaluating which one is “best”. Both tools are capable of calculating greenhouse gas footprints from BIM building models and for traditional projects. Calcus is currently better positioned as a calculation tool for builders, and Calcus now intends to offer “free” greenhouse gas calculations. In Calcus, you can also construct calculations manually or via imports from an IFC model. In KGR however, you can evaluate a building’s life cycle greenhouse gas emissions which include infrastructure-related load, stationary energy consumption and transport throughout the life cycle and operation of the building. In Calcus, tests were run on replacement of objects in a BIM to see what impact this would have on the greenhouse gas footprint. The load-bearing concrete walls were replaced with climate walls. The results clearly display how price and greenhouse gas impact change. This worked as expected and can be viewed as a demonstration of how Calcus and BIM can be utilised in practice. KGR does not have this functionality at the time of writing.
9. Future initiatives
9.1. Theoretical and factual greenhouse gas impact for buildings In the ClimateBIM project, we have worked with generic BIM models and greenhouse gas impact data. In practice, greenhouse gas analyses executed during the drawing board phase and/or detailed engineering phase will not reflect the factual greenhouse gas impact for an erected building. In order to identify the factual greenhouse gas impact from the materials in a building, all products involved in the building activity have to be supplied with FM documentation (FM stands for facilities management) which contains environmental product declarations (EPD) with greenhouse gas emissions. These product-specific greenhouse gas emissions can then be added up in a number of alternative ways.
1. The traditional method involving collection of FM data. 2. The greenhouse gas impact is transferred to the model as one of the FM parameters on
product-based objects in a product-specific BIM. 3. Calcus or similar calculation tool with a product-specific price line register.
Alternative 2 is the preferred solution with BIM as central carrier of information for a building project. The BuildingBIM eCommerce project has created and demonstrated a solution for this which is documented in the project report. The flow of work in the eCommerce project is governed by generic objects in a BIM, following a process for ordering, procurement and delivery. Upon delivery of the product to the building site, several parameters for the relevant generic object in the IFC model are updated to include FM information. For the eCommerce project, this form of update was carried out in the model server where the IFC model is stored. The eCommerce gateway and model server exchanged information in ifcXML format. An alternative method of transferring product-specific greenhouse gas data to a BIM is to replace generic objects in the generic BIM with product-specific objects which contain greenhouse gas data as one of the FM parameters for the object. The two main challenges faced when updating a BIM with product-specific greenhouse gas emission data are; firstly, making sure all the suppliers provide greenhouse gas emission data with all building

Page 21
products as a part of the FM documentation and secondly, where to place the information in the IFC model. Greenhouse gas emission data for building materials will in the future be delivered on EPDs (environmental product declarations) together with other environmental indicators for the product. Work on the formats and methods for storage of such data such as properties for objects in IFC models should be initiated as a cooperation project between EPD Norge and the relevant software suppliers. In the BuildingBIM eCommerce project, the FM information created in the IFC model upon delivery was stored in Archicad-specific parameters and Psets (property sets). Even though a non-proprietary exchange format was utilised, the information is stored in PSets which belong to a certain BIM modelling application. The building industry has to join forces to determine where not just greenhouse gas information shall be stored in IFC but also the rest of the FM information. The IFC format is complex and comprehensive, involving numerous properties which can be linked to objects. It is possible that the IFC format actually contains more parameters today which suit the Norwegian building industry’s requirement for FM information, but that the level of knowledge of the format content is insufficient in Norway. In order to make the absolute most of IFC, all those involved in BIM work need advanced training in content, structure, export and manipulation of the IFC format. There is also a need for increased willingness to share this expertise. Alternative 3, which utilises Calcus, should be relatively simple to implement as long as greenhouse gas impact data is provided from the building material suppliers. An element register has to be established in addition to a price line register which contains product-specific greenhouse gas data. The IFC model also has to be imported to a new Calcus project which makes use of product-specific registers. Responsibility for documentation of greenhouse gas emissions for a building should be distributed as follows:
• Emission data for the different stages of the production chain until a component has been completed and supplied to the supplier’s warehouse should be documented by environmental product declarations.
• Collection of transport data from the supplier’s warehouse to the building site and any emissions in connection with assembly should be handled by the contractor.
The collection of emission data for transport of materials to the building site becomes complex if it is required to be accurate, due to the number of suppliers involved in a building project. KGR has implemented a simplified method for estimating emissions related to transport to the building site. This is based on the number of trips made by trucks and lorries to the building site. While this method cannot provide an accurate figure for emissions from transporting materials to the building site, it does provide an indication of the scope of emissions from the last transport stage.

Page 22
Proposal for distribution of responsibility for greenhouse gas emissions data
Figure 9: Proposal for distribution of responsibility for reporting greenhouse gas emission data in
building materials
9.2. Further development of the generic greenhouse gas impact database
The data set for greenhouse gas emissions from production of building materials used by KGR and Calcus is based on a report from Cicero dated 2006 and revised in January 2008. The data set requires maintenance and further development. Responsibility for the operation and further development of the greenhouse gas data set should be allocated to an impartial company/organisation within the building industry. The issue of data set storage also requires evaluation. In order to keep the data set up to date and to prevent sources of error, the data set could possibly be made available for periodical download directly to tools which utilise the data set. This would eliminate the need for developers who use the data set to create a separate table which is sent to customers for every update. Furthermore, the data set should be controlled and quality assured by a third party organisation. With KGR, the user does not have the capacity to change a greenhouse gas factor for a material. The advantage of this is that users cannot change these values to shed the models in a better environmental light. The disadvantage is that the selection of alternative production methods for raw materials (for example, replacing new steel with recycled steel) cannot be displayed in the generic model. This type of change will become increasingly appropriate even during engineering phases, as requirements arise for buildings with reduced greenhouse gas emissions. In Calcus, users are able to change the emission factors on the price line (i.e. at object level) but cannot change a material’s greenhouse gas emission factor for the entire project.
Phases in the production chain for a general building component
Greenhouse gas data documented by supplier: • Requires environmental product declarations
which contain greenhouse gas data. - Needs substantiation in authority requirements
• Requires tool or procedure for import to BIM via FM parameter for product-specific objects
Emission data is calculated by contractor: Requires tool with capacity to: - Calculate emissions from transport stage production site to building site - Handle numerous suppliers and transport stage distances
Transport to secondary production
Extraction of raw material
Transport – exploitation for primary production
Fitting Transport to building site
Secondary production composition of components
Raw materials converted to components

Page 23
9.3. Generic greenhouse gas figures directly from BIM? A building information model can receive input with new information on the model and the objects in the model in the form of new parameters. It is therefore possible to enter greenhouse gas emission data as parameters connected to materials in a BIM. With greenhouse gas data for materials included in the model, users could generate a greenhouse gas footprint for a building directly from the model together with a volume take-off. This method naturally provides an advantage in that the user does not need to transfer data to other systems for calculation of greenhouse gas emissions. An organisation which chooses to execute greenhouse gas calculations using this method will save perhaps on software licence costs, IT administration costs and training costs. However, the initial investment will require significant funding for:
• Set-up of the BIM tool. • Maintenance of the CO2 greenhouse gas data set.
A trial run of the above method was carried out in a simple Revit model, to demonstrate that it was possible. New material was entered for density and greenhouse gas emissions per kg material. Using this data, the greenhouse gas emissions could be calculated in material take-off as shown below. This method has not been tested on the BuildingBIM models, and a comparison between Calcus and KGR results is therefore not possible for this project.
Figure 10: Demonstration of greenhouse gas emission data directly in the Revit model
A system specially developed for greenhouse gas impact calculation will also lack a standardised method which provides appropriate comparison of results from different solutions for a building. The information regarding greenhouse gas impact will be sent to tool-specific parameters in the model, and this will prevent any standardisation of greenhouse gas data from different BIM modelling tools.
9.4. Criteria and requirements from the authorities At the time of writing, there are no requirements which limit greenhouse gas emissions from production of materials in buildings. Until the time that building authorities introduce such requirements, greenhouse gas emissions are calculated for buildings on a voluntary basis. Statsbygg has been at the forefront of any requirements for reductions in greenhouse gas emissions for the building industry with their development of greenhouse gas accounts (klimagassregnskap.no) and with their targets specified in the report entitled “Climate-related challenges for Statsbygg”. Skanska has plans to provide greenhouse gas emission calculations to builders upon request. It is unlikely that

Page 24
the entire building industry will start evaluating greenhouse gases when selecting materials until regulations or incentives are introduced. Greenhouse gas calculations must be presented at an early stage during engineering if the basic data is to be available in time for the builders to make the correct material choices. If we are to reach the global goals for lower greenhouse gas emissions agreed upon in the Kyoto agreement, the building industry will have to also regulate their emissions. This is achievable via a quota system related to for example the number of kilograms of CO2 eq. emissions permitted per m2 or by allocating awards to buildings with low greenhouse gas emissions. The LEED system from the USA has been developed independently of the public authorities but has now been adopted by a number of cities and states along with authorities in other countries, as criteria for permitting building work. So far, there is no direct reward system for low greenhouse gas emissions from materials. The system is subject to continuous development, and a future version of LEED should include an increased focus on greenhouse gas emissions.
9.5. Suggested improvements to the tools During the project, a number of deficiencies and potential areas for improvement were observed in Calcus, KGR and BIM/Revit. These are described below: Calcus: The version of Calcus used in the project is a beta version. Several of the observations made regarding Calcus during utilisation for the ClimateBIM project will result in system improvements before the product is released for sale. The greenhouse gas calculation module (CO2 module) is scheduled for commercial launch at the start of June 2009.
• Increase in reporting capacity. The potential to report greenhouse gas emissions in all existing Calcus reports.
• Report displaying greenhouse gas emissions per material volume (corresponding to “Basic materials” in KGR).
• Report listing manual changes to emission factors. • Greenhouse gas emissions in all the reports so that costs and greenhouse gas emissions can
be evaluated on several levels. • Simplified method for replacing greenhouse gas factors from the data set where materials
from other sources are used (for example, recycled materials, materials with alternative production processes or imported materials). Adjusted factors require documentation in a report.
• Capacity to enter emission factors for electrical consumption during material production. Greenhouse gas accounts:
• Improved interface for reading and editing input to entries. Capacity to filter entries without input.
• Improved reporting capacity. For example, reports which summarise input for each module in KGR.
• BIM integration. Capacity to import IFC models with automatic calculation of greenhouse gas footprint. In order to avoid KGR with IFC integration only providing one variant of Calcus’s interpretation of IFC, a greenhouse gas account IFC reader could function as follows:

Page 25
o The IFC model is read to KGR. o KGR interprets the IFC model and generates a structure based on the IFC structure. o KGR lists all “BIM materials” in the IFC model. Capacity to have more materials in a
BIM than the actual building material in the building. o The user connects BIM materials to KGR materials and any volume factors are
entered (for example furring – only 17% of the volume contains material). For example, EU_concrete, EU_Concrete in situ will become Concrete in
KGR. o KGR issues reports of greenhouse gas emissions at object level, object type level, per
floor, per material and per building element. o KGR generates project settings so that an amended IFC model can be downloaded to
the system. • Life cycle functions for all materials/building elements. • Capacity to store KGR projects as a new project without having to type in all information
several times. • Capacity to replace greenhouse gas emission factors from the data set where materials from
other sources are used (for example recycled materials, materials with alternative production processes or imported materials). Adjusted factors must be documented in a report.
• Capacity to view how entries calculate emissions (reader access only). Modelling tool/Revit: Revit was used as the modelling tool for this project. The first items for improvement apply in general to modelling, where the model is to be used for calculation of greenhouse gas impact:
• Limit the number of material types in the model. Materials in BIM models are often used to control the appearance of objects in the model and visualisation. There may be several types of concrete, so that the colour can be individually controlled for these. When the same materials are used for volume take-off, there will be more “BIM materials” than the actual building materials.
• Standardise volume take-off from the model. • Adjustment of volumes for geometric volumes which are not filled 100% with materials.
Examples of this are furring and wall studs. • Capacity to model wall studs in walls. • More Revit internal parameters required in Multi-Category Material Take-off.
Revit specific errors observed are as follows:
• Objects in category IFC_railing are not included in Revit “Material Take-off”. This issue has been reported to Autodesk via CAD-Q support.

Page 26
10. References
1. Climate-related challenges for Statsbygg – Zdena Cervenka – Statsbygg 2. Buildings materials and CO2, Western European emission reduction strategies – D. J.
Gielen – ECN (The Netherlands Energy Research Foundation) 3. Greenhouse gas accounts for building emissions from material production – summary –
Cicero
11. Appendices
3. Calcus summary report for models 1 and 2 4. Cicero summary report on greenhouse gas emissions from production of building
materials
Page 27
Appendix 1 Calcus summary report for model 1.

Page 28
Calcus summary report for model 2.

Page 29
Appendix 2 Greenhouse gas accounts for building emissions from material production – summary Cicero 19 September 2006 Revised January 2007/January 2008 Summary A literary study of greenhouse gas emissions from production of different building materials has been carried out. Emissions of carbon dioxide (CO2), methane (CH4) and laughing gas (N2O) and the gases containing fluoride HFK, PFK and SF6 occur during production of building materials and increase global warming. A rising concentration of these gases in the atmosphere is therefore to be avoided. The selection of building materials will have an influence on the total environmental impact of a building. The results of this study will be used to compile a set of greenhouse gas accounts for buildings. 1. Aspects of the greenhouse gas accounts The collection of data for the individual building materials in this project is based on a literature study and several sources have been utilised to cover all relevant material. The data includes emissions from raw material take-off, transport to production site and production. The majority of data reflects emissions in Norway. In cases where different calculations are available, the source with the estimated highest proximity to current Norwegian conditions has been utilised. However, some of the data sources are more than 10 years old. The description of the individual materials in the greenhouse gas accounts will clarify the premises applied. The different greenhouse gases vary in their impact on the environment. There is also a variance in the length of time the emission of the different gases continues to impact the composition of the atmosphere. CO2 for example has a relatively weak but very long-term impact on the climate, while methane has a much more powerful but short-term impact. In order to compare the climate impact of the different gases, it is common to utilise GWP values (Global Warming Potential). By multiplying by the GWP, emissions of other greenhouse gases such as CH4, N2O, HFK, PFK and SF6 are converted to so-called CO2 equivalents. It is normal to assume that emission reductions of one ton CO2 has the same effect as reducing emissions by one ton of CO2 equivalents for any other greenhouse gas. GWP values (the values utilised in the Kyoto protocol) Greenhouse gas Climate impact over 100 years (GWP values as
CO2 equivalents) Carbon dioxide, CO2 1 Methane, CH4 21 Laughing gas, N2O 310 Hydrofluorcarbons, HFK 140-11 700 Perfluorcarbons, PFK 6 500 – 9 200 Sulphur hexafluoride, SF6 23 900

Page 30
2. Materials included in the greenhouse gas accounts Emission figures converted into CO2 equivalents will be specified for each material, in addition to energy consumption during production. Emissions originate both from energy consumption and from the production process (extraction and input of other materials than energy materials)1. For certain materials, it has been more difficult and more demanding to achieve access to emission figures from the production process. In several instances, a number of data sources have been compared and the consistency of data checked for a cross section of different building materials. Based on the calculations, the volume of the different materials in a building project can be determined. Building site wastage should also be included in the calculation. A building project will thus have the capacity to set up a set of greenhouse gas accounts based on own estimates and figures specified in the greenhouse gas accounts as follows. 2.1 Emission estimates The emission estimates are based on a literary review. Data from Fossdal, 1995, has been updated with Fossdal 2006, references provided as a footnote. A Load-bearing systems and elements – kg CO2-eq per ton material Code MATERIALS kg CO2-eq./ton Load-bearing systems and elements Revised 2006 Ref. A1 Concrete 115 122 2 A2 Wood 40 A3 Timber 50 A4 Steel beam Recovery Rate
96% 780 737 3
A5 Scrap steel RR 90% 245 710 4 A6 Steel from ore 1072 3215 5
A7 Cement 856 656 6
A8 Lightweight aggregate blocks (Leca blocks)
226
A9 Leca blocks (1 metre foundation wall)
161
A10 Aluminium (Bauxitt) 2 082 10634 7
A11 Recycled aluminium 287 801 8
1 Consumption of energy as raw material for example in plastic production is accounted for as process emissions. 2 Ready-mix concrete Unicon AS, NEPD no. 47N 2004 3 World Steel Life Cycle Inventory EU average Product: Sections (2000) 4 Environmental declaration Hot rolled steel plate RUUKKII Valid until 2008 5 World Steel Life Cycle Inventory EU average Product: Hot Rolled Coil BPRoute 2000 6 Norcem Standard cement FA, NEPD no. 24 N 2002 7 Environment Profile Report for the European Aluminium Industry (EEA) 2000 8 Environment Profile Report for the European Aluminium Industry (EEA) 2000

Page 31
In principal, the estimates have been taken from a study carried out by Fossdal in 1995, revised/verified by Fossdal in 2006. The exceptions are timber, where the figures are from USA EPA (2002) and steel beams which are taken from an EPD, the industrial association for environmental declarations. Moreover, emissions from aluminium production originate from Norwegian industry. Here, the estimates are based on reported emission figures to the Norwegian Pollution Control Authority (PCA) for the aluminium branch in total in 2005. The difference between the original and verified data is particularly significant for aluminium production. This is due to the difference between Norwegian and European industry. As it is equally likely that aluminium for a Norwegian building will be purchased in Europe as in Norway, it is thought that the highest figures are the most correct. The difference is also significant for steel. B Façade materials Code MATERIALS kg CO2-eq./ton Façade materials B1 Brick 165.5 B2 Mortar 185
Estimates taken from a study carried out by Fossdal in 1995 C Glass Code MATERIALS kg CO2 eq. /ton Glass Revised 2006 C1 glass9 609 820
Estimates taken from a study carried out by Fossdal in 1995, revised 2006 D Insulation Code MATERIALS kg CO2-eq. / ton Insulation Revised 2006 D1 D2 D3 D4 D5 D6
polystyrene10 glass wool (Glava) rock wool11 cellulose fibre12 polyurethane13 cellulose fibre
5412 876 774 166
4807 166
2900
1220 220
4210
9 Pilkington façade glass 10 Plastic Europe Polystyrene general purpose 1994 11 Rockwool Hardrock 1998 12 Norwegian cellulose insulation/Nordiska Ecofiber Norge AS 1999 13 APME (POLYOLS) Pages 32-39

Page 32
Estimates taken from a study carried out by Fossdal in 1995, revised/verified by Fossdal in 2006. The recycled glass content in glass wool in the 1995 Fossdal study is based on 30%. However, it should be noted that this volume has probably seen a significant increase over the 10 years since the estimate was made. Cellulose insulation is mainly manufactured from recyclable paper treated with fire-retardant chemicals. Different manufacturers use different types of chemicals, with a varying ratio of paper to chemicals. The manufacture of cellulose fibre is directly connected to the recycling of excess paper from collection points and should therefore not be considered in the context of cutting forests for cellulose and paper production. E Different types of board material Code MATERIALS kg CO2-eq / ton Different types of board materials Revised 2006 E1 Gypsum 1310 E2 Gypsum boards 1641 E3 Plywood14 333 E4 Chipboard15 45 185 E5 Porous fibre board /
asphalt board16 118 320
E6 Pressed fibre board 67 E7 MDF (Medium density
fibre board) 100
E8 Glulam (laminate) (kg/m3)
169.64
E9 Protan roofing17 2076 The estimates for the different board materials have been collected from a range of sources. Raw production of gypsum originates from Sjunnesson (2002) and this estimate has been accumulated with Fossdal’s (1995) estimate for production of gypsum board from gypsum. Plywood and laminate are estimates from Puettman and Wilson (2005). Please also note that this estimate is specified in kg/m3. Chipboard and fibre board are based on estimates in Fossdal (1995). MDF is based on estimates from USA EPA (2002) where greenhouse gas emissions from the production of MDF are calculated. Emissions from production of roofing represent an estimate from an EDP association for environmental declarations, based on production of Protan roofing.
14 Vänerply AB 1999 15 Forestia Gulv 1998 16 HUNTON FIBER AS Hunton underroof 2002 17 Protan 2004
Page 33
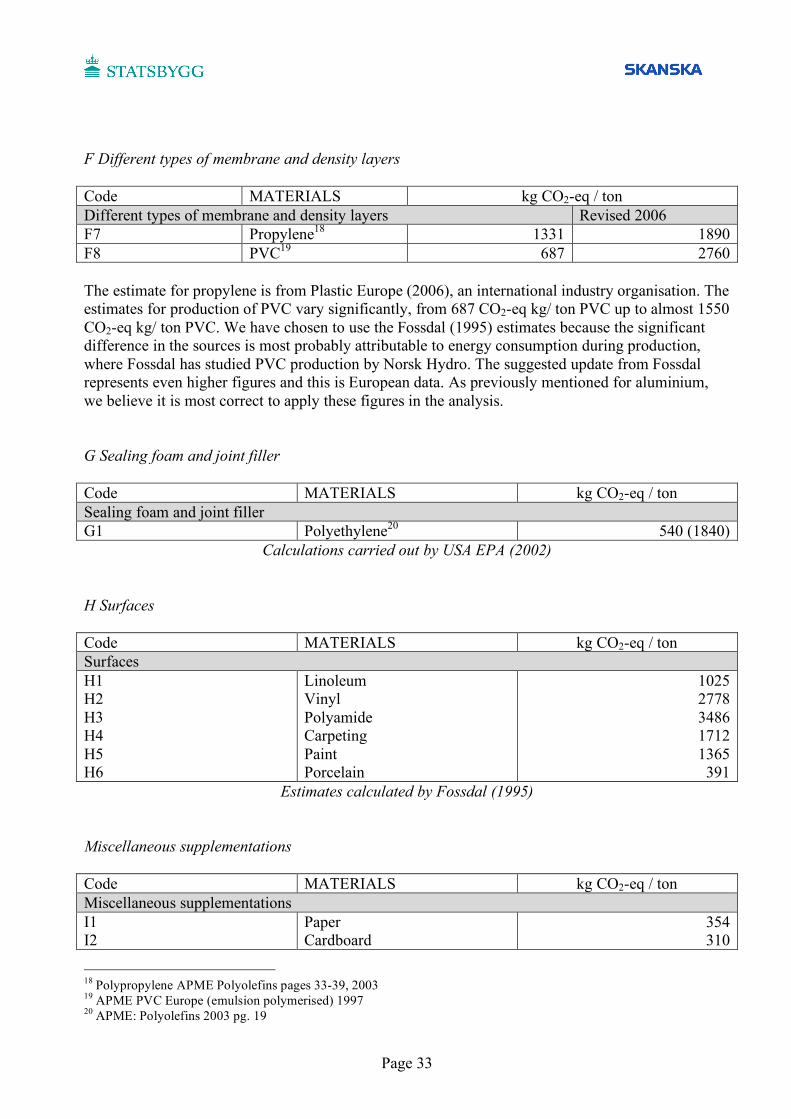
F Different types of membrane and density layers Code MATERIALS kg CO2-eq / ton Different types of membrane and density layers Revised 2006 F7 Propylene18 1331 1890 F8 PVC19 687 2760 The estimate for propylene is from Plastic Europe (2006), an international industry organisation. The estimates for production of PVC vary significantly, from 687 CO2-eq kg/ ton PVC up to almost 1550 CO2-eq kg/ ton PVC. We have chosen to use the Fossdal (1995) estimates because the significant difference in the sources is most probably attributable to energy consumption during production, where Fossdal has studied PVC production by Norsk Hydro. The suggested update from Fossdal represents even higher figures and this is European data. As previously mentioned for aluminium, we believe it is most correct to apply these figures in the analysis. G Sealing foam and joint filler Code MATERIALS kg CO2-eq / ton Sealing foam and joint filler G1 Polyethylene20 540 (1840)
Calculations carried out by USA EPA (2002) H Surfaces Code MATERIALS kg CO2-eq / ton Surfaces H1 H2 H3 H4 H5 H6
Linoleum Vinyl Polyamide Carpeting Paint Porcelain
1025 2778 3486 1712 1365 391
Estimates calculated by Fossdal (1995) Miscellaneous supplementations Code MATERIALS kg CO2-eq / ton Miscellaneous supplementations I1 I2
Paper Cardboard
354 310
18 Polypropylene APME Polyolefins pages 33-39, 2003 19 APME PVC Europe (emulsion polymerised) 1997 20 APME: Polyolefins 2003 pg. 19

Page 34
I3 I4
Asphalt Nails, stainless
35 1870
The estimates for paper have been generated by USA EPA (2002). The estimates for cardboard and asphalt are from Fossdal (1995). The nail estimates are from an EDP generated for Gunnebo industrier. 3. Summary During this study, we have reviewed a number of studies with estimates of the environmental impact of producing building materials. It is not easy to calculate the environmental impact of the production of building materials. The emissions rely on material consumption, transport routes to and/or between the production site and the distribution of energy sources during production. Once we have determined which materials have the most significance for environmental impact, it will be possible to improve the data applied. In a number of instances, the updates including estimates from Fossdal based on his archives show varying estimates. Some of these can be attributed to the differences between Norwegian and European production. As Norwegian companies mainly purchase from the European market, it is most correct to utilise the latter figures. As Fossdal is the original source in many cases, it is most correct to apply his proposed updates to the enclosed spreadsheet. References EPD, industrial association for environmental declarations, online: http://www.epd-norge.no/, http://www.nho.no/miljo/printart2680.html Fossdal, Sverre (1995): Energy and environmental accounts for buildings: production of building materials, accounts for homes and office buildings, Project Report / Norwegian research institute for buildings, ISBN: 82-536-0481-5 (h). Norwegian Industry (2005): Significant reduction in greenhouse gas emissions, online: http://www.norskindustri.no/getfile.php/Dokumenter/PDF/rapp-klimagasser%20-A1%202005.pdf Puettman, Maureen and Wilson, James (2005): Life cycle analysis of wood products: cradle to gate LCI of residential wood building materials, Wood and fiber science 37 pp 18-29, Corrim Special Issue Sjunnesson, Jeanette (2005): Life cycle assessment of concrete, master thesis Lund University Department of Technology and Society, environmental and energy systems studies. USA EPA (2002): SOLID WASTE MANAGEMENT AND GREENHOUSE GASES: A Life-Cycle Assessment of Emissions and Sinks, 2nd EDITION, EPA530-R-02-006 May 2002.

Project cooperation partners
Statsbygg: Zdena Cervanka and Diderik HaugSkanska BIM Department: Trine Kvåle Hervik, Kai Haakon Kristensen and Rupert HannaNOIS: Øyvind JensenCivitas: Eivind Selvig

Skanska Norge AS
Skanska Teknikk – BIM
Drammensveien 60
P.O. Box 1175 Sentrum
NO-0107 Oslo
Tel.: + 47 40 00 64 00
Fax: + 47 23 27 17 30
www.skanska.no
Statsbygg
Public Construction and Property, Norway
Biskop Gunnerus’ gate 6
P.O. Box 8106 Dep
NO-0032 Oslo
Tel.: + 47 81 55 50 45
Fax: + 47 22 95 40 01
www.statsbygg.no