Greenhouse Business Management Ben Beale Extension Educator-MCE St. Mary’s County Some slides...
83
Greenhouse Business Management Ben Beale Extension Educator-MCE St. Mary’s County Some slides adapted from Wei- Fe Uva; Cornell Extension
-
date post
21-Dec-2015 -
Category
Documents
-
view
217 -
download
3
Transcript of Greenhouse Business Management Ben Beale Extension Educator-MCE St. Mary’s County Some slides...

Greenhouse Business Management
Ben Beale
Extension Educator-MCE
St. Mary’s County
Some slides adapted from Wei-Fe Uva; Cornell Extension

Objectives
• Trends in Maryland Greenhouse Businesses
• Marketing Strategies for Greenhouse Businesses
• Financials-Enterprise Budgeting

Why do we care?
• Rising population base of affluent suburbanites in reach of Maryland growers
Source: Census 2000 analyzed by the Social Science Data Analysis Network (SSDAN).

1953-Agricultural land

1982

1992
Why do we care?
• Rising population base of affluent suburbanites in reach of Maryland growers
• Growing interest in gardening, landscaping, and plants.

Why do we care?
• Rising population base of affluent suburbanites in reach of Maryland growers
• Growing interest in gardening, landscaping, and plants.
• Horticulture industry is the fastest growing sector in American Agriculture.

Greenhouse and nursery crops: Wholesale cash receipts
0.0 5.0 10.0 15.0 20.0
1992
1994
1996
1998
2000
2002
Billion dollars
Nursery and other greenhouse Floriculture

Production trends of floriculture crops
0
1,000
2,000
3,000
4,000
5,000
6,000
1994 1995 1996 1997 1998 1999 2000 2001 2002 2003
Mill
ion
$
bedding and garden plants potted flowering plants
foliage plants cut flowers
propagative material and cut greens

Floriculture crops: Average sales per grower
0
200,000
400,000
600,000
800,000
1,000,000
1,200,000
1,400,000
1,600,000
1993 1994 1995 1996 1997 1998 1999 2000 2001 2002 2003
Do
llar
s
West South Midwest Northeast

Maryland
0
50,000
100,000
150,000
200,000
250,000
300,000
350,000
1994 1995 1996 1997 1998 1999 2000 2001 2002 2003
Maryland
ERS Data. $ in 1000. Greenhouse and Nursery Crops

Now for the Bad News!
• The majority of small businesses fail within the first 2 years.
• Most folks starting a greenhouse do so because they enjoy growing, not the business side.


The Importance of Management

SWOT analysis:
The SWOT analysis is simply a tool for organizing your thoughts and determining areas of competitive advantage.
Looks internally at:
•Strength
•Weaknesses
Looks externally at:
•Threats
•Opportunities
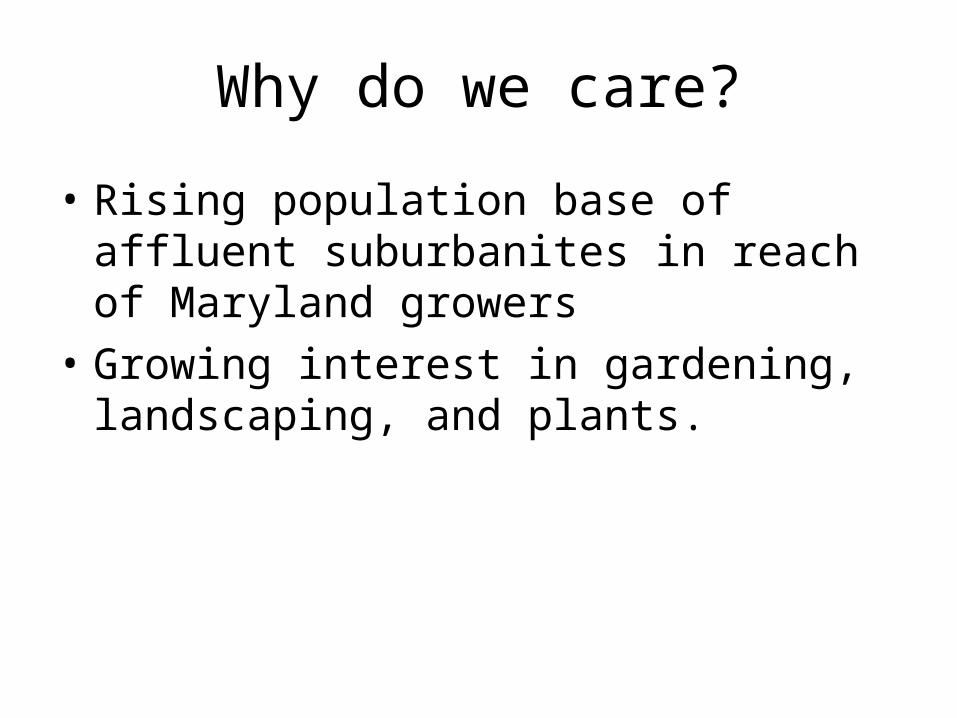
Internal Strengths: Strong local recognition of name Excellent internal efficiency with
management, communication and humanrecourses
Good communication skills and publicrelations
Very flexible horizontal structure Ability to specialize and customize each
product to customer needs Close to consumers Very good financial standing, low
debt/asset ratio Enjoys raising beef Internal production synergies through
feeding grain products through beef Facilities used for tobacco easily converted to beef
barns
External Opportunities Local Population base expanding offering
more customers Regional population base (within 4 hour
drive) represents 2/3 of total US population Disposable income very high in
surrounding area Large # of specialty restaurants and shops
in area Government subsidies and grant programs
for farmers direct marketing Tobacco conversion program provides
financial support for switching to otherenterprises
Limited competition in direct sales ofdifferentiated beef products
Consumer loyalty to local farm products Foreign disease scares increase value of
domestic beef
External Threats Local population base expanding-more
expensive land, large farm operations notcompatible with urban settings (noise,odors)
Traffic congestion prevents movement oflarge equipment
Unemployment low in area Farm industry very segmented and
specialized suited to large economy ofscale-leave little room in profits for smallproducer
Tobacco production not expected to last inlong term future
Internal Weaknesses: Production inefficiencies compared to
larger farms Most expertise in area of tobacco
production Marketing culture of farm based on
wholesale, commodity markets Limited experience in marketing
management

Overall objective-profit
Strength of SMP
Success of Execution
SMP not good
Execution not goodFigure 1

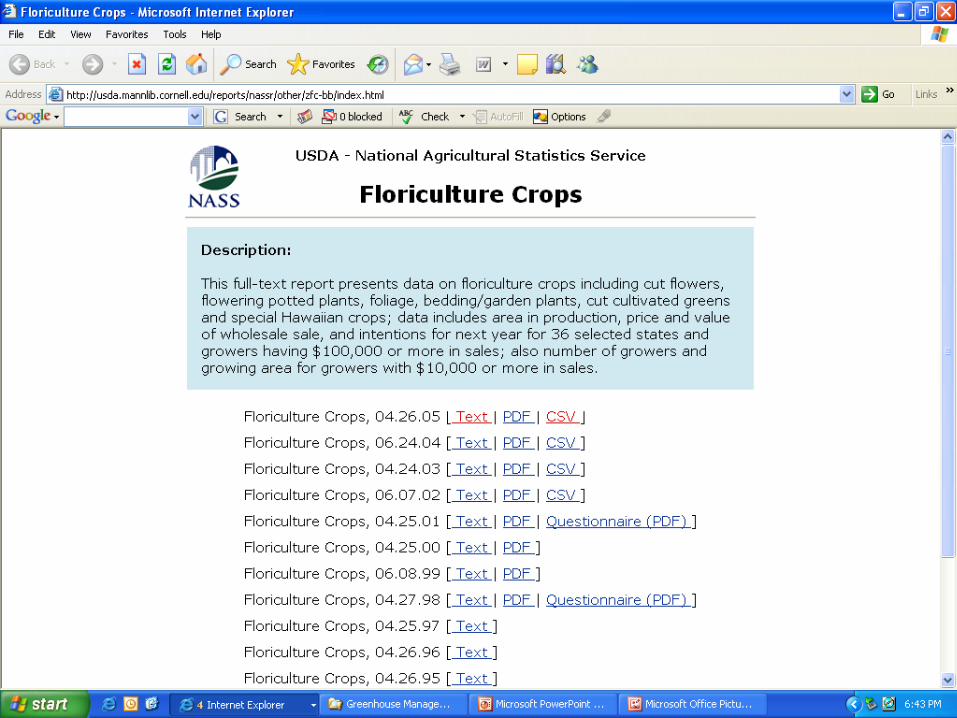
Cornell Greenhouse Cornell Greenhouse Business Summary, 2000 Business Summary, 2000
- Growing Greenbacks in Your - Growing Greenbacks in Your GreenhouseGreenhouse
Wen-fei Uva and Steve RichardsDepartment of Applied Economics and Management
Cornell University
http://hortmgt.aem.cornell.edu/resources/presentations.htm

2000 Greenhouse Businesses Profile2000 Greenhouse Businesses Profile• 29 New York Greenhouses
– 12 Eastern NY– 11 Central NY– 6 Western NY
• Marketing Channel: – 14 mainly wholesale, 15 mainly retail
• Major Crops:– 21 produced mainly bedding/garden plants– 5 produced mainly potted flowers– 1 greenhouse vegetables & herbs– 1 propagative material, 1 cut flowers

Size of Greenhouses Surveyed
01234567
1,440 15,580 29,720 43,860 More
Size (sq ft)
fre
qu
en
cy
Wen-fei Uva and Steve RichardsDepartment of Applied Economics and ManagementCornell University
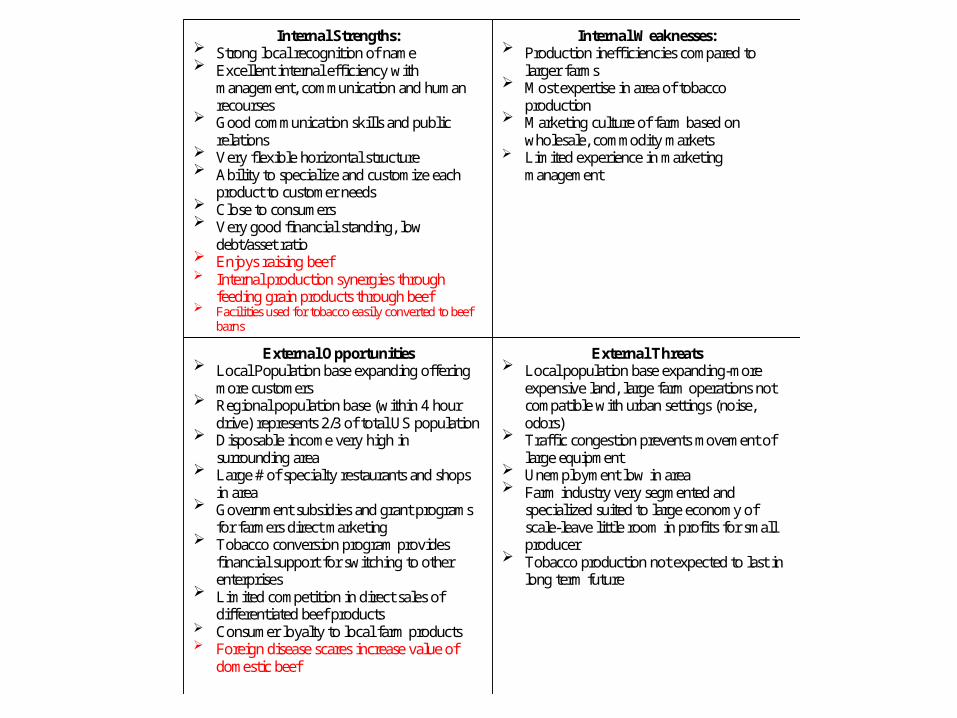
Scope of Greenhouse Study:Scope of Greenhouse Study:
Ave Size (SqFt) Ave Sales % G.M.All Greenhouses 38,500 576,000$ 27%
Wholesalers 55,500 837,500$ 26%
Retailers 23,000 334,000$ 28%
Wen-fei Uva and Steve RichardsDepartment of Applied Economics and ManagementCornell University

Wholesale Greenhouse 2000 Income Statement
WHOLESALE FIRMS >50% Amount Per Sq Foot % of SalesSales 843,403 14.67$ 100%Less: Cost of Goods Sold 664,711 11.10$ 74%Accrual Gross Margin 178,693 3.58$ 26%
Less: Overhead Expenses 162,473 2.98$ 20%Accrual Net Income 16,219 0.60$ 6%
Wen-fei Uva and Steve RichardsDepartment of Applied Economics and ManagementCornell University

Cost of Goods Sold: Wholesale
• Labor 44%
• Plant Material 23%
• Packaging Materials 11%
• Heating 6%
• All Other COGS 16%
Wen-fei Uva and Steve RichardsDepartment of Applied Economics and ManagementCornell University

Overhead Expenses: Wholesale
• Land Rent 18%
• Repairs 18%
• Depreciation 17%
• Insurance 12%
• Interest 12%
• Other Overhead 23%
Wen-fei Uva and Steve RichardsDepartment of Applied Economics and ManagementCornell University

Retail Greenhouse 2000 Income Statement
RETAIL GREENHOUSES Amount Per Sq Foot % of SalesIncome 304,510 13.90$ 100%Less: Cost of Goods Sold 219,612 10.56$ 73%Accrual Gross Margin 84,898 3.35$ 27%
Overhead Expenses 49,564 2.64$ 23%Accrual Net Income 35,334 0.71$ 3%
Wen-fei Uva and Steve RichardsDepartment of Applied Economics and ManagementCornell University

Cost of Goods Sold: Retail
• Labor 37%
• Plant Material 27%
• Hard Goods 7%
• Heating 6%
• All Other COGS 23%
Wen-fei UvaDepartment of Applied Economics and ManagementCornell University

Overhead Expenses: Retail
• Depreciation 20%
• Insurance 18%
• Miscellaneous 15%
• Interest 13%
• Repairs 11%
• Other Overhead 23%
Wen-fei Uva and Steve RichardsDepartment of Applied Economics and ManagementCornell University

Average Balance Sheet
ALL GREENHOUSES Year Start Year EndASSETS
Current Assets 176,429 187,411 Intermediate Assets 72,846 65,269 Long Term Assets 191,999 187,694
Total Assets 441,274 440,374
LIABILITIESCurrent Liabilities 54,895 53,404 Intermediate Liabilities 23,660 13,872 Long Term Liabilities 110,718 131,115
Total Liabilities 189,274 198,391
Net Worth (Assets-Liabilities) 252,000 241,983

Average Cash Flow Statement
Cash Flow From Operating ActivitiesCash Farm Income 56,127 Less: Cash Withdrawals 44,747
Net Provided From Operations 11,380 Cash Flow From Investing ActivitiesSale of Assets 5,167 Less: Capital Purchases 18,657
Net Provided From Investing (13,491) Cash Flow From Financing ActivitiesCash Inflow From Financing 35,890 Less: Cash Outflow From Financing 27,587
Net Provided From Financing 8,304 Cash Flow From Reserves
Beginning Cash/Checking/Savings 46,733
Less: Ending Cash/Check/Savings 47,515
Net Provided From Reserves (782)
IMBALANCE 5,411

First Question-What is marketing?
• Marketing is:– Organizing the resources of the firm toward understanding
customers needs and wants and offering products and/or services that meet those needs. (Russell Winer-Marketing Management)
– The purpose of a business is to create and keep a customer. To do that you have to produce and deliver goods and services that people value and want at prices and under conditions that are reasonably attractive relative to those offered by others to a proportion of customers large enough to make those prices and conditions possible. (Theodore Levitt-Marketing Theorist)
– Doing something for someone(s) better than another can in order to make a profit. (Ben’s farm guess)

Marketing Functions:
•Price
•Product
•Promotion
•Distribution

Products
PricePlace
Promotion
TargetMarket
Marketing is finding, developing, and profiting from opportunities
Your target markets will determine your production and marketing practices, Not vise versa.
Slide From: Wen-fei UvaDepartment of Applied Economics and ManagementCornell University


Low- Cost leadership Focus-Niche Strategy based on low cost
Best-Cost provider
Focus strategy based on differentiation
Broad differentiation
Low Cost/Low Price
Differentiation
Broad Narrow / Focused

What Opportunities Exist?
• Low-Cost Provider Strategy– Target Market: Chain Super Market and Box
Stores– Large Operations with market partnering
agreements– Mass market with commodity type pricing– Efficiency based

Wholesale Production-Contract Production
• Agreement with landscape and retail operations for production of particular or specialized cultivars– Contractors/builders– Smaller individual retail centers– On-site location advantages

Service Oriented Opportunities
• Production of material plus installation or service agreement– Landscaping-Production of “landscape
pillows” for high end market– Pick your own/ Plant a tree service– Rentals items -Parties, special occasions,
seasonal items, interior-scaping. Mostly container production.
– Interior-scapes

Wholesale Production-Specialty Items (differentiated strategy)
• Competitive advantage in being able to produce a product of substantial attributes that outside, larger producers can not.
• Such attributes include:– Quality– Delivery flexibility– Specialized cultivars branded for specific area– Value added features
• Ability to predict future trends and customer desires

Finding your niche-Getting things in the right place.

Name of the Game:Name of the Game:Niche MarketingNiche Marketing
• Identify marketsIdentify markets
• Determine special needsDetermine special needs
• Position yourself to serve those marketsPosition yourself to serve those markets
• Find out what the larger producers can’t Find out what the larger producers can’t supply: What is too small for them?supply: What is too small for them?
• Look for ways to differentiate your product, Look for ways to differentiate your product, not only from what you grow, but how you not only from what you grow, but how you grow it, what you do with it, or how you grow it, what you do with it, or how you package it, or market it.package it, or market it.

Some Examples of Current Some Examples of Current Niche Market TrendsNiche Market Trends
• Fresh, in-season local produceFresh, in-season local produce
• Color, (white eggplants, blue potatoes)Color, (white eggplants, blue potatoes)
• Nostalgia, (traditional American comfort Nostalgia, (traditional American comfort foods, i.e. corn-on-cob, corn bread, foods, i.e. corn-on-cob, corn bread, vegetable varieties from several years vegetable varieties from several years ago)ago)
• Organic foods, people believe it is saferOrganic foods, people believe it is safer
• Edible and cut flowersEdible and cut flowers


Where are folks selling?
• Farmer Owned farmers market
• Community farmers markets
• Direct sales to local stores
• Sales to supermarket chains
• Sales to wholesalers and brokers
• On-farm sales• Contract growers

Developing an Enterprise Budget
GREENHOUSE BEDDING PLANTS (24'X100' DOUBLE LAYER PLASTIC) PER ACRE FOR YEAR 2006ITEM UNIT QUANTITY PRICE TOTAL
GROSS INCOMEBEDDING PLANTS FLATS 2100 $7.00 ######### -$ TOTAL GROSS INCOME #########VARIABLE COSTSSOIL MIX CUBIC FEET 500 $3.60 1,800.00$ CUTTINGS FLATS 2100 $1.00 2,100.00$ FLATS FLATS 2100 $0.33 693.00$ INSERTS FLATS 2100 $0.30 630.00$ PLASTIC COLOR TAGS PACK 20000 $0.02 400.00$ NITROGEN POUND 50 $0.34 17.00$ LIQUID FEED NUTRIENTS POUND 50 $1.00 50.00$ PLASTIC COVER (40'X100'-2LAYERS-$600/3YRS/0.5YR) ROLL 2 $300.00 100.00$
BANROT POUND 4 $31.00 124.00$ INSECTICIDES, MITICIDES 1 $60.00 $60.00UTILITIES (ELEC. FUEL-OIL) 100 $19.00 $1,900.00HAULING FLATS 2100 $0.20 $420.00LABOR HOURS 600 $7.00 4,200.00$
-$

Department of Applied Economics and ManagementCornell UniversityIthaca, NY 14853
Dr. Wen-fei UvaSenior Extension Associate
What is Your Profitability? What is Your Profitability?
- - Using Financial Records to Using Financial Records to Improve Business PerformanceImprove Business Performance

What Is Financial What Is Financial Management?Management?
• The ability to allocate financial resources in the areas which generate the greatest returnsgreatest returns.
• Financial Management DecisionsYou Need to Make:


* Pricing Your Product* Pricing Your Product
• One of the most critical components of marketing. A common concern!
• Critical in achieving sales and profitability
• Need to know your COSTS

* Making Business * Making Business DecisionsDecisions
• Are your sales covering your costs?
• Which product lines generate the most income?
• Should you operate year-round or shut down in the winter?
• Contributions to fixed costs
• Optimum mix of product lines
• Goal setting and increased efficiency

* Making Investment * Making Investment DecisionsDecisions
• Input substitution
Capital for labor: installing automated irrigation system or not?
Buying vs. raising your own bedding plants
• Enterprise changes
Whether or not to sell a particular product
Adding another operation to your business
• What is the best investment for my money

Are Your Financially Healthy Are Your Financially Healthy and Wise?and Wise?
Do you keep good financial records?
Keep records for more than just taxes!
Use a computer program!
Financial information should be at your fingertips at all times
Are Your Financially Healthy Are Your Financially Healthy and Wise?and Wise?
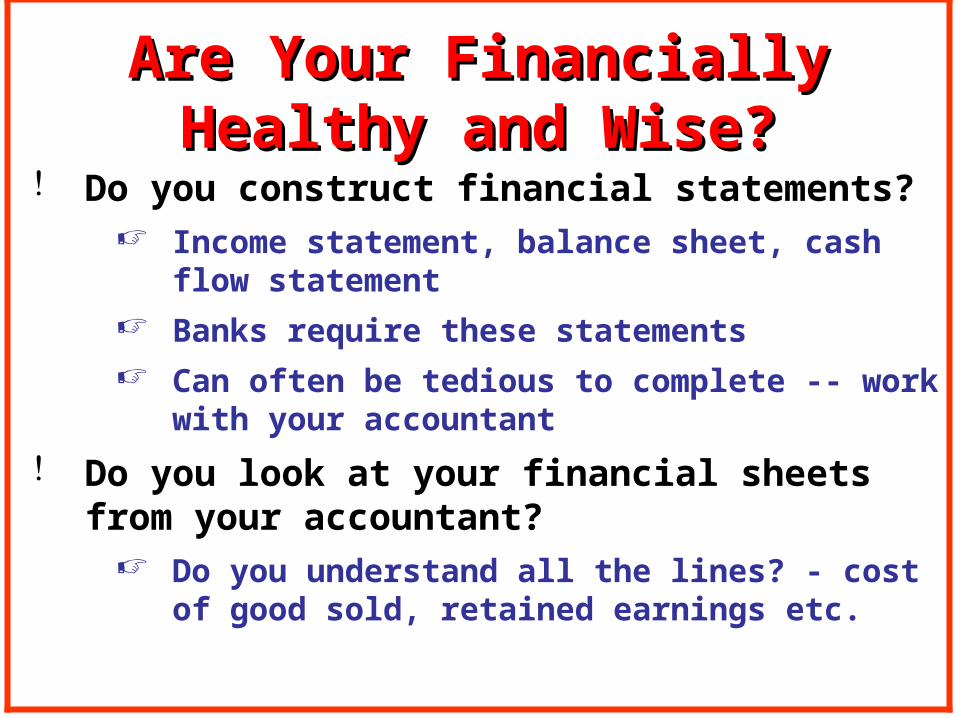
Do you construct financial statements? Income statement, balance sheet, cash
flow statement
Banks require these statements
Can often be tedious to complete -- work with your accountant
Do you look at your financial sheets from your accountant?
Do you understand all the lines? - cost of good sold, retained earnings etc.

Do You Perform Financial Analysis?
Cost analysis - costs to operate the business and profitability
Ratio analysis - Gross Margin Return On Investment, Return on Asset, Inventory Turns
Enterprise analysis - What is your most profitability product line?
Are Your Financially Healthy Are Your Financially Healthy and Wise?and Wise?

Do you know how your business compare with industry benchmarks How do you compare to other firms in the
industry? - Gross Margin, Inventory Turns, Profit Margin
Set performance goals Track your performance over time (trend
analysis)
Repeat process annually
Are Your Financially Healthy Are Your Financially Healthy and Wise?and Wise?

Calculating Calculating Production CostsProduction Costs
• A Record Keeping System for You
• Pricing for Profit

Expenses Records Variable costsVariable costs: cost items that vary with production volume
(Direct and Indirect).
Costs of plant materials, pots, soil, hourly labor, advertising.
Fixed costsFixed costs: cost items that do not vary with production volume (Overhead costs).
Costs of rent, property taxes, management salary and family living expenses.
Allocate these costs to each product could be tricky (by floor space, time in store, etc.)
25 to 50% of total costs.

Expenses Records - cont. Marketing costsMarketing costs:
Advertising, packaging, shipping, billing, and special promotion, display, etc.
It could also be assigned to variable and fixed costs, but why look at it separately?
Production efficiency vs. marketing efficiency
5 to 15% of total costs
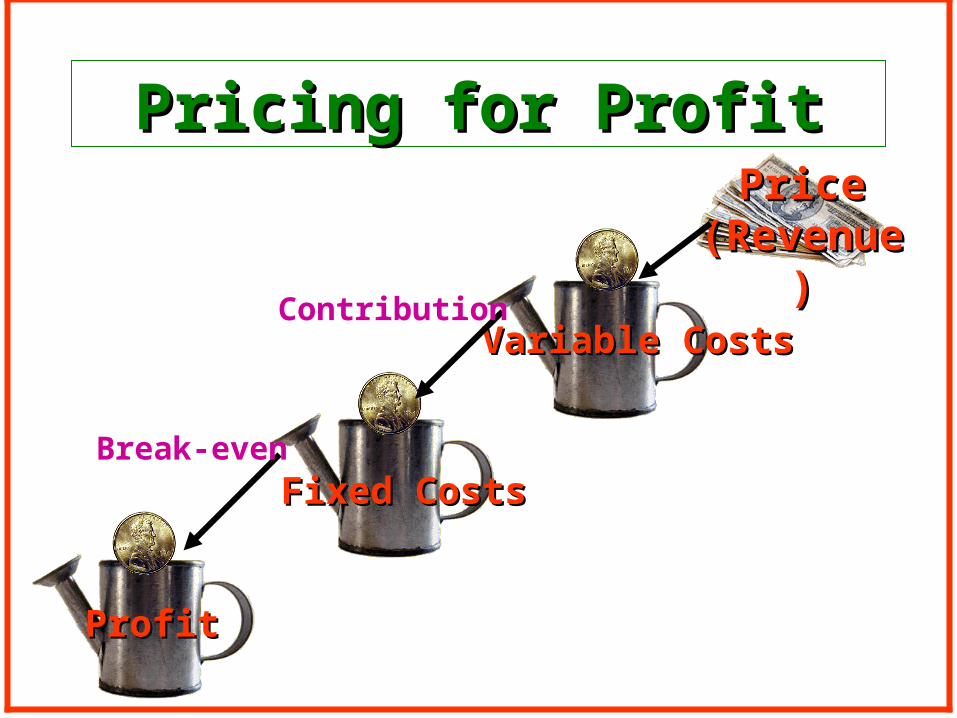
ProfitProfit
Pricing for ProfitPricing for Profit
Variable CostsVariable Costs
Fixed CostsFixed Costs
Price Price (Revenue)(Revenue)
Contribution
Break-even
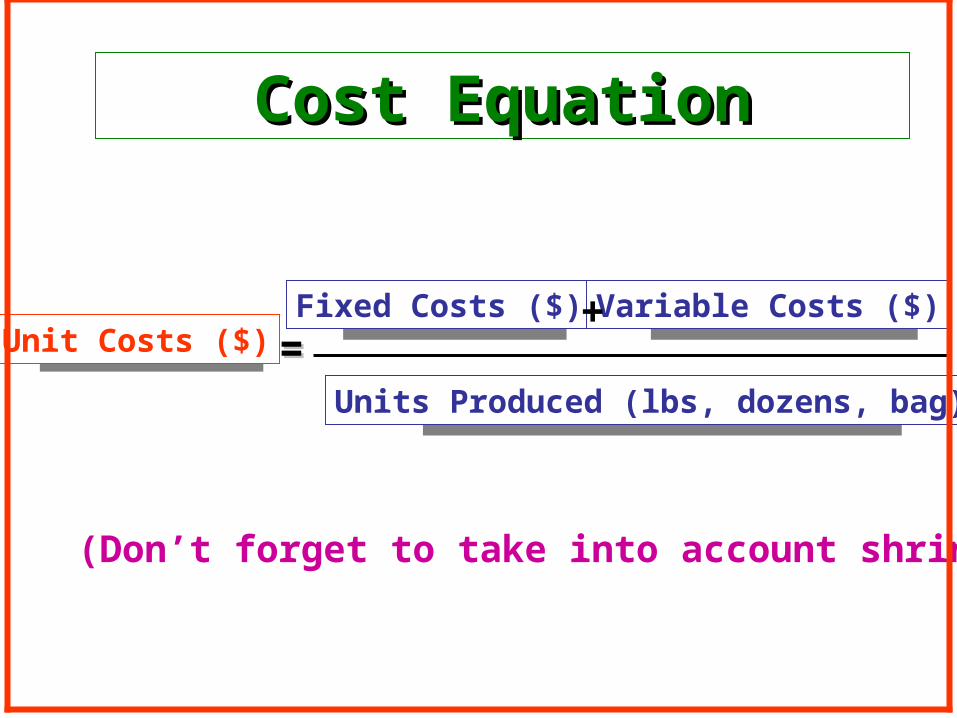
Cost EquationCost Equation
Unit Costs ($) ==Fixed Costs ($) Variable Costs ($)+
Units Produced (lbs, dozens, bag)
(Don’t forget to take into account shrinkage)

Analyze Enterprise ProfitabilityAnalyze Enterprise Profitability
Step 1: Determine How You Want to Allocate the Fixed Costs
# total sq.ft. Weeks inoperation
Total square ft. weeksin operation
Greenhouse 18,000 25 450,000
Outdoor display 50,000 28 1,400,000
Gift shop 5,000 45 225,000
4 0
5 0
Totals 68,500 2,075,000
By Area & Length of Operation

Step 2: Calculate SFW Needed for a Enterprise
(ex. 5,000 pots of 4” Geraniums)
Product Location SquareFeet
Weeks SFW
Geranium Greenhousespacing A
5,000 4 20,000
Geranium Greenhousespacing B
10,000 4 40,000
Geranium OutdoorDisplay
10,000 4 40,000
TOTAL 100,000

Step 3: Calculate Costs - Direct Variable Costs
Direct Variable Costs $ Amount
Seeds or plants $ 750
Potted soil 100
Fertilizer and Chemicals 50
Packaging material 150
Direct labor 2,000
TOTAL FOR THIS PRODUCT LINE $ 3,050

Step 3: Calculate Costs - Indirect Variable Costs
Indirect Variable Costs $ Amount Total Sq. Ft. Week $/Sq. Ft. Week
Electricity $ 8,000 2,075,000 $ 0.00386
Trucking 2,400 2,075,000 0.00116
Telephone 1,000 2,075,000 0.00048
Water 500 2,075,000 0.00024
Fuel 1,000 2,075,000 0.00048
Heating for Greenhouse 2,000 450,000 0.00444
Hourly Labor 65,000 2,075,000 0.03133
Advertising 2,000 Annually orspecial event?
2,075,0000.0096
TOTAL 0.05159

Step 3: Calculate Costs - Fixed Costs
Fixed Costs $ Amount Total Sq. Ft. Week $/Sq. Ft. Week
Management Salary 50,000 2,075,000 0.02410
Interest 15,616 2,075,000 0.00753
Depreciation 5,497 2,075,000 0.00265
Insurance 5,102 2,075,000 0.00246
Building and Equipment M/R 2,779 2,075,000 0.00134
Property Taxes 8,025 2,075,000 0.00387
Leases and Rental 10,879 2,075,000 0.00524
Office Supplies 2,991 2,075,000 0.00144
Professional Fee 2,123 2,075,000 0.00102
Misc. 4,000 2,075,000 0.00193
Family Expenses & BankPrincipal Payments
20,000
TOTAL 0.05157

Step 4: Calculate Enterprise Profitability
Revenue
Price per Unit $ 3.25
Units Sold (Take into consideration shrinkage) 4,800
TOTAL REVENUE $ 15.600
Expenses
Direct Variable Costs (COGS) $ 3,050
Indirect Variable Costs (100,000 SFW * $0.05159/SFW) = $ 5,159
Fixed (Overhead) Costs (100,000 SFW * $0.05157/SFW) = $ 5,157
TOTAL EXPENSES $ 13,366
ENTERPRISE PROFIT 2,134

Step 5: Breakeven Analysis
Variable Costs per UnitSold
($3,050 + $5,159) / 4,800= $1.71
Consider discontinueif below thisnumber
Overhead Costs per UnitSold
$5,157 / 4,800 = $1.07 Need to cover thisnumber
Total Cost per Unit $1.71 + $1.07 = $2.78 Breakeven price
Profit per Unit Sold (4,800pots)
$1.01
Profit per Unit Grown(5,000 pots)
$0.97
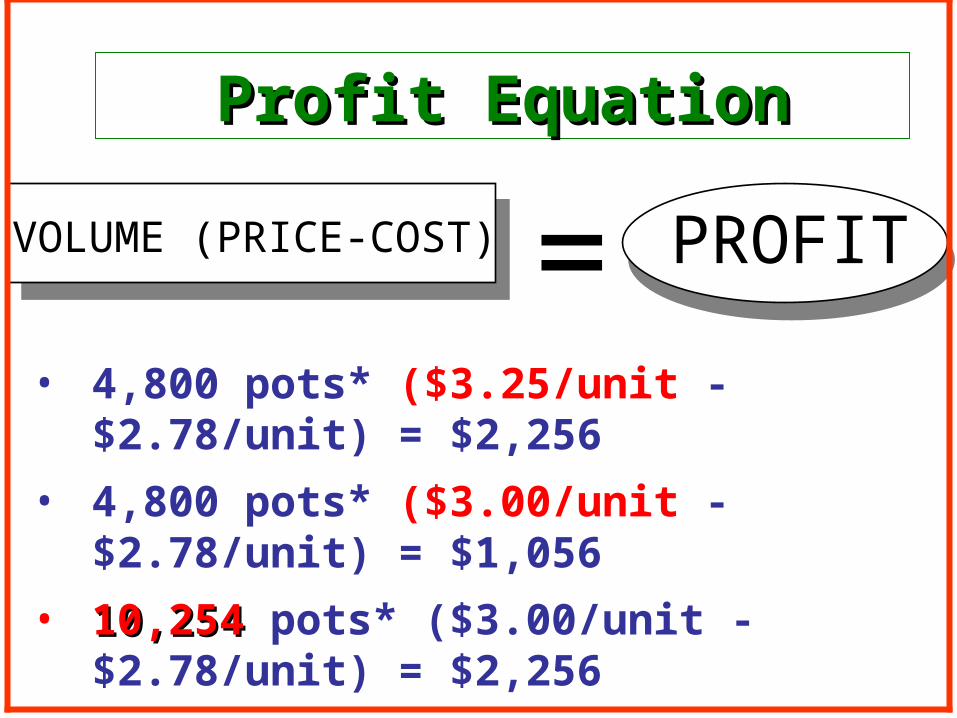
=VOLUME (PRICE-COST) PROFIT
Profit EquationProfit Equation
• 4,800 pots* ($3.25/unit - $2.78/unit) = $2,256
• 4,800 pots* ($3.00/unit - $2.78/unit) = $1,056
• 10,25410,254 pots* ($3.00/unit - $2.78/unit) = $2,256
• For $250,000 in sales, a 4% price increase (4 cent increase for every dollar) give you $10,000 more profit.

Evaluating Business Evaluating Business ProfitabilityProfitability
• Financial Ratios
• Efficiency Measures

Financial RatiosFinancial Ratios
• Profitability Ratios
• Gross Margin: (Revenue - Variable Costs) Revenue -- (around 50%)
• Profit Margin: (Revenue - Total Costs) Revenue -- (around 10-15%)
• Return on Assets
• Net Business Income Average Total Assets
• How efficient are you using your resources to produce income.

Financial RatiosFinancial Ratios• Inventory Ratio (3.5)
• Cost of Good Sold Average Inventory• How fast are you turnover your inventory
• Liquidity• Current Ratio: Current Liability Current
Assets• Your ability to cover current debt (liability)
• Solvency• Debt-to Asset Ratio: Total Liability Total
Assets• The percentage of the business’s assets to which
creditors have claim.

Efficiency MeasuresEfficiency Measures• Operating Efficiency
• Sales per Full Time Worker Equivalent• Net Income pre FT Worker Equivalent• Sales per Square Foot
• Cost Efficiency• Labor as percent of sales• Operating expenses as percent of sales• Costs per square foot (or square foot week)
• Profitability• Net Income per Owner• Net Income per Owner Hour• Net Income per Square Foot


http://aede.ag.ohio-state.edu/people/moore.301/index.htm


So get ready, hold on and enjoy the ride. The trying is half the fun.

And after all the hard work, you get to reap the benefit of your efforts!

The End