Green Transport Strategy for South Africa: (2018-2050)
68
Green Transport Strategy for South Africa: (2018-2050) Transport Department: REPUBLIC OF SOUTH AFRICA transport
Transcript of Green Transport Strategy for South Africa: (2018-2050)

Green Transport Strategy for South Africa: (2018-2050)
TransportDepartment:
REPUBLIC OF SOUTH AFRICA
transport


TransportDepartment:
REPUBLIC OF SOUTH AFRICA
transport
dotransport dotransportvideos@dotransport

Executive Summary 5
2. Problem Statement 8
4. POLICY AND LEGISLATIVE MANDATE 4
4.1 International Agreements and Conventions 10
4.2 Overview of National Policies 11
4.3 Approach 14
5. TRANSPORT-RELATED ENVIRONMENTAL
TAXATION AND FISCAL POLICY INSTRUMENTS 15
5.1 Fuel Taxation 15
5.2 Carbon Taxation 15
5.3 Vehicle Taxation 16
6. OVERVIEW OF THE TRANSPORT SECTOR 17
6.1 Road Transport 18
6.2 Rail Transport 19
6.3. Aviation Transport 20
6.4 Maritime Transport 21
7. STRATEGIC FOCUS 21
7.1 Vision 21
7.2 Mission 21
7.3 Values 22
7.4 Objectives of the Green Transport Strategy 22
7.5 Purpose of the Green Transport Strategy 22
7.6 Guiding Principles 23
7.7 Strategic Pillars and Implementation Themes 25
8 STRATEGIC INITIATIVES 26
8.1 Integrated Transit Systems 27
8.2 Road Transport Initiatives 27
8.2.1 Road Passenger Transport 28
8.2.2 Road Freight Transport 29
8.3 Rail Transport Strategic Initiatives 31
8.3.1 Passenger Rail Transport 31
8.3.2 Freight Rail Transport 32
8.4 Aviation Transport Strategic Initiatives 32
8.4.1 Carbon Off-setting and Reduction Scheme for International Aviation (CORSIA) 34
8.5 Maritime Transport Strategic Initiatives 35
8.6 Pipeline Transport 36
8.7 Cleaner Fuels and Alternative Fuels 36
8.7.1 Cleaner Fossil Fuels 37
8.7.2 Compressed Natural Gas (CNG): 37
8.7.3 Biogas and Biofuels 38
8.8 Electric Vehicles (EVs) 39
8.9 Future Modes of Transport 39
9. TRANSPORT ADAPTATION AND MITIGATION 43
9.1 Transport Adaptation 43
9.2 Barriers to Adaptation in the Transport Sector 44
9.3 Mitigation: The Sustainable Transport Programme 45
9.4 Transport Flagships and Nationally Appropriate Mitigation Actions (NAMAs) 46
10. ENABLERS AND BARRIERS FOR SUSTAINABLE MOBILITY 4610.1 Enablers and Barriers for Green Transport 46
11. OPPORTUNITIES / CO-BENEFITS FOR GREEN TRANSPORT 48
11.1 Economic 48
11.2 Social 48
11.3 Environmental 48
12 COST OF GTS AND FINANCING OPTIONS 49
12.1 Options for Financing Green Transport and
Economic Incentives 49
13 IMPLEMENTATION,MONITORING AND EVALUATION 51
13.2 Monitoring and Evaluation 51
14 COMMUNICATION STRATEGY 56
15 REFERENCES 57
CONTENTSGreen Transport Strategy for South Africa (2018-2050)
Department of Tranport

1 Department of Transport: South Africa Department of Transport: Green Transport Strategy for South Africa (2018-2050)
PART A: GENERAL INFORMATION
LIST OF ACRONYMS
ACSA Airports Company of South Africa
ADR Formally, the European Agreement concerning the International Carriage of Dangerous Goods by Road (ADR)*
ASBU Aviation System Block Upgrades
ATNS AirTrafficandNavigationServicesCompany
BRT Bus Rapid Transit System
C-BRTA Cross-Border Road Transport Agency
CBG Compressed Biogas
CF2 Cleaner Fuels Programme II
CO2 Carbon dioxide
CH4 Methane
CNG Compressed Natural Gas
COP Congress of Parties
CORSIA Carbon Off-setting and Reduction Scheme for International Aviation
DAFF Department of Agriculture, Forestry and Fisheries
DBSA Development Bank of Southern Africa
DEA Department of Environmental Affairs
DoE Department of Energy
DoT Department of Transport
DPE Department of Public Enterprise
DST Department of Science and Technology
DTI Department of Trade and Industry
EDD Economic Development Department
EEZ Exclusive Economic Zone
EVs Electric Vehicles
GDP Gross Domestic Product
GHG Greenhouse Gas
GHGI Greenhouse Gas Inventory
GIS Geographic Information Systems
INDC Intended Nationally Determined Contribution
GTS Green Transport Strategy
ICAO International Civil Aviation Organisation
ICT Information and Communication Technologies
IDC Industrial Development Cooperation
ICE Internal Combustion Engines
IMO International Maritime Organisation
IoT Internet of Things
IPAP Industrial Policy Action Plan
ITP Integrated Transport Plan
IPTN Integrated Public Transport Network
IPPC Intergovernmental Panel on Climate Change
LNG LiquefiedNaturalGas
ktCO2e kilo tons of Carbon Dioxide equivalent
LPG LiquefiedPetroleumGas
MARPOL International Protocol for the Prevention of Pollution from Ships
MRV MeasurableReportableVerification
NAAMSA National Association of Automobile Manufacturers of South Africa
NAMA Nationally Appropriate Mitigation Actions
NATMAP National Transport Master Plan
NCCC National Climate Change Committee
NCCRP White Paper on National Climate Change Response Policy
NCRS National Credit Regulator
NDC Nationally Determined Contributions
NDP National Development Plan
NMT Non-Motorised Transport
NT National Treasury
OEMS Original Equipment Manufacturers
PBN Performance-based Navigation
PHEV Plug-In Hybrid Electric Vehicles
PICC Presidential Infrastructure Coordinating Commission
PRASA Passenger Rail of South Africa
RAF Road Accident Fund
RTIA RoadTrafficInfringementAgency
RTMC RoadTrafficManagementCorporation
SAA South African Airways
SACU South African Customs Union
SADC Southern African Development Community
SALGA South African Local Government Association
SANRAL South African National Road Agency
SAMSA South African Maritime Authority
SANEDI South African National Energy Development Institute
SANTACO South African National Taxi Association
SARPs Standards and Recommended Practices
SOEs State Owned Enterprises
STP Sustainable Transport Progamme
SUT Sustainable Urban Transport
TSU Technical Support Unit
UNEP United Nations Environmental Programme
UNFCCC United Nations Framework Convention on Climate Change
USTDA United Nations Trade and Development Agenc
*ADRis a 1957 United Nations treaty that governs transnational transport
of hazardous materials. ADR is derived from the French name for the treaty,
Accord européen relatif au transport international des marchandises
Dangereuses par Route.
2Department of Transport: Green Transport Strategy for South Africa (2018-2050)
Table 1: Overview of environmentally-related taxes and charges in South Africa 27
Table 2: Highlights of the fuel taxes that are currently applied on petrol, diesel and biodiesel 17
Table 3: Projection for the transport sector: total of all GHGs with existing and planned measures 18
Table 4: Strategic pillars of the Green Transport strategy 25
Table 5: Estimated mitigation potential and cost (which are likely to be borne by the public and private sector, as well as consumers) of modal shifts in the transport sector 28
Table 6: Indicative Total Tonnage of Rail and Road Freight in South Africa by category and current modal usage 29
Table 7: Showing the tonnage of freight moved by train 30
Table 8: Types of future modes of transport 45
Table 9: Proposed NAMAs List for Transport 46
Table 10: An overarching policy framework to support low-carbon, green transport 50
Table11:Environmentalfundingandfinanceforthetransport sector 74
Table 12: Implementation Plan For GTS 78
Figure 1: GHG emissions from the transport sector with existing measures 9Figure 2: Analysis of South Africa’s pledge to emission reduction targets based on the Department of Environmental Affairsfiguresforhistoricalandprojected GHG emissions 10
Figure 3: Showing different modes of Eco-mobility including Non- Motorised Transport 19
Figure 4: Comparison of GHG emissions from different transport fuels and technologies 23
Figure 5: Showing change in cost of different fuel types (cost to improve the convenience and safety of transport) 25
Figure 6: Showing Fuel Cell future estimated cost compared to other technologies 32
Figure 7: Absence of measure baseline in Aviation for S.A 33
Figure 8: Value proposition for the development of manganese precursor materials 41
Figure 9: HySA value proposition 41
Figure 10: Comparison of BEVs and FCEVs 43
LIST OF TABLES AND FIGURES

3 Department of Transport: South Africa Department of Transport: Green Transport Strategy for South Africa (2018-2050)
South Africa is committed to providing a world class transport system that reduces both the cost of transport and the quantity of Greenhouse Gases (GHG), as well as other pollutants that are emitted by the sector.
Emissions from the transport sector account for 10.8% of the country’s total greenhouse gas emissions, with road transport being responsible
for 91.2% of these GHG emissions (DEA, 2010). Should these trends continue in the absence of policies and measures, the transport sector is projectedtoemitatotalof136GgCO₂eqbytheyear2050(DEA/GIZ:Mitigation Report, 2007).
Ourdeterminationtoimprovetheenvironmentforbenefitsofpresentandfuture generations of humankind in accordance with Chapter 2 (S24) of the Constitution of South Africa is the foundation that the GTS is based on. The Department of Transport is therefore committed to making a significant impact in reducingGHG emissions and contributing to thereduction of South Africa’s total GHG emissions by committing to a 5% reduction of emission in the transport sector by 2050.
This target is very ambitious and requires bold steps to be taken. These steps will include shifting passengers from private transport to public transport and freight from road to rail; switching to cleaner fuels and adopting new technologies such as alternative energy vehicles while making our cities and towns friendlier places for cyclists and pedestrians. The transformations that are required in the transport sector are challenging, but the benefitsincludeamoreefficient,lesscongestedroadnetworkandimprovedairqualityandpublichealth.
Dr Bonginkosi Blade Nzimande
MINISTER OF TRANSPORT, MP

4Department of Transport: Green Transport Strategy for South Africa (2018-2050)

5 Department of Transport: South Africa Department of Transport: Green Transport Strategy for South Africa (2018-2050)
1. EXECUTIVE SUMMARY
Themovementofgoodsandservicesintimeandspacedefinesandinfluenceseconomic activity. Demand for transport shapes the urban landscape and influences our peoples’ spatial choices in relation to schooling, places ofwork, religious services; economic services such as banking, shopping and basic lifestyle requirements. Businesses, in similar ways, choose to establish themselves based on market proximity and size, and ease of transport supporting labour, goods and services. These choices contribute in ways that are either favourable or extremely compromising to the well-being of individuals, households and businesses. (National Household Travel Survey, 2013:1).
Emissions from the transport sector in South Africa account for 10.8% of the country’s total Greenhouse Gas (GHG) Emissions. In addition to these direct emissions arising from the combustion of fuels, there are indirect emissions fromtheproduction,refiningandtransportationoffuels.
Continued growth within the transport sector, is likely to have an increasing impact on land resources, water quality, air quality and biodiversity. In urban centres transport is a major contributor to air pollution and emissions include nitrous oxides and particulates, which contribute to the brown haze we see overmanyofSouthAfrica’smaincities.Thesepollutantshaveasignificantimpact on human health, increasing risks of respiratory diseases, heart disease, lung cancer, and low birth weight (among others) – with children and the elderly particularly vulnerable. This places an even greater burden on the healthcare system with substantial medical costs.
Planes, trains and automobiles, carriages, carts and coaches from history’s earliest to modern man’s most sophisticated, modes of transport have changed through the ages with little attention paid to man’s first step inmobility: walking. In South Africa walking is one of the most utilised forms of gettingpeoplefromoneplacetoanother,butatenormouscost:financially,emotionally, morally and physically.
It is the responsibility of the DoT to contribute significantly to nationaleconomic development through a people-centred approach that creates opportunity and stimulates growth. Thus, it is the intention of the Department of Transport (DoT) to drive the goals of the National Transport Master Plan 2050asSouthAfricaconfrontsitscrossroadtobringsafe,efficient,reliable,affordable transport to all its people.
That makes the need for real change within the transport sector urgent and imperative.

6Department of Transport: Green Transport Strategy for South Africa (2018-2050)
TheDepartmentofTransportisthereforecommittedtomakingasignificantimpactinreducingGHGemissions.ToaddressthesignificantcontributionoftransporttonationalGHGemissions,government through the Department of Transport has developed a Green Transport Strategy (GTS), which aims to minimise the adverse impact of transport on the environment, while addressing current and future transport demands. This is underpinned by sustainable development principles. The strategy will promote green mobility to ensure that the transport sector supports the achievement of green economic growth targets and the protection of the environment.
The objectives of the GTS include:
1. Enabling the transport sector to contribute its fair share to the national effort to combat climate change in a balanced fashion, taking into account the DoT and the sector’s primary responsibility ofpromotingthedevelopmentoftheefficientintegratedtransportsystemstoenablesustainablesocio-economicdevelopment;
2. Promoting behavioral changes towards sustainable mobility alternatives through information, education and awareness raising;
3.Engagingthelowcarbontransitionofthesector,toassistwiththealigninganddevelopingofpolicieswhichpromoteenergyefficiencyandemissioncontrolmeasuresinalltransportmodes;
4. Minimizing the adverse effects of transport activities on the environment, and
5. Facilitating the sector’s just transition to climate resilient transport system and infrastructure
Roadtransporthasbeenidentifiedastheprimarysourceoftransport-relatedCO₂emissionsinSouthAfrica,contributing91.2%oftotaltransportGHGemissions.TheheavyrelianceofthesectoronfossilfuelscontributessignificantlytototalGHGemissionsforthecountry.Thisjustifiesafocusonimmediateandtargetedinterventionsaroundroadtransporttoeffectasignificantreductionof emissions in the transport sector as a whole. Therefore, one of the main drives of the implementation of the GTS will be to initiate immediate interventions in this sector to directly combat the emissions. (GHG Inventory, 2014).
Thisrenaissancetrajectorywill requirecommitment toresources:significant long-termfinanceand investment,aswellassupplementarywork topreparedetailedbusinessplansforfinanceandinvestment intransport-relatedmitigation(INDC,2015).Therearebroad-scaleeconomicopportunitiesforgrowthinthepublicandprivatesector.Someofthebenefitsincludeaccesstoemploymentopportunitiesforpoorcommunitiessuchasanefficientlyrunpublictransportsystem,accesstoclinicsandotherhealthcareservicesandlesspollutedair.Similarly,improvementsintransportefficiencywillhavepositiveknock-oneffectsforalleconomicsectorsthatmakeuseoftransport.
Themaindifficultyiseffectiveimplementationandsufficientfunding.Thechallengeofdevelopingtransportpoliciesforsustainabledevelopmentistoillustratethetrade-offbutemphasisethebenefitsandthecriticalurgency.Weareacutelyawarethatenvironmental,socialandeconomiccostshavetobeintegratedresponsiblytoachievethisbalance.(SustainableTransportpolicies,2001:17). Many of the measures required to achieve this balance are not new.
To achieve sustainable development, we need to:
• develop regulatory instruments (particularly for vehicle emissions);
• restructure taxes and provide incentives to reduce costs where possible;
• prioritise infrastructure development; and,
• educate and stimulate awareness to accelerate behavioural change
7 Department of Transport: South Africa Department of Transport: Green Transport Strategy for South Africa (2018-2050)
The quality of transport is our guiding principle, with a particular focus on rail services ensuring reliability across the supply chain and promotion of inter-modal services to achieve an integrated transit system.
Long-term investment is essential for the success of the Green Transport Strategy. Innovative industries or sectors within and outside of transport parameters are at the forefront of bringing about low carbon intensive initiatives. While the Government can set appropriate policies, it is ultimately up to the private sector to buy into the large-scale uptake of green transport. As such, the policy framework enables various drivers and initiatives, while largely reducing barriers as perceived by the private sector. In practice, green transport is integral to society, the economy and the environment.
In terms of the social impact, we need to address the increase of sustainable mobility and counter the spatial disconnect from business centres, trade markets and job opportunities for less privileged groups as a national priority. When it comes to the environment, reducing air pollution, particularly in an urban context, is a direct short-term need, in addition to combating climate change in the long run. Lastly, and even more importantly, in the context of a developing economy, the economic proposition of green sustainable transport is a central factor to making green options “the spring of hope” in a commercially brimming future.
South Africa has committed to the core principles of international conventions, such as the United Nations Framework Convention on Climate Change (UNFCCC), and other conventions especially the Chicago Convention for Aviation, and the International Maritime Organisation (IMO) Convention for Maritime Transport.
The Paris Agreement outlines the following principles to combating the effects of global climate change:
a) Holding the increase in the global average temperature to well below 2°C above pre-industrial levels and to pursue efforts to limit the temperature increase to 1.5°C above pre-industrial levels,recognisingthatthiswouldsignificantlyreducetherisksandimpactsofclimatechange.
b) Increasing the ability to adapt to the adverse impacts of climate change and foster climate resilience and low greenhouse gas emissions development, in a manner that does not threaten food production; and
c) Makingfinancialsupportconsistentwithapathwaytowardslowgreenhousegasemissionsandclimate-resilientdevelopment.
The global community has taken decisive action in addressing the effects of climate change, by aiming to reach “global peaking of Greenhouse Gas emissions as soon as possible”. The Paris Agreement has been described as both an incentive and a driver for fossil fuel divestment.
AccordingtoSouthAfrica’sGreenhouseGasMitigationPotentialAnalysisMitigationReport(2014),arangeofpotentialmitigationmeasureshasbeenidentifiedfor implementationwithinthetransport sector to reduce emissions and contribute towards South Africa’s GHG reduction targets by 2050.
The list of mitigation opportunities was categorised as follows:
• mplementation of the “modal shift” notion;
• Demand reduction measures;
• Moreefficientvehicletechnologies;
• Moreefficientoperations;and
• Alternative lower-carbon fuels.
The GTS subsequently seeks to address and limit the negative environmental impacts of the transport sector in South Africa, by providing a clear and distinct route of environmental policy directives and a mapping of resilient climate change initiatives for the sector that include joint ventures with other spheres of government and the private sector.

8Department of Transport: Green Transport Strategy for South Africa (2018-2050)
Transport remains a key sector to ensuring economic transformation through innovation. We must not only be responsible but responsive to the real challenges: to adjust by learning, moving forward with time and delivering sustainable solutions for a liveable future for all South Africa’s people.
2. PROBLEM STATEMENT
Decarbonisingtransportisasignificantchallenge,asitisoneofthemajorsectorswhereemissionsarewellabovetheir1990levels,andhavecontinuedtoincreaseatabout33%overthesameperiod.Theyhavehoweverstartedtofallrecentlyduetohighoilpricesandimprovedvehicleefficiency.Morethantwothirdsoftransport-relatedGreenhouseGas(GHG)emissionsarefromroadtransport. Emissions from the transport sector in South Africa account for 10.8% of the country’s total GHG emissions. This places the transport sector second only to the energy sector in terms of emissionsvolume.Thesefiguresrepresentdirectemissionsonly,principallyconsistingoftailpipeemissions.IfindirectGHGemissionsassociatedwiththetransportsectorweretobeincluded,suchasGHGemissionsassociatedwithfuelrefineriesandelectricitygenerationfortransport,thesefigureswouldbesubstantiallyhigher.
GHG emissions and Climate ChangeTheoverwhelmingconsensusofscientificopinion,asreflectedintheIntergovernmentalPanelonClimateChange, isthatclimatechangeintheformofglobalwarmingisrealanddrivenbyemissions of greenhouse gases caused by human activity. The single most important GHG is carbon dioxide (CO2) and the single most problematic GHG source is CO2 emissions, which are mostly emitted from the production and consumption of fossil fuels.
Mitigating the extent and managing the impact of climate change is a global priority. As a water scarce country, South Africa is particularly vulnerable to the risks of increased average temperatures, drought and rai nfall variability associated with global warming. At the same time, as a developing country with a historical dependence on its extensive coal deposits for energy, South Africa faces particular challenges in reorienting to a low carbon economy.
Transport activity levels are strongly related to socio-economic drivers, in particular growth in population and GDP. Effective and accessible transport is a vital enabling factor for economic growth. Thesedrivers,inturn,influencesocialfactorssuchaslevelsofvehicleownershipandthenatureandfrequencyofjourneysmade(MitigationReport,2014).Researchshowsthatcarownershipand the demand for transport are increasing steadily in South Africa (GIZ, 2015).
Transport is also a critical factor in urban spatial planning. The historical focus on providing and maintaining infrastructure to support the private car has led to unsustainable and inequitable outcomes. The spatial footprint of the private car is many times greater than that of public or non-motorised transport (NMT).
Asaresult,scarceurbanspaceisallocatedinefficiently.Thesectorhasalsohadtoconfrontthelegacyofapartheidspatialplanningwhichhasresultedinfragmented,unequalandinefficienttransport systems that require the poor to commute long distances to reach their places of work. These travel patterns impact substantially on air quality and climate change. Interventions to transformthetransportsectorshouldthereforeincludelesseningthemovementofgoodsandpeople;shiftingtolowcarbonmodesoftransportandimprovingenergyandfuelefficiency.
Sustainable transport is essentially the capacity to support the mobility needs of people, freight and information in a manner that is least damaging to the environment.
Sustainabledevelopmentappliedtotransportsystemsrequiresthepromotionoflinkagesbetweenenvironmentalprotection,economicefficiencyandsocialprogress.Undertheenvironmentaldimension,theobjectiveconsistsofunderstandingthereciprocalinfluencesofthephysicalenvironmentandthepracticesoftheindustryandallaspectsofthetransportindustrytoaddressthoseenvironmentalissues.Undertheeconomicdimension,theobjectiveconsistsoforientingprogressinthesenseofeconomicefficiency.Transportmustthereforebecost-effectiveandcapableofadapting to changing demands. Under the social dimension, the objective consists of upgrading standards of living and quality of life.
Transport systems form the backbone of South Africa’s socio-economic activities through enabling the movement of people and products.
Apartheid planning and marginalisation of some communities has left a legacy of transport networks that are poorly integrated, resulting in the majority of citizens living far from work, and with inadequate transport infrastructure. Many people do not have access to convenient, safe and affordable transport. Furthermore, South Africa is a developing country experiencing rapid urbanisation, which is intensifying the need for access to reliable transport systems.
Demand for transport is derived from other economic activities and is directly related to social levels of wealth within a country’s population. Wealth indicates the propensity of households to acquire food, household goods, and services. Research shows that a steady increase in household incomes directly translates into increased consumption and increased demand for transport. As people (especially in South Africa) earn more, they end up buying more cars. However, there are externalities associated with the acquisition of more cars.

9 Department of Transport: South Africa Department of Transport: Green Transport Strategy for South Africa (2018-2050)
Streetsbecomecongested,especiallyinthecities,andmoresoduringpeakhours.Trafficcongestionrestrictsthemobilityofworkers,rawmaterials,andfinishedgoods(Takyietal.,2013).Supplyinterruptionsarecostlytotheeconomy.Overallproductivitytendstobenegativelyaffectedbytrafficcongestion.
Similarly, rising GDP drives the demand for freight transport (heavy vehicles). The number of heavy vehicles using a road is the main cause of road deterioration (CSIR, 1994:4). In South Africa, the number of heavy vehicles increased considerably as a result of the shift of cargo from rail to road due to deregulation and the subsequent underutilisation of rail. The greater the number of heavy vehicles on SA’s roads, the greater the deterioration of the country’s roads, and increased maintenance costs. The outcome is worsened if the heavy vehicles are overloaded. Overloaded trucks are also associated with safety concerns and increased carbon dioxide emissions.
Carefullong-termplanningisthusrequiredtoensurethatthereissufficientinfrastructuretosupporttheefficientfunctioningandgrowthofthetransportsectorinthefuture,whileminimisingtheexternalities. Notwithstanding growing demand for transport, the sector has a critical role to play in achieving South Africa’s GHG reduction targets and the DoT will need to focus all resources available to meet these ambitious targets.
Figure 1 illustrates GHG emissions from the transport sector between 2000 and 2050, taking into account existing and currently planned policies. On the basis of this projection, it is apparent that a radical shift within the transport sector is required.
4. POLICY AND LEGISLATIVE MANDATE
According to United Nations Environment Programme (UNEP) (2011), Green transportisdefinedassupportforenvironmentalsustainabilitythroughe.g.theprotection of the global climate, ecosystems, public health and natural resources. It also supports the other pillars of sustainable development, namely economic (affordable,fairandefficienttransportthatengendersasustainablecompetitiveeconomy, as well as balanced regional development and the creation of decent jobs) and social (e.g. allowing basic access and the development needs of individuals, companies and society to be met safely and in a manner consistent with human and ecosystem health, and promoting poverty reduction, equality and equity within and between successive generations) .
Government is developing an implementation plan (the Green Transport Strategy) that will ensure that the South African transport sector initiates transformational changes in thinking, policy, technology and investment, through a step-by-step approach. South Africa’s transport sector will incrementally move to instituting efficient fuels, vehicleemissioncontrols, sector related technology innovation,exploration of alternative energy sources, and gradually eliminate or minimise the use of fossil-energy over time.
The mandate of the Department of Transport is to:
• Leadthedevelopmentofintegratedefficienttransportsystemsbycreatingaframeworkofsustainablepolicies,regulationsandimplementablemodelstosupportGovernmentstrategiesforeconomic, social and international development.
• Maximise the contribution of transport to the economic and social development goals of our country by providing fully integrated transport operations and infrastructure.
The transport sector, especially in the context of environmental sustainability, is informed by a number of national policies, strategies and legislation, as well as international agreements to which South Africa is a signatory. Of particular importance in relation to the GTS is the National Climate Change Response Policy, which mandates the DoT to lead a Transport Flagship Programme:
Figure 1. GHG emissions from the transport sector with existing measures (Source: South Africa’s GHG Mitigation potential Analysis, DEA)
10Department of Transport: Green Transport Strategy for South Africa (2018-2050)
“As part of the Transport Flagship Programme, the Department of Transport will facilitate the development of an enhanced public transport programme to promote lower-carbon mobility in five metros and in 10 smaller cities and create an Efficient Vehicles Programme with interventions that result in measurable improvements in the average efficiency of the South African vehicle fleet by 2020.
Furthermore, the planned rail re-capitalisation programme is considered an important component of this Flagship Programme, in so far as it will facilitate both passenger modal shifts and the shift of freight from road to rail.
Initially led by the Department of Transport, the programme will also include a Government Vehicle Efficiency Programme that will measurably improve the efficiency of the government vehicle fleet by 2020. It will encourage new efficient-vehicle technologies, such as electric vehicles, by setting procurement objectives for acquiring such vehicles.”
4.1 International Agreements and Conventions
Climate change, linked with energy consumption and security of supply of fuel, is considered one of the most serious and pressing threats to sustainable development, with adverse impacts expected on human health, food security, economic activity, natural resources, physical infrastructure and the environment. The international political response to climate change began with the adoption of the United Nations Framework Convention on Climate Change (UNFCCC) in 1992. Accordingly, South Africa has committed to taking concrete measures to mitigate climate change, through economy-wide measures that include the transport sector.
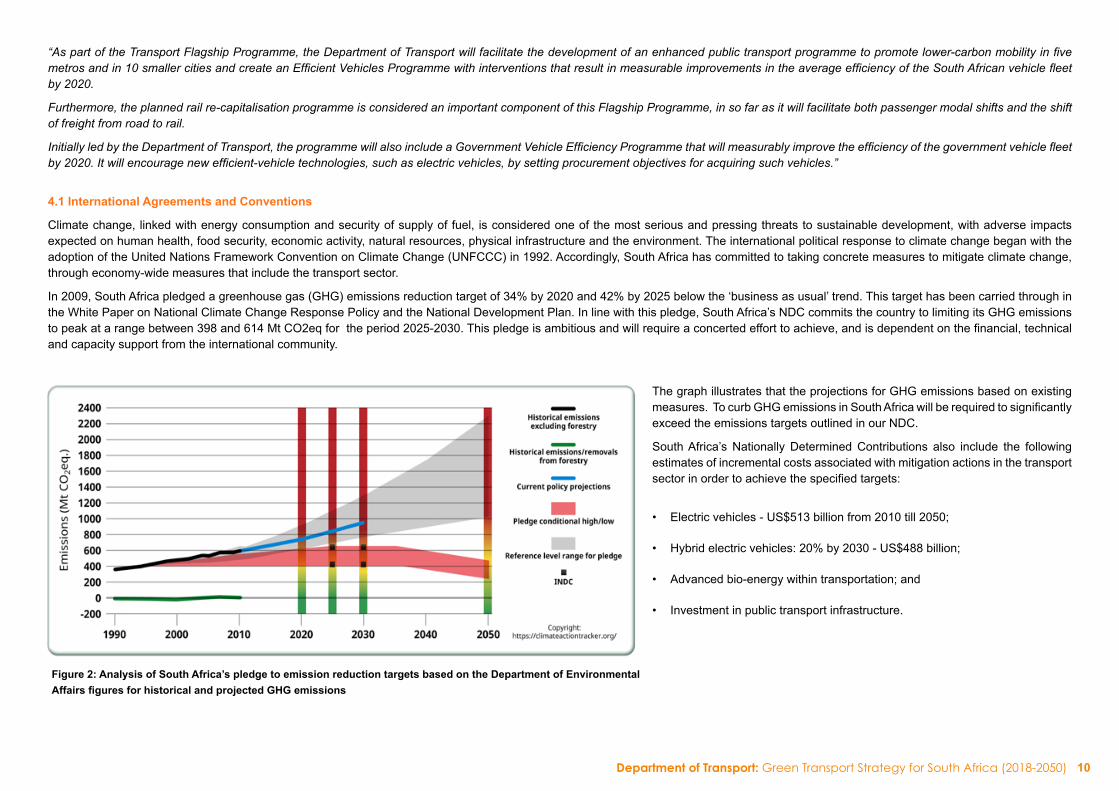
In 2009, South Africa pledged a greenhouse gas (GHG) emissions reduction target of 34% by 2020 and 42% by 2025 below the ‘business as usual’ trend. This target has been carried through in the White Paper on National Climate Change Response Policy and the National Development Plan. In line with this pledge, South Africa’s NDC commits the country to limiting its GHG emissions topeakatarangebetween398and614MtCO2eqfortheperiod2025-2030.Thispledgeisambitiousandwillrequireaconcertedefforttoachieve,andisdependentonthefinancial,technicaland capacity support from the international community.
The graph illustrates that the projections for GHG emissions based on existing measures.TocurbGHGemissionsinSouthAfricawillberequiredtosignificantlyexceed the emissions targets outlined in our NDC.
South Africa’s Nationally Determined Contributions also include the following estimates of incremental costs associated with mitigation actions in the transport sectorinordertoachievethespecifiedtargets:
• Electric vehicles - US$513 billion from 2010 till 2050;
• Hybrid electric vehicles: 20% by 2030 - US$488 billion;
• Advanced bio-energy within transportation; and
• Investment in public transport infrastructure.
Figure 2: Analysis of South Africa’s pledge to emission reduction targets based on the Department of Environmental Affairs figures for historical and projected GHG emissions
11 Department of Transport: South Africa Department of Transport: Green Transport Strategy for South Africa (2018-2050)
4.2 Overview of National Policies
The overview of national policies focuses on outlining the current policy and regulatory framework that forms a legislative foundation for the development of the GTS.
CONSTITUTION OF THE REPUBLIC OF SOUTH AFRICA: (The Constitution Act 108 of 1996)
Section 24 of the Constitution of the Republic of South Africa states that:
“Everyone has the right to an environment that is not harmful to their health or well-being; and to have the environment protected for the benefit of present and future generations, through reasonable legislative and other measures that prevent pollution and ecological degradation, promote conservation, and secure ecologically sustainable development and use of natural resources, while promoting justifiable economic and social development.”
THE WHITE PAPER ON NATIONAL TRANSPORT, 1996
The National Transport Policy states that the vision for the South African transport sector is a system which will “Provide safe, reliable, effective, efficient, and fully integrated transport operations and infrastructure which will best meet the needs of freight and passenger customers at improving levels of service and cost in a fashion which supports Government strategies for economic and social development whilst being environmentally and economically sustainable.”
WHITE PAPER ON ENERGY POLICY, 1998
TheWhitePaperonEnergyPolicysetsoutfivepolicyobjectives:increasingaccesstoaffordableenergyservices;improvingenergygovernance;stimulatingeconomicdevelopment;managingenergy-related environmental and health impacts; and securing supply through diversity.
NATIONAL ENVIRONMENTAL MANAGEMENT ACT 107 OF 1998 (NEMA)
TheNationalEnvironmentalManagementAct(NEMA)seekstopromotetheprotectionoftheenvironmentanditsresourcesforthebenefitofpresentandfuturegenerationsthroughreasonablelegislative and other measures that prevent pollution and ecological degradation, promote conservation, and secure ecologically sustainable development and use of natural resources, while promotingjustifiableeconomicandsocialdevelopmentasstatedinSection24oftheConstitution.
THE NATIONAL FREIGHT LOGISTICS STRATEGY, 2005
TheNationalFreightLogisticsStrategysetsthestrategicframeworkforinstitutionalreformandindustrialstructuringtoensureamoreefficientfreightsystemallowingimprovedsystemaccesstomarginalised service providers and cargo owners, while applying downward pressure on prices and transit times.
SOUTH AFRICA’S LONG-TERM MITIGATION SCENARIOS (LTMS), 2007
The Long-Term Mitigation Scenarios (LTMS) process took place in South Africa between 2005 and 2008. This was a Cabinet-mandated process led by the Department of Environmental Affairs and Tourism. The LTMS arose out of the realisation that South Africa would need to contribute its fair share to mitigation.
PUBLIC TRANSPORT STRATEGY, 2007
The Public Transport Strategy has two key focus areas, namely accelerated modal Upgrading and Integrated Rapid Public Transport Networks. The Public Transport Strategy is a key driver of other strategies developed within the transport sector.
NATIONAL LAND TRANSPORT ACT, 2009
TheNationalLandTransportActprescribesthatanymeasuresrelatingtopublictransportmustpromotetheefficientuseofenergyresourcesandlimitadverseenvironmentalimpactsinrelationto land transport.
WHITE PAPER ON NATIONAL CLIMATE CHANGE RESPONSE POLICY, 2011
The National Climate Change Response Policy (NCCRP) White Paper presents the South African Government’s vision for an effective climate change response and the long-term, transition to a climate-resilient and low carbon economy and society. The NCCRP also outlines a National Climate Change Response Flagship Programme for the transport sector.

12Department of Transport: Green Transport Strategy for South Africa (2018-2050)
NATIONAL STRATEGY FOR SUSTAINABLE DEVELOPMENT AND ACTION PLAN (NSSD 1) 2011–2014
One of the key implementation plans towards a green economy focuses on sustainable transport and infrastructure. The aim of this intervention is to reduce the transport sector’s carbon footprint.
THE SPATIAL PLANNING AND LAND USE MANAGEMENT ACT 16 OF 2013 (SPLUMA)
SPLUMA provides a new framework to govern planning permissions and approvals. It sets parameters for new development and lawful land uses in South Africa. SPLUMA is a framework law, which means that the law stipulates processes and provides broad principles that underpin spatial planning decisions by local and provincial authorities.
NATIONAL DEVELOPMENT PLAN VISION 2030
The National Development Plan emphasises that by 2030 investments in the transport sector will ensure that it serves as a key driver to empower South Africa and its people. These investments will enable and improve access to economic opportunities, social spaces and services, by overcoming the challenges of geographic distances in an affordable, reliable and safe manner.
PETROLEUM PIPELINES ACT
TheActaimstopromotetheefficient,sustainableandorderlydevelopment,operationanduseofpetroleumpipelines,loadingandstoragefacilities.Also,theActaimstofacilitateinvestmentinthe petroleum pipelines industry, provide for the security of pipelines and related infrastructure, as well as promote companies in the petroleum pipeline industry that are owned or controlled by historically disadvantaged South Africans (DTI, 2016).
PETROLEUM PRODUCTS AMENDMENT ACT
The objectives of the Act are to govern the production, transporting and trading in petroleum products. The Government can limit the number of licences allocated. The Act prohibits manufacturers and wholesalers from holding a retail licence except for training purposes. Also, it aims to facilitate transformation of South Africa’s petroleum and liquid fuels industry; ensures a system for allocation of licences, prescribes offences and penalties, and provides for appeal and arbitration platforms. It is an annexure to the liquid fuels charter (DTI, 2016).
REGULATION REGARDING PETROLEUM PRODUCTS WHOLESALE LICENCES
Theregulationsdefine“petroleumproducts”asbeing“aviationgasoline,biofuels,diesel,jetfuel,liquefiedpetroleumgas,paraffinandpetrol”(DTI,2016).
REGULATION ON PETROLEUM PRODUCTS SITE AND RETAIL LICENCES
Theregulationsdefine“petroleumproducts”asbeing“liquefiedpetroleumgasusedforthepropulsionofvehicles,petrolanddiesel”.Inthisregard,itispersuasivethatthesavingregulationsdefine“petrol” as being “any mixture of petrol with any other product, which can be used as fuel for the operation of a spark ignition engine” (DTI, 2016).
REGULATION REGARDING PETROLEUM PRODUCTS MANUFACTURING LICENCES
Theregulationsdefine“biofuel”asbeing“abiodegradableandrenewablepetroleumproductorpetroleumproductcomponentextractedfromvegetablematter”anda“manufacturingfacility”asbeing “plant or equipment that is used to manufacture petroleum products”(DTI, 2016).
REGULATION REGARDING PETROLEUM PRODUCTS SPECIFICATIONS AND STANDARDS
Theaimoftheregulationistorecommendthetighteningoffuelspecificationsbyfurtherreducingthelevelsofsulphurinbothpetrolanddiesel,aswellasthereductionofbenzeneandaromaticlevels in petrol to levels equivalent to Euro 5 emissions standard (DTI, 2016).
DEFINITION OF GAS FOR TRANSPORT
The aim of the Act is to promote the orderly development of the piped gas industry, establish a national regulatory framework and establish a national gas regulator as the custodian and enforcer of the national regulatory framework (DTI, 2016).
INJECTION OF BIOGAS (I.E. BIOMETHANE) INTO THE GAS PIPELINE NETWORK (I.E. WHEELING)
Currently,therearenoexamplesofbiogasprojectsthathaveconnectedtothegasgrid.AlthoughNERSAhasbeenmandatedwiththistask,nospecificregulationshavebeendevelopedyettofacilitatetheopeningofthefewlong-distancepipelinesandurbanfinegridsinGauteng(DTI,2016).

13 Department of Transport: South Africa Department of Transport: Green Transport Strategy for South Africa (2018-2050)
FUEL ECONOMY AND CO2-LABELLING
TheGovernmentspecifiesmandatorylabellingfornewpassengercars,indicatingfueleconomy(l/100km)andCO2emissionsin(g/km)ofthetypeofvehicleasperacertainpredeterminedformat(DTI, 2016).
PROCUREMENT RULES FOR LOCAL CONTENT IN THE BUS SECTOR
Preferential Procurement Regulations prescribe 70% and 80% locally-made content of the bus body for, city and commuter buses, respectively (DTI, 2016).
CLASSIFICATION AND REGISTRATION
Thegovernmenthasinplaceseveralrequirementsforfuelandvehicleclassificationsandregistration(DTI,2016).
AIR QUALITY STANDARDS
TheActaimstoprotectandenhancetheairqualityinSouthAfrica,preventairpollutionandecologicaldegradationandsecureecologicallysustainabledevelopmentwhilestrikingajustifiablebalance between economic, social and environmental development (DTI, 2016).
TRANSPORT OF DANGEROUS GOODS
The transport of dangerous goods is regulated by the South African National Standard (SANS), which legislates the design, construction, testing, approval and maintenance of road vehicles and portable tanks. SANS complies with the latest edition of the ADR*, which is the European Agreement concerning the international carriage of dangerous goods by road. The ADR stipulates that a spark-ignition engine shall not be used for transportation of such goods (DTI, 2016).
RESALE OF ELECTRICITY FOR EV USE
The resale of electricity in the SA electricity supply industry (ESI) is a growing business. The Electricity Regulation Act, 2006 makes provision for the licensing of generation, transmission, distribution, export or import and trading activities with regard to electricity by the Energy Regulator. Electricity resale falls under trading activities, which need to be licenced (e.g. municipalities) or registered (e.g. high-density housing complexes, shopping malls or commercial property). Several requirements apply, including with regard to mark-up on cost (DTI, 2016).
BIOFUELS REGULATORY FRAMEWORK
TheBiofuelsRegulatoryFrameworkprovidesformandatoryblendingrequirementsforpetrolanddieselofbetween2-10%v/vbioethanoland5%v/vbiodiesel.Thelegislationhasbeengazette,with the operation date to be determined by the Minister. It is uncertain if the regulation will be implemented, with the result that the private sector currently is largely unwilling to invest in the production of biofuels to generate cleaner fuels (DTI, 2016).
GOVERNMENT EV PROCUREMENT POLICY
TheElectricVehicleIndustryRoadMapplanstointroduceapolicytoensurethat5%oftotalannualfleetrequirementsbyboththeStateandStateOwnedEnterprisescompriseEVs,subsequentlyincreasing by 5%,until 2020 (DTI, 2016).
NATIONAL TRANSPORT MASTER PLAN, 2016
TheNationalTransportMasterPlan(NATMAP2050)aimstoachieveanintegrated,smartandefficienttransportsystemsupportingathrivingeconomythatpromotessustainableeconomicgrowth,supports a healthier lifestyle, provides safe and accessible mobility options, includes all communities and preserves the environment. Of particular relevance and important to the Green Transport Strategy is Strategic Pillar 7: Preservation of the Environment linked to Chapter 9 of the NATMAP Report.
NATMAP Objectives: Environmental
1. Reduce greenhouse gases and other emissions;
2. Minimise transport’s impact on the environment;

14Department of Transport: Green Transport Strategy for South Africa (2018-2050)
3.Reducetrafficcongestion;and
4. Minimise environmental impact by promoting public passenger transport, choosing optimal transport modes, using low carbon-emitting energy and renewable energy resources.
THE INDUSTRIAL POLICY ACTION PLAN (IPAP)
The IPAP is informed by the vision set out for South Africa’s development provided by the National Development Plan (NDP). The overriding goal of the IPAP is to prevent industrial decline and supportthegrowthanddiversificationofSouthAfrica’smanufacturingsector.
4.3 Approach
The approach used to develop the Green Transport Strategy included both primary and secondary research. Primary research included gathering and collating information and inputs from an expert reference group, as well as inter-Governmental stakeholder and implementation workshops. Secondary research consisted of desktop research involving both national and international literature reviews, as well as extensive stakeholder consultations.
The overarching approach has been to identify a short-term draft of GHG mitigation interventions which are most cost-effective, practical, and deliver the best social and economic returns, based on a survey of international best practice and domestic research, including South Africa’s Greenhouse Gas Mitigation Potential Analysis (the Mitigation Report) undertaken by the Department of Environmental Affairs (DEA). In particular, Appendix E of the Mitigation Report contains detailed estimates of the impact and costs of a range of potential mitigation measures in the transport sector.
Allinterventionsormeasuresidentifiedinthestrategyhavebeendesignedtobe:
• Specific–thescopeoftheproposedactivitiesshouldbeclear.
• Measurable–thebenefitsandoutcomesoftheproposedactivitiesshouldbequantifiable.
• Achievable and Realistic – given the practical constraints of capacity, available technology and resources.
• Timely–theproposedinterventionsmustprovidemeasurableoutcomeswithinaspecifiedtimeframe.
The GTS’s Approach has been informed by:
The pre-requisite to avoid the overinvestment of resources in technologies that are likely to be redundant in a future low carbon economy and the need to plan for the potential of new technologies that may result in disruptive, transformative and innovative change

15 Department of Transport: South Africa Department of Transport: Green Transport Strategy for South Africa (2018-2050)
5. TRANSPORT-RELATED ENVIRONMENTAL TAXATION AND FISCAL POLICY INSTRUMENTS
Petrol,dieselandbiodieselareclassifiedasfuellevygoodsintermsoftheCustomsandExciseAct,No.91of1964.Theyarethereforesubjecttofueltaxesandlevies,butarezero-ratedforVATpurposes.ThegeneralfuellevyisdeterminedbytheMinisterofFinanceintheannualbudget(Budgettax,2006).ItisusedtofinancegeneralGovernmentexpenditureprogrammes.TheRoadAccidentFundlevyisusedtocompensatevictimsofmotorvehicleaccidents(NT,2017).TheEqualisationFundlevyisusedasamechanismtosmoothretailfuelpricestooffsetsignificantpriceshocks. The Customs and Excise levy is imposed as a source of funding for the member countries of the South African Customs Union (SACU).
5.1 Fuel Taxation
ThecurrentfueltaxregimeinSouthAfricaappliestopetrol,dieselandbiodieselbasedonvolume(perlitre)tohelpachievevariouspolicyobjectives.Petrol,dieselandbiodieselareclassifiedasfuel levy goods and zero-rated for value added tax (VAT) purposes.
The current fuel taxes imposed include the fuel levy (FL), the Road Accident Fund (RAF) levy, and the customs and excise levy (C&E) which are collected in terms of an agreement by the SACU. These taxes seek to achieve both revenue-raising objectives (for general Government expenditures and to compensate victims of vehicle accidents) and environmental objectives, by ensuring that the negative environmental externalities associated with fossil fuel use are incorporated into fuel prices (NT, 2017).
5.2 Carbon Taxation
Government has proposed the carbon tax policy as a key mitigation instrument in South Africa’s broader climate change policy response to internalise the negative externality costs of GHG emissions (NT, 2017). The introduction of a carbon price will change the relative prices of goods and services, making emission-intensive goods more expensive relative to those that are less emissions-intensive(Carbontax,2016).Acarbontaxseekstoleveltheplayingfieldbetweencarbonintensive(fossilfuelbasedfirms)andlowcarbonemittingsectors(renewableenergyandenergyefficienttechnologies).Italsoprovidesanincentiveforconsumersandbusinessestoadjusttheirbehaviour,resultinginareductioninemissions.GHGemissionsarisingfromtransportfuels will be covered by the carbon tax regime and incorporated into the current fuel tax regime as an add-on.
The design of the carbon tax aims to contribute to a meaningful and permanent reduction in GHG emissions, while minimising any potential adverse impacts on low income households and industrialcompetitiveness.Theprovisionoftax-freeemissionsthresholdsandallowancesrangingfrom60%to95%willresultinarelativelymodestcarbontaxraterangingfromR6toR48/tonCO2eqduringthefirstphaseofthecarbontaxuptotheendof2020(Carbontax,2016).ThecarbontaxinthecaseofGHGemissionsfromtheuseofpetrolanddieselwillbeanadd-ontothecurrent fuel tax regime.
The proposed carbon tax will result in a higher effective tax on diesel than on petrol, due to the higher carbon intensity of diesel fuel relative to petrol. Fuels used by the international aviation and international maritime sectors will initially be excluded from the carbon tax, as these are covered by international agreements. Greenhouse gas resulting from the use of such fuels will be priced in terms of the international agreements that are currently under development.
It is proposed that domestic aviation will be subject to the domestic carbon-related fuel taxation, taking into account climate policies proposed under the International Civil Aviation Organisation (ICAO).
South Africa has a number of environmentally-related taxes already in place (see Table 1). Together, these tax instruments account for approximately 2% of GDP and just under 10% of total tax revenue.Environmentally-relatedtaxrevenuetrendsareheavilyinfluencedbythegeneralfuellevy,whichaccountsformorethan70%oftherevenuecollectedfromthisgroupofinstruments.

16Department of Transport: Green Transport Strategy for South Africa (2018-2050)
Table 1: Overview of environmentally related taxes and charges in South Africa
Since the majority of existing environmentally-related taxes were introduced with the primary intention of raising revenue, the potential exists to improve the environmental outcomes and behavioural incentives created by theseinstruments.Fromafiscalpointofview,theideaofusingenvironmentally-relatedtaxesaspartofataxshifting exercise also needs to be explored.
5.3 Vehicle Taxation
Value added tax (VAT) is imposed on all motor vehicle sales and an ad valorem customs and excise duty, based on the price of the vehicle, is imposed on all passenger and light commercial vehicle purchases. Medium and heavy commercial vehicles are exempt from ad valorem customs and excise duties. Provinces have exclusive responsibilityunder theConstitution forprovincial roadmanagementand trafficcontrol.TheRoadTrafficActof1996withitsrelevantregulationsempowersprovincialgovernmentstoimposecertainroadtrafficfees.TheRoadTrafficActfeesaredividedintothefollowingcategories:motorvehiclelicencesthatincludeallcategoriesof vehicles; operator licences that include setting the level of these fees and appoint registered agents to collect thefeesontheirbehalf.ProvincesalsochargefeesforroadtrafficregulationserviceshoseintheRoadTrafficAct (for example, vehicle registration fees upon change of ownership).
Two types of environmentally-friendly alternative fuels from biomass have reached technical maturity and acceptance in international fuel markets. These are biodiesel from vegetable oils and bioethanol fuels. Currently, biodiesel can be produced more economically than bioethanol fuels, provides more energy, is a cleaner burning fuel and is compatible with existing engines and commercial fuel distribution systems.
Giventhepotentiallong-termbenefitsofbiodiesel,afavourablefueltaxtreatmentwasannouncedinthe2002budget in an attempt to reduce the cost disadvantages that biodiesel currently faces with respect to fossil fuels. The intention is to give a similar fuel tax dispensation for bioethanol in the future.
Analysis of the mitigation potential of available fuels and technologies suggests that South Africa should be focusing on adopting biogas (biomethane) as a transport fuel and electric vehicles (e-Mobility) as a technology. Thisshouldnotprecludeadeterminedeffort toreducethecarbonprofileofvehiclespoweredbyfossil fuels,since they represent the vast majority of vehicles on our roads - something which is very unlikely to substantially changewithinthenextfiveyears.
The environmental effects of existing environmentally-related taxes and charges need to be better understood andquantifiedwherepossible.Insomeinstancesthiswillprovedifficult,sincemanyoftheseinstrumentshave
been in place for some time. A study of the impact of current environmentally-related taxes may therefore depend on the development of scenarios to illustrate what the situation would have been in the absence of these taxes.
Giventhelikelypotentialtoimprovetheenvironmentaleffectivenessofexistingenvironmentally-relatedtaxesandcharges,suchopportunitiesneedtobeidentifiedandassessed.Thisimportantstepwillhelptoidentifypriorityareasforfutureenvironmentalfiscalreforms.Inaddition,potentiallynewenvironmentaltaxinstrumentsneedtobeidentifiedandtheirappropriatenessevaluated.
Intermsoffiscalobjectives,oneareathathasreceivedagreatdealofattentionoverrecentyearsistheideaofusingtherevenuesfromenvironmentally-relatedtaxesaspartofataxshiftingexercise. The idea of taxing “bads” (such as environmental pollution) and reducing taxes on “goods” (such as labour) has been termed the double-dividend hypothesis. This hypothesis asserts thatawin-winsituationcouldbeachievedinthatnotonlyisanimprovementinenvironmentalqualitysecured(thefirstdividend),butgainsineconomicefficiencyandemploymentcouldalsoberealised (the second dividend). Such a policy approach is of particular relevance to South Africa since it offers the potential to better align the achievement of environmental goals with other social and economic objectives.
Source: EFR Policy: National Treasury: 2010

17 Department of Transport: South Africa Department of Transport: Green Transport Strategy for South Africa (2018-2050)
Table 2 highlights the current fuel taxes on petrol, diesel and biodiesel. Currently, diesel is taxed at a lower rate than petrol and no fuel tax differential currently exists between leaded and unleaded petrol.
Table 2: Highlights of the fuel taxes on petrol, diesel and biodiesel
From an environmental perspective, there is little merit in promoting diesel use over petrol. While dieselenginesaremoreefficientthanpetrolenginesintermsofenergyproductionperlitre,theirmain disadvantage is that they produce more carbon emissions than petrol engines. Hence petrol engines have air quality advantages and lower particulate emissions using basic abatement technologies. Diesel engines can have air quality advantages and lower particulate emissions using basic abatement technologies.
Theframeworkcouldbefurtherrefinedtoreflectotherenvironmentalexternalitiesandobjectives.Although the general fuel levy could be reformed to better contribute to air quality objectives, the limitationsofthisinstrumentmustberecognised.Inparticular,itisdifficulttocreatemoretargetedincentives beyond those outlined above. Supplementary reforms in vehicle taxation could be used to this end and could help to incentivise the introduction of vehicles that produce fewer emissions and withincreasedfuelefficiency.
In taking environmental considerations into account, it is appropriate to distinguish between the environmental costs imposed by different vehicles. This could be done according to a range of criteriaincludingvehicletype,fueltype,and/oremissions.Indoingso,caremustbetakennottoadversely impact on the rate of renewal of the vehicle stock or the level of tax revenue. Treasury announced reforms to the motor vehicle ad valorem excise duty in 2009 to include a carbon emissions component, based on DoE and the National Association of Automobile Manufacturers of South Africa (NAAMSA) vehicle carbon emission labelling, for implementation. In Budget 2010, the levywasadjustedtoaflatratetaxonnewpassengervehicleemissionsattherateofR75gCO2/km for emissions exceeding 120gCO2/km effective from 1 September 2010. Since the externalenvironmental costs resulting from the use of medium and heavy commercial vehicles are likely to be much higher than for passenger or light commercial vehicles, consideration could also be given to include these categories of vehicles in the excise duty net.
6. OVERVIEW OF THE TRANSPORT SECTOR
When conducting an overview of the transport sector, it becomes imperative to compare the full life-cycle of GHG emissions (including the extraction and production of transport fuels and energy carriers) of a wide range of transport fuels, hydrogen fuel cell and electric vehicle technologies. Emissions of electric vehicles and hydrogen fuel cell vehicles depend on the emissions factors of the electricity source. The European Union power mix is used as reference point in illustrating the potentialforanadaptive,cleanerandefficientfuelmixfortransportsystemsinSouthAfrica.
(Source: EFR Policy, National Treasury, 2010)

18Department of Transport: Green Transport Strategy for South Africa (2018-2050)
Table 3: Projection for the transport sector: total of all GHGs with existing and planned measures
6.1 Road Transport
The road sub-sector in South Africa contributes 91, 2% of the transport sector’s total emissions. Itisthereforeevidentthatthissub-sectoroffersthehighestmitigationpotentialbenefits.
Table 3 above indicates that road contributes the most significant amount to total GHGemissions from the transport sector in South Africa. The road sector will therefore be the focus of the Green Transport Strategy, as this allows the greatest opportunity for reductions. The modal shifts from private car usage to public transport (particularly rail) and non-motorised transporthavebeenidentifiedasessentialactionstoreduceenergyconsumptionandGHGemissions.
The Public Transport Strategy also plans to integrate rail, taxi and bus services in co-operation with private operators, both operationally and through ownership. Johannesburg’s successes with the Bus Rapid Transport System (BRT) has led to it being adapted and implemented in other South African cities, including Cape Town, Nelson Mandela Bay, Rustenburg, Ekurhuleni,
JohannesburgandTshwane.TshwaneisthefirstAfricancitytooperateafleetofcleanfuelBRTbuses(operatingonCNG)inAfrica.Approximately67%oftheSouthAfricanpopulationuseminibustaxis as their prime mode of transport.
TheSouthAfricanGovernmenthas introducedcompulsorysafetystandardsandataxi recapitalisationprogrammewhichaimstoreplaceoldandunsafe taxiswithnewer,moreefficient taxivehicles. In addition, it has started engaging with the taxi industry about introducing green initiatives into the minibus taxi industry by promoting the use and the uptake of cleaner fuels as a transport fuel for the taxi industry.
The road infrastructure in South Africa is also a cause for concern, as it is generally poorly maintained, with 78% of the national road network thought to be older than its original design life, while 30% of the infrastructure is rated as being in either ‘poor’ or ‘very poor’ condition. Of particular concern is the state of provincial gravel roads, 50% of which are rated as being ‘poor’ or ‘very poor’ and particular municipalities, some of which contain settlements in which virtually all roads are either in a ‘poor’ or ‘very poor’ condition.
The Green Transport Strategy will align to the following desired outcomes pertaining to the proposed norms and standards for “Green Roads”:
• A well-resourced road network that provides sustainable employment opportunities for the maintenance and expansion of paved and unpaved road infrastructure nationally.
• The minimisation of waste, water, heat and energy requirements and the sourcing of materials, resources and labour locally to reduce costs and life cycle emissions in the construction and maintenance of road infrastructure.
• The utilisation of recycled construction materials to minimise usage of virgin resources wherever possible.
• The construction of low carbon climate resilient (LCR) road infrastructure , including bus lanes, railways and non-motorised transport infrastructure.
• Thecarefulconsiderationofroadnetworkexpansionsoastoconserveandpromotenaturalhabitats,ecologicalcorridorsandwatersystems,andpreventerosionandflooding.
1Low-carbon resilient infrastructure refers to infrastructure required to tackle climate change, both in terms of meeting greenhouse gas (GHG) emission targets and in terms of adapting to inevitable consequences of increasing temperatures (Global Green Growth Institute, 2015)
* As described in Table 3, the emissions projection for the aviation sector assumes only the partial implementation of the target implied by the voluntary sectoral agreement to reduce net CO₂ emissions from the aviation sector. Source: GIZ mitigation potential analysis

19 Department of Transport: South Africa Department of Transport: Green Transport Strategy for South Africa (2018-2050)
• Substantial investments in renewable, sustainable fuel and power sources for private vehicles (e.g. electricity, biogas).
• PromotionofmotorvehiclemanufacturingandassemblyinSouthAfricatomitigatelifecycleCO₂emissionsofimportedvehicles.
• Promotion of non-motorised transport infrastructure to promote sustainable, carbon neutral modes of transport (e.g. cycling, walking).
• Legislative frameworks and smart incentives to promote uptake of sustainable transport modes and infrastructure.
6.2 Rail Transport
The events that have marked South Africa’s history have impacted significantlyonthedevelopmentoftherailsectorand,togetherwithother external factors have resulted in a railway industry that now faces several major challenges. Current challenges include the aging, deteriorating or obsolete state of much of the rail infrastructure and rolling stock, a capital investment backlog and a need for investment funds, and a preference by logistic transport service providers to transport freight by road rather than rail. There also exists the preference by long-distance passengers to travel by road rather by train,poorrailsecurityforbothpassengerandfreight,inefficientrailoperations and a shortage of technical skills and experience within the rail sector (National Rail Policy, 2015).
After many years of overloading and under-maintaining rail infrastructure, the condition of the heritage commuter rolling stock had deteriorated to crisis levels, and was unable to satisfy passenger demands. Similarly, the network infrastructure was not able to meet the demands of a rapidly changing society. To consolidate passenger rail, that is Metrorail and Shosholoza Meyl, the Passenger Rail Agency of South Africa (PRASA) was established in 2009.
Regarding freight rail,mostbranch line trafficwas lost topredatorycompetition from road haulers during the 1980s. Deregulation of road freight in 1988 resulted in substantial volumes of high-value low-
density freight on the core network shifting from rail to road during the 1990s. During the 2000s, a continued lack of competitiveness and investment by Transnet Freight Rail (TFR) resulted in road haulers deploying side tipper interlinks to encroach on the last bastion of freight rail, long-distance haulage of heavy bulk commodities such as coal, grain, and ore. Overall, railways in South Africa had deteriorated to a stage where the need to adapt to rail’s global renaissance had become patently obvious to most stakeholders (National Rail Policy, 2015). However, since 2012 Transnet has invested R108.6 billion in rail infrastructure and new locomotives.
By contrast, two important positive steps were the establishment of the Railway Safety Regulator by Act of Parliament in 2002, and the development of the Gautrain Rapid Rail Link as a public private partnership in terms of a concession agreement between the Gauteng Provincial Government and the Bombela Concession Company. Gautrain opened for service in May 2010, in time for the FIFA Soccer World Cup.
Figure 3: Showing different modes of eco-mobility including non-motorised transport
20Department of Transport: Green Transport Strategy for South Africa (2018-2050)
The South African National Infrastructure Plan, which includes both economic and social infrastructure, is coordinated by the Presidential Infrastructure Coordinating Commission (PICC). The PICC is mandated to oversee the implementation of 18 Strategic Infrastructure Projects (SIPs) that will stimulate social and economic growth. The SIPs are aimed at addressing South Africa’s infrastructuredeficittoboosteconomicgrowthandcreatemuch-neededjobs.Theseinclude,amongothers,theconstructionofroads,powerstations,pipelinesand,inthepresentcontext,rail.SixoftheSIPsaddressrailissuessuchasbranchlines,capacity,corridors,densification,infrastructure,investment,logistics,road-to-railshift,andupgrading.
Improving the country’s 20 247km rail network is a top Government priority, with projects aiming to address maintenance backlogs, increase freight rail volumes, grow market share of container traffic,andprocurenewfleetsforboththepassengerandfreightsectors.
TheDepartmentofTransportisresponsibleforthepassengerrailsystemwhichisbeingoverhauledwitha20-yearfleetrenewalprogrammeinplacetoprocuremorethan7200newtrains.Thepassenger rail network is managed and implemented by the Passenger Rail Agency of South Africa (PRASA), which focuses on revitalising the local industry through the local manufacturing of components. The existing rail network for both passenger and rail is being upgraded to take advantage of the new technological features and modernising rolling stock.
Around 2.2-million people travel by train every day in South Africa, and the Metrorail commuter services can be found in Cape Town, the Eastern Cape Province, Durban, and greater Johannesburg and Pretoria. The intention is to expand the rail services and their accessibility to the bigger emergent middle class, who are showing more aptitude and appetite to use an integrated but safe network.
6.3. Aviation Transport
Currently aviation contributes only 5% of the transport sector’s GHG emissions (GHG Mitigation Report, 2014).
SouthAfricanairlinescurrentlyhaveagingfleetsandlackfundsforretrofittingtheircurrentfleetsorforrenewal.Thereissomeworkbeingdonearoundinvestigatingtheswitchtobiofuels.Forexample, a project in Limpopo, Solaris, being done by South African Airways (SAA), American aeroplane maker, Boeing - in partnership with SkyNRG and Sunchem SA, is looking at using a high-energytobaccohybridforbiofuelproductionforaviation.Wealreadyhaveasuccessstory.TheSouthAfricanAirwaysgroupin2015operatedAfrica’sfirstsustainablebiofuelflight.MangoflewBoeing737-800sbetweenJohannesburgandCapeTown,makinghistoryasthefirstflightsoftheirkindontheAfricancontinent.Theflightsusedhome-grownfeedstockfromtheMarbleHallareaintheLimpoporegion.Inadditiontosupportingthehistoricflight,thefarmingprojectbroughtjobcreationandeconomicgrowthtothearea.SouthAfricaisenormouslyproudofthisbiojetfuel supply chain.
RecentlyAirportsCompanySouthAfrica(ACSA)launcheditsfirst200m2solarpowerplantatGeorgeAirport-demonstratingitscommitmenttocleanenergygenerationandsustainability.GeorgeAirportisSouthAfrica’sfirstandcurrentlytheonlyregionalairporttobepoweredthroughsolarenergy.ACSAisplanningonintroducinganenergymixintoallofitsairports.Overthenext18monthsthey are rolling out similar plants at all of their smaller airports – Kimberley, Upington, Port Elizabeth, East London and Bloemfontein.

21 Department of Transport: South Africa Department of Transport: Green Transport Strategy for South Africa (2018-2050)
As a member state of ICAO, South Africa has consented to the implementation of International Civil Aviation Standards and Recommended Practices (SARPs) and policies in support of a safe, efficient,secure,economicallysustainableandenvironmentallyresponsiblecivilaviationsector.Thesecouldincludeaircraft-relatedtechnologydevelopment;aircraft-basedemissiontestingwithpenalties;alternativefuels;improvedAirtrafficmanagement(ATM)andinfrastructureuse;market-basedmeasures;airportimprovements;andregulatorymeasures.AspertheStateActionPlan,2016, South Africa has committed to only focus on the improved ATM measures, as this is at an advanced stage of implementation due to the country’s Performance-based Navigation (PBN) Implementation Plan. This is also in line with reaching the Carbon Neutral Growth by 2020 from the aviation Industry as per ICAO principles.
6.4 Maritime Transport
Maritime transport is a very small contributor to transport sector emissions in South Africa: less than 2.2% (GHG Mitigation Analysis Report, 2014). This is due to maritime transport operating mainly beyond South African boundaries. The international nature of maritime emissions is being discussed under the relevant United Nations agency responsible for maritime safety and the prevention of pollution from shipping, the International Maritime Organisation (IMO). South Africa is a signatory to a number of multilateral conventions relating to climate change. The IMO is also responsible for implementing measures to reduce emissions from maritime transport. It must also ensure that it continues and expands its engagement with these multilateral processes which are responsible for setting important norms or standards for the sector, many of which relate to the environment.
MarineFishingmaybeconsideredunderMaritimeTransport,butbecausefishingismainlywithinSouthAfricanwaters(EEZ-ExclusiveEconomicZone),thesectorisnotdirectlysubjectedtotherulesandregulationsoftheIMO.TheDepartmentofEnvironmentalAffairs(DEA)publishedaninventoryofGHGemissions,butthisdidnotincludeSouthAfrica’smarinefisheries.However,CO2emissionsperlandedtonsoffishperyear,inferredfromadesktopexercise,wasroughlyestimatedas1.5milliontonsofCO2peryearfortheentirefishingsector,intheyear2000(DAFF,2016).Giventhattheestimatedtotalemissionsbythecountryforthatyearwas461milliontonsCO2,thefisheriessectoraccountedforonly0.35%ofCO2(DAFF,2016).
Currently,thissubsectoroffersarelativelysmallopportunityforsignificantactionsofchangeandGHGemissionreductionscomparedtothereductionsandimpactsthatcanbemadewithintheroad sub-sector.
ItisworthnotingthatSouthAfricaexportscommercialfishproductstoremotedestinationsinEurope,theUSAandFarEast.Thiscouldaddsignificantlytothecarbonfootprintoftherelevantfishingsectors. Even though, as stated above, maritime’s contribution to GHG emissions is only 1% of the total GHG emissions of the transport sector (GHG Mitigation Report, 2014), we still recommend thatmoreaccurateestimatesofthecarbonfootprintofSouthAfrica’sfishtradingactivitiesbeobtained.Weshouldalsomonitorthis.(DAFF,2016).
In conclusion, the Situational Analysis demonstrates that, while a strong and extensive legislative framework to guide the transport sector is in place, there has been a lack of focused strategy and policy in relation to cleaner mobility and green transport to guide regulating the transport sector. We have outlined a number of measures to be carried at provincial and local level. Unfortunately, there is no framework to guide the implementation of measures at national, provincial and local levels. The GTS development provides opportunities for the DoT to develop norms and standards to ensure that there is consistency in the way climate change responses are implemented across different jurisdictions (national, provincial and local).
SincethetransportsectorhasbeenidentifiedasoneofthemajorcontributorstototalGHGemissionsinSouthAfrica,theGreenTransportStrategyneedstomakeasignificantcontributiontoSouth Africa’s governance of low carbon mobility transport choices in the future, across all modes.
Measures that have been undertaken through the International Maritime Organisation include the adoption of a marine sulphur cap of 0.5%, as provided for in the MARPOL Annex VI, as from January 2020. As South Africa is party to the IMO, we will also need to abide by this regulation, and initiate the necessary plans to ensure its successful implementation.
7. STRATEGIC FOCUS
7.1 Vision
The vision of the GTS is to substantially reduce GHG emissions and other environmental impacts from the transport sector by 5% by 2050.
7.2 Mission
The GTS will support the contribution of the transport sector to the social and economic development of the country, while incrementally initiating innovative green alternative transformations in the sector to assist with the reduction of harmful emissions and negative environmental impacts associated with transport systems.

22Department of Transport: Green Transport Strategy for South Africa (2018-2050)
7.3 Values
In order to meet the county’s GHG emissions reduction targets within the relatively short time horizon, the transport sector needs to implement radical changes. At the same time, these changes should not undermine transport’s contribution to meeting economic and social needs for connection and mobility. In particular, the GTS seeks to:
• contribute to the prosperous functioning of a modern economy and cater for the transport needs of expanding human settlements
• provide for a healthy environment and supportive ecosystem services, while dismantling apartheid’s structural disconnection of poor people from economic opportunity
• reduce the cost and improve the convenience and safety of transport, ie. providing guidelines for favourable cost-effective future green energy technologies
7.4 Objectives of the Green Transport Strategy
• Enabling the transport sector to contribute its fair share to the national effort to combat climate change in a balanced fashion, taking into account the DoT and the sector’s primary responsibility ofpromotingthedevelopmentoftheefficientintegratedtransportsystemstoenablesustainablesocio-economicdevelopment;
• Promoting behavioral changes towards sustainable mobility alternatives through information, education and awareness raising;
• Engagingthelowcarbontransitionofthesector,toassistwiththealigninganddevelopingofpolicieswhichpromoteenergyefficiencyandemissioncontrolmeasuresinalltransportmodes;
• Minimizing the adverse effects of transport activities on the environment, and
• Facilitating the sector’s just transition to climate resilient transport system and infrastructure
7.5 Purpose of the Green Transport Strategy
The GTS will be the cornerstone of policy development within the transport sector for the lowering of GHG emissions, the contribution of transport to the green economy, the promotion of green sustainablemobilityandtheuptakeofcleanerandmoreefficienttechnologies.
TheGreenTransportStrategyservesasaguidefortheDoTtoimplementabasketofmeasuresthatwillsignificantly:
• reduce GHG emissions produced by the transport sector;
• reduce the environmental and human health impacts associated with the transport sector, resulting in a more resilient sector; and
• reducetransportGHGemissionstocontributesignificantlytonationaleffortsaimedatdecreaseemissionsasagreedtobytheSouthAfricanGovernmentatCOP21inParisthroughtheNDC.
Research undertaken by a host of other research organisations on behalf of the South African Government clearly indicates the following core conclusions:

23 Department of Transport: South Africa Department of Transport: Green Transport Strategy for South Africa (2018-2050)
• Implementing measures that will reduce the need to travel and avoid unnecessary trips through walkable communities, integrated land use planning or “transit oriented development” and improving vehicle occupancy rates.
• Given that the road transport sub-sector is responsible for 91.2% of direct emissions by the transport sector, shifting passenger choices to public transport and freight to rail is a necessity.
• Biogas and solar powered electric mobility surpasses any other cleaner fossil fuel in terms of GHG reductions.
TheGTSidentifiesandproposeskeymeasurestofacilitatethemodalshiftfromroadtorail,privatetopublictransport,andpromotescleanervehicletechnologies.Itisalsoimportanttopromotenon-motorised transport and develop the associated infrastructure to support this.
While vehicle efficiency and low carbon fuels have an important roleto play in reducing transport emissions, building a resilient low carbon transport system requires systemic changes in order to shift from the current situation of low-density human settlements in which the private car is the primary form of transport. Integrated transport planning that actively addresses the spatial planning implications of land use decisions is best achieved through cooperation between all affected departments in all spheres of Government.
7.6 Guiding Principles
The GTS is informed by the fundamental and substantive principles of sustainable development articulated in the National Strategy for Sustainable Development, as approved by the Cabinet in 2011 (DEA, 2011):
The substantive principles are based on the following sustainable development principles that are already enshrined in South African law and that underscore a systems approach to achieving sustainable development:
• Natural resources must be used sustainably.
• Socio-economic systems are embedded in and dependent on ecosystems.
• Basic human needs must be met to ensure that the resources necessary for long-term survival are not destroyed for short-term gain.
The fundamental principles of Sustainable Development can also be related to the following fundamental human rights that are guaranteed in the Constitution of the Republic of South Africa:
• Human dignity and social equity
• Justice and fairness
Figure 4: Comparison of GHG emissions from different transport fuels and technologies (Source: SANEDI, 2015)
24Department of Transport: Green Transport Strategy for South Africa (2018-2050)
• Democratic governance
• A healthy and safe environment
In the context of the GTS, this creates the following imperatives - to:
• reduce environmentally harmful emissions from the transport sector;
• reduce the impact of transport infrastructure on the environment;
• ensure integrated transport systems provide equitable access to economic opportunities for all South Africans and support economic growth and development; and,
• ensure that the provision of transport services and infrastructure includes using resources sustainably.
LONG-TERM VISION: THE USE OF RESOURCES AND SUPPORTING THE ECO-SYSTEM
• nstituting “no-car zones”, within most of the central business districts being closed off for car use, and emphasising eco-mobility mode of transport like walking and cycling as the preferred mode oftransport,allowingsignificantareasofurbanrealestatecurrentlyusedforparkingtoberepurposedforuseinaffordableinner-cityhousingandbusinesses.
• An extensive network of cycle lanes and pedestrian walkways to re-orient South Africa’s towns and cities away from cars towards people. The investment in non-motorised transport infrastructure will yield a double dividend in terms of human health, by both reducing harmful air pollution and promoting healthy exercise.
• Long-distancefreight,identifiedbytheNationalFreightLogisticsStrategy,willberestrictedtorail,withthedevelopmentof“GreenCorridors”intheroadnetworktopromotetheuseofcleanerefficienttechnologiesinourFreightindustry.Togetherwithintensifiedmodalshiftsinpassengertransport,thiswillgreatlyreduceroadtrafficandthecostsofmaintainingurbanandnationalroads,allowing resources to be redirected to environmentally sensitive upgrades of rural road infrastructure.
• Thereplacementoffossilfuelsbyvehicletechnologieswithloworzerotailpipeemissions,suchaselectricandfuelcellvehicles,willbefaradvancedand,coupledwithasignificantlylowernational electricity grid emissions factor due to a large scale switch to renewable energy improvements this will lead to a dramatic reduction in the carbon intensity of motorised transport.
• Allwastecollectionvehiclesandaportionofmunicipalbusesnotalreadyreplacedbyelectricvehicleswillberetrofittedtoenablepropulsionwithacombinationofbiogasandbiofuelsproducedfrom domestic, commercial and agricultural waste

25 Department of Transport: South Africa Department of Transport: Green Transport Strategy for South Africa (2018-2050)
7.7 Strategic Pillars and Implementation Themes
The Green Transport Strategy is based on:
- 5 implementation themes and
- 10 strategic pillars.
Theshort-termstrategictargetslistedbelowformpartofthe“quickwins”forthestrategy.TheywillessentiallyformpartofthefirstphaseoftheImplementationPlan:5to7years.
1. To achieve modal shiftsinthetransportsectorthatreduceGHGemissionsandotherharmfulemissions,reducetransportcongestionandimprovetemporal,spatialandeconomicefficiencyinthe transport sector. In particular, achieve a 30% shift of freight transport from road to rail by a 20% shift of passenger transport from private cars to public transport and eco-mobility transport.
2. Toconvert5%ofthepublicandnationalsectorfleetinthefirstsevenyearsoftheimplementationofthisstrategyandanannualincreaseof2%thereafter,tocleaner alternative fuel and efficient technology vehicles (ideally powered through renewable energy) and environmentally sustainable low carbon fuels by 2025, including the use of CNG, biogas and biofuels and the use of renewable energy to provide electricity for transport.
3. To reduce fossil-fuel related emissions in the transport sector by promoting norms and standards for fuel economy and putting in place regulations that promote improved efficiency in fossil-fuel powered vehicles and improved environmental performance of fossil fuels.
Figure 5: Showing change in cost of different fuel types (cost to improve the convenience and safety of transport)
Table 4: Strategic pillars of the Green Transport Strategy

26Department of Transport: Green Transport Strategy for South Africa (2018-2050)
4. To promote strategies and standards for delivering transport infrastructure, integrated transit planning and systems that build climate resilience in urban and rural communities, whilst minimising the environmental impact of transport infrastructure.
5. To develop best practice guidelines to ensure that integrated, climate- friendly transport options are incorporated into land use and spatial planning at national, provincial and local levels.
6. Investinsourcesofgreenenergy’sinfrastructure,suchasbiogasfillingstations,electriccarchargingpoints,GISintegratorICTtechnologyplatformsforlocatingstations,regulatingfuturepricingand providing statistics.
8 STRATEGIC INITIATIVES
TheGTSfocusesonprioritymeasuresthatwillcontributemosttoaradicalshiftinSouthAfrica’stransportemissionsprofile.Thecorollaryeffectsoffullimplementationwillbesafer,morereliableand cheaper transport options for the majority of South Africans. It is a recommendation of this strategy that “all future investments in the transport sector should be informed by the vision, guiding principles, and strategic objectives of the GTS”, while strategically involving youth in the planning and design of future models, through institutions of learning and regular engagements.
TheIUDFandNSDFpresentthespatialdevelopmentvisionforthecountry,thusgivingdirectionastowheredevelopmentandinfrastructureinvestmentis/andorwillbeconcentrated.TheIUDFemphasizes the importance of urbanization and space, therefor the IUDF seeks to unlock the potential of urban areas by implementing interventions that augment the spatial transformative, economic growth, poverty alleviation and inclusive impacts of urbanization. In order to help achieve this, the GTS has created a platform to incorporate and unpack the following policy levers of the IUDF, such as:
� a. integrated urban planning and management,
� b. integrated transportation and mobility,
� c. integrated and sustainable human settlements,
� d. integrated urban infrastructure, and
� e. efficientlandgovernanceandmanagementsystems.
The GTS must also locate and relate initiatives in Municipal Spatial Development Frameworks required interns of the Spatial Planning and Land Use Management Act, Act 16 of 2013. Currently the GTS ought to cite the BRT systems as not only a means to achieve modal shifts, but also to realise spatial transformation and economic growth. Here the bottom up and top down processes that ensures mutual reinforcement of local and national policies will be critical. The roles of provinces and municipalities in ensuring that the GTS is incorporated into spatial plans, land use schemes and related policies must be emphasised and vice versa. This is also in line with the Sustainable Urban Agenda which aims to:
• support better coordination between transport and urban and territorial planning departments in mutual understanding and policy frameworks ant the national, subnational and local levels, including through sustainable urban and metropolitan transport and mobility plans,
• strengthening sustainable transport and mobility by ensuring connectivity between cities and their surroundings,
• generatingandusingrenewableandaffordableenergyandsustainableandefficienttransportinfrastructureandservices,
• renewable energy costs give cities and human settlements an effective tool to lower energy costs
• adopting a “smart” approach that makes use of opportunities from digitilisation, clean energy and technologies, as well as innovative transport technologies

27 Department of Transport: South Africa Department of Transport: Green Transport Strategy for South Africa (2018-2050)
• improving road safety and integrating it into sustainable mobility and transport infrastructure planning design,
• promoting access for all to safe, age- and gender- responsive, affordable, accessible and sustainable urban mobility and land and sea transport systems, enabling meaningful participation in social and economic activities in cities and human settlements, by integrating transport and mobility plans into overall urban and territorial plans and promoting wide range of transport and mobility options, and
• establishing urban and territorial transport infrastructure and service funds at the national level based on a variety of funding sources ranging from public grants to contributions from other public entities and the private sector, enduring coordination among actors and interventions as well as accountability.
ThroughtheexecutionoftheGTS,anditsinitiativesit’simportanttobenon-prescriptivewiththeoutcomes/principlesoftechnologywithintransport,asthiswillallowforinnovationinpursuitofanemission lowering outcome for the transportation sector.
8.1 Integrated Transit Systems
Fundamentaltothegreeningofthetransportsectoristheseamlesslyintegratedfunctioningofthetransportsystem.Theseintegrationpoliciesandstrategieshavebeendefinedinalltransportsector planning, policy and strategy documents. Integration is the key principle on which all transport strategy rests for successful execution and functioning.
In terms of the GTS, the modal shifts to rail and away from private vehicle use are premised on integrated transit and feeder systems that make far greater use of public transport and non-motorised transport.
The interaction of transport infrastructure with the property market can lead to outcomes that are neither socially nor environmentally desirable. For instance, the provision of transport infrastructure such as railway stations or bus terminals tends to result in an increase in the market value of nearby property. This can have unintended local consequences in terms of converting residential property to commercial property and reducing the availability of land for mixed and low cost housing. The DoT needs to develop best practice guidelines to ensure that integrated, climate-friendly transport options are incorporated into land use and spatial planning - nationally, provincially and locally. One option is for the Minister to prepare such guidelines in terms of the provisions of the Spatial Planning and Land-Use Management Act to inform planning decisions.
In addition, Intelligent Transport Systems have the potential to reduce GHG emissions and can be used through transport planning processes to provide advanced data via digital connectivity such assignaltiming,real-timetravelerinformation,incidentmanagement,etc.Transportplanningandinvestmentdecisionscanimprovetheoperationalefficiencyofmulti-modaltransportnetworksand integrated transport and land use planning to reduce travel time. The DoT in consultation with National Treasury will provide a national team of experts to consult to all spheres of Government as infrastructure expands. The team of green transport integration experts will also consult to the Strategic Integrated Projects throughout their planning and execution.
8.2 Road Transport Initiatives
The road transport sector contributes approximately 91.2% of total transport GHG emission (GHGI, 2015). Therefore, the emphasis of the GTS must be on drastically reducing emissions from the road sector.
One of the primary intervention mechanisms to achieve this, is through achieving modal shifts in the transport of freight from road to rail, and from private vehicle use to public transport and eco-mobility transport for passenger transport.
Modal shift, which is generally an aggregate analysis phenomenon, takes place after a choice of travel mode, at an individual-user level, is made. One of the reasons for modal shifts from road to railisdeterioratingtransportassets,resultinginincreasedoperatingcostsandreducingefficiencyandindustrialcompetitiveness.
There is frequent comment on the dominance of road freight transport and the need to move freight from road to rail (DoT, 2005). Road transport services for bulk and semi-bulk commodities are often a more expensive second-best option, which is used by industry and logistics providers as the default option in the absence of available railway services. Road freight transport has continued toincreasewithheavygoodsvehicles(HGV)makingup34%oftrafficontheN3.HGVaccidentlevelsontheroutearethesameaslightvehicles.Thereisdeterioratinginfrastructureinallmodesand restricted capacity to fund maintenance, upgrading and modernisation of the infrastructure. There is a frequently-stated policy objective to transfer road freight to rail, for the purpose of reducing roadfreighttrafficandtheover-usageoftheroadinfrastructure(DoT,2005).

28Department of Transport: Green Transport Strategy for South Africa (2018-2050)
According to Page et al, (2001), the reasons for public transport users changing to private cars is affordability, availability and safety. Based on the 2003 national household travel survey, it is clear that,acrosstheboard,unavailabilityofservicesisthemainreasonfornotusingpublictransport.Therefore,inordertoinfluencemodeshiftfromprivatetopublictransport,itisimportantthateffortsare made to expand the public transport network, while making public transport available, affordable, convenient and easily accessible. Modal shift from private passenger cars to public transport hasthepotentialtosignificantlyreduceemissionsfromtheroadsub-sector,byemphasisingtheuseofandexpansionofservicessuchastheBRTservices,andpassengerrailsystems,thusencouraging a modal shift from private use to public transport use.
The DEA’s 2014 Mitigation Report provides estimates of the potential CO2 emissions reductions that can be achieved through modal shifts in the transport sector (Table 4), as well as the estimated costs of achieving these reductions per ton of avoided CO2 emissions. While the initial capital costs are high, by 2050 modal shifts in passenger transport represent a saving to the economy
The proposed tax on new vehicle sales (fuel-based) will be used to contribute to the cost of procuring green vehicles to ultimately bringing the price down.
The relaxing of taxes associated with green vehicles to further reduce the price to below the petrol or diesel vehicles is also another suggestion, Taxing diesel and petrol manufacturers is another possible way to fund e-mobility development in the country.
8.2.1 Road Passenger TransportThe GTS aims to assist with developing policy, regulatory norms and standards, fiscalinstruments and recommendations essential for achieving a modal shift of passengers from
private vehicle use to public transport, and particularly from road to rail.
Inordertoachievethesemodalshiftssignificantinvestmentisrequired.
• Bus rapid transit systemsneedtobesignificantlyexpandedthroughoutthelargecities.Security,reliabilityandfrequencyofBRTsystemsalsoneedtobeimproved.
• The taxi industry, a major component of the transport sector, needs to be engaged to develop their role as important feeders to the public transport system.
• An intelligent transport system must be developed, where all public transport including the minibus industry can be monitored by metropolitan control centres through GPS, GIS and loT connectivity.Theintelligenttransportsystemwillprovideinformationtothepublicaboutcongestion,stationsavailable,transportoptions,aswellasarrival/departuretimesthroughoutSouthAfrica’s large urban cities.
• A single ticketing system should be developed, where the public can use smart tags as the payment mechanism. The smart tag will be swiped on entry and exit of the public transport system. It could also be used in the minibus taxi industry. The smart tag will be loaded with funds at the same distribution points used to buy mobile air time. Non-motorised transport infrastructure, namely the building of cycle lanes along key transport routes and improved pavements walkways must be included in the maintenance mandates of SANRAL and local government where appropriate. These facilities require urgent expansion to provide for the majority of South Africans who use non-motorised transport as their primary mode of transport and to capitalise on the growing public desire for non-motorised ‘green’ transport.
• The planning and design of transport infrastructure expansion must consider future eco-mobility developments.
• Government will work with the private sector to expand the current number of electric charging stations powered by renewable energy sources. These stations will also be accessible to the general public.
Table 5: Estimated mitigation potential and cost (which are likely to be borne by the public and private sector, as well as consumers) of modal shifts in the transport sector
Source: GIZ mitigation potential analysis on behalf of DEA 2014
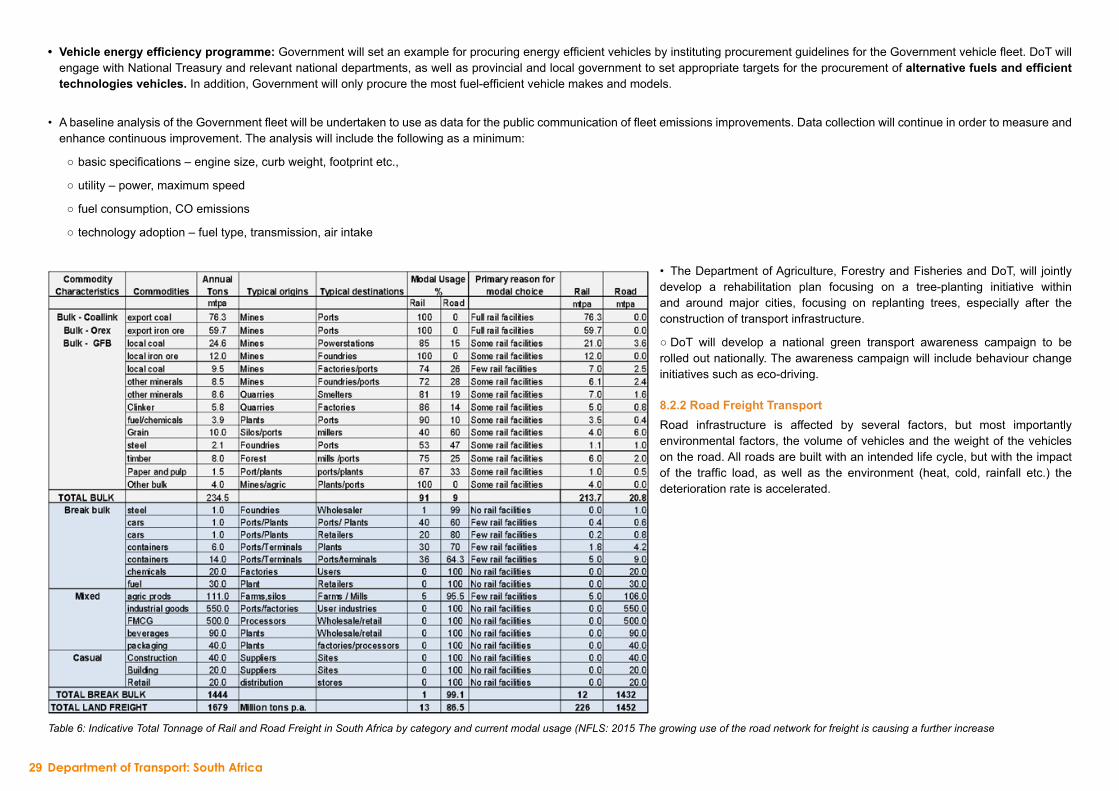
29 Department of Transport: South Africa Department of Transport: Green Transport Strategy for South Africa (2018-2050)
• Vehicle energy efficiency programme:GovernmentwillsetanexampleforprocuringenergyefficientvehiclesbyinstitutingprocurementguidelinesfortheGovernmentvehiclefleet.DoTwillengage with National Treasury and relevant national departments, as well as provincial and local government to set appropriate targets for the procurement of alternative fuels and efficient technologies vehicles.Inaddition,Governmentwillonlyprocurethemostfuel-efficientvehiclemakesandmodels.
• AbaselineanalysisoftheGovernmentfleetwillbeundertakentouseasdataforthepubliccommunicationoffleetemissionsimprovements.Datacollectionwillcontinueinordertomeasureandenhance continuous improvement. The analysis will include the following as a minimum:
○ basicspecifications–enginesize,curbweight,footprintetc.,
○ utility – power, maximum speed
○ fuel consumption, CO emissions
○ technology adoption – fuel type, transmission, air intake
• The Department of Agriculture, Forestry and Fisheries and DoT, will jointly develop a rehabilitation plan focusing on a tree-planting initiative within and around major cities, focusing on replanting trees, especially after the construction of transport infrastructure.
○ DoT will develop a national green transport awareness campaign to be rolled out nationally. The awareness campaign will include behaviour change initiatives such as eco-driving.
8.2.2 Road Freight TransportRoad infrastructure is affected by several factors, but most importantly environmental factors, the volume of vehicles and the weight of the vehicles on the road. All roads are built with an intended life cycle, but with the impact of the traffic load, as well as the environment (heat, cold, rainfall etc.) thedeterioration rate is accelerated.
Table 6: Indicative Total Tonnage of Rail and Road Freight in South Africa by category and current modal usage (NFLS: 2015 The growing use of the road network for freight is causing a further increase

30Department of Transport: Green Transport Strategy for South Africa (2018-2050)
Table 7: Showing the tonnage of freight moved by train (Source: Freight Train / NP&A)
in maintenance requirements and costs for the road network, adding to congestion and the growth in emissions and particulate matter in the air. Strategic action, including possible regulatory or fiscalmeasuresisneededtoencouragefreighttobetransportedviatherailnetwork.Theincreaseduseofrailwilleasetheenvironmental,healthandcongestionburdens.MoreimportantlyasseeninTable6,theneedformodalshiftofsomecommoditiesisanecessityforimprovingtheefficienciesofbothmodes,andalsoformanagingnegativeexternalitiesasmuchaspossible.
RailtransportablefreightthathasbeenidentifiedasperTable7below,shouldideallynotbetransportedviatheroadnetwork.Historically,railwasthepreferredmethodofmovingfreightinSouthAfrica, but following deregulation of the transport sector, the rail market share, and consequently also investment in rail transport infrastructure, has progressively decreased. There is a modal imbalancebetweenroadandrailmovements,whichleadstoanunsustainableuseofroadinfrastructure(Havenga&Pienaar2012).Thishasledtoastrainonthenationalfiscusduetoincreasedcapital and maintenance costs of road infrastructure, as well as demands on the private sector, as the cost of road transport has been increased (Freight shift from road to Rail Report, DEA, 2014)
South African roads are under more pressure from increased freight and passenger transport within the Southern African Development Community (SADC) region. South Africa has the largest ports and provides important transit corridors to the SADC region. The pressure is also compounded by the large movement of people coming to South Africa in search of employment and better opportunities.
Recommended road regulatory actions
DoT will prepare the following regulatory actions targeted at encouraging the modal shift from road to rail and from private vehicle use to public transport:
• In consultation with the cities (local government), DoT will assist with the development of regulatory and policy frameworks for levying a congestion charge on vehicles entering central business hubs. International best practice with regard to congestion zone taxing will be taken into account. Congestion zone taxing, however, will require supporting infrastructure – park and rides, integrated eco-mobility transport facilities, as well as bike and car share scheme development.
• In consultation with stakeholders and the National Treasury, review the current levels of the environmental levy on new motor vehicle CO2 emissions and expand the tax to include commercial vehiclestomoreeffectivelyinfluenceenergyefficiencyandtheenvironmentalperformanceofthecountry’svehiclefleet.
• Develop a regulatory regime in consultation with National Treasury for the annual taxing of vehicles based on their emissions through the annual car licensing renewal system.
• Enhancetheregulatoryregimetoincludeathree-yearlytestonvehiclesthatcoversroadworthinessandexhaustemissions.Thetestcertificatewillneedtobeproducedeverythreeyearsofcarlicensing renewal. The test scores will be used to adjudicate a price relative to safety and emissions performance.
• Theuseofvehiclefueleconomynormsandstandardstolabelvehiclesintermsoftheirfuelefficiencyandemissionstandardswillcontinue.Baselinestudiesontheimplementationofmorestringent fuel economy standards (such as Euro V) should lead to the adoption of appropriate greener standards.
• ntroduce car life cycle limits on the road, i.e. a car with an engine more than 400 000km must be banned from the road, or scrapped (e.g. propose a similar program such as the taxi recap).
• In consultation with cities, DoT will assist with the development of regulations to ensure that freight vehicles may only enter urban hubs during off peak hour

31 Department of Transport: South Africa Department of Transport: Green Transport Strategy for South Africa (2018-2050)
• Researchwillalsobeconductedintotheviabilityofre-introducing“Roadfreightpermits”inSouthAfricawithpermitpricingreflectingtheemissionsfortonnecargooffreightvehicles,aswellasroad-use charges to internalise the externalities of possible overloading from freight haulers.
• The DoT will develop green standards and guidelines for road construction, maintenance and upgrades. This will include standards and guidelines on climate change resilient materials.
8.3 Rail Transport Strategic Initiatives
Rail provides the most immediate relief required to meet emission reduction targets in the limited time frame available. The GTS supports the determination of the NATMAP 2050 vision to establish targeted high-speed intercity networks, heavy haul, tram rail, cable cars, double stacking and contemporary urban rail options. This vision could revitalise rail in South Africa through investment in a small high-performance new network that can set extra-urban railways on a renaissance trajectory and expand funding sources through private sector participation. Rail is far superior from a direct emission mitigation perspective than road transport.
Directemissionsfromtherailsectorcontributeonly1.6%ofalltransportemissions(GHGI,DEA,2015).However,thisfigureexcludesemissionsfromelectricityconsumption.Thereareaccordinglysignificantinvestmentcostsrequiredtoactualisethemodalshiftrequiredforachievingthesector’sreductionfigures.Thesecostscanbecoveredbyextractingtaxesandpenaltiesfromtheemittersof GHG and reinvesting these funds into modal shift initiatives.
8.3.1 Passenger Rail TransportThe DoT, through the GTS, supports the following rail policy directives and additional proposed regulatory frameworks:
• Invest in the improvement and development of PRASA’s (passenger rail) infrastructure and services.
• Restore and revitalise the rural branch line network.
• Drawing from the Gautrain model, expand and upgrade rail networks into all urban areas.
• Increase frequency, digital information connectivity (IoT), and reliability and safety levels for passengers.
• Secure local and global private sector participation in high-speed networks.
• Conduct research to appropriately tax the road transport sector for road maintenance.
• Develop a system to incentivise corporates and private sector spend on rail transport.
• Encourage PRASA to investigate a move towards fuel-cell and solar powered locomotives in a shift to using low carbon energy sources.

32Department of Transport: Green Transport Strategy for South Africa (2018-2050)
• The DoT together with industry will also initiate the development of Green standards and guidelines for rail infrastructure and construction, maintenance and upgrades. This will include standards and guidelines on climate change resilient materials.
8.3.2 Freight Rail Transport
• Increase frequency, digital information connectivity (IoT), reliability and safety levels for freight.
• Design a pricing system that is competitive with road transport.
• Develop tax incentives related to corporate and private spend on rail transport.
• Encourage Transnet to move towards fuel-cell and solar powered locomotives in a shift to using low carbon energy sources (figureabove).
• The DoT will develop green standards and guidelines for rail infrastructure construction, maintenance and upgrades. This will include standards and guidelines on climate change resilient materials.
8.4 Aviation Transport Strategic Initiatives
Althoughemissionsfromdomesticaviationhavemorethandoubledsince2010,(StateActionPlan,DoT,2015)reflectingthelargegrowthinpassengerdemandoverthisperiod,aviationstillonlycontributedlessthan8%tototaltransportGHGemissions,inSouthAfrica.However,thisfigureislikelytogrow,giventhegrowthinpassengerdemandforairtravel(GHGI:DEA:2014).
The estimation of baseline fuel consumption and CO2 emissions for international aviation within South Africa was done with assistance from ICAO statistics. The baseline was projected from 2016 until 2050.
Figure 1 shows that in the absence of any measures - ‘do nothing approach’ - there will be a gradual increase in CO2 emissions. In order to contribute towards the global ICAO goal of Carbon Neutral Growth (CNG) 2020, South Africa selected measures to begin the implementation process. Historic data was obtained from ICAO, thus the methodology used for differentiating between international aviation and domestic emissions is the ICAO methodology (State of Registration).
Figure 6: Showing Fuel Cell future estimated cost compared to other technologies

33 Department of Transport: South Africa Department of Transport: Green Transport Strategy for South Africa (2018-2050)
The International Civil Aviation Organisation (ICAO) is a UN specialist agency, established by States in 1944 to manage the administration and governance of the Convention on International Civil Aviation. As a member state of ICAO, South Africa has consented to the implementation of International Civil Aviation Standards and Recommended Practices (SARPs) and policies in supportofasafe,efficient,secure,economicallysustainableandenvironmentallyresponsiblecivilaviation sector.
ICAO’s basket of measures to reduce CO2 emissions from international aviation include the following:
• Aircraft-related technology development;
• Aircraft based emission testing with penalties,
• Alternative fuels;
• ImprovedAirTrafficManagementandinfrastructureuse;
• Market-based measures;
• Airport improvements; and
• Regulatory measures.
As per the State Action Plan, 2016, South Africa has committed to only focus on the improved ATM measures. The plan is at an advanced stage of implementation due to the country’s Performance-based Navigation Implementation Plan.
TheAirTrafficandNavigationServices(ATNS)CompanyisthehomeofexpertairtrafficcontrolandmanagementsolutionsforSouthAfrica,aswellas10%oftheglobalairspace.SouthAfricahasembarkedonaprojecttoaligntheSouthAfricanfixedroutestructuretosupportPBNimplementation.Theprojectisaimedatreducingtrackmilesforaircraftoperatingintheen-routeenvironment;this reduces fuel burn, emissions and words towards environmental sustainability.
The important ICAO initiative of Aviation System Block Upgrades (ASBU) in facilitating a seamless global air navigation system has been collectively embraced by the RSA. In support of the ASBU initiative, RSA, through the aviation industry-sanctioned ATM roadmap (led by ATNS), rolled out several ongoing initiatives to facilitate compliance with Block 0, as detailed in the ASBU framework.
CollaborativeinitiativessuchastheUnitedNationsTradeandDevelopmentAgency(USTDA)airsidecapacitystudy;facilitatetheflexibleuseofairspace;andairtrafficflowmanagement.Afurtherinitiative in line with the ASBU Block 0 upgrade is the implementation of PBN. Envisaged milestones in achieving the PBN initiative include revised terminal area procedures for several airports suchasLanseria,George,EastLondonandPortElizabeth.Theserevisionsareaimedatenhancingtheflexibilityandefficiencyofbothdepartureanddescentprofilesforairspaceusers,thusaddressingseveralPIAs,includingtheenvironmental-(greenerairports)andefficiency-(flexibleflights)relatedparametersassociatedwithairtravel.
AirportsCompanySouthAfricahasandcontinues to invest in infrastructuralandoperationalupgrades. Inaddition,GeorgeAirport is thefirstairport inSouthAfrica to installextensivesolartechnology. ACSA also intended to participate in the Airports Council International’s (ACI) Airport Carbon Accreditation programme in 2016. Reduced energy demand projects include the installation of building management systems which reduce electrical demand, and the installation of cleaner alternative sources of power generation such as the installation of photovoltaic panels which generate a portion of the airports’ electrical demand. Projects for the installation of photovoltaic panels have already been completed at three ACSA airports.
Figure 7: Absence of measure baseline in Aviation for S.A (Source: DOT State Action Plan: 2016)

34Department of Transport: Green Transport Strategy for South Africa (2018-2050)
SAAhasaprogressiveenvironmentalstrategy,withtheoverallandfirmobjectiveofbeingrecognisedamongsomeofthemostenvironmentallysustainableairlinesintheworld.ThefirstAfricansustainablebiofuelflightwasdonebySAAon15July2016.SAAandMangoflightsonBoeing737-800soperatedbetweenJohannesburgandCapeTown,makinghistoryasthefirstsustainablebiofuelflightstohavetakenplaceinAfrica.SouthAfricaiscurrentlyimplementingoneofthesevenmeasureshighlightedbyICAO.However,CO2emissionsareslowlybeingreduced.Therefore,for the country to reduce more CO2 emissions, some of the other measures listed below need to be fully implemented.
The following assistance will be needed to enable the implementation of other measures:
• Research and innovation
The RSA intends to implement some of the seven measures recommended by ICAO. We need assistance in various research areas that have a role to play in ensuring CNG 2020. Heavy involvement of youth in innovation is critical to designing a suitable future for them.
• Education
Trainingoncollection,monitoring,reportingandverificationofdataisrequired,inadditiontofilteringthroughtolowerlevelsofeducation.
• Finance
The process of taking the alternative fuels measure from a conceptually small-scale project to a large industrially viable stage will require massive upscaling to produce enough sustainable feedstock.Arefinerywillneedtobeestablishedtoprocesstheoilthatisproduced.Penaltiesfromsingleaircrafttestingcanbeused.Thecompetitioncommissionhasgoodmodelsthatcouldbeadopted.
• Technical support
For the alternative fuels project, knowledge of agronomical and mechanical best practices is needed to optimise the supply chain. This can be achieved through bringing in retired experts - both locally,aswellassomethroughtheGermangovernmentSESprogramme-http://lang.ses-bonn.de/en/.0
ThefinancialpressurescurrentlyexperiencedbytheindustryinSouthAfricamakeitchallengingtoprocurenew,moreefficientaircraftorinvestinbiofuelproduction.Henceeffortsareconcentratedonretrofittingtechnologiesandimprovedoperationalefficiencies.
8.4.1 Carbon Off-setting and Reduction Scheme for International Aviation (CORSIA) ICAO’s CORSIA aims to achieve Carbon Neutral Growth by mitigating aviation emissions above 2020 levels, through the purchase of carbon offsets. Starting in 2021, the system will be implementedinthreephases:voluntarypilotandfirstphasesfrom2021to2026,andthenamandatorysecondphaseforstatesaccountingforapproximately75%oftrafficgrowthfrom2027to2035. The mandatory phase is implemented through a dynamic approach, in which the offsetting requirement for a given carrier transitions from the industry average to the growth rate of that airline.Theoriginalmeasure,developedduringthe38thAssembly,proposedamandatoryphasestartingin2021.Toaddressconcernsfromlessdevelopedcountries,thefinalisedmeasurepushedthe mandatory second phase to 2027, adding two voluntary phases: a pilot phase from 2021–2023, and Phase 1 from 2024–2026. As of January 30, 2017, 66 member states, representing about 64% of global traffic as covered by CORSIA, have pledged their participation in the pilot phase. Countries choosing to opt-in later may still do so, and any countries participating in the voluntary phases can later choose to opt out with six months’ notice to ICAO. (ICCT, 2017)
The mandatory phase, starting in 2027, will apply to all member countries, with exceptions for developing countries and small markets. Small Island Developing States (SIDS), Least Developed Countries (LDCs), and Landlocked Developing Countries (LLDCs) will be exempt from the measure - unless they choose to opt in. The same will hold true for countries whose 2018 global aviation activity market share is less than 0.5% of the global total or is not within the 90% cumulative share, from largest to smallest, of all international aviation activity in the form of RTKs.

35 Department of Transport: South Africa Department of Transport: Green Transport Strategy for South Africa (2018-2050)
The offsetting obligation will begin based on the sectoral growth rate, in which all air carriers purchase offsets for emissions that are consistent with the average emissions growth rate of the entire sector since 2020. Starting in 2030, the offsetting obligation will transition to an individual approach, where unique air carriers offset some portion of their own individual growth since 2020. Starting in2022,ICAOplanstoreviewthemeasureeverythreeyearstoadjustasnecessary.Afinalreviewwilltakeplacein2032,whenICAOwilldecidewhethertoextendCORSIAbeyond2035.
CORSIA establishes a framework under which airlines will purchase carbon credits from other sectors to offset most emissions above 2020 levels. Thus, the impact of the system on both net (in-sector emissions minus offsets) and absolute in-sector aviation emissions will depend on the criteria used to determine offsets eligible for use under the system and, correspondingly, the cost of thoseoffsets.Becausethosecriteriaarestillunderdevelopment,itisdifficulttodefinitivelyassesstheimpactofthissystemonabsoluteemissionsuntilthecriteriaarefinalised.
TheCORSIAapproachcouldimpactabsoluteaviationemissionsifthedirectoffsettingcostsarehighenoughtopromotefurtherfuelefficiencyimprovementsortoraiseticketpricesenoughtoreducedemand.OneapproachtoestimatingtheeffectofCORSIAonefficiencyistocomparethedirectcostsimposedbyCORSIAtotheunderlyingcostoffuel.Thecostoftheoffsettingrequiredby CORSIA depends on the price of offsets, the year of implementation, the growth rate of a given airline, and the fraction of the offsetting obligations based on the individual airline’s growth, as opposed to the sectoral growth.
WithinICAO’sapproachtoreduceCO2emissionsfrominternationalaviation,whichincludespromotingoperationalefficiencyimprovements,moreefficientaircraftandenginedesign,andlowcarbonfuels,CORSIAismeanttoactasthefinal“gapfiller”tooffsetanyremainingpost-2020emissionsgrowth(ICCT,2017).Withcurrentexemptions,however,CORSIAwillcover,atmost,75%oftrafficgrowthnotreducedbytheothermeasures.Becausethecoveragegapresultingfromtheseexemptionswillnotberedistributedtoparticipatingcarriers,theCNG2020goalisnotexpectedto be met, regardless of low carbon fuel use or operational and design improvements. CORSIA applies to CO2 emissions growth from international aviation only. It does not apply to domestic aviation,whichwasresponsiblefor30%ofaviationtrafficin2014.CORSIAalsodoesnotaddressthenon-CO2climateimpactsofaviation,notablymethane,nitrousoxides,blackcarbon,andtheprecursors of AIC.
8.5 Maritime Transport Strategic Initiatives
Government’s approach to protecting the marine environment from pollution is both proactive and reactive. The proactive component is the responsibility of South African Maritime Agency (SAMSA) – preventing pollution from ships. The reactive component is the mandate of the Department of Environmental Affairs (DEA) – mitigating and combating the effects of pollution from ships once it has occurred. Ports are required to provide adequate environmental infrastructure and systems, such as reception facilities. This helps to mitigate illegal dumping of ship-sourced pollutants at sea.
The protection of the environment and ecosystems on which our livelihoods depend has emerged as one of the most pressing issues in the past few decades. Concerned with the implications ofunsustainableconsumptionoffinitenatural resources,governmentsdecided to launch,working through theUnitedNationssystem, throughmultilateralenvironmentalagreements.Theseagreements,whileintendedtoaddressdifferentenvironmentalproblems,andofdifferingproportions,shareonecommonality,namelytheprotectionoftheenvironmentforthebenefitofpresentand future generations.
Multilateral environmental agreements, by their very nature, are agreed at a global level, but implementation typically takes place at a national level. South Africa (through the Department of Transport) is a signatory to several of these agreements, with corresponding rights and obligations. The country needs to formulate and implement policies related to its multilateral obligations regarding the protection of its marine environment, while also giving effect to national environmental legislation.
Oceansandcoastsareintrinsicallylinkedwithsocietyandprovidehumankindwithmanyenvironmental,economicandsocialbenefits,fromregulatingtheweatherandclimatetoprovidingoxygen,food and livelihoods to the global population. However, overexploitation of our marine environment over the years and other human activities, such as the burning of fossil fuels, have had an adverseimpactontheocean;therefore,effectivestrategiesthatwillhelpprotectthemarineenvironmentforthebenefitofpresentandfuturegenerationsneedtobeexplored.
To date, the country’s maritime transport sector programmes and other interventions have been skewed in favour of industrial development, and marine environmental protection has largely been ignored.Thenotionofsustainabledevelopmentcallsforthebalancingofthreepillars:social,economicandenvironmental.Governmenthasadutytoprotectthemarineenvironmentforthebenefitof present and future generations.
Althoughthemaritimeindustryhasalwaysbeenpronetoenvironmentalissues(suchasoilpollution,ballastwaterissuesandcombatingaquaticinvasivespecies)andenergyinefficiencies,theseissues have taken on a new urgency in view of global warming and air pollution by ships. Hence, the department will continue to be concerned with these issues. The protection and preservation of the environment is a pressing issue for developing nations, but the maritime industry knows no boundaries. Environmental compliance issues are now paramount in the international arena. It is in the interests of the South African maritime industry to be kept abreast of international environmental compliance issues and to prepare for them. This way, when they are eventually extended to the South African industries, they will be implemented without hindrance.

36Department of Transport: Green Transport Strategy for South Africa (2018-2050)
The mandate and obligations to develop policies and take corresponding measures for the protection of the marine environment stem from many international, continental and regional policy declarations. In addition, South Africa is party to many political declarations, including the Rio Declaration on Environment and Development and its Agenda 21, 1992, the Millennium Declaration and the Millennium Development Goals, 2000, as well as the Rio+20 Declaration. Furthermore, at national level, various pieces of environmental legislation and policies have a bearing on the maritime transport industry or policy, including the Constitution of the Republic of South Africa (Act No. 108 of 1996), the National Environmental Management Act, No. 107 of 1998, and the White Paper on National Climate Change Response, 2011.
Maritime transport is arguably the most ecologically-friendly mode of transport andthemost fuel-efficientwayofcarryingcargo. Internationalshippingcausesaround 3% of the global carbon dioxide emissions from fuel combustion. The international regulatory framework under the Kyoto Protocol does not, however, cover bunker fuel emissions from international shipping.
Recent developments in global warming and climate change have sharpened the focus on the need to regulate issues such as pollution caused by the discharge of oil, liquid and other harmful substances, sewerage, as well as garbage from normal shipping operations. This includes air pollution, particularly the need to regulate and reduce GHG emissions from shipping. Nitrogen and sulphur dioxide are two of the major causes of environmental problems in the shipping industry.
The growth in international trade means that international shipping is expanding. Moreover, the globalisation of the shipping industry and economic activity promotes international shipping and consequently increases global emissions.
Another measure that has been undertaken through the IMO is the adoption of a marine sulphur cap of 0.5%, as provided for in the MARPOL Annex VI, effectiveJanuary 2020. As South Africa is party to the IMO, we will need to abide by this regulation, and initiate the necessary plans to ensure its successful implementation.
8.6 Pipeline Transport
IntheGreenhouseGasInventory(GHGI),thetransportsectorisdefinedintermsofroadtransport,railways,civilaviationandwater-bornenavigationcategories.However,thetransportofcertainproducts (for example primary fuels) can also be accomplished using pipelines. Within the GHGI the emissions associated with energy used in pipeline transport and particulates released are allocated to other sectors. They are therefore not relevant to the GTS. (Source: GIZ mitigation potential analysis)
8.7 Cleaner Fuels and Alternative Fuels
In terms of reducing the use of fossil fuels, the DoT needs to actively promote investment in the production of biogas, the use of CNG, LNG, as well as fuel cell and solar powered EVs. In addition, there is currently no policy or regulatory framework that determines the requirements, norms and standards for cleaner fossil fuels in South Africa. There is also no policy or incentive scheme that rewards users of cleaner fuels and cleaner fossil fuels. As mentioned below, the development of these regulatory and policy frameworks is an immediate priority.
Maritime Policy Statement Summary

37 Department of Transport: South Africa Department of Transport: Green Transport Strategy for South Africa (2018-2050)
Transnet is planning to develop LNG import facilities at the ports of Richards Bay, Ngqura and Saldanha. This will facilitate downstream security of future supply of natural gas for CNG demand.
The production and burning of fossil fuels is the primary cause of global warming. Every effort therefore needs to be made to reduce the impact of fossil fuels.
There are two options available:
1. Reduce the use of fossil fuels.
2. Produce cleaner fossil fuels.
By adding strategic tax penalties for new fossil fuel vehicle buyers, that money could be used to contribute to the cost of buying green vehicles and bring the price down. By moderately reducing taxes associated with green vehicles, the intention is to further reduce the price to below that of petrol or diesel cars.
The two options listed above will enable the mobilisation of the sector towards moving into a low carbon intensive approach. The DoT also needs to promote the use of biofuels within South Africa, asthisrenewableenergysourcepresentsthepotentialfornumerousenergysecurityandefficiencybenefitsfortheSouthAfricaneconomy.ThebiofuelsindustryalsohasthepotentialtocontributesignificantlytojobcreationinSouthAfrica.
8.7.1 Cleaner Fossil FuelsFossil fuels are the single largest contributor to GHG emissions in the transport sector (GHGI, DEA, 2014). In order to meet Government’s global commitments low carbon intensive fuel
TheDepartmentofEnergyisalsoengagedinthe“CleanerFuelsProgramII”(CF2),whichisessentiallytheplannedupgradingofoilrefineriesinSouthAfricatoproduceEuro5-specificfuels.TheCF2 regulations stipulate that sulfur levels in petrol and diesel must remain below 10 parts per million (ppm). This new national standard was supposed to have taken effect in July 2017, however the implementation of this regulation has not reached the level of uptake and support from the sector that it requires. The 10ppm fuel is currently only being produced and available at the pump by SASOL. The Department will also look into the IRP for references for this proposed lower carbon fuel transitioning that the GTS is proposing.
Cleaner Fossil Fuel Regulatory actions:
• Asthemandatedentityfordraftingfuelregulations,theDepartmentofEnergywillbeengagedindraftingregulationsrequiringrefineriestoproducefossilfuelsthatmeetnewstandardsandnormsrequiredforemissionsprofiles.
8.7.2 Compressed Natural Gas (CNG):Natural Gas has begun to take a foothold in the South African market in both the minibus taxi industry and in the cities’ Metro bus systems. While not as GHG friendly as renewable energies or pure biogas, Natural Gas produces less emissions than the current fossil fuels being used in the country. As such it could serve as a potential transition fuel to stimulate biogas production by developing a potential off-take market.
The DoT will capitalise on the private sector’s initiative to grow the use of CNG in South Africa by working with the Development Bank of South Africa’s (DBSA) Green Fund, Department of Trade andIndustry(DTI)andtheIndustrialDevelopmentCorporation(IDC)tomakedevelopmentandprojectfinanceavailableatattractiverates.Theprivatesectorhasconcentratedonprovidinggas-firedboilersystemsandconvertingminibustaxisintodual-fuelvehicles.
Theprovisionofattractiveorconcessionaryfinanceratestotheprivatesectoriskey.Theprivatesectorshouldbeencouragedtoaggressivelypursuethisinitiative.AggressivecommunicationisrequiredfromDoT(andlocalandprovincialentitiesresponsiblefortransport)withtheminibustaxiindustry,tohighlightthebenefitsandcost-effectivenessofCNGrelativetofossilfuels.
Security of CNG supply is crucial. Currently South Africa has no CNG reserves available other than from Mozambique. In addition, the distribution network for gas is limited. The private sector is currently using road to transport gas the last mile from the large national and provincial pipelines. Additional domestic and regional supplies of CNG are currently being investigated, including off-shore natural gas reservoirs and “fracking”.

38Department of Transport: Green Transport Strategy for South Africa (2018-2050)
CNG Regulatory Actions:
The following initiatives form the backbone of DoT’s efforts to promote the use of Natural Gas:
• Inconjunctionwithcities,DoTwillassistwithdraftregulationsrequiring10%oftheMunicipalfleetstobeconvertedannuallytoenergyefficientvehicles.
• DoTwillleadtheefforttoprovideavailablefundingmodeloptionsuponrequestfortheconversionofminibustaxistodual-fuelvehiclesandretrofitfillingstations.
• DoT will initiate discussions with the taxi industry to promote dual-fuel conversion.
• DoT will draft regulations to foster a conducive environment for the conversions of public and quasi-public transport vehicles to be converted to dual-fuel vehicles within 10 years.
8.7.3 Biogas and Biofuels The production of biogas through growing biomass material can have negative effects on food production and water usage as a result of the hectares and water needed to produce the biomass. Itisthereforenotideal.However,theproductionofbiogasusingexistingwastematerial–sewerage,animalmanure,landfills-directlyatthesiteofthewastestorageorproductionisfinanciallyfeasible. As with biogas, there is concern around the production of biomass for biofuel production regarding food security, water usage, and the hectares of land required. This also could have a negativeimpactonfoodprices.Biofuelneedstoberegulated.Forthestatedpurposesoffoodsecurityandenvironmentalconcern,theFinalBiofuelsStrategyproposestheproductionofspecificcrops for the production of bioethanol and biodiesel (Department of Energy, Draft Position Paper, 2014).
TheDoTandDoEwillestablishateamtoexaminethecostandbenefitsofbuildingbiogasplantsatlargeurbanlandfillsitesandsewerageplants.Thisresearchwillbeextendedtocompilingacost/benefitanalysisofconstructingsmallerbiogasplantsatthesitesoflargebuildingsthathouseconsiderableamountsofpeopleandthereforeproducelargerquantitiesofwaste.
Biogas Regulatory actions:
The team of experts will also investigate and draft regulations that:
• compel Government vehicles that are directly related to waste and have everyday access to biogas to use biogas as a fuel.
• in conjunction with National Treasury, draft tax incentive mechanisms for the use of biofuels in the private sector. Private sector tax incentives will encourage private sector investment in biogas production.
• develop a system for centralising animal manure collections at regional biogas plants to increase feedstock.
The Biofuels Industrial Strategy of South Africa followed by the Position Paper in terms of the National Energy Act34 of 2008, published by the DoE on 15th January 2014 provides for a 2% (or 400 million liters per annum) dispersion level of biofuels into the national liquid fuels supply. The deadline for the mandatory blending of biofuels with petroleum was set for the 1st October 2015, in an attempttofosteraregulatoryenvironmenttoenabletheproductionofbiofuelsthroughthefullandproperimplementationofthefinalBiofuelsStrategy.Theabovetimeframesfortheimplementationof the Biofuels strategy have not yet be achieved.

39 Department of Transport: South Africa Department of Transport: Green Transport Strategy for South Africa (2018-2050)
8.8 Electric Vehicles (EVs)
Currently the market share of EVs in South Africa is minimal (approximately 700 vehicles). However, this number is expected to grow exponentially to make a meaningful contribution to reaching GHG reduction targets. Given the fossil fuels associated with electricity production and the pressures on South Africa’s electrical power generation and distribution systems, EVs should preferably be charged via renewable energy and in future may even assist as back-up power sources to households and grid feed through their batteries. Solar power is responsible for very low GHG emissions (primarily associated with the manufacture of photovoltaic cells).
Electric Vehicle Actions:
In order to radically grow the uptake of EVs in South Africa DoT, in conjunction with DTI and National Treasury, the DoT will:
• offer producers of EV vehicle manufacturing incentives to both produce and sell affordable EVs in South Africa, for both the local and export markets.
• work with local research institutions to conduct research on EV batteries.
• work with national, provincial and local government departments and authorities and the automobile industry to set annual targets for the uptake of electric vehicles and hybrid electric vehicles intheGovernmentvehiclefleet,aswellasmonitoringthelocalcontentofthemanufacturingofcarslocally,inlinewiththeIndustrialPolicyActionPlan(IPAP).
• introducetheconversionofoldtechnologyvehicleswithhigheremissionfactorstoberetrofittedwithEVtechnology.
• considerprovidingincentivesrelatedtothebeneficiationofusinglocalresourcesinthemanufacturingofkeymachineriesandorcomponents(e.g.fuelcell).
• assist in establishing and developing local EV OEMs.
In addition, according to research conducted by SANEDI (2014), despite the higher up-front cost of an EV, the lifetime cost of the EV is below that of a conventional car as a result of the inexpensive electrical (solar) refueling. Secondly, with increased demand and production, and the advancement in battery technology, the high up-front costs are expected to decline.
8.9 Future Modes of Transport
Withrecenttransporttechnologiesevolvingatsucharapidpace,thefuturemodesoftransportcanbedefinedasthosetransportinventionsthatwillbedevelopedinthefutureorarecurrentlyunder development such as these found below:

40Department of Transport: Green Transport Strategy for South Africa (2018-2050)
These kinds of “newer” modes being introduced in the transport sector, will require operational regulations, as they will also need to be mandated to use clean, green, and safe energy sources; as alternatives to nuclear power. Self-driving cars could represent the next development and could well be the most disruptive innovation the transport sector has ever seen. Radical changes to transport services such as mobile application services like Uber and Ride-Share, indicate that the future spectrum of the transport sector will be extremely different from what it is today. It is vital that transport regulations be revised to accommodate technological innovations.
The Department of Trade and Industry (DTI), together with the Department of Science and Technology, have embarked on project to establish the enabling environment for implementing hydrogen fuel cell driven public transport, with the aim of promoting South Africa’s OEM sector. The DTI has targeting South Africa’s metropolitan municipalities as possible users of fuel cell
technologyintheirbusfleets,whiletransportingthemillionsofcommuters.Thistrialisstillunderway.
Hydrogenmaybeproducedonalargescaleusingwatercoal,naturalgasorplantmatter.Thus,muchasthefinalproductinvolveslesserlevelsofpollution,thebenefitsarewatereddownifproduction uses fossil fuels.
Hydrogen fuel cell technology is advantageous in that it has a low carbon footprint - therefore contributing to cleaner air and better health for the South African citizenry. It also involves minimal noise when used in fuel cells. However, implementation from scratch, of production, distribution and retail outlets for hydrogen fuel cells is likely to be expensive. Each fuel cell vehicle would require $900 to $1000 to achieve the above listed chain of activities, according to 2013 International Energy Agency (IEA) estimations (Dti, 2017).
The Department of Science and Technology (DST) is facilitating the transition towards cleaner energy solutions and is supporting a number of research initiatives aimed at promoting the adoption of cleaner fuel cells for transport. The initiatives include the Biofuels research programme, Uyilo e-mobility Programme, energy storage focused on lithium ion batteries and the development of hydrogen and fuel cell technologies through the Hydrogen South Africa (HySA) Programme.
In the electric vehicle space, the Department is supporting research, development and innovation (RDI) initiatives focused on developing technologies that would enable the deployment of both hydrogen fuel cell and battery powered electric vehicles. Both battery electric vehicles (BEVs) and fuel cell electric vehicles (FCEVs) will use an electric drivetrain, with the lithium ion battery and hydrogen used as the fuel sources respectively.
8.9.1 Biofuels Research ProgrammeThe DST is supporting the development of cleaner fuels through its bio-fuels research programme, which has research chairs at the universities of Stellenbosch and North West. In addition, under thebio-fuelsprogrammeatNelsonMandelaUniversity,thedepartmentissupportingthedevelopmentofablendedbio-fuelsmixingcoalwaste/discardswithalgae.
8.9.2 Uyilo e-mobility ProgrammeThe DST in partnership with the Technology Innovation Agency (TIA) is supporting the development of electric vehicle components (motors, battery management systems) and research on the use as well as localisation of renewable energy based charging points. In addition, a battery testing facility has been established at Nelson Mandela University that will test and validate batteries for safety and compliance in collaboration with other institutions through the Energy Storage Programme.
8.9.3 Energy Storage Research ProgrammeAs part of a broader Energy Storage research, development and Innovation (RDI) Programme, the department is supporting the development of the high energy density nickel manganese cobalt (NMC) precursor material for lithium ion batteries (LIBs) targeted at the electric vehicle market. The local development of precursors and value added components will support the deployment of electric vehicles in South Africa. LIBs, whose cathode materials use NMC precursors, appear to be the dominant battery technology for the electric vehicle market. Figure 8 gives an indication of the increase in revenue (starting from the manganese ore) that could accrue from the local production and export of precursor material. Development of precursor material for LIBs is being conducted at a pilot facility in Nelspruit while partnerships (both local and international) are being sought in order to take the technology to market. In addition, through the participating universities and science councils, other components of the LIBs such as electrolytes, cells and battery management systems are being developed. In this regard, a facility located at the University of the Western Cape (UWC) has demonstrated the production of lithium-ion battery cells at pilot scale.
Maritime Policy Statement Summary

41 Department of Transport: South Africa Department of Transport: Green Transport Strategy for South Africa (2018-2050)
8.9.4 Hydrogen South Africa (HySA) ProgrammeThrough the Cabinet approved Hydrogen South Africa (HySA) Programme, the DST is supporting renewable hydrogen production, storage and distribution in support of fuel cell powered transport. ThethreeHySACentresofCompetencehavemadesignificantprogressinthedevelopmentoffuelcelltechnologythatisalreadyunderdemonstrationinmaterialhandlingequipment,golfcartsand electric scooters. Further development work is targeted at components for fuel cell powered passenger vehicles including buses. The HySA Programme is therefore enabling the development ofvalueaddedcomponents(Figure9)basedonplatinumgroupmetals(PGM)beneficiation.
8.9.5 Technology DemonstrationsSouth Africa has embarked on a number of demonstration projects as part of implementing the various RDI initiatives, in order to show case how the technologies can make an impact in a number of sectors.
8.9.5.1 Fuel cell buses
TheDSThasearmarkedfundingforthefirstfuelcellbusdemonstrationprojectthroughacollaborationbetweenHySAandBusmark(alocalbuscompanybasedinGauteng).TheDepartmentof Trade and Industry (the dti) has conducted a study on the viability of hydrogen fuel cell powered buses (fuel cell buses) in South Africa. The study indicates that there is potential for fuel cell bus adoption by the metros, given the predictability of the routes and the desire to go green. However, prior to the deployment of such buses, the technology must be proven under South African conditions through a demonstration (bus pilot) project.
8.9.5.2 Fuel cell Forklifts
Material handling vehicles offer another potential opportunity for the deployment of hydrogen fuel cells in on site transport. Fuel cell powered forklifts have the highest number of deployments globally, with the USA as the leading country. Studies conducted show that there is a good business case for fuel cell powered forklifts particularly in warehouses that operate for 24 hours. In this regard, the shorter refuelling times (5 -15 mins) make the fuel cell powered forklifts more attractive than the battery powered forklifts.
Figure 8: Value proposition for the development of manganese precursor materials Figure 9: HySA value proposition (Note: Numbers given were calculated based on prevailing commodity prices at the time)

42Department of Transport: Green Transport Strategy for South Africa (2018-2050)
AfuelcellpoweredforklifthasbeeninoperationatImpalaPlatinumRefineriesinSpringssinceOctober2015.TheprojectwasacollaborationbetweenImpalaPlatinumandHySASystemshostedatUniversityoftheWesternCape(UWC).TheImpalaPlatinumRefineriessitehasadirectpipelineofhydrogen,whichmakesiteasiertorefuelthefuelcellforkliftusingrefuellinginfrastructuredevelopedandinstalledonsitebytheHySAteamatUWC.Todate,thedemonstrationhasbeenabletoshowthatthereareindeedbenefitssuchasanincreaseinproductivityaswellasacleanerworking environment due to reduced emissions through the use of the fuel cell powered forklift. As a result, further demonstration projects are being planned through collaboration involving the industrial development corporation (IDC), HySA and mining companies.
8.9.5.3 Electric scooters
Battery electric scooters tend to encounter challenges associated with range limitations, particularly in areas where the terrain is bad. In such instances, hydrogen fuel cells could be used to extend therangeofthesescootersandincreaseproductivity.AprojectofthisnatureiscurrentlyunderwaythroughacollaborationbetweenHySAandtheSouthAfricanPostOffice(SAPO),withfundingfrom the DST. At least three battery electric scooters will have their range extended using hydrogen fuel cells with the on-board hydrogen stored in containers using metal hydride hydrogen storage materialdevelopedthroughtheHySAProgramme.Thefirstsuchscooterhasbeencompletedandiscurrentlyundergoingperformancetestingandvalidation.
8.9.6 Hydrogen production, storage and distributionHydrogen, usually in gaseous form, is the main fuel required for fuel cell operation. Hydrogen may be produced on a large scale using water electrolysis, coal, natural gas or plant matter. Thus, muchasthefinalproductinvolveslesserlevelsofpollution,thebenefitsarewatereddownifproductionusesfossilfuels.Theproductionofhydrogenusingrenewableenergysourceslikesolarphotovoltaic (Solar PV) and wind powering electrolysers that break down water into hydrogen and oxygen has been demonstrated globally even at megawatt scale. HySA Infrastructure at North West University in Potchefstroom has a pilot facility producing renewable hydrogen from solar PV at 2.5kg per day.
Themainchallengewithhydrogenisitsstorageanddistribution,giventhesizeofitsmolecule.Significantquantitiesofhydrogenaretransportedonlyintheformofliquidhydrogen(atcryogenictemperatures) or using high pressure (350 -700 bar) cylinders as is the case in mobile applications. However, technologies such as metal hydride (solid state) hydrogen storage and liquid organic hydrogen carriers (LOHC) offer promise for on-site transport and underground mining equipment respectively.
Hydrogen fuel cell technology is advantageous in that it has a low carbon footprint - therefore contributing to cleaner air and better health for the South African citizenry. It also involves minimal noise when used in fuel cells. As an emerging technology, fuel cell technology, together with the associated production, distribution, storage and dispensing of hydrogen at retail outlets still comes at a high cost. Each fuel cell vehicle would require $900 to $1000 to achieve the above listed chain of activities, according to 2013 International Energy Agency (IEA) estimations (the dti, 2017).
8.9.7 BEVs versus FCEVsArguments have been put forward to present BEVs and FCEVs as competing technologies, yet they are actually complementary. According to a recent study by the Hydrogen Council , BEVs have ahighwell-to-wheelenergyefficiency(60%)whenpoweredbyelectricityfromrenewables,whilebatterieshavealowenergydensityperweight(0.6MJperkg),whichmakesthemsuitableforlighter vehicles and shorter ranges. When stored aboard a vehicle, hydrogen has a much higher energy density per weight (2.3 MJ per kg) than batteries, which enables FCEVs to travel longer distancesandperformerbetterforheavyvehicleswherebatteriesbecomeimpracticalandinefficient(Figure10).Asthecapacityincreases,FCEVswillbecomecheaper,becauseaddinghydrogenstorage will be more cost effective than adding batteries in order to achieve the same performance.

43 Department of Transport: South Africa Department of Transport: Green Transport Strategy for South Africa (2018-2050)
TheadoptionofbothBEVsandFCEVshasenormousbenefitsforSouthAfricaandcouldlaunchthecountry on a route to energy independence, free from the unpredictable oil prices. The development ofalocallithiumionbatteryindustrywillbeneficiatethemanganeseresourcesthatSouthAfricahasas well as other minerals such as nickel, cobalt and lithium that are available in the Southern African Development Community (SADC) region. In addition, the carbon footprint of BEVs can be lowered further by using charging stations that are powered by Solar PV incorporating battery storage. FCEVs could use hydrogen generated from renewable energy resources such as solar PV and wind through water electrolysis. Large-scale generation of hydrogen from the solar PV plants for use as a transport fuel, storage for excess renewable energy and chemical commodity for other industrial sectors has the potential to put South Africa on a growth trajectory that is free from fossil fuels.
The Department of Trade and Industry (the dti), together with the DST, have embarked on a project to establish an enabling environment for implementing hydrogen fuel cell powered public transport, with theaimofpromoting technologiesdevelopedthroughbeneficiationofSouthAfrica’smineralresources. The dti is targeting South Africa’s metropolitan municipalities as possible users of fuel cell technologyintheirbusfleets,whiletransportingthemillionsofcommuters.Itisessentialthatbothpublic and private sector partners come together to provide the necessary infrastructure required to scale up demonstration projects that will facilitate greater adoption of BEVs and FCEVs in South Africa. FCEVs in particular, have the potential to mitigate the potential decline in PGM demand used in internal combustion engines (ICEs) that is likely to result from the reduced use of ICEs due to emissions restrictions.
9. TRANSPORT ADAPTATION AND MITIGATION
The magnitude and rate of climate change depends partly on future global GHG emissions. Consequently, global mitigation action to reduce GHG emissions has been and continues to be a paramount strategy addressed through the United Nations Framework Convention on Climate Change (UNFCCC) and a range of related GHG mitigation policies. As transport is one of the main contributors to GHG emissions, mitigation actions have mainly been the focus of the sector in dealing with climate change. The overall strategic approach for the RSA’s climate change response isguidedbytheNationalDevelopmentPlan(NDP)(Vision2030).TheNDPproposesmovingtowardsalowcarboneconomy.DifferentsectorsofsocietyhaverolestoplayinfulfillingVision2030.The DoT’s objective in supporting the transition to a low carbon economy is to ‘increase the contribution of transport to environmental protection’ (State Action Plan, DoT: 2016).
Although usually seen as different strategies — mitigation dealing with the source of the problem and adaptation with unavoidable impacts — mitigation and adaptation are complementary actions.
The GTS addresses both mitigation and adaptation, and there should be an emphasis for future initiatives to be on climate-related projects and policies, including both mitigation and adaptation.
9.1 Transport Adaptation
It should be considered that even if global GHG emissions were to stop today, climate change would continue for many decades as a result of past emissions and the inertia of the climate system. Adaptation to already experienced changes in climate as well as to plausible future climate scenarios is therefore a necessity. For the GTS, ‘adaptation’ refers to actions responding to current and future climate change impacts and vulnerabilities (as well as to the climate variability that occurs in the absence of climate change) within ongoing and expected societal change. It means protecting againstthenegativeimpactsofclimatechange,butalsobuildingresilienceandtakingadvantageofanybenefitsitmaybring(EEA,2014b).
Inthecontextoftheflagshipinitiativeonaresource-efficientprogramme,inthetransportsector,ashifttowardsacompetitiveandresourceefficienttransportsystemsetsouthowthetransportsector can contribute by reducing its carbon emissions by 50% (EC, 2011b) from 1990 levels. Complementary to policies aimed at reducing GHG emissions, the adaptation to climate change (EC, 2013d) aims to
Figure 10: Comparison of BEVs and FCEVs.

44Department of Transport: Green Transport Strategy for South Africa (2018-2050)
contribute to a more climate-resilient transport industry, by enhancing the preparedness and capacity to respond to the impacts of climate change at local, regional and national levels. It also refers explicitly to transport as a sector that needs to adapt. Furthermore, the transport sector supports moving to a competitive low carbon economy in 2050 that foresees a reduction of at least 80% of GHGs by 2050 compared to 1990.
Theenvisagedlong-termGHGreductionsintheroadmapstowardsacompetitivelowcarboneconomyandresource-efficienttransportrequirenotonlygradualimprovementsofcurrentstrategiesbut structural changes leading to a transition of society and as such of the transport sector. These structural long-term changes in the organisation of transport and mobility might also offer thepotential toreducevulnerabilities toclimatechange.Conversely, themagnitudeofclimatechangemightrequiremajorstructuralmodificationstoadaptandtheseeffortscansupport thetransition towards a competitive low carbon economy too. For example, transforming transport behaviour and transport demand could achieve not only lower emissions but, at the same time, offeropportunitieseithertobuildamoreresilienttransportsystemandservicesunderclimatechange,ortodevelopmoreflexiblesocialandeconomicpracticesthatcouldbetteraccommodateeventual disruptions in the transport system.
Its objective is to contribute to a more resilient sector at national, regional and local levels, thereby focusing on enabling Member States and local governments to take action and to mainstream adaptationintodifferentpolicyareas.Thestrategyconsidersthat‘byprioritisingcoherent,flexibleandparticipatoryapproaches,itismoreaffordabletotakeearly,plannedadaptationactionthanto pay the price of not adapting’.
Climatechangeadaptationisnotyetbroadlymainstreamedwithintransportplanninganddecision-makingpracticesincludespecificmandatesforthetransportsector,suchastherevisionoftechnicalstandardsintherailsector,networkvulnerabilitystudies,therevisionofguidelinesonthehazardsofforestfiresoninfrastructure,orthedevelopmentofscenariosinordertoconsideradaptation within the Environmental Impact Assessment process.
9.2 Barriers to Adaptation in the Transport Sector
Adaptationinthetransportsectorstillfacessignificantbarriersbothatpoliticalandtechnicallevels.Theadaptationoftransportsystemstoclimatechangeisgenerallyassociatedwithaneedforadditionalresources,andparticularlyoffinancialones;actualaccesstothesefinancialresourceswasratedasverysignificantbarrier.Lackofawareness,trainingandcapacitiesareperceivedasbarriers with slightly lower importance and less consensus across the different spheres of government.
Barriers, such as uncertainty and the lack of political action also need to be addressed. This lack of action can be due to the fact that adaptation is seen as a long term issue. It does, not encourage urgent short-term action, because there is no political priority or because adaptation is perceived as a longer-term activity.
The development of adaptation strategies typically follows a cycle, moving from initial awareness raising among stakeholders and decision-makers to exploration of risks and vulnerability, identificationofadaptationoptions,developmentofadaptationstrategiesoractionplans,andmonitoringofimplementationandresults.Informationcollectedonpastweathereventsandtheirimpactscanbeavaluablestartingpointforassessingvulnerabilitiesanddevelopingstrategiestoadapttoclimatechange.However,obtainingdataimpacts,specificallyontransport,availableintheformatsrequiredtocross-checkwithweatherinformationandwithdatafromotherstakeholdersisdifficult.Better,up-to-datetoolsformanagingweatheronanoperationallevelservetoimprove resilience on a day-to-day basis and provide practitioners with a better understanding of their baseline vulnerability. They can then extend this to consider the climate change timescale.

45 Department of Transport: South Africa Department of Transport: Green Transport Strategy for South Africa (2018-2050)
Transport Adaptation
• Transport systems are complex. They play a fundamental role in the economy and society, and are characterised by the long lifespan and high costs of their infrastructure. These characteristics all suggest the need for an adaptation approach with a long-term and systemic perspective, thus also preventing possible lock-ins into unsustainable development paths.
• Up until now, the dominant approach for reducing the vulnerability of transport systems has been to make incremental changes. While this approach works well for many cases, it can be insufficienttodealwithdisruptiveorfundamentalchangesinclimate,thesocietyortheeconomy.Whenchangesofthissorthappen,transportsystemswillneedtoadoptamorefundamentaland comprehensive change, involving both the use of new technology and the implementation of alternative approaches for managing transport demand and supply.
• Aflexibletransportstructure-theabilitytoeasilyfindanothertransportoptionintheeventthatoneoptionbecomesunusable-playsanimportantroleincreatingaresilienttransportsystem.Anapproach,whereincrementalandfundamentalchangesarecompatibledependingonthespecificsituationtosolve,willresultinamoreresilienttransportsystem.Indecidingwhentoact,it is better to anticipate this need for change and to act early rather than wait for events to force change. Forward-thinking will require a shift away from piecemeal action to more planned and integrated approaches, including early action whenever possible.
• Good adaptation requires information and knowledge. This information can be made available by a centrally managed database. Innovation and fundamental change often need research, often including a variety of measures to promote the implementation of adaptation measures in the transport sector. These measures include funding support, the provision of information, capacity building,andreviewoftechnicalstandards.Theengagementofallthemainstakeholdersinthetransportsectorisofkeyimportancefromtheperspectiveofbothequityandefficiency,andpolicymakers and researchers should make an extra effort to engage stakeholders in their research and information-dissemination activities.
• Currently, greater attention is given to adapting transport infrastructure (rail tracks, ports, roads, etc.) than to adapting transport services (operation of infrastructure and equipment, use of staff, timetables and routing, contingency plans, communication of service options, etc.). More use could be made of this underused potential of transport service operators.
Itisimportantthatadaptationmeasurestakeninthetransportsectoraremonitoredandanalysed,asthiswillenablestakeholderstoimprovetheeffectivenessandefficiencyoffuturepolicy.Itwillalso help to stimulate a transparent public debate on what additional actions are needed. The next generation of transport policy will need to mainstream these transitional approaches to climate change adaptation and mitigation as two complementary strategies to cope with climate change, thereby facilitating the emergence of a resilient transport system.
9.3 Mitigation: The Sustainable Transport Programme
TheresponsetoGovernment’sapproachtomitigatingclimatechangeisreflectedintheNationalClimateChangeResponseWhitePaper2011,whichstipulatesthateconomicsectorssuchastransport need to develop “Mitigation Plans” in an effort to reduce emissions from different sectors.
The Sustainable Transport Programme (STP) will be the implementing vehicle for the GTS. The programme envisions promoting the implementation of STP measures (Avoid – Shift – Improve) atlocallevelthatalignwithnationalgoals(e.g.NationalClimateChangeResponseWhitePaper).TheSTPprogrammeand/officewillbridgethegapbetweenthepolicy-makingatnationalleveland the implementation at local level.
The implementation of the GTS is intended to be in a two-phase cycle:
- Thefirstphaseistoestablishanationalprogramme(imbeddedwithinthecoreelementsoftheGTS)and
- The second phase will then focus on the implementation of direct mitigation measures on the local level.
During Phase 1 the following outputs are foreseen. These activities can be summarised as supportive measures to enable the implementation of mitigation actions in urban areas in South Africa.
1. Establishing an independent Technical Support Unit (TSU) for STP;

46Department of Transport: Green Transport Strategy for South Africa (2018-2050)
2. Organising a knowledge-sharing platform among all spheres of the Government on STP & public;
3. Improving the capacity of MRV, aiming for a national harmonised approach;
4. Supporting municipalities during the design and implementation of sustainable mobility measures;
5. Promoting the improvement of the legal framework in the context of STP; and
6.Creatingandcoordinatingaccesstofinancialresourcestosupporttheimplementationofsustainablemobilitymeasures.
The national programme will support local governments in their actions towards an environmentally-friendly transport system. An independent and comprehensive mechanism therefore needs to be established to ensure successful implementation of the measures and co-ordination of stakeholders. One key intervention of the Sustainable Transport Programme of the DoT will be the coordination and distribution of lessons learnt and best practices amongst municipalities.
9.4 Transport Flagships and Nationally Appropriate Mitigation Actions (NAMAs)
TheGTSwillalsobeusedasamechanismtoimplementtheTransportFlagshipsasidentifiedintheWhitePaperonNationalClimateChangeResponse2011.Aspartofmitigationeffortsforthereduction of emissions, the concept of Nationally Appropriate Mitigation Actions (NAMAs) was introduced under the UNFCCC and is seen as a useful instrument for mitigation action in developing countries (GIZ, 2014). NAMAs are voluntary measures taken by developing countries and reported by national governments to the UNFCCC.
ANAMAisdefinedas“anyactionthatreducesemissionsindevelopingcountriesandispreparedundertheumbrellaofanationalgovernmentalinitiativewiththeaimofachievingareductioninemissions relative to ‘business as usual’ emissions by 2020 (GIZ, 2014).
Table 9: Proposed NAMAs List for Transport (Source: DoT) The Department of Transport has also committed to a NAMA programme. The NAMA in theTableabovearearepresentationofthe‘scopeofwork’thathasbeenidentifiedandwillbefurtherelaboratedonandfinalisedasaresultoffurtherworkdonebytheDoT,GIZ project, CSP 3, and stakeholder engagement.
10. ENABLERS AND BARRIERS FOR SUSTAINABLE MOBILITY
On high-level, green transport enablers, barriers and drivers are often placed in the context of their social, economic and environmental impact. In terms of social impact, one needs to take note especially of the need to increase mobility and counter the spatial disconnect from markets and jobs for less privileged groups created during apartheid. When it comes to the environment, reducing air pollution, especially in an urban context, is a direct short-term need. Contributing to the fight against climatechange in the longer run is also important.
Introducingchangeisoftendifficult,especiallywhenitconcernsinnovativesectorswherelonger-terminvestmentsaremade.Forthisreason,itisimportanttoidentifythefactors that play a central role in facilitating or triggering change and those that can hinder successful implementation. While Government can set appropriate policies, it is ultimately up to the private and public sector to guarantee the large-scale uptake of green transport. Hence it is important to identify enablers, barriers and drivers as they are perceived by the market and society. Public policy can then be designed in such a way as to remove barriers and strengthen enablers and drivers.

47 Department of Transport: South Africa Department of Transport: Green Transport Strategy for South Africa (2018-2050)
10.1 Enablers and Barriers for Green Transport
Within an enabling environment a set of interrelated conditions such as the appropriate funding, and enabling regulatory environment are in place, which impact positively on the capacity of development actors. On the other hand, barriers might at the same time exit that negatively impact on this capacity. They hamper the development of the sector in an unnecessary or uncalled for manner. Enablers or barriers may exist in relation to the current policy framework that is in place, as mapped above, or they may exist in their own capacity.
WhenlookingatthecurrentenablingenvironmentoftheSouthAfricangreentransportsector,onlyalimitednumberofenablingconditionscanbeidentified.Forexample:
• From an economic perspective, the recent discovery of shale gas in the Karoo has improved the capacity for actors to develop mid- and down-stream CNG infrastructure in that the initial supply side risk of CNG over the long terms has been reduced;
• From a social perspective, a number of industry associations covering several aspects of the green transport value chain with the aim to, among other things, increase the level of organisation within the sector and subsectors.
• A good example of this is the establishment of the National Biogas Platform during the 2013 National Biogas Conference. There is collaboration between the public and private sectors supported by the German government, in this regard. Also, with the support of entities such as the IDC, a number of CNG re-fuelling stations have been established. Although still at a pilot stage, some of these stations are equipped with training and information centres, providing valuable information to the different private actors within the value chain and the public at large.
• From an environmental perspective, the South African automotive industry in conjunction with the Department of Minerals and Energy is introducing a standardised fuel economy and CO2 emissiontestingandlabellingsystemforapplicationtonewpassengercardsatdealerships.Previousexperiencesshowthatthisshouldsignificantlyimprovethedecisionspeoplemakeintermsof environmental impact and consciousness. Continuous digital data collection is required.
As with the enabling environment, several barriers impact on the capacity of development actors. For example:
• From an economic perspective, the private sector is currently held back in its long-term investment in CNG and CBG supply infrastructure due to regulatory uncertainty surrounding the continuance ofrelativetaxbenefitofthesefuels,whichareVAT-ed,andconventionalfuels,whicharesubjecttofuelstaxes.AsimilarproblemcanbefoundwiththeBiofuelsRegulatoryFramework.Aslongas the Government does not set the operation date of the legislation, producers will not invest in the necessary projects to manufacture biofuels, as they are not guaranteed of adequate returns tomakeaviablefinancialproposition.Highupfrontinvestmentcostsforgreentechnologiesalsoprovideanobstacle,asprivate-sectorfinanceisdifficulttoobtaininpractice;
• From a social perspective, the limited range of current EV technologies and long charging times create “range anxiety” for many people and present a barrier for people to use electric vehicles.
• Generally,vehicleownerstravelrelativelylongdistancesinSouthAfrica.Assuch,stakeholderconsultationsindicatethatthelackofpubliccharginginfrastructurepresentsasignificanthindranceto thesector’sdevelopment.Forgas-poweredvehicles, thesameargumentapplies in that too fewfillingstationsare inoperation.Also, several stakeholdershave indicated thatgeneralknowledgeaboutCNGfortransportislacking,i.e.peoplearenotawareofthepossibilitiesforuseintransport.Manypeoplewhoareaware,perceivegasassomethingflammableanddangerous,not suited for transport;
• From an environmental perspective, policy documents aimed at promoting green transport stand alone, hampering the overall effort of improving environmental outcomes in terms of (urban) air quality and mitigating climate change. There is no high-level, integrated plan that aligns policies and regulations. This may hinder the development of the green transport sector. There is also very limited data gathering on the topic to conduct research and inform policy.

48Department of Transport: Green Transport Strategy for South Africa (2018-2050)
In summary, one can conclude that there are a number of conditions that in combination provide an enabling environment for the Green transport sector. However, it is important to note that most of the enabling conditions are still under development. It is also interesting to see that compared to the green transport sector, the enabling environment of the traditional petrol and diesel sector is much larger and more developed. Moreover, several barriers exist as perceived by the market and society. These should be addressed in the future to facilitate the uptake of green transport technologies.
11. OPPORTUNITIES / CO-BENEFITS FOR GREEN TRANSPORT
Onahigher,moreabstractlevel,theopportunities/co-benefitsrelatetotheenhancedaccesstoemploymentopportunitiesforpoorcommunitiesduetoanimprovementsinpublictransportandpublichealthbenefitsassociatedwithimprovedairqualityknowledge,andconditionsthatinitiateandsupportactivitiesaimedatdevelopinggreentransporttechnologiesandtendtolinkquitedirectto economic, social and environmental considerations.
11.1 Economic
The context of a developing economy - even more importantly, the economic proposition of green sustainable transport - is a central factor in making green options commercially attractive in the future. The need to increase sustainable mobility and counter the spatial disconnect from market and jobs for less privileged groups is however especially urgent, but both businesses and consumers(endusers)aregenerallyhesitanttopaytheinvestmentpremiumforagreeneroptionwhilebeinguncertainaboutthetechnicalandfinancialbenefits.Ifthegreeneroption,however,ischeaper over its overall lifetime of use, this can be an important driver for uptake. The latter tends to be the case for green alternatives, where a higher investment cost is more than compensated for by a lower cost of use. This is the case when investing in a taxi conversion to biogas and subsequently reaping the rewards of a lower fuel price. A prerequisite however, is that users need to be well-informed about the green alternative.
Treasurycanalsobenefitbyusingbiogasorelectricityastransportfuels,asthesearelocallyproduced,asopposedtopetrol/diesel,whichareimportedatthemarginallevel(oraremadefromimportedcrudeoil,whichrepresentsabout90%oftheirmanufacturedvalue).Inotherwords,thiswouldrepresentasignificantincreaseinlocaleconomicactivity,withassociatedforex(balanceofpayment) savings and the generation of more local taxes. A typical car uses about 2 to 3 times more fuel than the cost of the vehicle (DTI, 2016), and for higher mileage vehicles, such as minibus taxis, the fuel (imported) cost can be more than 10 times the vehicle cost.
Furthermore, thecreationofasubstantialdemandthroughgreenpublicprocurementandthedecisionoffleetowners toswitchtogreenalternativeswillencouragebetterchoices.Howeversuppliers might be reluctant to invest in, for example, biogas production, while users are reluctant to switch their vehicles to biogas doubting fuel availability and nervous to take a risk.
11.2 Social
Greentransporttechnologiesdonotpersecontributetotheeconomicandsocialmobilityofpeopleasconventionaltransporttechnologiescan,inprinciple,fulfilthesamepurpose.Nevertheless,job creation can be a driver for the introduction of green transport alternatives. Green transport also involves lesser negative externalities being borne by society. This is particularly the case with biofuels, as they require relatively labour-intensive fuel production. This requires the conversion of specially grown crops to a biodegradable waste and energy for fuel. In principle, however, all alternative green transport technologies have the potential to create jobs, as new infrastructure has to be developed. The downside however is that green technologies could result in job losses which could be countered with the job creation that the industry will create.
11.3 Environmental
When it comes to the environment, reducing air pollution, particularly in an urban context, is a direct short-term need, in addition to combating climate change in the long run. Although on its own, environmentalbenefitsdogenerallynotconstituteadecisivedriverforbusinessestoact, itcanif itcomestogetherwithenvisagedfutureregulation,makingthecontinuationofconventionaltransportmoredifficultand/orcostly.AnexampleisthecityofPariswhichdoesnotallowcarsregisteredbefore1January1997inthecitycentrestreetsfromMondaytoFriday,from8amto8pm.Business stakeholders have indicated that from a strategic standpoint, long- term protection of the ‘licence to operate’ is a driver behind the greening of transport, particularly for urban transport and taxis.
Global practice shows that only a small percentage of consumers will opt for the green choice on the merits of the contribution to improve the environment. (DTI, 2015)
49 Department of Transport: South Africa Department of Transport: Green Transport Strategy for South Africa (2018-2050)
12 COST OF GTS AND FINANCING OPTIONS
12.1 Options for Financing Green Transport and Economic Incentives
Tosupportgreentransport,thereisincreasedrecognitionoftheneedforreformstocurrentfinancingpatternsandtoconsiderfinancialoptionsthathelptobridgethefinancinggapbetweenconventionalandlow,carbongreentransporttechnologies.Itisvitallyimportantthattransportinvestmentsareappropriatelyscreenedaccordingtospecificsustainabilitycriteriatoensurethatsufficientresourcesarechanneledtowardslowcarbon,greentransport.
Access to funding is crucial to the successful implementation of the GTS. This document outlines a number of regulatory actions that will draw in funds. However, the quantum of funding required particularly for expansion and upgrading of public transport and the rail network will require both international and private funding.
This would ensure that:
• adequate funding is made available for green transport technologies, capacity building, operations and infrastructure to ensure that the additional costs of these investments can be recovered.
• resourcesareshiftedfromsupportingunsustainableformsoftransporttowardsgreentransport,andthatadditionalfinancialresourcesaremobilisedandscaledup.
• publicfundingatall levelsincludinginternational,nationalandlocalfundsaremobilisedtosupportgreentransport.Decision-makingtoolssuchasprojectappraisalsandcost-benefitanalysisshouldbereformedtoensureconsistencywithsupportinggreentransportbyeffortstomonetisethenon-marketenvironmentalcostsandbenefitsofspecificprojects.
• privatefinanceisleveragedthroughappropriatedesignofmarketsandthecreationofconsistent,long-termincentivestoinvestingreentransportandtheapplicationofpublic-privatesectormodels to directly invest in and operate green transport systems (such as the bus rapid transit systems).
• financingflowsfromvarioussourcesaredesignedtocomplementeachother,ratherthanworktopursuedifferentgoals.
TheDepartmentofTransportinconsultationwithNationalTreasury,theDepartmentofEnergy,andtheDepartmentofEnvironmentalAffairswillconsiderandselectthefinancingoptionsthatwillhaveinincreasedbenefitstotheenvironment.
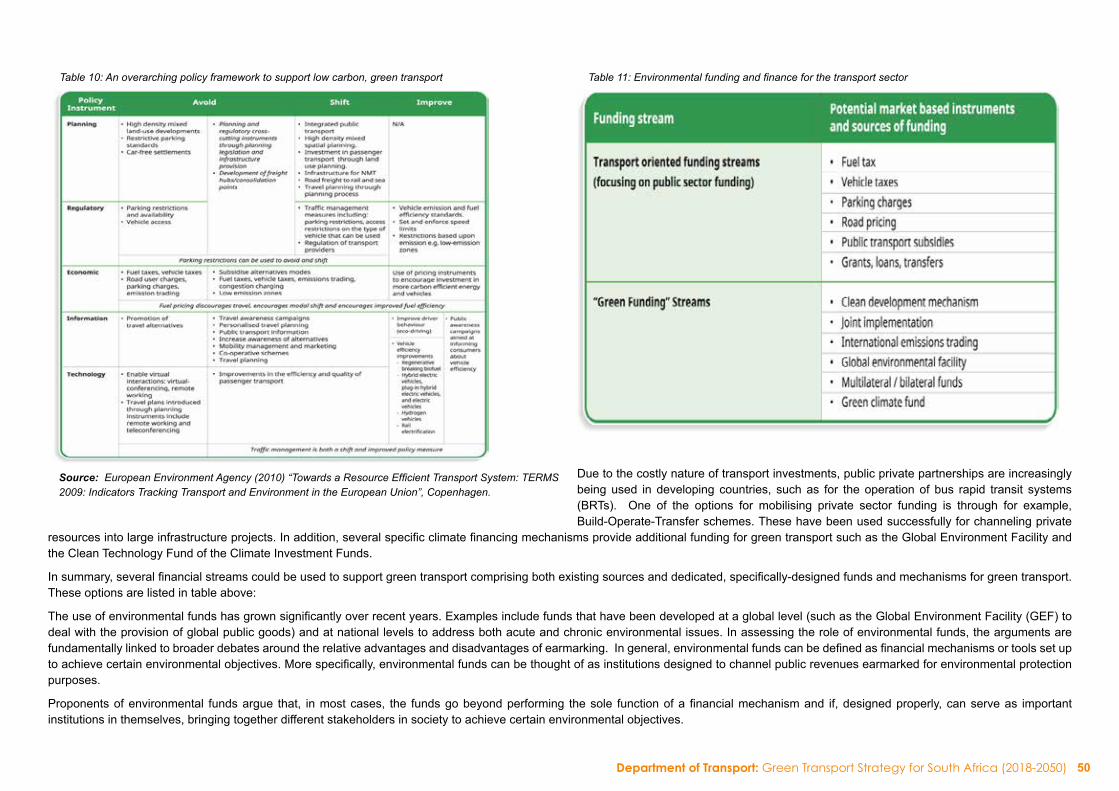
50Department of Transport: Green Transport Strategy for South Africa (2018-2050)
Table 10: An overarching policy framework to support low carbon, green transport Table 11: Environmental funding and finance for the transport sector
Source: European Environment Agency (2010) “Towards a Resource Efficient Transport System: TERMS 2009: Indicators Tracking Transport and Environment in the European Union”, Copenhagen.
Due to the costly nature of transport investments, public private partnerships are increasingly being used in developing countries, such as for the operation of bus rapid transit systems (BRTs). One of the options for mobilising private sector funding is through for example, Build-Operate-Transfer schemes. These have been used successfully for channeling private
resourcesintolargeinfrastructureprojects.Inaddition,severalspecificclimatefinancingmechanismsprovideadditionalfundingforgreentransportsuchastheGlobalEnvironmentFacilityandthe Clean Technology Fund of the Climate Investment Funds.
Insummary,severalfinancialstreamscouldbeusedtosupportgreentransportcomprisingbothexistingsourcesanddedicated,specifically-designedfundsandmechanismsforgreentransport.These options are listed in table above:
Theuseofenvironmentalfundshasgrownsignificantlyoverrecentyears.Examplesincludefundsthathavebeendevelopedatagloballevel(suchastheGlobalEnvironmentFacility(GEF)todeal with the provision of global public goods) and at national levels to address both acute and chronic environmental issues. In assessing the role of environmental funds, the arguments are fundamentallylinkedtobroaderdebatesaroundtherelativeadvantagesanddisadvantagesofearmarking.Ingeneral,environmentalfundscanbedefinedasfinancialmechanismsortoolssetuptoachievecertainenvironmentalobjectives.Morespecifically,environmentalfundscanbethoughtofasinstitutionsdesignedtochannelpublicrevenuesearmarkedforenvironmentalprotectionpurposes.
Proponentsofenvironmental fundsargue that, inmostcases, the fundsgobeyondperforming thesole functionofafinancialmechanismand if,designedproperly,canserveas importantinstitutions in themselves, bringing together different stakeholders in society to achieve certain environmental objectives.
51 Department of Transport: South Africa Department of Transport: Green Transport Strategy for South Africa (2018-2050)
13 IMPLEMENTATION, MONITORING AND EVALUATION
To ensure the successful implementation of the GTS, a comprehensive Monitoring and Evaluation system needs to be aligned with the strategy, to ensure that the deliverables of the project are achieved on time and a suitable system is instituted to ensure monitor progress.
The DoT will facilitate the following actions:
• Collaborate with DOT agencies (e.g. RTMC, ACSA, CAA, SANRAL, RAF, ATNS, RTIA, RSR, PRASA, PORTS REGULATOR, SAMSA and the C-BRTA.) and other SOEs such as SANEDI, to ensure that projects which lower GHG emissions are incorporated within their operations and Business Plans going forward. Transport entities will also need to report on their progress and implementation of environmental projects in their annual reports.
• Arrange“preferentialfunding”throughSouthAfrica’sdevelopmentfinanceinstitutionsforthelocalprivatesectortoparticipatein:
○ theconversionofminibustaxisintodual-fuelvehiclesandretrofitexistingfillingstationsornewbuildstoprovideCNG.
○ the building of high speed inter- and intra-city rail networks.
○ thesupportofEVlocaldevelopment(OEMs,Chargers,andEVinnovation),EVbusinessesincludingsuppliersfunding,andbanksbuy-inonEVsbystructuringvehiclefinanceforEVs.
• SouthAfrica’scommitmentintermsoftheNDCweremadeontheconditionthatSouthAfricareceivesglobalfinancialandtechnicalsupport.TheDoTwillthereforecompiledocumentationtosupportproject-specificfundingrequeststotheGreenClimateFund,theWorldBankandUNFCCC.
• DoT through consultation with National Treasury will develop an approach for engagement with other aid agencies, the IDC and South Africa’s commercial banks which will include guarantee and insurance products for green projects.
13.1 Implementation Plan
Thefollowingtableshowsthespecificactionsrequired,detailsthereof,thepersonresponsibleandthetimeline.
AllinterventionsormeasuresneedtobeSMART(Specific,Measurable,Achievable,Realistic,Timely).
The timeline referred to in the Implementation Plan follows the following outline:
• Short-Term: (5 - 7 years)
• Medium-Term: (8 - 10 years)
• Long-Term: (11 - 20 years)
The GTS will also implement an internal review period, every three (3) years to ensure that the strategic interventions within the strategy are being implemented judiciously.
13.2 Monitoring and Evaluation
The DoT will use NT’s project evaluation methodology in order to prioritise projects for funding and implementation.

52Department of Transport: Green Transport Strategy for South Africa (2018-2050)
Eachprojectandthedataproducedneedstobemeasured,reportedandverifiedinordertoprovidecriticalinformationforthefuturebuild-outandexpansionofprojects.
There is a need for advanced ICT development and implementation to analyse historical data vs. live data to decisively envision the future. Data requests and processing not take days, it should be instant - IoT. Once consolidated, the goal is to house a data centre for all needed parameters (congestion, GIS, GPS, buy in). Each project will require its own measuring, reporting andverification(MRV)frameworkwhichwillbedevelopedbythepersonandteamresponsibleforimplementingtheproject.
Activity Measures Lead Department Supporting Department/Institution
Time Frame
FUNDING
Preferential funding Arrangepreferentialfundingthroughdevelopmentfinanceinstitutions or private sector participation in dual fuel conversions, EV’s and high speed rail networks
All relevant stakeaholders SHORT,MEDIUM AND LONG TERM
Global Funding Compiledocumentationforprojectspecificfundingrequests to the Green Climate Fund, world Bank, UNFCCC, USAID, and other Developmental Credit Agencies
All relevant stakeholders National Treasury, EDD, DTI, DEA, DBSA, DST
SHORT,MEDIUM AND LONG TERM
RAIL
Passenger Rail Invest in improvement of rail services and infrastructure.
Initiate Marketing campaigns for rail to attract users.
PRASA, DoT DOT MEDIUM TERM
Expand branch network Restore rural branch network. Transnet, Gautrain, NT, DoT, DPE, DTI
LONG TERM
Establish Rail Economic Regulator
Rail Economic regulator will regulate rail prices (passenger and freight) and ensure competitiveness to road
DoT, NT, EDD MEDIUM TERM
Cleaner Technologies Encouragerailoperatorstoinvestintheuseefficientandlow carbon intensive technologies such as the use of fuel-cell or solar powered locomotives.
DoT, DPE PRASA, TRANSNET MEDIUM TERM
Rail Infrastructure Standards
Develop Green Standards and Guidelines for rail infrastructure and construction, maintenance, upgrades and materials.
DoT, PRASA, Transnet, Metrorail, Gautrain, NT, DPE,
SHORT TERM
MARITIME AND AVIATION
Biofuels as alternative Expand on existing pilots for the use of biofuels in aviation. Strengthen regulatory requirements for biofuels mix for aviation fuel.
DoT, DOE, DEA SAA, ACSA, DST SHORT TERM
MEDIUM TERM

53 Department of Transport: South Africa Department of Transport: Green Transport Strategy for South Africa (2018-2050)
Operations and Procedures (Energy
Efficiency)
Review and update existing operational procedures to ensureenergyefficiency
DoT DoT Agencies SHORT TERM
Infrastructure (Energy Efficiency and
Renewable Energy)
Implement rooftop PV and EEretrofitsofportsandairports
DoT ACSA SHORT-MEDIUM TERM
Carbon Offsets Invest in the development of carbon offset programmes for transport consumers (business and private), and continuous testing of emissions per plane with limits and penalties to those planes above limited
DOE, DoT CAA, IATA, ICAO MEDIUM TERM
CLEANER FUELS AND TECHNOLOGIES
Biogas transport fuel regulations
Develop regulations that compelgovernmentfleetwith access to biogas to use the biogas as an alternative fuel
DoT NT, DOE, SANEDI, Provincial Government MEDIUM TERM
Alternative fuels tax incentives
Focus of the private sector needs to be balanced with the
public sector.
Draft tax incentives for private sector use of alternative fuels, and penalties
NT DoT, DOE, MEDIUM TERM
Activity Measures Lead Department Supporting Department/Institution Time Frame
Dual-fuel regulations Draft regulations providing a conducive environment for public and quasi-public transportation to be converted to cleaner dual-fuel vehicles.
DoT IDC, DOE, DPE, Taxi Associations, SANEDI, CSIR LONG TERM
Fossil Fuels Draft regulations requiring refineriestomeetnewstandards and norms for cleaner fuels.
DOE DOT MEDIUM TERM
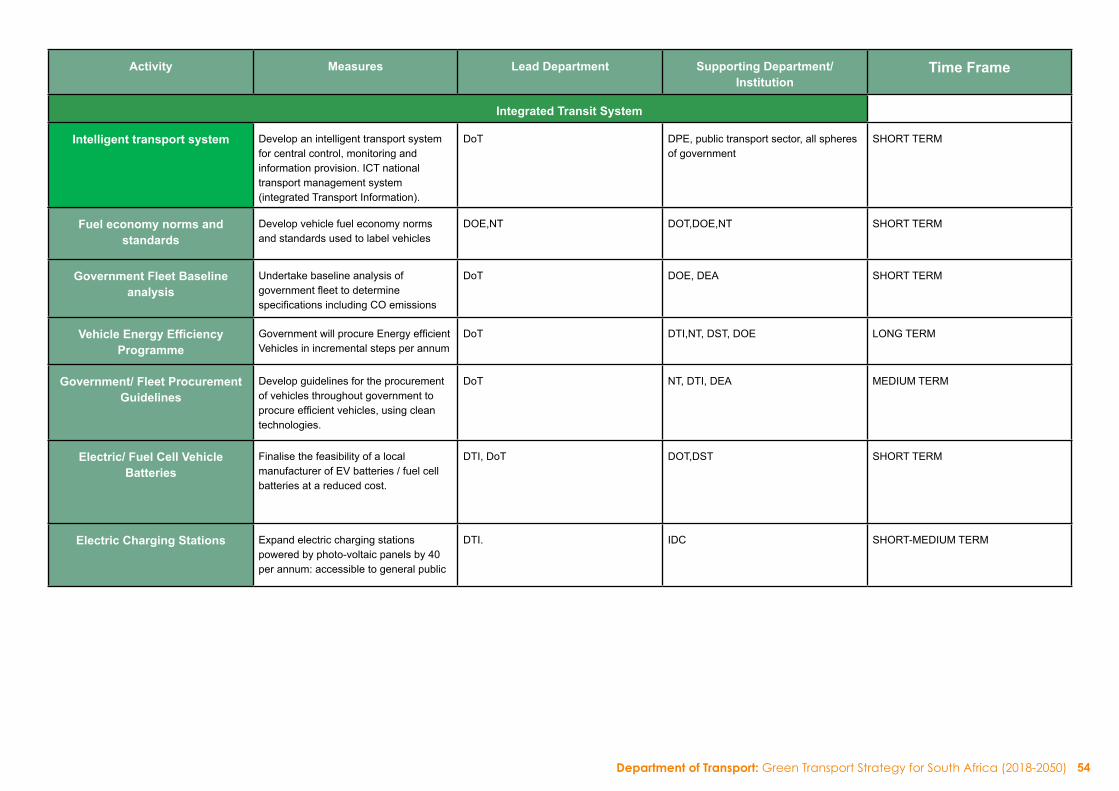
54Department of Transport: Green Transport Strategy for South Africa (2018-2050)
Fuel economy norms and standards
Develop vehicle fuel economy norms and standards used to label vehicles
DOE,NT DOT,DOE,NT SHORT TERM
Government Fleet Baseline analysis
Undertake baseline analysis of governmentfleettodeterminespecificationsincludingCOemissions
DoT DOE, DEA SHORT TERM
Vehicle Energy Efficiency Programme
GovernmentwillprocureEnergyefficientVehicles in incremental steps per annum
DoT DTI,NT, DST, DOE LONG TERM
Government/ Fleet Procurement Guidelines
Develop guidelines for the procurement of vehicles throughout government to procureefficientvehicles,usingcleantechnologies.
DoT NT, DTI, DEA MEDIUM TERM
Electric/ Fuel Cell Vehicle Batteries
Finalise the feasibility of a local manufacturerofEVbatteries/fuelcellbatteries at a reduced cost.
DTI, DoT DOT,DST SHORT TERM
Electric Charging Stations Expand electric charging stations powered by photo-voltaic panels by 40 per annum: accessible to general public
DTI. IDC SHORT-MEDIUM TERM
Activity Measures Lead Department Supporting Department/Institution
Time Frame
Integrated Transit System
Intelligent transport system Develop an intelligent transport system for central control, monitoring and information provision. ICT national transport management system (integrated Transport Information).
DoT DPE, public transport sector, all spheres of government
SHORT TERM

55 Department of Transport: South Africa Department of Transport: Green Transport Strategy for South Africa (2018-2050)
Activity Measures Lead Department Supporting Department/Institution
Time Frame
Single ticketing system Develop smart tag enabled single ticketing system for use in public transport and taxi industry.
DoT DTI, DPE, public sector, Government, PRASA, Transnet, Buses, Metrorail, Municipalities, all taxis (minibus and metered)
LONG TERM
Revise ITPs Revise minimum requirements in ITPs to facilitate integration between municipal transport systems, and also include sustainable transit plans for climate resilient cities.
Provincial (enforcement) and Municipal (implementation)
DoT SHORT TERM AND LONG TERM
Metro-bus fleets Draft regulations requiring 10% of Municipalbusfleetsconvertedtocleanertechnologies or cleaner fuel.
DoT Local Government LONG TERM
Emission standards Develop regulatory regime with NT and DEA for annual taxing of vehicles based on their emission standards through car licensing renewal system and new car sales.
DoT NT, DOE, private sector, Local Government, DEA
MEDIUM TERM
Non-motorisedTransport Infrastructure
Develop regulations, standards and best practice guidelines.
Develop and expand NMT Infrastructure.
DoT Local Government SHORT TERM
Travel Demand Management Develop a regulatory policy on congestion charges.
Local Government Local Government MEDIUM TERM
Road Freight Permits Re-introduce road freight permits reflectingloadcapacityoffreightvehicles.
DoT NT, private sector, SANRAL RTMC, CBRTA, RAF, RTIA, Provincial Government
SHORT TERM
Green Road Infrastructure Standards
Develop green standards and guidelines for construction of low-carbon climate resilient road infrastructure, including buslanes,EVchargerpoints,BioGas/NCG/LNGstations.
DoT SANRAL, Provincial Government SHORT TERM

56Department of Transport: Green Transport Strategy for South Africa (2018-2050)
14 COMMUNICATION STRATEGY
A feasible communication plan to support the GTS needs to be based on evidence about consumer decision-making in relation to modal shifts in transport, promoting the uptake of eco-mobility and NMT,andintroducingefficientvehicletechnologies.Forinstance,consumersaremorelikelytoinvestigatetransportoptionswhenplanningkeylifedecisionsaroundemployment,educationandmoving home. Behavioural change on the part of both consumers and service providers therefore has a critical role to play in reducing the environmental impact of transport.
A further illustration in which behaviour change is important to both public and public transport is in relation to driver training. Appropriate driving techniques and vehicle maintenance can result in reducedtransportemissions.Thesebenefitsneedtobecommunicatedtobothserviceprovidersandconsumers–forinstance,throughthesystemoflicensingpublicandprivatedrivers.
Atthesametime,consumersneedtobewell-informedabouttheimportanceoftransportinrelationtotheenvironmentandmadeawareofthebenefitsofpublictransport,particularlyaspublictransport infrastructure and services are improved and expanded. This needs to be introduced as part of the standard curriculum at all levels of the education system.
Robustpublicrelationscampaignswillneedtoberuninordertoencouragethemodalshiftdesired,especiallywhenpromotingpublictransportand/orfromICEtoEV.Eachregulatoryactionwillalso need to be fully communicated with stakeholders in order to drive buy-in and compliance. Banks are good drivers of campaigns as people spend time at banks and have more time to read in thisenvironment.TheirattentionislessavailableforbillboardsorTV/radio/internet.It’ssimilartoadvertisingonpublictoiletdoors,aspeopleusethesefacilitiesfrequently.

57 Department of Transport: South Africa Department of Transport: Green Transport Strategy for South Africa (2018-2050)
15 REFERENCES
Brown,M;Yongsung,K&Romani,M.,2015,InfrastructureFinanceintheDevelopingWorld:GreenInfrastructureDefinitionandNeeds.GlobalGreenGrowthInstitute,2015.
Congress of Parties, 2015, United Nations Framework on Convention on Climate Change
Carbon Tax, 2016. National Treasury http://www.gov.za/sites/www.gov.za/files/speech_docs/Carbon%20Tax%20Modelling%20Report.pdf
Department of Energy, 2014, Draft Position Paper on the South African Biofuels Regulatory Framework. 2014, Pretoria.
Department of Environmental Affairs, 2007, Long Term Mitigation Scenarios, https://open.uct.ac.za/bitstream/handle/11427/16804/Scenario_Building_Team_Long_Term_Mitigation_2007.pdf?sequence
Department: Environmental Affairs and Tourism, 2008, The National Framework for Sustainable Development in South Africa. 2008.
Department of Environmental Affairs, 2014, Mitigation Potential Analysis https://www.environment.gov.za/sites/default/files/docs/appendixG_afolusector.pdf
Department of Environmental Affairs, (2011), National Strategy for Sustainable Development and Action Plan (NSSD1) 2011-2014. 2011.
Department of Environmental Affairs (DEA), 2013: Greenhouse Gas Inventory for South Africa, 2000–2010. Pretoria, DEA.
Department of Environmental Affairs (DEA), 2014: South Africa’s Greenhouse Gas Mitigation Potential Analysis. Pretoria, DEA.
Department of Environmental Affairs, 2014, GHG National Inventory Report: South Africa 2000-2010. 2014, Pretoria.
Department of Environmental Affairs, 2014. Freight Shift from Road to Rail: The Socio-Economic Impact of a Modal Shift of Freight from Road to Rail to Achieve Maximum Greenhouse Gas Mitigation in the Transport Sector. 2014, Pretoria.
Department of Energy, 2014, Draft Position Paper on the South African Biofuels Regulatory Framework. 2014, Pretoria.
Department of Energy, 2005. Energy Efficiency Strategy of the Republic of South Africa.
Department of the Presidency. National Development Plan: Vision 2030.
Department of Transport. National Rail Policy: Green Paper. 2015, Pretoria. http://www.transport.gov.za/LinkClick.aspx?fileticket=0MTIGeNPZ8s%3D&tabid=334&mid=1800
Department of Transport. Roads Policy for South Africa: Draft Green Paper. 2016, Pretoria. http://www.swartland.org.za/media/docs/2015/Documents/Services/Salga/Roads%20Infrastructure%20Policy%20-%20Policy%20Framework.pdf
Department of Transport. Strategic Plan: Revised 2011/12 – 2013/14. http://www.transport.gov.za/Portals/0/Annual%20Reports/DoT%20Strat%20plan.pdf
The above link is not live
Department of Transport, 2007. Public Transport Strategy, Pretoria.
Department of Trade & Industry (2016), Green Transport Study.
Gauteng Province Department of Roads and Transport, 2012. 5-Year Transport Implementation Plan.
Gauteng Province – Roads and Transport, 2015. Gauteng’s 25 Year Integrated Transport Master Plan.
Hayashi, Y. and Kato, H. (2000). A Model System for the Assessment of the Effects of Car and Fuel Green Taxes on CO2 Emissions. Department of Geotechnical and Environmental Engineering, Nagoya University, Nagoya.
IATA. A Global Approach to Reducing Aviation Emissions: First Stop Carbon-Neutral Growth by 2020. IATA. 2009.
Intended National Determined Contributions, 2015, https://www.environment.gov.za/sites/default/files/docs/sanational_determinedcontribution.pdf

58Department of Transport: Green Transport Strategy for South Africa (2018-2050)
http://www.treasury.gov.za/documents/national%20budget/2006/sars/B05Guide.pdf
http://www.treasury.gov.za/comm_media/press/2017/20170215001%20%20REVIEW%20OF%20THE%0DIESEL%20FUEL%20TAX%20REFUND.pdf
https://www.cbd.int/doc/.../im/.../wscbteeb-mena-01-enviro-fiscal-reform-sa-en.pdf
http://www.climatechangenews.com/2015/08/04/south-africa-to-target-34-carbon-cuts-by-2025/
http://www.climateactiontracker.org/
Karani, P. Environmental Implications of the Road Network in South Africa. Development Bank of South Africa, Pretoria.
Kelly, F.J & Fussell, J.C (2015), Air Pollution and Public Health: Emerging Hazards and Improved Understanding of Risk, Environ Geochem Health: 37(4): 631-641
Mock, P and Posada, F. New Vehicle Fuel Economy and CO₂ Emissions Standard Regulations. The International Council on Clean Transportation. 2015.
National Household Travel Survey, 2013, Department of Transport http://www.transport.gov.za/Portals/0/NHTS2/1.%20P0320%20%20NHTS_February%20to%20March%202013%201-54.pdf
National Treasury, 2017, http://www.treasury.gov.za/documents/national%20budget/2006/sars/B05Guide.pdf
Page, O, Moeketsi, P, Schurink, W, Molefe, L, and Bruce, D, 2001. Crime and crime prevention on public transport. Pretoria: UNISA Press.
Republic of South Africa (RSA). 2011. National Climate Change Response White Paper. South Africa.
Sustainable Transport Policies, 2001, European Ministers Conference, page 17
South Africa’s Intended Nationally Determined Contribution, 2015.
UNEP, 2011, https://web.unep.org/greeneconomy/sites/unep.org.greeneconomy/files/publications/ger/ger_final_dec_2011/10.0-TRA-Transport.pdf

59 Department of Transport: South Africa Department of Transport: Green Transport Strategy for South Africa (2018-2050)
Notes....................................................................................................................................................................................................................................................................................................................
....................................................................................................................................................................................................................................................................................................................
...................................................................................................................................................................................................................................................................................................................
...................................................................................................................................................................................................................................................................................................................
...................................................................................................................................................................................................................................................................................................................
...................................................................................................................................................................................................................................................................................................................
...................................................................................................................................................................................................................................................................................................................
...................................................................................................................................................................................................................................................................................................................
...................................................................................................................................................................................................................................................................................................................
...................................................................................................................................................................................................................................................................................................................
...................................................................................................................................................................................................................................................................................................................
...................................................................................................................................................................................................................................................................................................................
...................................................................................................................................................................................................................................................................................................................
...................................................................................................................................................................................................................................................................................................................
...................................................................................................................................................................................................................................................................................................................
...................................................................................................................................................................................................................................................................................................................
...................................................................................................................................................................................................................................................................................................................
...................................................................................................................................................................................................................................................................................................................
...................................................................................................................................................................................................................................................................................................................
...................................................................................................................................................................................................................................................................................................................
...................................................................................................................................................................................................................................................................................................................
...................................................................................................................................................................................................................................................................................................................
...................................................................................................................................................................................................................................................................................................................
...................................................................................................................................................................................................................................................................................................................
...................................................................................................................................................................................................................................................................................................................
...................................................................................................................................................................................................................................................................................................................
...................................................................................................................................................................................................................................................................................................................
...................................................................................................................................................................................................................................................................................................................
...................................................................................................................................................................................................................................................................................................................
...................................................................................................................................................................................................................................................................................................................
...................................................................................................................................................................................................................................................................................................................
...................................................................................................................................................................................................................................................................................................................
...................................................................................................................................................................................................................................................................................................................
...................................................................................................................................................................................................................................................................................................................
...................................................................................................................................................................................................................................................................................................................
...................................................................................................................................................................................................................................................................................................................
...................................................................................................................................................................................................................................................................................................................
....................................................................................................................................................................................................................................................................................................................

60Department of Transport: Green Transport Strategy for South Africa (2018-2050)
Notes....................................................................................................................................................................................................................................................................................................................
....................................................................................................................................................................................................................................................................................................................
...................................................................................................................................................................................................................................................................................................................
....................................................................................................................................................................................................................................................................................................................
...................................................................................................................................................................................................................................................................................................................
...................................................................................................................................................................................................................................................................................................................
...................................................................................................................................................................................................................................................................................................................
...................................................................................................................................................................................................................................................................................................................
...................................................................................................................................................................................................................................................................................................................
...................................................................................................................................................................................................................................................................................................................
...................................................................................................................................................................................................................................................................................................................
...................................................................................................................................................................................................................................................................................................................
...................................................................................................................................................................................................................................................................................................................
...................................................................................................................................................................................................................................................................................................................
...................................................................................................................................................................................................................................................................................................................
...................................................................................................................................................................................................................................................................................................................
...................................................................................................................................................................................................................................................................................................................
...................................................................................................................................................................................................................................................................................................................
...................................................................................................................................................................................................................................................................................................................
...................................................................................................................................................................................................................................................................................................................
...................................................................................................................................................................................................................................................................................................................
...................................................................................................................................................................................................................................................................................................................
...................................................................................................................................................................................................................................................................................................................
...................................................................................................................................................................................................................................................................................................................
...................................................................................................................................................................................................................................................................................................................
...................................................................................................................................................................................................................................................................................................................
...................................................................................................................................................................................................................................................................................................................
...................................................................................................................................................................................................................................................................................................................
...................................................................................................................................................................................................................................................................................................................
...................................................................................................................................................................................................................................................................................................................
...................................................................................................................................................................................................................................................................................................................
...................................................................................................................................................................................................................................................................................................................
...................................................................................................................................................................................................................................................................................................................
...................................................................................................................................................................................................................................................................................................................
...................................................................................................................................................................................................................................................................................................................
...................................................................................................................................................................................................................................................................................................................
...................................................................................................................................................................................................................................................................................................................
...................................................................................................................................................................................................................................................................................................................
...................................................................................................................................................................................................................................................................................................................
....................................................................................................................................................................................................................................................................................................................

61 Department of Transport: South Africa Department of Transport: Green Transport Strategy for South Africa (2018-2050)
Notes....................................................................................................................................................................................................................................................................................................................
....................................................................................................................................................................................................................................................................................................................
...................................................................................................................................................................................................................................................................................................................
....................................................................................................................................................................................................................................................................................................................
...................................................................................................................................................................................................................................................................................................................
...................................................................................................................................................................................................................................................................................................................
...................................................................................................................................................................................................................................................................................................................
...................................................................................................................................................................................................................................................................................................................
...................................................................................................................................................................................................................................................................................................................
...................................................................................................................................................................................................................................................................................................................
...................................................................................................................................................................................................................................................................................................................
...................................................................................................................................................................................................................................................................................................................
...................................................................................................................................................................................................................................................................................................................
...................................................................................................................................................................................................................................................................................................................
...................................................................................................................................................................................................................................................................................................................
...................................................................................................................................................................................................................................................................................................................
...................................................................................................................................................................................................................................................................................................................
...................................................................................................................................................................................................................................................................................................................
...................................................................................................................................................................................................................................................................................................................
...................................................................................................................................................................................................................................................................................................................
...................................................................................................................................................................................................................................................................................................................
...................................................................................................................................................................................................................................................................................................................
...................................................................................................................................................................................................................................................................................................................
...................................................................................................................................................................................................................................................................................................................
...................................................................................................................................................................................................................................................................................................................
...................................................................................................................................................................................................................................................................................................................
...................................................................................................................................................................................................................................................................................................................
...................................................................................................................................................................................................................................................................................................................
...................................................................................................................................................................................................................................................................................................................
...................................................................................................................................................................................................................................................................................................................
...................................................................................................................................................................................................................................................................................................................
...................................................................................................................................................................................................................................................................................................................
...................................................................................................................................................................................................................................................................................................................
...................................................................................................................................................................................................................................................................................................................
...................................................................................................................................................................................................................................................................................................................
...................................................................................................................................................................................................................................................................................................................
...................................................................................................................................................................................................................................................................................................................
...................................................................................................................................................................................................................................................................................................................
...................................................................................................................................................................................................................................................................................................................
....................................................................................................................................................................................................................................................................................................................

62Department of Transport: Green Transport Strategy for South Africa (2018-2050)

63 Department of Transport: South Africa Department of Transport: Green Transport Strategy for South Africa (2018-2050)
TransportDepartment:
REPUBLIC OF SOUTH AFRICA
transport
PrivateBagX193
Pretoria, 0001, Forum Building
Cnr Struben and Bosman
Pretoria