Green-Schools Travel
26
Green-Schools Travel
Transcript of Green-Schools Travel

1
GREEN-SCHOOLS TRAVEL
Green-Schools Travel

2
GREEN-SCHOOLS TRAVEL
This toolkit is aimed at secondary 1st – 6th years. It’s designed to be flexible and help you to build a learning experience across multiple subjects for your students. So, you can work your way from start to end, using it as a full unit of learning or use the toolkit for just one or two activities with your class. Some of the strongest subject links are detailed in the table below and listed in full at the start of each section, but there are lots more that you can link to. It can also be used to support your Green-Schools programme.
The aim of this toolkit is to not only achieve a greater awareness of local air quality and how it affects us, but also to highlight how actions in our daily lives can have an impact on the air that we breathe. It also aims to ensure this message is fed back into the pupil’s home environment, thus reaching the wider population. Infor-mation on air pollution is given along with complementary activities. Monitoring the air quality around your school and other fieldwork form key parts of the toolkit. Details on how to undertake air quality monitoring are available on the Green-Schools website.

3
GREEN-SCHOOLS TRAVEL
ACTIVITY
ACTIVITY
ACTIVITY
ACTIVITY
ACTIVITY
ACTIVITY
ACTIVITY
ACTIVITY
ACTIVITY
ACTIVITY
ACTIVITY
ACTIVITY
ACTIVITY
ACTIVITY
4
GREEN-SCHOOLS TRAVEL
Air Quality Index Activity
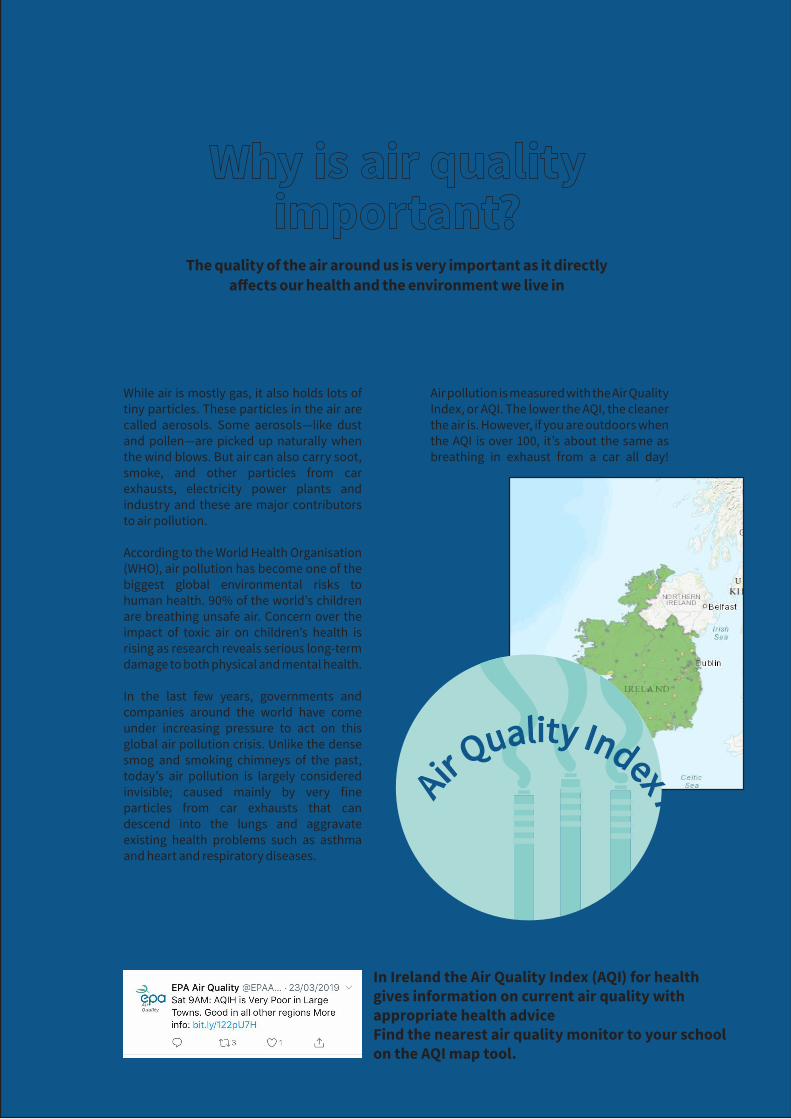
While air is mostly gas, it also holds lots of tiny particles. These particles in the air are called aerosols. Some aerosols—like dust and pollen—are picked up naturally when the wind blows. But air can also carry soot, smoke, and other particles from car exhausts, electricity power plants and industry and these are major contributors to air pollution.
According to the World Health Organisation (WHO), air pollution has become one of the biggest global environmental risks to human health. 90% of the world’s children are breathing unsafe air. Concern over the impact of toxic air on children’s health is rising as research reveals serious long-term damage to both physical and mental health.
In the last few years, governments and companies around the world have come under increasing pressure to act on this global air pollution crisis. Unlike the dense smog and smoking chimneys of the past, today’s air pollution is largely considered invisible; caused mainly by very fine particles from car exhausts that can descend into the lungs and aggravate existing health problems such as asthma and heart and respiratory diseases.
Air pollution is measured with the Air Quality Index, or AQI. The lower the AQI, the cleaner the air is. However, if you are outdoors when the AQI is over 100, it’s about the same as breathing in exhaust from a car all day!
In Ireland the Air Quality Index (AQI) for health gives information on current air quality with appropriate health advice www.epa.ie/air/quality/ Find the nearest air quality monitor to your school on the AQI map tool.
The quality of the air around us is very important as it directly affects our health and the environment we live in

5
GREEN-SCHOOLS TRAVEL
Humans have impacted air quality for a very long time. Some of the first big air pollution events would have been the huge fires set by prehistoric humans to smoke out prey animals and change the landscape from forest to grasslands. As humans evolved so too did the pollution they created. A major pollutant historically and one that is still a huge issue in some parts of the world is coal.
As far back as Roman times, 2000 years ago, the courts considered civil claims over smoke pollution. The empire even tried a very early version of a Clean Air Act. In 535, the Emperor proclaimed the importance of clean air as a birthright, “By the law of nature these things are common to mankind—the air, running water, the sea.
For example, in 1952 smog in London killed 4000 people and led to the Clean Air Acts of 1956 and 1968. These acts banned emissions of black smoke and so instead of burning bituminous coal (smoky coal), residents in urban areas and factories burnt smokeless fuel.
From the 1800’s as the Industrial Revolution took hold there that burned a lot of coal. The polluted smoke from these factories spread into the surrounding areas and killed food crops and made people who had to breathe in the smoke from these factories sick. Smog is a horrible mix of smoke and fog and in some areas it got so bad it killed people.
Some air pollution comes from natural sources like volcanoes or storms but most air pollution comes from human activities
Air pollution is “the new tobacco...” as famously quoted by Dr. Tedros Adhanom Ghebreyesus,
WHO’s Director General
The Industrial Revolution in the 1800’s saw coal burning increase hugely in many areas and making
money was put ahead of health concerns

6
GREEN-SCHOOLS TRAVEL
In 2013 the smoky coal ban was extended to the next 25 largest urban areas in the country. Following on from that Ireland will have a total nationwide ban on smoky coal in 2019. However, just as some areas were getting to grips with controlling coal pollution, another source of air pollution was on the rise – the car.
The first petrol car was invented by Karl Benz in 1886. At first there were very few cars on the road, so they didn’t have a huge effect on air quality but through the 20th century the numbers exploded and by the 1980s, the numbers of vehicles on the road was rapidly increasing and so were emissions of pollutants like nitrogen dioxide (NO₂) and fine particles (PM). The catalytic converter was introduced to reduce the amount of dangerous emissions from car exhausts by filtering them out and by 1993 all new cars sold in Europe had to be fitted with one and this led to a rapid decline in emissions. However, our roads are busier than ever. Car emissions still contain a range of largely invisible toxic substances that are having a serious impact on our environment and our health.
Air quality in Ireland is generally good, among the best in Europe, but levels of some pollutants are still of concern. Traffic produces a lot of pollution and in some urban areas this can come close to breaking the limits allowed. Solid fuel burning in houses are the other main sources of air pollution in Ireland e.g. coal burning, turf (peat) briquettes, wood. Ireland introduced a bituminous (smoky coal) ban in 1990 but only in Dublin. Research showed it resulted in 350 fewer deaths per year in Dublin. However, impacts on air quality were still being felt in areas where smoky coal was still for sale, even in smaller towns and villages.
Ireland has one of the highest rates of asthma in the world.
One in five children in Ireland are treated for asthma
High rates of hospital admissions in Ireland are linked to poor air quality at certain times of the
year
Respiratory deaths in Ireland are 40% above European Union
average, accounting for one-in-five deaths

7
GREEN-SCHOOLS TRAVEL
Where is the fuel from?
Find
a Fuel Activity Each group to research one fuel or energy source (think fossil fuels and renewables like wind, water, solar). List the advantages and disadvantages of using this fuel or energy source and any other information you think is im-portant. Each group presents their findings to the rest of the class. Can be extended to poster project.
General information
Advantages Disadvantages
https://greenschoolsireland.org/resources/aqt-find-a-fuel-activity-p7/

8
GREEN-SCHOOLS TRAVEL
Activity - Clean Air, Clean Energy
To get clean air we need to use clean energy. All fossil fuels are said to be finite - they are running out and cannot be replaced. Governments across the world are planning to stop using fossil fuels altogether by the end of this century and are making the transfer to renewable energy – sources that will not run out and do not produce air pollution.
May 2019 the UK government was advised by its Committee on Climate Change to immediately set targets to cut greenhouse gas emissions to zero by the year 2050.
What is the present situation in Ireland in terms of the amount of our energy met by fossil fuels and the amount met by renewables?
What plans can you come with to help the switch from fossil fuels to renewables?

9
GREEN-SCHOOLS TRAVEL
It’s electric bus technology re-engineered for a train but it’s also got solar panels on the roof so it can recharge itself. For cloudy days there are solar panels in the station’s roof so it can plug in.
From 1st July 2019 Ireland will no longer be able to purchase diesel buses for public transport. Instead public transport will use more biomethane gas produced from agriculture and food industry waste. Biomethane bus fleets are running in many cities including Stockholm, Lille and Nottingham.
Some people believe that electric cars are the next step in reducing traffic emissions. Electric vehicles do not produce any emissions directly, as they are battery powered and don’t have an exhaust. However, the way the electricity to charge their batteries is generated is a source of pollution if it is fossil fuel based. If renewable energy sources are supported in making up a greater proportion of our electricity power then the electric car can also become cleaner for our environment.
Biofuels have been around since early 1900’s. The first car, Henry Ford’s Model T, ran on Hemp biofuel. But biofuels were replaced by cheap and seemingly never-ending fossil fuels. Recent revisitation of biofuel options has drawbacks, especially with large scale land usage. However, biofuels can offer solutions to local issues of transportation and waste.
Instead of sending a tonnes of waste coffee grounds to landfill where it degrades and releases greenhouse gases, it’s collected and turned it into a biofuel. The final fuel mix is made up of 80% diesel, and 20% biofuel
It’s electric bus technology re-engineered for a train but it’s also got solar panels on the roof so it can recharge itself. For cloudy days
“Bio Bus”, Bali, Indonesia running on used cooking oil since 2015
New green initiative for London buses to be fuelled by coffee, 2017
Fully solar-powered train, New South Wales, Australia, 2017
Gas Powered Bus Hits Ireland’s Roads, March 2019
See headlines marked in bold below for cleaner fueledtransport
Planes are the worst mode of travel when it comes to their environmental impact. Investigate what can be done to improve this? (hint...at the moment just fly less!)
Activity

10
GREEN-SCHOOLS TRAVEL
Air pollution is not the same everywhere. Different pollutants are released into the air from a wide range of sources. Can you identify the sources of air pollution in the graphic below?
1 2
33 4
5 6
7 8
https://greenschoolsireland.org/resources/aqt-sources-of-air-pollution-p10/

11
GREEN-SCHOOLS TRAVEL
Carbon monoxide (CO)
Carbon monoxide is produced from incomplete burning of fossil fuels. Car engines used to emit CO at dangerous levels but catalytic converters were developed to mix oxygen with most of the CO to form non-poisonous carbon dioxide (CO2). So now CO is still in car exhaust fumes but at lower levels.
Colourless, odourless, tasteless gas and at high levels is toxic to humans. We breathe in CO like normal air with no irritation to our nose or throats. Then, our blood cells attach with CO molecules instead of oxygen molecules, starving our organs of the oxygen they need. CO poison-ing leads to flu-like symptoms and can be fatal.
POLLUTANT EMISSION SOURCE CHARACTERISTICS AND EFFECTS
Nitrogen oxides (NOx)
Nitrogen oxides are a group of gases made up of both nitrogen and oxygen. Transport is the main source of emissions (41% of the total in Ireland in 2016) and they are also produced by electricity power stations that burn fossil fuels.
Nitrogen oxides is associated with diseases such as diabetes, hypertension, stroke, chronic obstructive pulmonary disease (COPD) and asthma. It also contributes to acidification of soils and surface waters, ozone (O3) formation and nitrogen enrichment in nture (see polluted rain below).
Sulphur dioxide (SO2)
Main sources are electricity power generation, industry and residential solid fuel burning. It also comes from transport, but cleaner fuels and better vehicles are reducing this source.
Sulfur dioxide affects health when it is breathed in, irritating the nose, throat, and airways. Those most at risk are people with asthma or similar conditions. It also contributes to the acidification of soils and surface waters (see polluted rain below).
Polluted rain When we burn fossil fuels, gases containing NO2 and SO2 are released into the air. These gases dissolve in water in the atmosphere and fall back to earth as acid rain.
Acid rain harms wildlife, vegetation and buildings. When this acid rain soaks into soil it changes the chemistry of the soil and can make it unfit for many plants. Acid rain also changes the chemistry of the lakes and streams that the polluted rainwater flows into, harming fish and other aquatic life.
Particulate Matter(PM)
Particulate matter can be made up of natural things like sea salt, plant pollen and sub-Saharan dust. But one of the biggest human-made sources of PM pollution in Ire-land is directly from vehicles e.g. exhaust pipes and dust from the wearing of brakes and tyres.
PM are floating specks of dust. They are so tiny they can’t be seen with the naked eye and can be breathed deep into our lungs. PM are responsible for significant negative impacts on human health. See next page for more info on PM.
Ozone Ozone is a gas with both natural and human sources. Most ground-level ozone pollution is produced by industry and transport that emit chemicals and these chemicals react with sunlight to form ozone.
High up in the atmosphere ozone plays a protective role, shielding Earth from harmful rays and ultraviolet radiation. However, at ground level it acts as a greenhouse gas and has harmful effects on human health. Exposure to ground-level ozone increases a person’s likelihood of getting respiratory disease.

12
GREEN-SCHOOLS TRAVEL
When run on fossil fuels, cars and other vehicles produce a range of toxic substances that pollute our air. These are invisible to the naked
eye. Let’s take a closer look at some of these tiny toxic pollutants. The diagram below shows the scale of both Particulate Matter (PM)
sizes with a human hair and grains of sand.
PM can be solid particles or liquid droplets and are divided into 2 groups depending on size:
o PM10 are between 2.5 and 10 um (micrometers)
o PM2.5 are less than 2.5 um
Complete combustion (100% efficient burning) would turn all carbon in a fuel into carbon
dioxide (CO2). But combustion is never totally efficient or complete and so burning produces
not only CO2 but also things like carbon monoxide (CO) and black carbon particles. This
mixture of Particulate Matter from incomplete combustion is often called soot.
Toxic pollutants
Complete versus incomplete combustion
90 um diametergrain of sand
50-70 um diameterhuman hair
PM2.5 <2.5 um diameter
PM10 <10 um diameter

13
GREEN-SCHOOLS TRAVEL
There are many pollutants that affect the quality of our air we breathe. In groups researchone or more pollutant. See the previous ‘Transport and air pollution’ table for ideas of pollutants to research or choose your own.
Where it comes from and the effects it has on human health and our environment?
What is the upper limit for this pollutant in Ireland and is the level of this pollutant generally increasing or decreasing. Why?
Highlight solutions to this pollution that are being used
or should be put in place.Activity
Groups can complete the activity on page 14 and
present their findings to the class. Why not design a poster or chart with this information to display to
whole school?

14
GREEN-SCHOOLS TRAVEL
Increasing or decreasing levels? Why?
Where it comes from? Health effects Environmental effects
Solutions to pollutionUpper limit values in Ireland
CHECK OUT WWW.EPA.IE
https://greenschoolsireland.org/resources/aqt-get-to-know-pollutants-p14/

15
GREEN-SCHOOLS TRAVEL
Irelands air is relatively clean as, like many developed countries, we have the technology and resources to combat pollution. This sadly is not the case for all countries. According to studies by the World Health Organisation, some of the worst cities for air pollution in the world are
Some of these cities are in quite poor countries, and they do not have the money to spend on cleaner technologies and vehicles. It may that air pollution is just a concern for developing nations, but as we’ve seen, pollution knows no boundaries and cities closer to us such as Rome and London suffer from high levels of pollution.
Karachi in Pakistan Beijing in ChinaLima in Peru Cairo in Egypt
https://greenschoolsireland.org/resources/air-quality-toolkit-air-quality-around-the-world-a4-p16/
16
GREEN-SCHOOLS TRAVEL
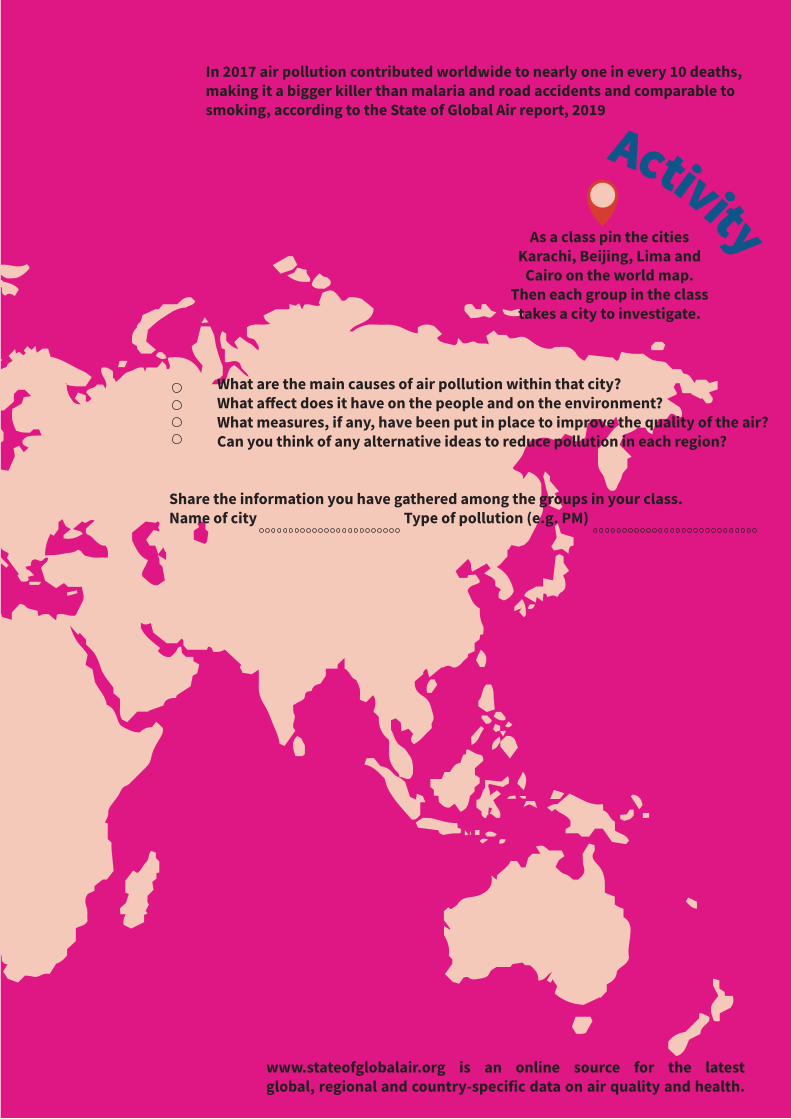
ActivityAs a class pin the cities Karachi, Beijing, Lima and
Cairo on the world map. Then each group in the class
takes a city to investigate.
In 2017 air pollution contributed worldwide to nearly one in every 10 deaths, making it a bigger killer than malaria and road accidents and comparable to smoking, according to the State of Global Air report, 2019
What are the main causes of air pollution within that city? What affect does it have on the people and on the environment? What measures, if any, have been put in place to improve the quality of the air? Can you think of any alternative ideas to reduce pollution in each region?
Share the information you have gathered among the groups in your class.Name of city Type of pollution (e.g. PM)
www.stateofglobalair.org is an online source for the latest global, regional and country-specific data on air quality and health.

17
GREEN-SCHOOLS TRAVEL
Young people are far more susceptible to
pollution than adults, due to their immature and
developing systems and lower body weight
Everything that impacts our environment impacts
us as we are part of the environment and cannot live separately from it - the air we breathe, the
water we drink
When we are exposed to air pollution it gets into our lungs and can cause respiratory (breathing) problems and worsen
existing respiratory problems, like asthma
When we are exposed to air pollution it also
effects many other parts of our bodies including eyes, brains, heart and reproductive systems

18
GREEN-SCHOOLS TRAVEL
RESPIRATORY SYSTEMIrritation & infection. Asthma & reduced lung function. Chronic obstructive pulmonary disease
HEADACHE & STRESSS02, PM - Impact on the central nervous system
REPRODUCTIVE SYSTEMPM- Impacts to both male and female reproductive systems
SENSORY IRRITATION03, PM, N02, S02 - Breathing problems, irritation of eyes, nose and throat
IMPACTS ON LIVERN02 - Spleen and blood
CARDIOVASCULARPM, 03, S02 - Heart or blood vessels diseases

19
GREEN-SCHOOLS TRAVEL
International attention of the impacts of air pollution on health is increasing. Is there action being taken for solutions to these problems?
ActivityThe WHO Global Conference on Air Pollution and Health, 30 October – 1 November 2018 was the first-ever global event to focus on both air pollution and health. Participants included ministers of health and environment and other national government representatives; representatives of intergovernmental agencies, health professionals, other sectors (e.g. transport, energy, etc.), as well as from research, academia and civil society. The conference featured a “BreatheLife2030” with agreement on a target to meet WHO’s Air Quality Guidelines and reduce climate emissions and reduce the 7 million deaths a year due to air pollution by 2030, as a contribution to achieving the Sustainable Development Goals. Press reports say that participants agreed an aspirational goal of reducing the number of deaths from air pollution by two-thirds by 2030.
Air pollution action
o Find out what was agreed at the WHO Global Conference on Air Pollution and Health.
o Who will monitor whether the conference agreements are being met and how will this be done?

20
GREEN-SCHOOLS TRAVEL
air pollution → greenhouse gases → global warming → climate change
There is a focus on Carbon dioxide as the main greenhouse gas (GHG) probably because it is the greenhouse gas that we produce most of. However, there are other air pollutant greenhouse gases that also cause global warming including Methane, Nitrous oxide, black carbon, ground-level Ozone. These GHGs differ in many ways but most are Short-lived Climate Pollutants (SLCPs) in termsof how long they stay in our atmosphere. CO₂ remains in the atmosphere for a hundred years or more, Methane stays for about a decade while Black carbon and ground-level Ozone remain for only a few hours to a few weeks. After CO₂, it is Black carbon and Methane that are the top contributors to global warming.
The good news is that lowering air pollution levels of these SLCPs has almost immediate effects. Many are now switching from being totally focused on lowering CO₂ emissions to putting more effort into reducing SLCPs. This will slow down climate change sooner and offers an opportunity for improving our air quality quickly.
Air pollution and climate change are often treated as if they were two separate problems, when they are actually caused by the same issues - burning fossil fuels. Air pollution also includes the extragreenhouse gases we are producing that are causing global warming and leading to climate change. Air pollution has the most direct impact on health and causes economic harm to buildings, vegetation and activities such as tourism. Climate change affects lives, property and the natural world in a less direct, but serious way - weather disasters, storms, floods, droughts and rising sea levels.
Greenhouse gases that we produce add to the gases from natural sources in the atmosphere and affect the amount of sunlight absorbed by the atmosphere which heats our planet and changes the climate.
The October 2018 report by the Inter- governmental Panel on Climate Change (IPCC) stresses the importance of keeping global warming to no more than a 1.5˚C increase in global average temperature above pre-industrial revolution levels. We’ve already gone 1̊ C above that pre-industrial revolution temperature.
Activity
By reducing air pollution we also protect our climate
In combating climate change most of the focus is on reducing CO₂
emissions. What is being done to reduce other greenhouse gases
like SLCPs?

21
GREEN-SCHOOLS TRAVEL
Air can be polluted both indoors and outdoors. Tobacco and other kinds of smoking are examples of indoor air pollution. Exposure to air pollution while sitting in a car or bus, especially when it’s stuck in traffic, can be serious. Sick Building Syndrome is a health condition related to pesticides, insecticides and chemicals we use at home, in schools and offices.
Acid rain has been reduced thanks to legislation cleaning up emissions of sulphur. However, emissions of nitrogen are reducing much more slowly. Urban nitrogen dioxide is mainly from traffic. While exhaust catalysts have decreased total nitrogen oxides from petrol cars by around 96%, real-world tests show that pollution controls on diesel cars are not as effective. New diesels produce similar nitrogen oxides to those bought 15 years ago.
In Europe, nitrogen dioxide (NO₂) has been a focus of air pollution concerns, especially following the dieselgate scandal (diesel exhaust emissions were manipulated by car manufacturers in diesel) and numerous legal battles faced by governments that have been shown to be in breach of legal limits. Recent satellite data shows the scale and spread of global NO₂. Mapped against known pollution sources, it shows that NO₂ pollution doesn’t come from diesel pollution alone; it is also emitted by coal, oil, gas and biomass plants as well as forest fires and crop burning.Acid rain – some good news!
Research the background to Dieselgate. What happened and why did it happen? Outline the present situation with the companies involved. What sanctions and/or legal proceedings were taken against them? How will this be prevented from happening again?
Indoor air pollution
Dieselgate Activity

22
GREEN-SCHOOLS TRAVEL
Understanding the effects of air pollution is complicated not only by the many kinds of pollutants but also how the pollutants interact with each other and their environment. The strength of a pollutants effect depends on many factors, some outlined below.
Pollution is found at different heights in the atmosphere. Some are emitted at ground level, from transport for example, and this is where people are at high exposure to pollution especially in built up areas where buildings make it difficult for pollution to disperse. Power plants or factories with smoke stacks emit pollution at higher levels. While those closest to the source are most at risk, pollution at higher levels of the atmosphere can travel hundreds of kilometers including across borders.
Pollution emissions vary at different times of the year particularly from seasonal events, such as forest fires or agricultural burning. Emissions from power plants and vehicles are quite stable all year round, but the impacts of their pollution can be made much worse at ground level under certain weather conditions, for example when the air is still, as the wind does not disperse it.
With a pollution source like transport there is a daily fluctuation at commuting times. Picture a road close to your school. Each car, van, bus, lorry and motorbike that travels along that road produces pollution. If you think of all the roads within your town, and scale up to Ireland, it’s easier to see how transport is one of the significant contributors to air pollution.
Pollution source
Time of day
Not all air pollution comes directly from sources such as traffic and electricity production. Some pollutants are created from chemical reactions among other pollutants in the air. An example is ground level ozone (O3) produced when nitrogen oxides (NOx) and volatile organic compounds (VOCs) react with each other in sunlight and stagnant air.
Smog (smoke mixed with fog) is often caused by a mix of heavy traffic, high temperatures, sunshine and calm winds. Even during winter months if wind speeds are low, the air becomes stagnate at a place forming smog and increasing pollution levels near the ground closer to where people are. It also decreases visibility and disturbs the environment. Temperature inversions are situations when warm air does not rise as usual but instead is trapped near the ground. During temperature inversions if the wind is calm, smog may get trapped and remain over a place for days.
Time of year and weather
Smog
What’s in the mix?
23
GREEN-SCHOOLS TRAVEL
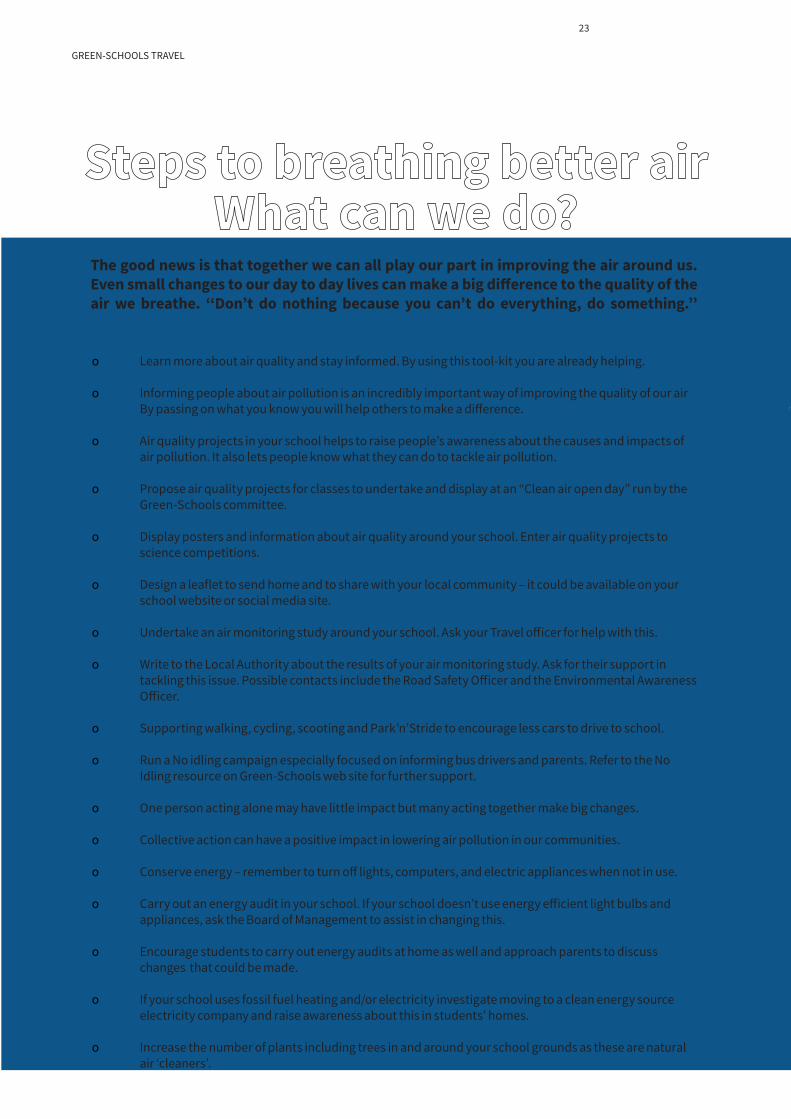
o Learn more about air quality and stay informed. By using this tool-kit you are already helping.
o Informing people about air pollution is an incredibly important way of improving the quality of our air By passing on what you know you will help others to make a difference.
o Air quality projects in your school helps to raise people’s awareness about the causes and impacts of air pollution. It also lets people know what they can do to tackle air pollution.
o Propose air quality projects for classes to undertake and display at an “Clean air open day” run by the Green-Schools committee.
o Display posters and information about air quality around your school. Enter air quality projects to science competitions.
o Design a leaflet to send home and to share with your local community – it could be available on your school website or social media site.
o Undertake an air monitoring study around your school. Ask your Travel officer for help with this.
o Write to the Local Authority about the results of your air monitoring study. Ask for their support in tackling this issue. Possible contacts include the Road Safety Officer and the Environmental Awareness Officer.
o Supporting walking, cycling, scooting and Park’n’Stride to encourage less cars to drive to school.
o Run a No idling campaign especially focused on informing bus drivers and parents. Refer to the No Idling resource on Green-Schools web site for further support.
o One person acting alone may have little impact but many acting together make big changes.
o Collective action can have a positive impact in lowering air pollution in our communities.
o Conserve energy – remember to turn off lights, computers, and electric appliances when not in use.
o Carry out an energy audit in your school. If your school doesn’t use energy efficient light bulbs and appliances, ask the Board of Management to assist in changing this.
o Encourage students to carry out energy audits at home as well and approach parents to discuss changes that could be made.
o If your school uses fossil fuel heating and/or electricity investigate moving to a clean energy source electricity company and raise awareness about this in students’ homes.
o Increase the number of plants including trees in and around your school grounds as these are natural air ‘cleaners’.
The good news is that together we can all play our part in improving the air around us. Even small changes to our day to day lives can make a big difference to the quality of the air we breathe. ‘‘Don’t do nothing because you can’t do everything, do something.’’

24
GREEN-SCHOOLS TRAVEL
Now that you understand what air pollution is and what the main causes are you can carry out your own investigation into what air quality is like around your school and consider the causes of this pollution. To investigate how good or bad our air quality is we test the air around us for certain known pollutants. Monitoring (testing over time) the amounts of these pollutants is also important as this can vary hugely depending on time of day and weather.
The simplest type of air monitor that can be used is called a Diffusion Tube. This is a small plastic tube which absorbs any Nitrogen Dioxide (NO₂) gas that drifts past. The methodology involves installing diffusion tubes at different locations around school grounds (preferably two tubes near to traffic or idling cars and the third in a less exposed area). As levels of NO₂ decrease with distance from source (i.e. cars), it will be expected that the results will vary by location of the tubes. They are collected for analysis after a month.
Another type of monitor are Automatic Monitors that give up-to-date information on air pollution as it happens. This records air quality continuously and downloads the information (data) to a computer. One way to measure the impact of transport on air quality is to compare pollution levels during weekdays and weekends, when there is usually less traffic. The automatic air
monitors are useful for this and to tell us if air pollution is bad at certain times of the day, for example, at rush hour, when people are trying to get to school or work, and home again in the evening. They can also tell us if the air pollution is worse at certain times of the year, for example, when there is little or no wind the pollution can be trapped in the air and doesn’t disperse easily then levels of pollution can be high. Also, if there is a polluting event, such as a large fire in the area or even further away in Europe, we can usually see the air pollution levels creeping higher.
Automatic Monitors
Contact your Travel Officer to inquire about monitoring of air quality outside your school
Activ
ity- Monitor the air
Diffusion Monitors

25
GREEN-SCHOOLS TRAVEL
Activity: Traffic surveyIn this activity you will conduct a simple traffic survey and the results will give you an indication of the level of air pollution you may find outside your school. To carry out the traffic survey you will need to download the traffic survey instructions and record sheet.
https://greenschoolsireland.org/resources/traffic-count-survey-instructions/https://greenschoolsireland.org/resources/traffic-count-survey-recording-sheet/
Activity: Causes of local air pollution survey
This activity allows you to record your observations of the individual factors that may cause air pollution around your school or within your local area. In this activity walk around your school grounds or chosen area and note any factors you can see across the landscape that may be a source of pollution. You may also want to use a camera to take a photograph of what you see. It would be useful, before starting this activity to think about the sources of pollution that were identified earlier in the site. To carry out the local air pollution survey you will need to download the causes of air pollution observation instructions and sheet.
https://greenschoolsireland.org/resources/aqt-causes-of-local-air-pollution-survey-p25/

26
GREEN-SCHOOLS TRAVEL
Based on your walk home, what are the two main sources of pollution?
Where you surprised by what you observed? Why?
What do you think? Hint: what can you and your family, local businesses and the local authorities do to prevent or reduce this pollution?
As you walk home from school take time to safely observe your surroundings and note any possible sources of pollution you can see. Record your observations as outlined in the spaces numbered 1 to 3 below.
Interview someone about the amount of traffic outside and around the school grounds, and the impact this has on your local area. For example, you could interview the school crossing warden, a parent and/or student who always walks or cycles to school or a parent and/or student who always comes to school by car.
With your group, design potential questions that you could ask. Once you have completed your interviews share the information with your class.
Extension exercise for ‘Why do you travel the way you travel?’. Using the information gathered from your traffic surveys and your interviews, write a persuasive letter or leaflet for pupils / parents / local community encouraging them not to use their cars for unnecessary journeys.
Questions for‘Why do you travel the way you travel?’
Responses
Why
do you travel the way you trave
l?
Interviewed by Interviewing
https://greenschoolsireland.org/resources/aqt-why-do-you-travel-the-way-you-travel-p26/