Green process design, industrial ecology, and ... PROOF RECYCL 1735 1–21 Resources, Conservation...
21
UNCORRECTED PROOF RECYCL 1735 1–21 Resources, Conservation and Recycling xxx (2005) xxx–xxx Green process design, industrial ecology, and 3 sustainability: A systems analysis perspective 4 Urmila Diwekar ∗ Department of Bio, Chemical, and Industrial Engineering and Institute for Environmental Science 5 and Policy, University of Illinois at Chicago, MC-063, Chicago, IL 60607, USA 6 Accepted 18 January 2005 7 Abstract 8 This paper presents a systems analysis perspective that extends the traditional process design 9 framework to green process design and industrial ecology leading to sustainability. For green process 10 design this involves starting the design decisions as early as chemical and material selection stage on 11 one end, and managing and planning decisions at the other end. However, uncertainties and multiple 12 and conflicting objectives are inherent in such a design process. Uncertainties increase further in 13 industrial ecology. Combining AI approaches with optimization methods, and constraining the system 14 using thermodynamics and physics can provide a way to address this problem. The concept of overall 15 sustainability goes beyond industrial ecology and brings in time dependent nature of the ecosystem and 16 multi-disciplinary decision making. Optimal control methods and theories from financial literature 17 can be useful in handling the time dependent uncertainties in this problem. 18 © 2005 Elsevier B.V. All rights reserved. 19 Keywords: Sustainability; Process design; Industrial ecology; Optimisation; Multi-objective; Uncertainty analysis; 20 Systems analysis; Options theory; Ito processes 21 22 1. Introduction 23 Computer aided simulation models and other design tools allow engineers to design, 24 simulate, and optimize chemical processes. However, there is a critical need to incorpo- 25 ∗ Tel.: +1 312 355 3277; fax: +1 312 996 5921. E-mail address: [email protected]. 1 0921-3449/$ – see front matter © 2005 Elsevier B.V. All rights reserved. 2 doi:10.1016/j.resconrec.2005.01.007
Transcript of Green process design, industrial ecology, and ... PROOF RECYCL 1735 1–21 Resources, Conservation...

UN
CO
RR
EC
TED
PR
OO
F
RECYCL 1735 1–21
Resources, Conservation and Recycling xxx (2005) xxx–xxx
Green process design, industrial ecology, and3
sustainability: A systems analysis perspective4
Urmila Diwekar∗
Department of Bio, Chemical, and Industrial Engineering and Institute for Environmental Science5
and Policy, University of Illinois at Chicago, MC-063, Chicago, IL 60607, USA6
Accepted 18 January 2005
7
Abstract8
This paper presents a systems analysis perspective that extends the traditional process design9
framework to green process design and industrial ecology leading to sustainability. For green process10
design this involves starting the design decisions as early as chemical and material selection stage on11
one end, and managing and planning decisions at the other end. However, uncertainties and multiple12
and conflicting objectives are inherent in such a design process. Uncertainties increase further in13
industrial ecology. Combining AI approaches with optimization methods, and constraining the system14
using thermodynamics and physics can provide a way to address this problem. The concept of overall15
sustainability goes beyond industrial ecology and brings in time dependent nature of the ecosystem and16
multi-disciplinary decision making. Optimal control methods and theories from financial literature17
can be useful in handling the time dependent uncertainties in this problem.18
© 2005 Elsevier B.V. All rights reserved.19
Keywords:Sustainability; Process design; Industrial ecology; Optimisation; Multi-objective; Uncertainty analysis;20
Systems analysis; Options theory; Ito processes21
22
1. Introduction23
Computer aided simulation models and other design tools allow engineers to design,24
simulate, and optimize chemical processes. However, there is a critical need to incorpo-25
∗ Tel.: +1 312 355 3277; fax: +1 312 996 5921.E-mail address:[email protected].
1 0921-3449/$ – see front matter © 2005 Elsevier B.V. All rights reserved.2 doi:10.1016/j.resconrec.2005.01.007
professor
Text Box
Published, Resources, Conservation, and Recycling, 44(2005), 215-235. (Invited Paper)

UN
CO
RR
EC
TED
PR
OO
F
RECYCL 1735 1–21
2 U. Diwekar / Resources, Conservation and Recycling xxx (2005) xxx–xxx
rate green engineering into the design of these processes (Diwekar, 2003a). This calls for26
extending the breadth of the design process to incorporate ecological and sustainability27
issues early in design. This paper presents a systems analysis perspective for extending the28
traditional design framework from green process design, to industrial ecology, to sustain-29
ability. As a first step, the framework extends the traditional design framework to include30
decisions starting from chemical and material selection, to management and planning. This31
integration poses challenging problem of discrete and continuous decisions, and nonlinear32
models. As the envelope is extended, the uncertainties in the model increase. Further, green33
engineering concepts change the single goal of engineering design from profitability to34
include number of different and conflicting objectives that can define the sustainability in35
the end.36
In industrial ecology, this decision making changes from the small scale of a single37
unit operation or industrial production plant to the larger scales of an integrated industrial38
park, community, firm or sector, the available management options expand from simple39
changes in process operation and inputs to more complex resource management strategies,40
including integrated waste recycling and reuse options. The concept of overall sustainability41
goes beyond industrial ecology and brings in time dependent nature of the ecosystem.42
Decisions regarding regulations, human interactions with ecosystem come in picture. It43
involves dealing with various time scales and time dependent uncertainties which require44
appropriately modeling these. The activity is data intensive, however, mass and energy45
balance, and thermodynamic principles can be utilized to identify, predict, and bridge the46
data gaps. Further, sophisticated system analysis tools based on efficient optimization,47
artificial intelligence (AI) algorithms, and methods for uncertainty analysis can provide a48
plausible option to address this Herculean task. This paper outlines the approach in following49
sections. Section2 describes the systems approach to green process design followed by50
Section3 on Industrial ecology leading to Section4 on overall Sustainability. Finally,51
Section5 concludes the paper with a summary.52
2. Green process design53
Process simulation is defined as the utilization of computer software resources to de-54
velop mathematical models for the construction of an accurate, representative model of55
a chemical process in order to understand its actual behavior during regular plant oper-56
ations. Steady state simulators like PRO-II, ASPEN Plus (Aspen tech, 2003a) are well57
known in this area and are extensively used for simulation of continuous chemical pro-58
cesses. Although batch process simulators are not yet reached the same maturity due to59
the complexities associated with the unsteady state and flexible nature of batch processing,60
they have become more sophisticated over the years (Aspen tech, 2003b; Shanklin et al.,61
2001; Diwekar, 1996). Chemical process industries have become aware of the importance62
of reducing waste and these industries are practicing the art of pollution prevention. These63
trends are also reflected in these simulation packages. In the past, process simulation was64
mainly concerned with the development of sophisticated unit operation blocks to predict65
accurate mass flows of principal components in a process. In recent years, environmen-66
tal consciousness and considerations in chemical process design and simulation demand67

UN
CO
RR
EC
TED
PR
OO
F
RECYCL 1735 1–21
U. Diwekar / Resources, Conservation and Recycling xxx (2005) xxx–xxx 3
an effort extending far beyond the capability of existing process simulators to model pro-68
cesses with environmental control options. For tracking of trace components and demands69
non-equilibrium based models are provided. Packages like the waste reduction algorithm70
(WAR) (EPA, 2002) provides data related to various environmental impacts like toxicity71
and exposure data and existing simulators are equipped with thermodynamic models to72
characterize the impacts (e.g. infinite dilution activity coefficients for solvent selection).73
Group contribution methods to facilitate molecular design level synthesis are also available74
now (Molecular Knowlege Systems, 1994, 1998). However, there is still a long way to at-75
tain the goal of sustainability. Recently,Anastas and Zimmerman (2003)presented twelve76
principles of green engineering to achieve sustainability through science and technology.77
For example, currently, environmentally friendly or “green” processes are designed based78
on concepts of process integration, which embodies a number of closely-related methodolo-79
gies for designing new processes and retrofitting existing ones by taking into consideration80
the performance of the entire process as a whole (Rossiter, 1994; Ei-Halwagi, 1997). The81
main advantage of process integration is that it is inherently “conservation oriented” and82
enhance the process performance by minimizing the use and/or maximizing the recovery of83
energy and materials. In addition to process integration, integrated environmental control84
strategies introduced in the early design stages of a process, rather than an end-of-pipe85
control option introduced in the later stages, have been shown to improve the technical and86
economic performance of a process. However, to attain sustainability one has to extend this87
framework beyond process integration and environmental control technologies. This means88
introducing green engineering principles as early as possible, and at all levels of engineering89
decision making. However, integrating all these principles at all levels is an onerous task.90
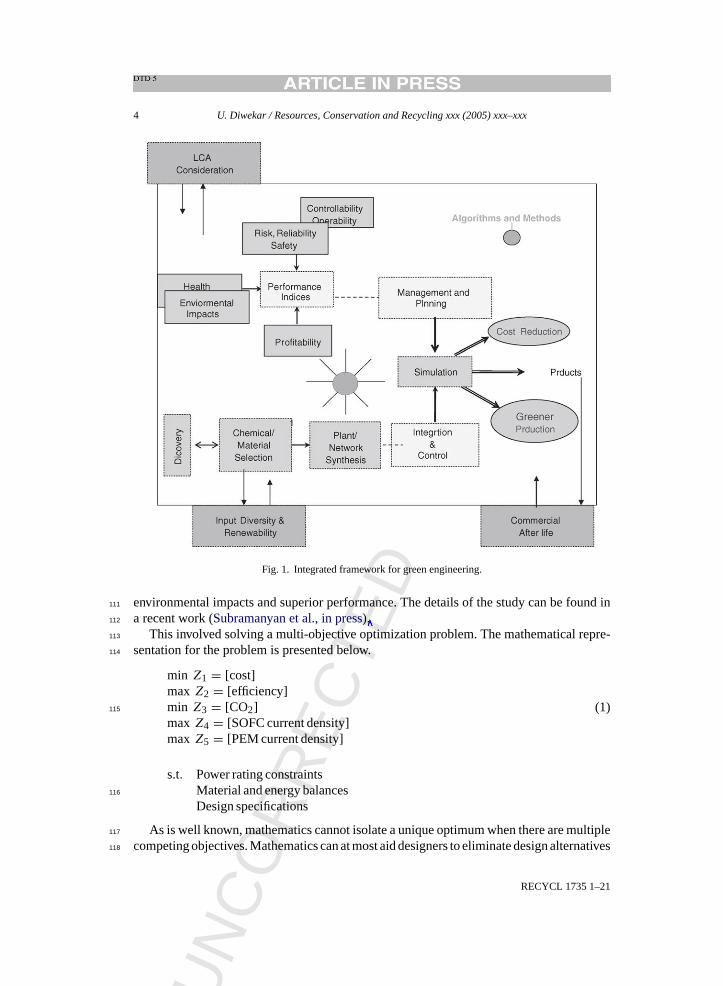
Fig. 1shows the integrated framework proposed by the author (Diwekar, 2003a) to include91
the green engineering principles at all stages. Unlike the traditional process design where92
engineers are looking for low cost options, environmental considerations include various93
objectives like the long term and short-term environmental and other impacts. This new94
framework includes decisions at all levels starting from the chemical or material selection95
to the process synthesis stages, to the management and planning stage, linked to the green96
objectives and goals shown on the top left left-hand corner of the figure.97
Fig. 1shows that the decision making is driven by objectives such as costs, environmental98
impacts, reliability etc. However, this requires the ability to model the phenomena and to99
include uncertainties in predicting the various objectives. This is particularly important for100
new environmental friendly technologies like the fuel cell technology for power generation.101
The next subsection presents the importance of uncertainty analysis in obtaining greener102
and environmentally friendly plants for energy generation.103
2.1. Multi-objective designs for a hybrid fuel cell power plant under uncertainty104
As the first step towards a multi-objective analysis for obtaining cleaner, efficient, cost-105
effective and greener electricity, a fuel cell hybrid plant design case study is presented here.106
The study, which is sponsored by the National Energy Technology Laboratories (NETL), is107
based on a hybrid fuel cell power plant system that uses both solid oxide fuel cells (SOFC)108
as well as polymer electrolyte fuel cells (PEM). The aim of case study is to illustrate the109
benefits of using the multi-objective optimization methods to obtain designs with minimum110
UN
CO
RR
EC
TED
PR
OO
F
RECYCL 1735 1–21
4 U. Diwekar / Resources, Conservation and Recycling xxx (2005) xxx–xxx
Fig. 1. Integrated framework for green engineering.
environmental impacts and superior performance. The details of the study can be found in111
a recent work (Subramanyan et al., in press).112
This involved solving a multi-objective optimization problem. The mathematical repre-113
sentation for the problem is presented below.114
min Z1 = [cost]max Z2 = [efficiency]min Z3 = [CO2]max Z4 = [SOFC current density]max Z5 = [PEM current density]
(1)115
s.t. Power rating constraintsMaterial and energy balancesDesign specifications
116
As is well known, mathematics cannot isolate a unique optimum when there are multiple117
competing objectives. Mathematics can at most aid designers to eliminate design alternatives118
professor
Cross-Out
professor
Inserted Text
2004).

UN
CO
RR
EC
TED
PR
OO
F
RECYCL 1735 1–21
U. Diwekar / Resources, Conservation and Recycling xxx (2005) xxx–xxx 5
dominated by others, leaving a number of alternatives in what is called the Pareto set (Hwang119
et al., 1980). Fig. 2a shows the Pareto optimal solutions for minimization of cost and CO2120
emissions, and efficiency maximization. It is clearly seen that the non-convex nature of the121
multi-objective optimization problem here results in regions of trade-offs, as well as regions122
of opportunities. For instance, the region around 0.35 kg/kWh CO2 emissions and 57%123
efficiency indicates costs around $1500–$1600 per kW. Immediately adjacent to the upper124
left of this region one can select plant designs with approximately 10% lower emissions,125
15% higher efficiency, and 30% lower costs. Furthermore, this approach helps identify the126
best technology, which will provide the smallest trade-offs between objectives. One such127
significant result is, for instance, the trade-offs between efficiency and cost in case of strict128
environmental regulations. Here, the decision maker can determine which alternative is the129
most suitable given current regulations and policies. Further, extending this study to cover a130
multitude of technologies and potential resources will allow the determination of the most131
promising renewable technologies for electricity generation. The results show that cost132
does not necessarily conflict with the environmental impacts all the time, and one can find133
optimal designs which will be both environmentally friendly and economically beneficial.134
However, these trade-offs are obtained using system level models developed in ASPEN135
Plus simulator. The question is, will these trade-offs change if models do not capture the136
complete physical phenomena?137
As stated earlier this technology is new and is at conceptual stage, therefore, we are138
considering the first type of uncertainties, i.e. uncertainties related to the modeling phenom-139
ena. Specially, we are concentrating on the two fuel cell models in this study. In general,140
an essential component (apart from the electrochemical reactions) of a fuel cell model is141
the current density characteristic of a particular fuel cell. The current density characteris-142
tic provides the voltage and current density profile, and is a function of fuel cell design.143
In this work, we have used the experimental data reported in the literature (Geisbrecht,144
2002) to characterize uncertainties in the current density characteristic. Once probability145
distributions are assigned to the uncertain parameters, the next step is to propagate the146
uncertainties and obtain stochastic multi-objective optimization trade-off surfaces.Fig. 2b147
shows such a surface for the same three objective functions shown earlier inFig. 2a. It can148
be seen that the modeling uncertainties have considerable effect on the objectives since149
the trade-off surfaces are markedly different. These uncertainties can be reduced if bet-150
ter models are used. However, obtaining the Pareto set for a highly nonlinear system like151
the hybrid fuel cell power plant is computationally very expensive even with simplified152
models used in this exercise. Inclusion of uncertainties results in many fold increased com-153
putational intensity. Therefore, it is necessary to have efficient methods, algorithms, and154
better computational power to address these problems. One such framework is described155
below.156
2.2. Algorithmic framework157
The algorithmic framework behind the integrated framework inFig. 1, is shown in the158
Fig. 3.159
Level 1, is the inner most level and corresponds to models for process simulation. This160
level defines all possible chemical and process alternatives for a particular process. Chem-161

UNCORRECTED PROOF
RE
CY
CL
17351–21
6U.D
iwekar/R
esource
s,Conserva
tionandRecyclin
gxxx
(2005)xxx–
xxx
Fig. 2. Pareto-optimal surface for SOFC-PEM hybrid fuel cell power plant: (a) deterministic, (b) stochastic.

UN
CO
RR
EC
TED
PR
OO
F
RECYCL 1735 1–21
U. Diwekar / Resources, Conservation and Recycling xxx (2005) xxx–xxx 7
Fig. 3. The algorithmic framework.
ical process simulators like ASPEN (Aspen tech, 2003a), MultiBatchDS (Diwekar, 1996),162
SuperPro (Shanklin et al., 2001) are useful for this innermost level modeling.163
Level 2, sampling loop: the diverse nature of uncertainty, such as estimation errors164
and process variations, can be specified in terms of probability distributions. The type165
of distribution chosen for an uncertain variable reflects the amount of information that166
is available. Once probability distributions are assigned to the uncertain parameters, the167
next step is to perform a sampling operation from the multi- variable uncertain parameter168
domain. Recently developed Hammersley sequence sampling (HSS) provides an efficient169
method for handling uncertainties in real world problems (Kalagnanam and Diwekar, 1997;170
Diwekar and Kalagnanam, 1997).171
Level 3, continuous optimizer: this step involves continuous decisions like design and172
operating conditions for a process. Derivative based quasi-Newton methods, where the173
gradient (i.e., Jacobian) is approximated based on differences in thex and f(x) obtained174
from previous iterations, are widely used in process optimization.175
Level 4, discrete optimizer: this involves dealing with discrete decisions such as chemical176
and process structural alternatives. This is the most difficult optimization step. New algo-177
rithms are designed by improving efficiency in this discrete optimization step (Diwekar,178
2003b; Kim and Diwekar, 2002).179
Level 5, multi-objective programming, MOP: this represents the outermost loop inFig. 3.180
A generalized multi-objective optimization problem can be formulated as follows:181
min Z = Zi, i = 1, . . . , p, p ≥ 2,
s.t. h(x, y) = 0,
g(x, y) ≤ 0,
(2)182

UN
CO
RR
EC
TED
PR
OO
F
RECYCL 1735 1–21
8 U. Diwekar / Resources, Conservation and Recycling xxx (2005) xxx–xxx
wherex andy are continuous and discrete decision variables, andp is the number of objec-183
tive functions like cost, and environmental impacts. The functionsh(x,y) andg(x,y) repre-184
sent equality and inequality constraints, respectively. There are a large array of analytical185
techniques to solve this MOP problem; however, the MOP methods are generally divided186
into two basic types: preference-based methods and generating methods. Preference-based187
methods like goal programming attempt to quantify the decision-maker’s preference, and188
with this information, the solution that best satisfies the decision-makers’s preference is189
then identified (Diwekar, 2003b). Generating methods, such as the weighting method and190
the constraint method, have been developed to find the exact Pareto set or an approximation191
of it. A new variant of constraint method that minimizes the number of single objective192
optimization problems (MINSOOP) to be solved can be used to obtain the Pareto set for193
green process designs (Fu and Diwekar, in press).194
As this framework is extended from process design to industrial ecology, data require-195
ments increases and so are uncertainties. A conceptual approach based on various physical196
and thermodynamic constraints, optimization and uncertainty analysis algorithms and arti-197
ficial intelligence method are presented below.198
3. Industrial ecology and industrial symbiosis199
Industrial ecology is the study of the flows of materials and energy in industrial and200
consumer activities, of the effects of these flows on the environment, and of the influences201
of economic, political, regulatory, and social factors on the use, transformation, and dis-202
position of resources (White, 1994). Industrial ecology applies the principles of material203
and energy balance, traditionally used by scientists and engineers to analyze well-defined204
ecological systems or industrial unit operations, to more complex systems of natural and205
human interaction. These systems can involve activities and resource utilization over scales206
ranging from single industrial plants to entire sectors, regions or economies. In so doing, the207
laws of conservation must consider a wide range of interacting economic, social, and envi-208
ronmental indicators. Furthermore, new methods and data are required for identifying the209
appropriate principles and laws of thermodynamics for these higher levels of aggregation210
(Ayres, 1995a,b).211
Fig. 4presents a conceptual framework for industrial ecology applied at different scales212
of spatial and economic organization, evaluating alternative management options using213
different types of information, tools for analysis, and criteria for performance evaluation214
(Diwekar and Small, 2002). As one moves from the small scale of a single unit operation or215
industrial production plant to the larger scales of an integrated industrial park, community,216
firm or sector, the available management options expand from simple changes in process217
operation and inputs to more complex resource management strategies, including integrated218
waste recycling and reuse options. Special focus has been placed on implementing the latter219
via industrial symbiosis, for example, through the pioneering work of integrating several220
industrial and municipal facilities in Kalundborg, Denmark (Ehrenfeld and Gertler, 1997).221
At the higher levels of spatial and economic organization, at national and global scales,222
management is implemented through the tools of regulation, economic incentives, taxation,223
trade policy, and international agreements.224
professor
Cross-Out
professor
Inserted Text
2004).

UN
CO
RR
EC
TED
PR
OO
F
RECYCL 1735 1–21
U. Diwekar / Resources, Conservation and Recycling xxx (2005) xxx–xxx 9
Fig. 4. Conceptual framework for industrial ecology.
To evaluate the full range of options illustrated in the framework shown inFig. 4apart225
from a multi-objective analysis (Chad and Allen, 1997), highly quantitative information226
on chemical properties, thermodynamic constants and constraints are needed, as are data227
relating to firm, sector, national and global resource utilization and conversion. Process228
simulators are based on mass and energy balance principles. They utilize thermodynamic229
models and data, and hence are ideally suited for imposing these constraints on the available230
data. However, the constraints and data involved are not restricted to mass and energy balance231
principles, and are available in various forms. For example, it is common practice to report232
undetectable quantities of emissions in terms of the detection limit (or least count) of the233
measuring instrument (specifying that the data may be less than or equal to the detection234

UN
CO
RR
EC
TED
PR
OO
F
RECYCL 1735 1–21
10 U. Diwekar / Resources, Conservation and Recycling xxx (2005) xxx–xxx
Table 1O(M) formalism and optimization constraints
O(M) relations Verbal explanation rL ≤ r ≤ rU Constraints
rL rU
r1: X1 �X2 X1 is much smaller thanX2 −∞ e X1/X2 − r1 = 0r2: X1 –<X2 X1 is moderately smaller thanX2 e 1/1 +e X1/X2 − r2 = 0r3: X1 ∼<X2 X1 is slightly smaller thanX2 1/1 +e 1 X1/X2 − r3 = 0r4: X1 =X2 X1 is exactly equal toX2 1 1 X1/X2 − r4 = 0r5: X1 >∼X2 X1 is slightly larger thanX2 1 1 +e X1/X2 − r5 = 0r6: X1 >–X2 X1 is moderately larger thanX2 1 +e 1/e X1/X2 − r6 = 0r7: X1 X2 X1 is much larger thanX2 1/e ∞ X1/X2 − r7 = 0
e is the engineering tolerance.
limit). Sometimes, the data are reported in the order-of-magnitude terms (e.g., refer to Case235
3 in (Ayres, 1995a), where the Benzo(a)pyrene content is reported to be much smaller236
than 0.0001). Furthermore, discrete, categorical information about the occurrence or non-237
occurrence of particular reactions, or the presence or absence of reaction byproducts, may238
be available.239
Given that knowledge is available in various forms (e.g., quantitative models for material240
and energy balances, order-of-magnitude information, qualitative information, and logical241
information), a unified framework that incorporates information of each type into its infer-242
ence is desirable. Optimization methods combined with artificial intelligence techniques, as243
proposed in (Kalagnanam and Diwekar, 1994), can provide such a framework. However, in244
order to describe this approach it is first necessary to choose a formal system which defines245
the syntax and the semantics for representing and reasoning with relative order of magnitude246
relations. The two main considerations for choosing a formalism is that it should provide247
an intuitive representation and should allow for sound and exact inferences. Here, we are248
using the O(M) formalism proposed by (Mavrovouniotis and Stephanopoulos, 1988). The249
optimization approach consists of first transforming the order of magnitude relations into250
a set of algebraic constraints (equality and inequality) as shown inTable 1and then an251
optimization problem is solved for inference. Unlike numerical methods for solving equa-252
tions (equality constraints), optimization methods can handle both equality and inequality253
conditions and hence can be used to make inferences from data in various forms.254
4. Sustainability255
One of the major problems in including industrial ecological concepts in design is the256
problem of uncertainties and defining broader metrics of overall resource use, global en-257
vironmental and economical impacts. The topic of sutainability goes beyond industrial258
ecology and is, perhaps, operationally and conceptually one of the most complex that mod-259
ern science has faced as it involves socio-economic interactions and its effect on the overall260
ecosystem.Fig. 5 presents the extension of framework from process design, to industrial261
ecology leading to socio-economic sustainability. At the center of this new framework is the262
green chemical plant engineered with clean products, clean processes, and green energy, and263

UN
CO
RR
EC
TED
PR
OO
F
RECYCL 1735 1–21
U. Diwekar / Resources, Conservation and Recycling xxx (2005) xxx–xxx 11
Fig. 5. From green engineering to industrial ecology to sustainability.
eco-friendly management and planning as described inFig. 1. The decision making is then264
extended to industrial symbiosis and industrial ecology, time-dependent socio-economic265
policies and together their effect on ecological systems leading to long term sustainability266
of the planet. However, it is necessary to provide a metric for sustainability that can address267
the cross disciplinary nature of sustainability involving human interactions with ecosystem.268
Fath and Cabezas (2002)have invoked the concept of information in its mathematical form269
as the centerpiece for their research work. The reason is that essentially any type of data or270
model can be converted to information regardless of disciplinary origin. Information can,271
therefore, serve as a common interdisciplinary bridge. They also hypothesized that infor-272
mation theory can serve as an appropriate basis for the construction of a basic theory of273
sustainability. The following brief paragraphs introduce Fisher information (FI) and their274
approach to a metric for sustainability.275
The work ofFisher (1922)introduced a statistical measure of indeterminacy now called276
Fisher information. Fisher information can be interpreted as a measure of the ability to277
estimate a parameter, as the amount of information that can be extracted from a set of278
measurements, and also as a measure of the state of disorder of a system or phenomenon279
(Frieden, 1998). It is the later interpretation that has the most relevance to issues of sustain-280
ability. Fisher information, I, for one variable is calculated as follows:281
FI =∫
1
p(x)
(dp(x)
dx
)2
dx (3)282
which can be extended to an-dimensional system. For physical systems, entropy follows283
the second law of thermodynamics, increasing monotonically with time. Conversely, Fisher284
information decreases with time as entropy (system disorder) increase. Ecological (and285

UN
CO
RR
EC
TED
PR
OO
F
RECYCL 1735 1–21
12 U. Diwekar / Resources, Conservation and Recycling xxx (2005) xxx–xxx
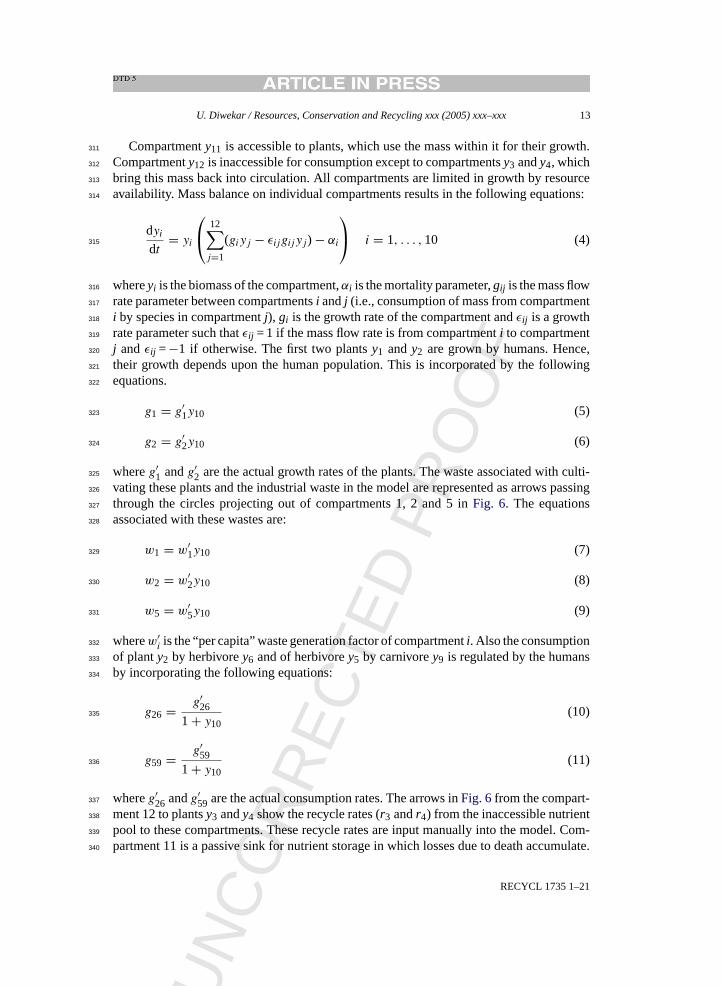
Fig. 6. Twelve compartment food web Model. Arrows indicate the direction of biomass.
perhaps sociological) systems, however, are able to create local order by utilizing energy286
flows through their self-organizing properties. This leads to the sustainability hypothesis287
proposed byFath and Cabezas (2002).288
The sustainability hypothesis states that: the time-averaged Fisher information of a sys-289
tem in a persistent regime does not change with time. The idea is that a change in regime290
will be manifest as a change in Fisher information. Note, this does not mean that changes291
that do not lead to a regime shift will not show up as changes in Fisher information.292
However this hypothesis (this objective) involves dealing with various time scales293
and time dependent uncertainties which require appropriately modeling, and the solution294
methodology requires further development for arriving at decision domains.295
4.1. A simple ecological model296
Fig. 5shows that in order to attain sustainability, one has to study the effect of various297
decisions from plant level to industrial sector to ecological level. Food web models is one298
way of studying the effect of waste on dynamics of the eco-systems. In order to study the299
sustainability hypothesis defined by the Fisher information, Cabezas and co-workers (Fath300
et al., 2003) used a simple food web model. In this work, the same model is used to show301
how human interventions like the change in mortality rates due to scientific advances, can302
perturb the dynamics of system. For more details, please refer toDuggempudi and Diwekar303
(2003).304
The food web model consists of twelve compartments (Fig. 6):305
1. Four primary producers i.e., plants (y1–y4).306
2. Three herbivores (y5–y7).307
3. Two carnivores (y8, y9).308
4. An omnivore i.e., human (y10).309
5. Two nutrient compartments (y11 andy12).310
UN
CO
RR
EC
TED
PR
OO
F
RECYCL 1735 1–21
U. Diwekar / Resources, Conservation and Recycling xxx (2005) xxx–xxx 13
Compartmenty11 is accessible to plants, which use the mass within it for their growth.311
Compartmenty12 is inaccessible for consumption except to compartmentsy3 andy4, which312
bring this mass back into circulation. All compartments are limited in growth by resource313
availability. Mass balance on individual compartments results in the following equations:314
dyi
dt= yi
12∑j=1
(giyj − εijgijyj) − αi
i = 1, . . . , 10 (4)315
whereyi is the biomass of the compartment,αi is the mortality parameter,gij is the mass flow316
rate parameter between compartmentsi andj (i.e., consumption of mass from compartment317
i by species in compartmentj), gi is the growth rate of the compartment andεij is a growth318
rate parameter such thatεij = 1 if the mass flow rate is from compartmenti to compartment319
j andεij =−1 if otherwise. The first two plantsy1 andy2 are grown by humans. Hence,320
their growth depends upon the human population. This is incorporated by the following321
equations.322
g1 = g′1y10 (5)323
g2 = g′2y10 (6)324
whereg′1 andg′
2 are the actual growth rates of the plants. The waste associated with culti-325
vating these plants and the industrial waste in the model are represented as arrows passing326
through the circles projecting out of compartments 1, 2 and 5 inFig. 6. The equations327
associated with these wastes are:328
w1 = w′1y10 (7)329
w2 = w′2y10 (8)330
w5 = w′5y10 (9)331
wherew′i is the “per capita” waste generation factor of compartmenti. Also the consumption332
of planty2 by herbivorey6 and of herbivorey5 by carnivorey9 is regulated by the humans333
by incorporating the following equations:334
g26 = g′26
1 + y10(10)335
g59 = g′59
1 + y10(11)336
whereg′26 andg′
59 are the actual consumption rates. The arrows inFig. 6from the compart-337
ment 12 to plantsy3 andy4 show the recycle rates (r3 andr4) from the inaccessible nutrient338
pool to these compartments. These recycle rates are input manually into the model. Com-339
partment 11 is a passive sink for nutrient storage in which losses due to death accumulate.340
UN
CO
RR
EC
TED
PR
OO
F
RECYCL 1735 1–21
14 U. Diwekar / Resources, Conservation and Recycling xxx (2005) xxx–xxx
Plants utilize this mass for growth, giving:341
dy11
dt=
12∑j=1
(αjyj) − y11
j=4∑j=1
gjyj −∑
i=1,2,5
wi
(12)342
wherewi is the waste factor of the compartmenti. Compartment 12 is an inaccessible343
nutrient pool that acts as a sink for waste generated by humans (y10) and the waste is344
involved in cultivation. Mass iny12 is re-introduced into the system by plantsy4 andy3 in345
proportion to the mass in these compartments, with a low flow back toy11 representing long346
term recycling process:347
dy12
dt=g12y10 + y11
∑i=1,2,5
wi
y12(r4y4 + r3y3 + α12
(13)348
It has been assumed that all the four primary producers i.e., plants, are subject to sinu-349
soidal forcing function to represent seasonal variation in growth due to solar incidence. The350
forcing function used in the model is:351
gi = gi
[1 + 1
3sin
(2πt
500− π
2
)2]
i = 1, 2, 3, 4. (14)352
Using the above differential equations and taking the time period of integration as353
T= 0–1000 the Fisher information of the model is calculated by:354
FI = 1
T
∫ T
0
(a(t)2
v(t)4
)dt (15)355
wherev(t) anda(t) are the speed and acceleration of the system, respectively. These values356
are obtained from the 12 system variables by:357
v(t) =√√√√i=12∑
i=1
(dyi
dt
)2
(16)358
a(t) = 1
vt
[i=12∑i=1
dyi
dt
d2yi
dt2
]. (17)359
The model presented above is a deterministic model. However, a number of parameters360
in this model are prone to uncertainties. For example, it is a well-known fact that human361
mortality rates have changed over time due to breakthroughs in medicines and other scientific362
activities. Is it possible to model this time dependent uncertainties?363
4.2. Modeling time dependent uncertainties364
It is a common practice to use probability distribution functions like normal, lognormal,365
uniform distributions, to model uncertainties as shown in the earlier algorithmic framework.366

UN
CO
RR
EC
TED
PR
OO
F
RECYCL 1735 1–21
U. Diwekar / Resources, Conservation and Recycling xxx (2005) xxx–xxx 15
However, these distributions are used for scalar parameter uncertainties. Modeling dynamic367
or time-dependent uncertainties is a difficult task. Recently,Diwekar (2003b)presented368
basic concepts for modeling time dependent uncertainties. These concepts are derived from369
the financial and economics literature where time dependent uncertainties dominate. The370
following paragraphs present these concepts briefly. This is followed by a subsection that371
uses analogy between stock prices and human mortality rate to develop models for time-372
dependent uncertainties in the rate of human mortality (Duggempudi and Diwekar, 2003).373
4.2.1. Stochastic processes374
A stochastic process is a variable that evolves over time in an uncertain way. One of the375
simplest examples of a stochastic process is the random walk process. The Wiener process or376
also called a Brownian motion is a continuous limit of the random walk and is a continuous377
time stochastic process. A Wiener process can be used as a building block to model an378
extremely broad range of variables that vary continuously and stochastically through time.379
For example, consider the price of a technology stock. It fluctuates randomly, but over a380
long time period has had a positive expected rate of growth that compensates investors for381
risk in holding the stock. Can the stock price be represented as a Wiener process? A Wiener382
process has three important properties:383
1. It satisfies the Markov property. The probability distribution for all future values of the384
process depends only on its current value. Stock prices can be modelled as Markov385
processes, on the grounds that public information is quickly incorporated in the current386
price of the stock and past pattern has no forecasting value.387
2. It has independent increments. The probability distribution for the change in the process388
over any time interval is independent of any other time interval (non-overlapping).389
3. Changes in the process over any finite interval of time are normally distributed, with a390
variance that increases linearly with the time interval.391
4.2.2. Human mortality rate: an Ito process392
What is common between the technology stock price example and the uncertainty in the393
mortality rate parameter in the above discussed ecological model?394
1. Both have time dependent variations. The technology stock fluctuates around the mean395
randomly, but over a long haul has a positive expected rate of growth. Mortality rates396
(from 1959 to 1999) on the other hand do not seem to show any trend but seem to fluctuate397
around a geometric mean as seen fromFig. 7. These mortality rates of human beings in the398
United States was collected from the years 1959 to 1999 from [http://www.mortality.org].399
2. Similar to the stock prices, mortality rate can be modelled as a Markov process as at any400
time period. The changes for both are non-overlapping.401
Hence, let us now assume that the behavior of the mortality rates with respect to time can402
be represented as a geometric mean reversion process (special instance of an Ito process),403
that is,404
dα = η(α − α)dt + σαdz (18)405
UN
CO
RR
EC
TED
PR
OO
F
RECYCL 1735 1–21
16 U. Diwekar / Resources, Conservation and Recycling xxx (2005) xxx–xxx
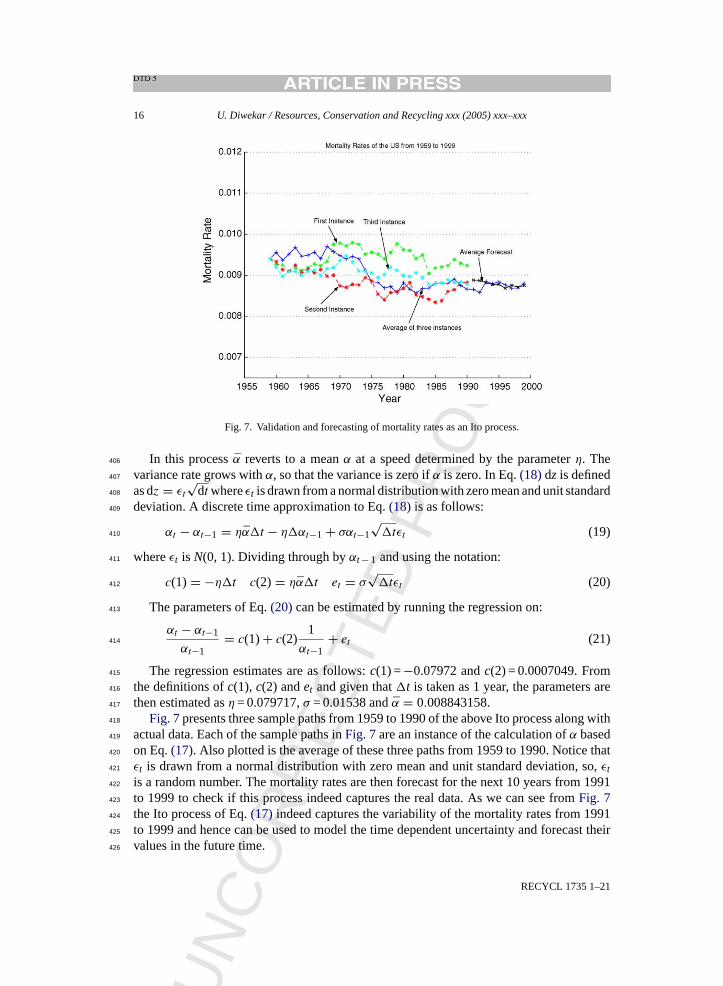
Fig. 7. Validation and forecasting of mortality rates as an Ito process.
In this processα reverts to a meanα at a speed determined by the parameterη. The406
variance rate grows withα, so that the variance is zero ifα is zero. In Eq.(18)dz is defined407
as dz = εt
√dt whereεt is drawn from a normal distribution with zero mean and unit standard408
deviation. A discrete time approximation to Eq.(18) is as follows:409
αt − αt−1 = ηα�t − η�αt−1 + σαt−1√
�tεt (19)410
whereεt isN(0, 1). Dividing through byαt− 1 and using the notation:411
c(1) = −η�t c(2) = ηα�t et = σ√
�tεt (20)412
The parameters of Eq.(20)can be estimated by running the regression on:413
αt − αt−1
αt−1= c(1) + c(2)
1
αt−1+ et (21)414
The regression estimates are as follows:c(1) =−0.07972 andc(2) = 0.0007049. From415
the definitions ofc(1), c(2) andet and given that�t is taken as 1 year, the parameters are416
then estimated asη = 0.079717,σ = 0.01538 andα = 0.008843158.417
Fig. 7presents three sample paths from 1959 to 1990 of the above Ito process along with418
actual data. Each of the sample paths inFig. 7are an instance of the calculation ofα based419
on Eq.(17). Also plotted is the average of these three paths from 1959 to 1990. Notice that420
εt is drawn from a normal distribution with zero mean and unit standard deviation, so,εt421
is a random number. The mortality rates are then forecast for the next 10 years from 1991422
to 1999 to check if this process indeed captures the real data. As we can see fromFig. 7423
the Ito process of Eq.(17) indeed captures the variability of the mortality rates from 1991424
to 1999 and hence can be used to model the time dependent uncertainty and forecast their425
values in the future time.426

UN
CO
RR
EC
TED
PR
OO
F
RECYCL 1735 1–21
U. Diwekar / Resources, Conservation and Recycling xxx (2005) xxx–xxx 17
4.3. Model revisited427
The base case model for this problem presented earlier was deterministic in nature.428
The base case plot of Fisher information against the time over which it is integrated is429
shown in theFig. 8. The Variance in the Fisher information, as can be seen from the430
Fig. 8, is found to be negligible showing a sustainable system. This is confirmed by the431
food web dynamics of the model with the masses of all the compartments as shown in the432
Fig. 9.433
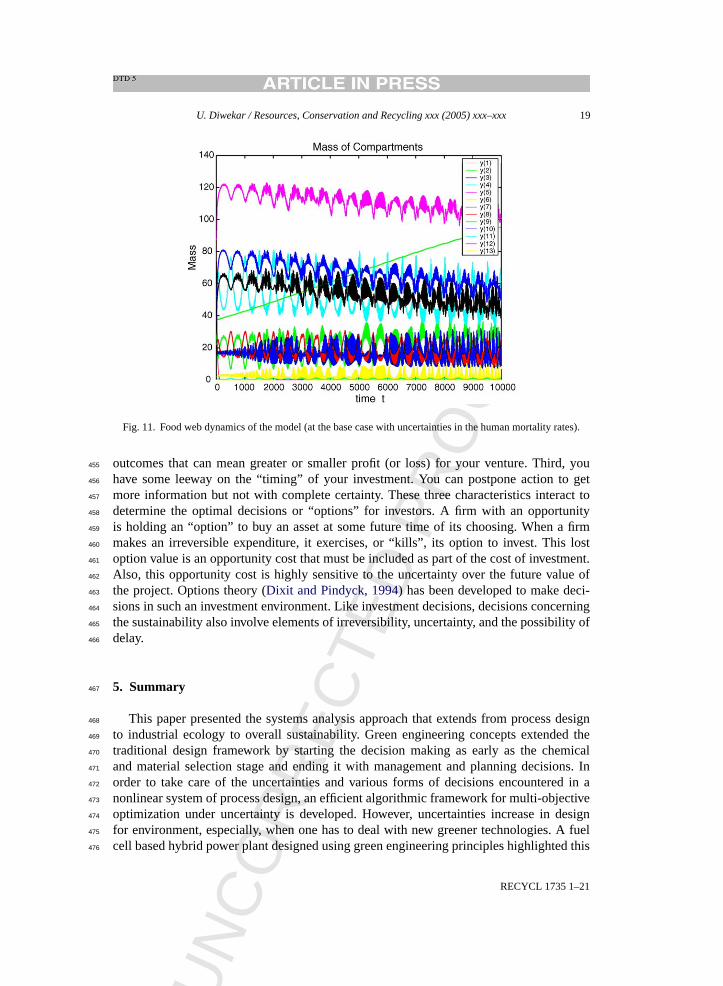
Now the time dependent uncertainties in the mortality rates were included in the model434
and the variance was calculated against the base case mean value of 0.1201.Fig. 10shows435
the average Fisher information at each time step against the time. The variance in the Fisher436
information is computed to be 1.3018106. This value is very high compared to the base437
case value, which shows that the uncertainties in the model parameters indeed increase438
the variance of the Fisher information. The food web dynamics of the model with uncer-439
tainties is shown in theFig. 11. Notice from the dynamics of the model that even though440
we expect the human population to increase over time, the humans are indeed decreas-441
ing. This is because the food (or biomass) available for the humans for consumption is442
decreasing over time which decreases their population. Also seen is the tremendous in-443
crease in the population of the carnivorey9. This decrease in the human population and444
increase in carnivore population is not favorable for the system. The system hence be-445
comes unsustainable, and so the variance in the Fisher information increases. This sug-446
gest change in decision making or regulating some of the decisions. Optimization and447
optimal control methods can help in finding optimal regulations so as to offset these dis-448
turbances using stochastic dynamic programming. One can derive further from the real449
Fig. 8. Base case Fisher information plot.

UN
CO
RR
EC
TED
PR
OO
F
RECYCL 1735 1–21
18 U. Diwekar / Resources, Conservation and Recycling xxx (2005) xxx–xxx
Fig. 9. Food web dynamics of the model at the base case.
options theory from finance. Most investment decisions share, to varying degrees, three450
important characteristics. First, the investment is partially or completely “irreversible”. In451
other words, the initial cost of investment is at least partially “sunk”; you cannot recover452
it all should you change your mind. Second, there is “uncertainty” over the future rewards453
from the investment. The best you can do is to assess the probabilities of the alternative454
Fig. 10. Average Fisher information (at each time step when the uncertainties in the mortality rates are included).
UN
CO
RR
EC
TED
PR
OO
F
RECYCL 1735 1–21
U. Diwekar / Resources, Conservation and Recycling xxx (2005) xxx–xxx 19
Fig. 11. Food web dynamics of the model (at the base case with uncertainties in the human mortality rates).
outcomes that can mean greater or smaller profit (or loss) for your venture. Third, you455
have some leeway on the “timing” of your investment. You can postpone action to get456
more information but not with complete certainty. These three characteristics interact to457
determine the optimal decisions or “options” for investors. A firm with an opportunity458
is holding an “option” to buy an asset at some future time of its choosing. When a firm459
makes an irreversible expenditure, it exercises, or “kills”, its option to invest. This lost460
option value is an opportunity cost that must be included as part of the cost of investment.461
Also, this opportunity cost is highly sensitive to the uncertainty over the future value of462
the project. Options theory (Dixit and Pindyck, 1994) has been developed to make deci-463
sions in such an investment environment. Like investment decisions, decisions concerning464
the sustainability also involve elements of irreversibility, uncertainty, and the possibility of465
delay.466
5. Summary467
This paper presented the systems analysis approach that extends from process design468
to industrial ecology to overall sustainability. Green engineering concepts extended the469
traditional design framework by starting the decision making as early as the chemical470
and material selection stage and ending it with management and planning decisions. In471
order to take care of the uncertainties and various forms of decisions encountered in a472
nonlinear system of process design, an efficient algorithmic framework for multi-objective473
optimization under uncertainty is developed. However, uncertainties increase in design474
for environment, especially, when one has to deal with new greener technologies. A fuel475
cell based hybrid power plant designed using green engineering principles highlighted this476

UN
CO
RR
EC
TED
PR
OO
F
RECYCL 1735 1–21
20 U. Diwekar / Resources, Conservation and Recycling xxx (2005) xxx–xxx
aspect. Industrial ecology is the next step to process design where this decision making477
changes from the small scale of a single unit operation or industrial production plant to the478
larger scales of an integrated industrial park, community, firm or sector, and the available479
management options expand from simple changes in process operation and inputs to more480
complex resource management strategies, including integrated waste recycling and reuse481
options. Uncertainties increase in industrial ecology due to data unavailability and various482
level of model aggregation. Here, methods for handling various forms of knowledge are483
useful. The concept of overall sustainability goes beyond industrial ecology and brings in484
time dependent nature of the ecosystem. Time dependent uncertainties and short to long term485
decisions in the face of uncertainties makes decision making complicated. Further, with this486
interdisciplinary aspect of system requires a different matric for evaluating sustainability.487
Recently developed sustainability theory based on Fisher information can provide a viable488
multi-disciplinary metric. Time dependent uncertainties and forecasting the decision is a489
common practice in finance. Therefore, theories from finance literature along with optimal490
control and optimization algorithms can help in addressing this problem. A simple ecological491
case study illustrated this concept.492
References493
Aspen tech, 2003a. AspenTech. Aspen Plus 12.1 User Guide. Cambridge, MA: AspenTech; 2003.494
Aspen tech, 2003b. AspenTech. Batch Plus 12.1 User Guide. Cambridge, MA: AspenTech; 2003.495
Ayres R. Life cycle analysis: a critique. Resource Conserv Recycl 1995a;14:199.496
Ayres R. Thermodynamics and process analysis for future economic scenarios. J Environ Resource Econ497
1995b;6:207.498
Anastas PT, Zimmerman JB. Design through the 12 principles of green engineering. Environ Sci Technol499
2003;37(5):95–101.500
Chad D, Allen D. Minimizing chlorine use: assessing the trade-o.s. between cost and chlorine use in chemical501
manufacturing. J Ind Ecol 1997;1(2):111–34.502
Diwekar U. Understanding batch distillation process principles with multibatchds. Comput Appl Chem Eng Educ503
1996;4(4):275–84.504
Diwekar U. Greener by design. Environ Sci Technol 2003a;37:5432–44 [Invited paperdkjdot].505
Diwekar U. Introduction to Applied Optimization. Dordrecht: Kluwer Academic Publishers; 2003b.506
Diwekar U, Kalagnanam JR. Efficiency sampling technique for optimization under uncertainty. AIChE J507
1997;43(2):440–7.508
Diwekar U, Small M. Process analysis approach to industrial ecology. In: Ayres, Ayres, editors. A handbook of509
industrial ecology. UK: Edward Elgar; 2002. p. 115–37.510
Dixit A, Pindyck R. Investment under uncertainty. Princeton, NJ: Princeton University Press; 1994.511
J. Duggempudi, U. Diwekar 2003. Sustainability, options theory, and off-line quality control. In Sustainability and512
Life Cycle Topical Conference, San Francisco, CA: AIChE National Meeting; 2003. p. 155C.513
Ehrenfeld J, Gertler. Industrial ecology in practice: the evolution of interdependence at kalundborg. J Ind Ecol514
1997;1(1):67.515
EPA. WAste Reduction (WAR) Algorithm Graphical User Interface, Version 1.0. ORD, US EPA; November, 2002.516
Fath B, Cabezas H. Towards a theory of sustainable systems. Fluid Phase Equil 2002;2:194–7.517
Fath B, Cabezas H, Pawlowski C. Regime changes in ecological systems: an information theory approach. J Theor518
Biol 2003;222(4):517–30.519
R. Fisher. Phil Trans Royal Soc Lond 1922;222:309.520
Frieden B. Physics from Fisher information: a unification. Cambridge, United Kingdom: Cambridge University521
Press; 1998.522
Y. Fu, U. Diwekar. An efficient sampling approach to multi-objective optimisation, Ann Operat Res, in press.523
professor
Cross-Out
professor
Inserted Text
2004;132:109.

UN
CO
RR
EC
TED
PR
OO
F
RECYCL 1735 1–21
U. Diwekar / Resources, Conservation and Recycling xxx (2005) xxx–xxx 21
R. Geisbrecht, 2002. Theory based process modeling for evaluation of fuel cells in advanced energy systems.524
Topical conference on Fuel Cells Power Systems. New Orleans, LA: AIChE Spring National Meeting, 2002.525
Ei-Halwagi MM. Pollution prevention through process integration: systematic design tools. San Diego, CA:526
Academic Press; 1997.527
Hwang CL, Paidy SR, Masud ASM. Mathematical programming with multiple objectives: a tutorial. Comput528
Operat Res 1980;7:5–31.529
Kalagnanam J, Diwekar U. An optimization approach to order of magnitude reasoning. AI Eng Des 1994;8:207.530
Kalagnanam JR, Diwekar U. An efficient sampling technique for off-line quality control. Technometrics531
1997;39(3):308–19.532
Kim K-J, Diwekar U. Hammersley stochastic annealing: Efficiency improvement for combinatorial optimization533
under uncertainty. IIE Trans Operat Eng 2002;34(9):761–78.534
Mavrovouniotis M, Stephanopoulos G. Formal order-of-magnitude reasoning in process engineering. Comput535
Chem Eng 1988;12:867–80.536
Molecular Knowlege Systems. Synapse Designer’s Guide. Cambridge, MA: Molecular Knowledge Systems, Inc.,537
1994.538
Molecular Knowlege Systems. Cranium User’s Guide. Cambridge, MA: Molecular Knowledge Systems, Inc.,539
1998.540
Rossiter A. Process integration and pollution prevention. In: Ei-Halwagi M, Petrides D, editors. Pollution pre-541
vention via process and product modifications. New York, NY: American Institute of Chemical Engineers;542
1994.543
Shanklin T, Roper K, Yegneswaran PK, Marten M. Selection of bioprocess simulation software for industrial544
applications. Biotechnol Bioeng 2001;72(4):483–9.545
K. Subramanyan, U. Diwekar, A. Goyal. Multi-objective optimization for hybrid fuel cells power system under546
uncertainty. J Power Sources, in press.547
White A. Preface. In: The greening of industrial ecosystems. Washington, DC: National Academy of Engineers,548
National Academy Press; 1994.549
professor
Cross-Out
professor
Inserted Text
2004; 132:99.