Green Mountain Care Board
59
INTELLIGENCE THAT WORKS THINKBRG.COM INTELLIGENCE THAT WORKS Green Mountain Care Board: VT Hospital Quality Review and Capacity Planning in Preparation for Value-Based Care October 27, 2021
Transcript of Green Mountain Care Board

I N TE L L I G E N C E TH AT W O R K S
THINKBRG.COM
I N T E L L I G E N C E T H AT W O R K S
Green Mountain Care Board:VT Hospital Quality Review and Capacity Planning in Preparation for Value-Based Care
October 27, 2021

I N TE L L I G E N C E TH AT W O R K S
Agenda
• Motivation/Background
• Key Findings from Data Analysis: Capacity & Quality
• Reimagining Care Delivery to Address Capacity & Quality Opportunities
• Methodology/Criteria
• Opportunities

I N TE L L I G E N C E TH AT W O R K S
THINKBRG.COM
I N T E L L I G E N C E T H AT W O R K S
Motivation/Background
I N TE L L I G E N C E TH AT W O R K S
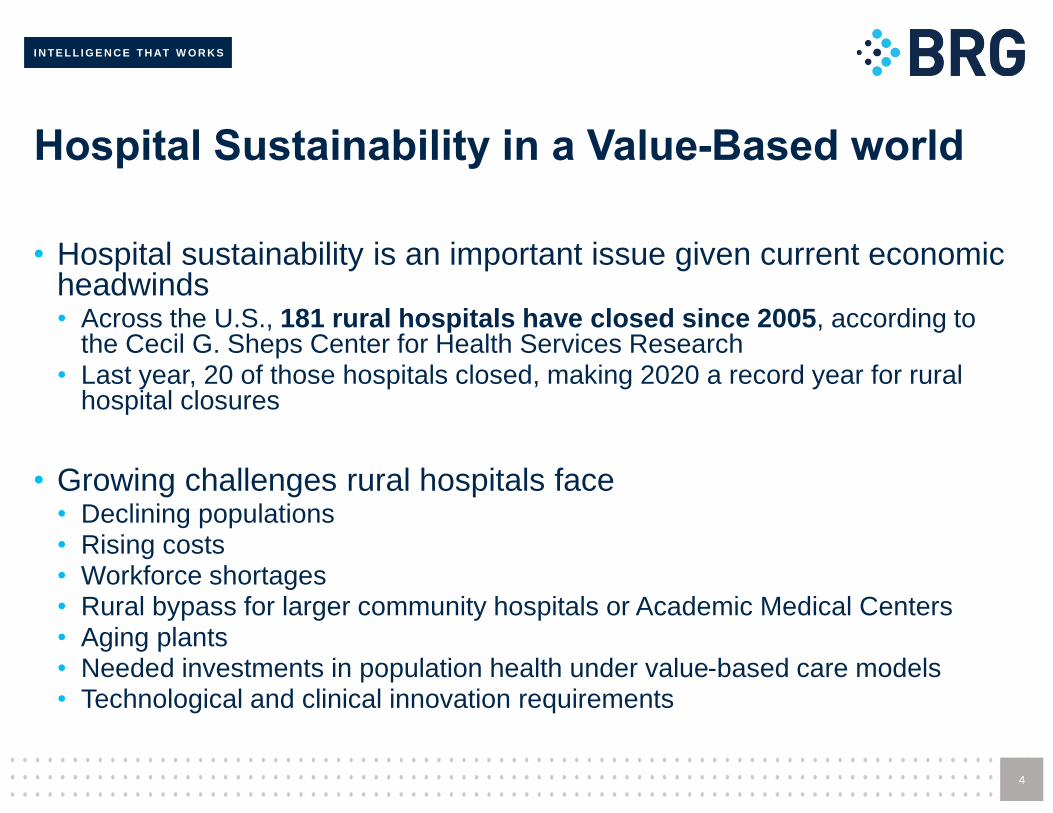
Hospital Sustainability in a Value-Based world
• Hospital sustainability is an important issue given current economic headwinds • Across the U.S., 181 rural hospitals have closed since 2005, according to
the Cecil G. Sheps Center for Health Services Research• Last year, 20 of those hospitals closed, making 2020 a record year for rural
hospital closures
• Growing challenges rural hospitals face• Declining populations• Rising costs• Workforce shortages• Rural bypass for larger community hospitals or Academic Medical Centers• Aging plants• Needed investments in population health under value-based care models• Technological and clinical innovation requirements
4

I N TE L L I G E N C E TH AT W O R K S
Sustainability
• Vermont hospitals have seen erosion in operating margins prior to the COVID-19 pandemic
• Value-based care initiatives must be balanced with access to care for patients across the state
• Within existing facilities
• Through alternative methods that provide access to quality care
5

I N TE L L I G E N C E TH AT W O R K S
Transitioning to Value-Based Care
• Hospitals will increasingly be held accountable for the cost and quality of care being provided
• This accountability may also be extended to the communities served by the hospital, not just those patients admitted to the facility
• In value-based payment models, excess hospital capacity can lead to unnecessary costs being locked into the system and low volume programs have the potential to provide lower quality of care.
• Potential excess capacity needs to be balanced to ensure appropriate access to care.
• Poor quality outcomes impact population health, potentially threatening reimbursements and compromising financial sustainability.
6

I N TE L L I G E N C E TH AT W O R K S
Why Value-Based Care?
• In a recent article from the Centers for Medicare and Medicaid Services
(CMS) Administrator and the Director of the Center for Medicare and
Medicaid Innovation (CMMI), CMS listed their priorities going forward:
• Drive accountable care
• Advance health equity
• Support innovation
• Address affordability
• Partner to achieve system transformation.
• In addition, commercial payers continue to move payments away from
fee-for-services into value-based models, including Accountable Care
Organizations, Bundled Payments, and increasing amounts of financial
and clinical risk for participating providers
7
All supportive of
driving value-
based payment
models

I N TE L L I G E N C E TH AT W O R K S
8
Key Findings from Data Analysis: Capacity & Quality

I N TE L L I G E N C E TH AT W O R K S
Factors in the Analysis
• BRG’s analysis focused on CY 2019
• Although COVID-19 has caused changes to the healthcare delivery system and patient use patterns, it is unclear how many of these trends are temporary vs permanent.
• Due to this ambiguity, BRG believes that utilizing CY 2019 is a reasonable approach when considering longer-term capacity needs.
• As part of the analysis, BRG did not have insight into the following factors that could potentially impact the conclusions:
• Clinical delivery model innovations occurring across providers and communities
• Strategic planning efforts of Vermont’s hospitals
• Specific state policies that may have an impact on current hospital capacity and future planning efforts
• The considerations highlighted in this presentation are intended to provoke robust discussion within the Vermont provider community regarding future needs, resources, and facility disposition. Additional discussion and analysis by Vermont policy makers will be required before any definitive decisions are made.
9

I N TE L L I G E N C E TH AT W O R K S
10
Key Findings – Emergency Department Use
Data Source: VUHDDS Research File
Note: Excluded Neonatal and Newborn
2019 Vermont Inpatient Discharges
ER Admit Non ER Admit Total %
Hospital Service Area Discharges Discharges Discharges ER Admit
Barre 3,456 1,717 5,173 66.81%
Bennington 2,209 648 2,857 77.32%
Brattleboro 1,045 476 1,521 68.70%
Burlington 7,825 4,348 12,173 64.28%
Middlebury 1,149 922 2,071 55.48%
Morrisville 1,032 873 1,905 54.17%
Newport 992 675 1,667 59.51%
Randolph 739 398 1,137 65.00%
Rutland 4,648 1,571 6,219 74.74%
Springfield 988 435 1,423 69.43%
St. Albans 2,139 1,559 3,698 57.84%
St. Johnsbury 816 494 1,310 62.29%
White River Jct 418 498 916 45.63%
Total: 27,456 14,614 42,070 65.26%
• The emergency room
continues to be the
source for more than
60% of acute care
volume at both critical
access hospitals (CAH)
and at general
community hospitals
• This represents a
potential opportunity for
improvement to the
degree that this care is
potentially avoidable or
could be treated in a
lower cost setting

I N TE L L I G E N C E TH AT W O R K S
Key Findings – Occupancy Rates
11
• BRG determined that overall occupancy rates for Vermont hospitals have remained relatively stable, but several Vermont hospitals are operating around <40% occupancy
• Brattleboro
• Northwestern
• Southwestern
• Springfield
• While the overall occupancy rate for Vermont’s CAHs (64.5%) is above the national average (33.2%), there is still excess bed capacity at individual Vermont CAHs.
• Low occupancy rates may decrease efficiency and increase costs.

I N TE L L I G E N C E TH AT W O R K S
Key Findings – Hospital Service Areas
12
• Of the total 42,000 admissions for Vermont residents, approximately 77% of admissions were served within-HSA and 23% of admissions were served outside the HSA
• Nearly a quarter of the patients admitted bypassed the hospital within their HSA.

I N TE L L I G E N C E TH AT W O R K S
Key Findings –Population-Driven Bed Need: Year 2026
• While the overall population is projected to decline, the elderly population is projected to increase by 2.6% per year. As a result, total discharges are projected to increase from approximately 48,000 to 51,000 discharges.
• Assuming stable discharge rates and stable length of stay across all Vermont residents, the total number of occupied beds will increase from a census of 676 to 719(+ 43 occupied beds).
• This projection assumes that outmigration of Vermont residents to out-of-state hospitals will continue at the same level as in CY2019.
• This projection also assumes that inmigration will continue to account for 6,220 total discharges at Vermont hospitals.
13
2019 Actual 2026 Projection
Age 0-64 Age 65+ Total Age 0-64 Age 65+ Total
POPULATION
Estimated population 501,596 121,441 623,038 477,982 143,506 621,488
% Change, 2019-2026 -4.7% 18.17% -0.25%
VERMONT RESIDENTS
Discharges per 1,000 42.32 171.61 67.52
# Discharges, Vermont Residents 21,230 20,840 42,070 20,235 24,723 44,958
Average length of stay 4.94 5.17 5.06 4.95 5.20 5.09
# Patient days 104,966 107,797 212,763 100,262 128,503 228,765
Average daily census, VT 288 295 583 275 352 627
NON-VERMONT VOLUME
# Discharges, Non-Vermont 3,321 2,899 6,220 3,321 2,899 6,220
Average length of stay 5.36 5.52 5.44 5.36 5.52 5.44
# Patient days 17,797 16,013 33,810 17,797 16,013 33,810
Average daily census, Non-VT 49 44 93 49 44 93
TOTAL HOSPITAL VOLUME
# Discharges 24,551 23,739 48,290 23,556 27,622 51,178
Average length of stay 5.00 5.22 5.11 5.01 5.23 5.13
# Patient days 122,763 123,810 246,573 118,059 144,516 262,575
Average daily census 337 339 676 323 396 719
BED NEED
# Staffed Beds, Year 2019 1,039
Assume improved occupancy rate, Year 2026
# Staffed Beds Required @ 70% Occupancy 1,028
# Staffed Beds Required @ 75% Occupancy 959

I N TE L L I G E N C E TH AT W O R K S
Key Findings – Future Projections
• While the overall population in Vermont is projected to decline, the aging of the population will drive a significant increase in Vermont resident discharges by the Year 2026. Assuming stable discharge rates, stable length of stay, and a stable number of out of State patients, the total number of occupied beds by Vermont residents is projected to increase from 676 occupied beds to 719 beds (+43 occupied beds, or a 6% increase).
• Absent consolidation of inpatient capacity or extension of specialty programs, several of the smaller Vermont hospitals are projected to have excess capacity in the range of 20-30 beds.
14

I N TE L L I G E N C E TH AT W O R K S
Key Findings –Year 2026: Bed Need By Hospital
15
• The below demand forecast assumes that:
• Discharge rates remain stable
• Length of stay remains stable
• The number of out-of-state patients remains stable
• The distribution of discharges from each HSA across hospitals remains stable
• The outmigration rate to out-of-state hospitals remains stable
• The model highlights that the need for additional acute care bed capacity is
heavily concentrated at the University of Vermont Medical Center, with additional
bed need projected for Central Vermont Medical Center and Mt Ascutney. Year 2026
Population-Based Projection for Acute Care Bed Need, by Hospital
Assumes stable use rate, stable length of stay and stable distribution across hospitals
Assumes stable number of out-of-state discharges
UVMC Rutland CVMC Copley Gifford Grace Cott Mt Ausc N Country NEastern NWestern Porter Brattleb SWestern Springfield TOTAL
Average Daily Census, 2026 388 89 58 12 13 1 29 11 13 24 11 17 33 19 719
Average Daily Census, 2019 359 87 55 12 12 1 28 11 13 22 10 17 32 18 676
Change in ADC, 2019-2026 29 2 3 1 1 0 1 1 1 2 1 1 1 1 44
Current Licensed Beds 457 124 76 25 25 19 35 25 25 53 25 47 78 25 1,039
2026 Bed Reqt @ 70% occup 554 127 83 18 19 2 42 16 19 34 16 25 46 27 1,028
2026 Bed Reqt @ 75% occup 517 119 78 17 18 2 39 15 18 31 15 23 43 25 959
# Bed Need, (Excess) @ 70% 97 3 7 (7) (6) (17) 7 (9) (6) (19) (9) (22) (32) 2 (11)
# Bed Need, (Excess) @ 75% 60 (5) 2 (8) (7) (17) 4 (10) (7) (22) (10) (24) (35) (0) (80)
# Bed Need, (Excess) @ 80% 28 -

I N TE L L I G E N C E TH AT W O R K S
Key Findings –Impact of Length of Stay on Bed Need
16
• Vermont hospitals show a longer length of stay relative to benchmarks. In
particular, the University of Vermont Medical Center shows a markedly high length
of stay relative to benchmarks (1.73 days longer relative to benchmark).
• As bed need is projected, it will be important to factor in hospitals’ improvement
toward the benchmark, or reduction in avoidable hospital days. These avoidable
hospital days are referred to here as ”excess days.”
• The reduction in excess days could translate into a significant reduction in
average daily census. The table below shows the impact of a 30% reduction in the
differential and the impact of a 50% reduction in the differential.
• 30% reduction in excess days 53 fewer occupied beds
• 50% reduction in excess days 84 fewer occupied beds
• This reduction in length of stay would likely require investment in home care
resources and other alternative delivery models.

I N TE L L I G E N C E TH AT W O R K S
Key Findings –Impact of Dartmouth Hitchcock Bed Expansion on Need
• Dartmouth Hitchcock (DH) has announced a $130 million expansion with a new tower that could house up to 112 new beds.• DH currently has 396 licensed beds• The tower would include 64 new beds with shell space for an additional 48 as need
arises
• 2019 Data• Dartmouth Hitchcock (DH) had total discharges of 18,752• VCHURES data show that 4,353 DH discharges were from Vermont
• 822 were under 65 years old• 3,531 were 65 or older
• Assumptions• The percentage of patient migration for out-of-state care would increase; DH
expansion would likely draw more patients from the state, further reducing needed bed capacity
• 32 new DH beds are online by 2026• The number of VT discharges increases proportionally across VT HSAs
17

I N TE L L I G E N C E TH AT W O R K S
Key Findings –Impact of Dartmouth Hitchcock Bed Expansion on Need
18
• The table below presents the demand forecast for bed capacity by hospital. It is a
population-driven forecast only, and assumes that:• Discharge rates remain stable
• Length of stay remains stable
• The distribution of discharges from each HSA across hospitals remains stable
• The outmigration rate to out-of-state hospitals reflects the increase in beds planned at
Dartmouth Hitchcock, assuming that 32 new beds are online with a proportional
increase in discharges from Vermont
• Assuming 75 percent occupancy, Vermont would need 8 fewer beds than under
the projection that outmigration is stable, with the largest effect on Rutland
UVMC Rutland CVMC Copley Gifford Grace Cottage Mt. Ausc N Country NEastern NWestern Porter Brattleb SWestern Springfield TOTAL
Average Daily Census, 2026 with stable outmigration 388 89 58 12 13 1 29 11 13 24 11 17 33 19 719
Additional bed reductions due to increased
outmigration to D-H if 32 beds opened 0 2 0 0 0 0 1 0 1 0 1 1 0 0 6
Average Daily Census, 2026 new of D-H effect 388 87 58 12 13 1 28 11 12 24 10 16 33 19 713
Current Licensed Beds 457 124 76 25 25 19 35 25 25 53 25 47 78 25 1039
Revised 2026 Beds Needed @ 70% occupancy 554 124 83 17 19 1 40 16 17 34 14 23 47 27 1019
Revised 2026 Bed Needed @ 75% occupancy 517 116 77 16 17 1 37 15 16 32 13 21 44 25 951
# Bed Need, (Excess) @ 70% 97 0 7 (8) (6) (18) 5 (9) (8) (19) (11) (24) (32) 2 (20)
# Bed Need, (Excess) @ 75% 60 (8) 1 (9) (8) (18) 2 (10) (9) (21) (12) (26) (35) 0 (88)
# Bed Need, (Excess) @ 80% 28
Assumes stable use rate, stable length of stay and stable distriution across hospitals
Assumes additional number of out-of-state discharges proportional to licensed bed increase
Year 2026
Population-Based Projection for Acute Care Bed Need, by Hospital

I N TE L L I G E N C E TH AT W O R K S
Key Findings –Total Impact of Projected Bed Need
• Some VT hospitals have significant projected declines compared to current licensed beds
• These reductions should be balanced against current lower occupancy rates at many of these facilities
19
Hospital Current Licensed Beds Projected Reduction
Brattleboro 47 -26
Grace Cottage 19 -18
North Country 20 -10
Northeastern 21 -9
Northwestern 53 -21
Porter 25 -12
Southwestern 68 -35

I N TE L L I G E N C E TH AT W O R K S
CMS Quality Pay for Performance Programs
20
• Mortality and Complications
• Patient Perception HCAHPS
• Infections
• Efficiency – Cost per Beneficiary
Value Based Purchasing (VBP)
• 30-day, all-cause Readmissions
• 6 clinical conditions
Hospital Readmission
Reduction Program (HRRP)
• AHRQ Patient Safety Indicator Composite
• CDC/NHSN Healthcare Associated Infections
Hospital Acquired Condition Reduction
Program (HACRP)
+/-2%
-3%
-1%
Medicare FFSRevenue
CAH do not participate in VBP, HRRP or HACRP. CAH do participate in MBQIP – Medicare Beneficiary Quality Improvement
Project. Data was not publicly available for the measures included in the project.

I N TE L L I G E N C E TH AT W O R K S
Key Findings – Hospital Quality Performance
• Under CMS Pay for Performance Programs, half of the Vermont hospitals have net rewards while half have net penalties (does not include CAHs)• 5 of 6 Hospitals have HRRP penalties
• 5 of 6 Hospitals have HVBP rewards
• 2 hospitals have HACRP penalties
• Within VBP, Vermont hospitals perform well on HCAHPS
• Areas of opportunity for improvement include:• 30-Day Mortality for AMI and 30-Day Mortality for Heart Failure
• 3 of 6 Hospitals are worse than Peer Group performance for 30 Day Readmissions for THA/TKA
• 2 of 6 Hospitals are worse than Peer Group performance for 30 Day Readmissions for AMI, COPD and Heart Failure
• CAH are exempt from Pay for Performance Programs but voluntarily participate in a quality program specific to CAH; data was not available to review these results
21

I N TE L L I G E N C E TH AT W O R K S
Key Findings Summary of Performance for Publicly Reported Programs – FY 2021
22
FY 2021 Payment Impact
HRRP
Penalty only
HACRP
Penalty only VBP
University of Vermont Medical Center ($155,000) $0 $176,000
Rutland Regional Medical Center $0 $0 $166,000
Central Vermont Medical Center ($7,000) $0 $297,000
Southwestern Vermont Medical Center ($214,000) $0 $116,000
Northwestern Medical Center ($57,000) ($124,000) $16,000
Brattleboro Memorial Hospital ($10,000) ($85,000) ($1,000)
Critical Access Hospitals Not applicable
– All but 1 hospital received a penalty for readmissions in HRRP
– All but 1 hospital received a reward under VBP
– 2 Hospitals received penalties in HACRP
National Best Quartile
National 2nd Quartile
National 3rd Quartile
National Worst Quartile
HRRP HACRP VBP
VBP
HCAHPS
VBP
Safety
VBP
Efficiency
VBP
Clinical
Care
VBP
Mort-30-
AMI
VBP
Mort-30-
HF
VBP
Mort-30-
PN
VBP
Mort-30-
COPD
VBP
Comp-
HIP-
KNEE
University of Vermont Medical Center 2 3 2 2 3 3 1 2 4 1 2 1
Rutland Regional Medical Center 1 1 1 1 1 2 2 4 2 1 1 1
Central Vermont Medical Center 1 2 1 1 2 1 1 1 3 1 1 2
Southwestern Vermont Medical Center 4 3 1 1 1 1 3 4 4 1 1 4
Northwestern Medical Center 3 4 2 2 2 2 3 3 3 1 2
Brattleboro Memorial Hospital 2 4 3 3 2 3 1 4 2 4 2
Not
Applicable
VBP Clinical CareVBP DomainsPayment Policy

I N TE L L I G E N C E TH AT W O R K S
Key Findings – Prevention Quality IndicatorsPQI 90 Overall Composite
23
Source: Vermont Health Care Uniform Reporting and Evaluation System (VHCURES)
https://www.qualityindicators.ahrq.gov/Modules/pqi_resources.aspx#techspecs https://www.qualityindicators.ahrq.gov/Downloads/Modules/PQI/V2
020/Version_2020_Benchmark_Tables_PQI.pdf
• Vermont’s 10.71 PQIs/1000 residents is
below (favorable) AHRQ benchmark of 13.06
• 3 HSAs are above the AHRQ benchmark

I N TE L L I G E N C E TH AT W O R K S
THINKBRG.COM
I N T E L L I G E N C E T H AT W O R K S
Reimagining Care Delivery to Address Capacity & Quality Opportunities
24

I N TE L L I G E N C E TH AT W O R K S
Reimagining Care Delivery Models
• Although BRG’s analysis reflected projections based on existing
need and future demographic changes, other clinical delivery
models exist that could meet the needs of Vermont’s residents
while also providing care in a more cost-effective and clinically
appropriate setting
• BRG believes there is opportunity to provide care to Vermont’s
residents utilizing some of these alternative clinical delivery
models
• In many cases this could be done by reimagining the current role
of an acute care hospital in the community and how to best meet
the needs of the community that it serves

I N TE L L I G E N C E TH AT W O R K S
Hospital at Home• In March 2020, CMS announced the Hospitals Without Walls program
• Hospitals were able to transfer patients to outside facilities, such as ambulatory surgery centers, inpatient rehabilitation hospitals, hotels, and dormitories, while still receiving hospital payments under Medicare
• In November 2020, CMS created the Acute Hospital Care at Home program
• Participating hospitals are required to have appropriate screening protocols before care at home begins to assess both medical and non-medical factors, including working utilities, assessment of physical barriers and screenings for domestic violence concerns
• Beneficiaries will only be admitted from emergency departments and inpatient hospital beds, and an in-person physician evaluation is required prior to starting care at home
• Hospital at Home has the potential to reduce total cost of care (by 30-40%),
reduce labs and other services, increase patient satisfaction and reduce
readmission rates
• As hospital at home models increase, there will be less need for bed capacity
so current projected bed needs are likely overstated.
26
Source: (https://pubmed.ncbi.nlm.nih.gov/31842232/; https://pubmed.ncbi.nlm.nih.gov/29411238/; https://link.springer.com/article/10.1007/s11606-021-07052-5).
I N TE L L I G E N C E TH AT W O R K S
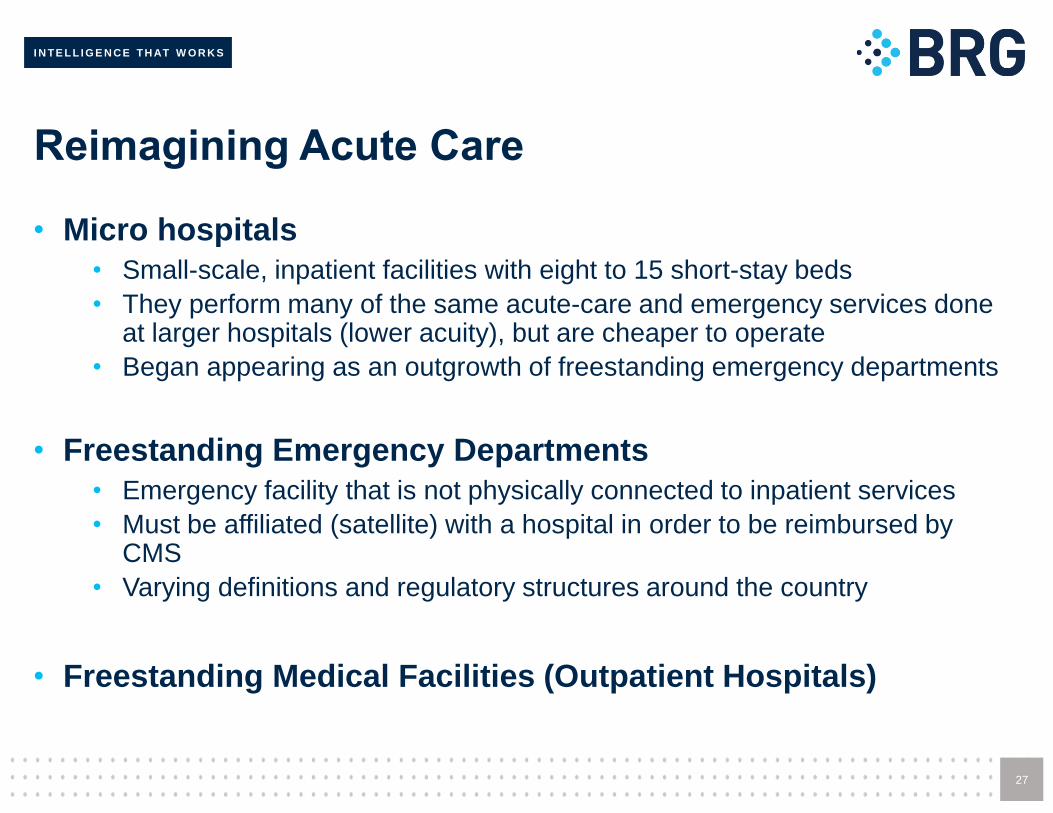
Reimagining Acute Care
• Micro hospitals
• Small-scale, inpatient facilities with eight to 15 short-stay beds
• They perform many of the same acute-care and emergency services done at larger hospitals (lower acuity), but are cheaper to operate
• Began appearing as an outgrowth of freestanding emergency departments
• Freestanding Emergency Departments
• Emergency facility that is not physically connected to inpatient services
• Must be affiliated (satellite) with a hospital in order to be reimbursed by CMS
• Varying definitions and regulatory structures around the country
• Freestanding Medical Facilities (Outpatient Hospitals)
27

I N TE L L I G E N C E TH AT W O R K S
Freestanding Medical Facilities (Outpatient Hospitals)
• Regulatory designation in Maryland to allow former acute care facilities
to be decommissioned and transitioned into a different clinical delivery
model
• Services include an emergency department, observation beds, mental
health, and robust outpatient services
• Example – Bon Secours Hospital in Baltimore City• Rapidly aging physical plant• Government payers and uninsured patients comprised vast majority of
volume• State subsidies were annually required to keep the hospital operating
• Located in an underserved area of Baltimore City• Transformed and reopened as Grace Medical Center
28

I N TE L L I G E N C E TH AT W O R K S
Freestanding Medical Facilities (cont.)
• Grace Medical Center offers:
• emergency care
• inpatient and outpatient mental health
• renal dialysis
• diagnostic services
• Offsite locations provide:
• primary care
• drug treatment
• outpatient mental health services
29

I N TE L L I G E N C E TH AT W O R K S
Rural Emergency Hospital• New designation being proposed by CMS; regulations have not yet been
established
• Eligibility• Eligible hospitals include CAHs and hospitals with 50 beds or less that are located
in a county (or equivalent unit of local government) that is in a rural area defined using the Office of Management and Budget (OMB) designation of non-metropolitan statistical area (MSA), or a hospital with 50 beds or less that is re-classified by CMS as rural
• REH’s must:• not exceed an annual per patient average length of stay of 24 hours
• be staffed 24 hours-a-day, seven days-a-week by a physician, nurse practitioner, clinical nurse specialist, or physician assistant
• meet the licensure requirements and staffing responsibilities of an ED
• have a transfer agreement in place with a level I or II trauma center
• meet conditions of participation applicable to CAH emergency services and hospital EDs (as determined applicable by the Secretary of the Department of Health and Human Services)
• meet the distinct part unit (DPU) requirements if the REH has a skilled nursing facility (SNF) DPU.
30
Source: https://www.shepscenter.unc.edu/programs-projects/rural-health/

I N TE L L I G E N C E TH AT W O R K S
Ambulatory Surgery Centers
• Vermont has the lowest number of ASCs in
the country
• Factors influencing the growing number of
Medicare-certified ASCs:
• Medicare beneficiaries' coinsurance is typically lower in ASCs than hospital outpatient departments
• Medicare now reimburses for total knee replacement in ASCs
• Hospital system and insurers are more interested in surgical center investment due to the emphasis on value-based care
• Orthopedics is the largest ASC specialty in the
country (36% of ASCs)
31
Sources:
https://www.ascassociation.org/advancingsurgicalcare/asc/numberofascsperstate
https://www.beckersasc.com/asc-news/100-things-to-know-about-ascs-2020.html
Hospitals
ASCs

I N TE L L I G E N C E TH AT W O R K S
THINKBRG.COM
I N T E L L I G E N C E T H AT W O R K S
Methodology/Criteria
32

I N TE L L I G E N C E TH AT W O R K S
Methodology and Criteria
• In order to determine opportunities to improve hospital
sustainability and prepare for a value-based world, BRG reviewed
data across a range of factors
• Each of these factors is critical to sustainability in a value-based
care framework, both in aggregate (State of Vermont) as well as at
the individual hospital level
• BRG created criteria for each of the factors to determine where
there may be areas of opportunity, recognizing that policy makers
in Vermont will need to work closely with industry leaders to
determine the best course of action going forward

I N TE L L I G E N C E TH AT W O R K S
Criteria
• Inpatient occupancy rates – adults and pediatrics
• Inpatient occupancy rates – intensive care units
• Projected bed need 2026
• ED use per 1,000 residents
• Prevention Quality Indicator (PQI) per 1,000 residents
• Case mix adjusted average cost per inpatient discharge (all payers)
• CMS Star Rating
• Drive time to nearest VT hospital
• Age of plant
34

I N TE L L I G E N C E TH AT W O R K S
Criteria #1:Inpatient Occupancy Rates –Adults and Pediatrics
35
HospitalInpatient Occupancy Rates -
Adults and Peds(%)
Brattleboro Memorial
Hospital 36.1%
Central Vermont
Medical Center 77.0%
Copley Hospital 56.3%
Gifford Medical Center58.4%
Grace Cottage Hospital
56.6%
Mt. Ascutney 78.8%
North Country 80.1%
Northeastern Regional82.0%
Northwestern Medical
Center 40.4%
Porter Medical Center 66.6%
Rutland Regional 78.0%
Southwestern Vermont
Medical Center 43.4%
Springfield Hospital 45.8%
UVM Medical Center 81.0%
• BRG compared 2019 occupancy rates
for each of the hospitals to identify
hospitals with lower occupancy rates
• Facilities with lower occupancy rates
may be eligible for “right-sizing,”
consolidation with other facilities, or
transitioned to a different care delivery
model
Red = less than 50%
Yellow = 50-75%
Green = Greater than 75%

I N TE L L I G E N C E TH AT W O R K S
Criteria #2:Inpatient Occupancy Rates –Intensive Care Units
36
• BRG compared 2019 occupancy rates
for each of the hospitals to identify
hospitals with lower occupancy rates
• Facilities with lower occupancy rates
may be eligible for “right-sizing,”
consolidation with other facilities, or
transitioned to a different care delivery
model
Red = less than 50%
Yellow = 50-75%
Green = Greater than 75%
HospitalInpatient Occupancy Rate -
Intensive Care Unit (%)
Brattleboro Memorial
Hospital N/A
Central Vermont
Medical Center 58.1%
Copley Hospital N/A
Gifford Medical Center32.3%
Grace Cottage Hospital
N/A
Mt. Ascutney N/A
North Country 8.2%
Northeastern Regional46.4%
Northwestern Medical
Center N/A*
Porter Medical Center N/A
Rutland Regional 26.2%
Southwestern Vermont
Medical Center 47.9%
Springfield Hospital N/A
UVM Medical Center 67.0%
*ICU beds were not
reported in Medicare
Cost Reports but our
understanding from
communications with the
GMCB is that NW has 4
bed ICU

I N TE L L I G E N C E TH AT W O R K S
Criteria #3:Projected Bed Need 2026
37
• Calculated projected bed
need in 2016, including the
additional of additional
capacity at Dartmouth-
Hitchcock
• Hospitals with reduced bed
need may present
opportunities for efficiency
Hospital Projected Bed Need 2026
Brattleboro Memorial Hospital -26
Central Vermont Medical Center 1
Copley Hospital -9
Gifford Medical Center-8
Grace Cottage Hospital -18
Mt. Ascutney2
North Country -10
Northeastern Regional-9
Northwestern Medical Center-21
Porter Medical Center -12
Rutland Regional -8
Southwestern Vermont Medical
Center -35
Springfield Hospital 0
UVM Medical Center 60
Red - bed reduction
Yellow - no change
Green - bed increase

I N TE L L I G E N C E TH AT W O R K S
Criteria #4:ED Use Rate per 1k residents for HSA
38
• Calculated ED use rates on a
population basis for each HSA
• Compared ED use rates vs
the VT average to determine
HSAs with higher ED use
rates, potentially indicating
need for greater ambulatory
services access
Red - above VT average
Green - below VT average
VT average = 340.4
Hospital
Brattleboro Memorial
Hospital Brattleboro 356.95
Central Vermont Medical
CenterBarre
333.99
Copley Hospital Morrisville 386.82
Gifford Medical Center Randolph336.73
Grace Cottage Hospital
Brattleboro (Grace
Cottage is in same HSA
as Brattleboro
Memorial Hospital) 356.95
Mt. Ascutney White River Jct 104.36
North Country Newport 513.18
Northeastern Regional St. Johnsbury 439.49
Northwestern Medical
CenterSt. Albans
477.54
Porter Medical Center Middlebury 494.94
Rutland RegionalRutland
411.93
Southwestern Vermont
Medical CenterBennington
422.75
Springfield Hospital Springfield 446.94
UVM Medical CenterBurlington
238.26
ED Use Rate (per 1,000 population) for Hospital's
HSA

I N TE L L I G E N C E TH AT W O R K S
Criteria #5:Prevention Quality Indicator (PQI) per 1k residents
39
• Calculated PQI Composite
use rates on a population
basis for each HSA
• Compared use rates to an
AHRQ benchmark
Red - greater than AHRQ
benchmark
Green - lower than AHRQ
benchmark
AHRQ benchmark - 13.06
Hospital
Brattleboro Memorial Hospital Brattleboro 10.63
Central Vermont Medical CenterBarre
8.01
Copley Hospital Morrisville
Gifford Medical Center Randolph15.01
Grace Cottage Hospital
Brattleboro
(Grace
Cottage is in
same HSA as
Brattleboro
Memorial
Hospital) 10.63
Mt. AscutneyWhite River
Jct 8.48
North Country Newport 12.94
Northeastern Regional St. Johnsbury 11.7
Northwestern Medical Center St. Albans12.48
Porter Medical Center Middlebury 7.73
Rutland RegionalRutland
13.24
Southwestern Vermont Medical
CenterBennington
16.41
Springfield Hospital Springfield 12.64
UVM Medical CenterBurlington
5.96
PQI Overall Composite for Hospital's HSA (per 1k
residents)

I N TE L L I G E N C E TH AT W O R K S
Criteria #6:Case Mix Adjusted Average Cost per Inpatient Discharge (All payers)
40
• Utilized information provided
by Burns and Associates
• Created cut points to show
outliers
• Although cost differentiation
exists by payer, stratification
by all payer demonstrates
distinct differences across
hospitals
HospitalCase Mix Adjusted Average Cost per
Inpatient Discharge (All Payers)
Brattleboro Memorial Hospital $14,683
Central Vermont Medical Center $14,846
Copley Hospital $11,733
Gifford Medical Center $13,947
Grace Cottage Hospital
$18,485
Mt. Ascutney $22,004
North Country $9,422
Northeastern Regional $14,115
Northwestern Medical Center$12,441
Porter Medical Center $10,582
Rutland Regional $15,624
Southwestern Vermont Medical
Center $9,681
Springfield Hospital $9,725
UVM Medical Center $19,228
Red - greater than $16,000
Yellow - $12,000 - $16,000
Green - lesss than $12,000

I N TE L L I G E N C E TH AT W O R K S
Criteria #7:CMS Star Rating
41
• Utilized CMS Star Ratings as a proxy for
hospital quality
• Not all hospitals had CMS Star Ratings
as noted in the chart
Hospital CMS Star Rating
Brattleboro Memorial
Hospital 2
Central Vermont
Medical Center 5
Copley Hospital 4
Gifford Medical Center3
Grace Cottage Hospital
N/A
Mt. Ascutney 4
North Country 2
Northeastern Regional3
Northwestern Medical
Center 3
Porter Medical Center 3
Rutland Regional 4
Southwestern Vermont
Medical Center 4
Springfield Hospital N/A
UVM Medical Center 5
Red = 1 or 2
Yellow = 3
Green = 4 or 5

I N TE L L I G E N C E TH AT W O R K S
Criteria #8:Drive Time to Nearest VT Hospital
42
• Calculated the drive time
between VT hospitals
• Used drive time rather than
distance to account for
geographic factors
• Hospitals close together
providing similar services may
provide opportunity for
consolidation
HospitalClosest VT Hospital based on Travel
Time
Estimated Drive Time to
Nearest VT Hospital (min)
Brattleboro Memorial
Hospital Grace Cottage Hospital 28
Central Vermont
Medical Center Gifford Medical Center 30
Copley Hospital Central Vermont Medical Center 45
Gifford Medical CenterCentral Vermont Medical Center
30
Grace Cottage Hospital
Brattleboro Memorial Hospital 28
Mt. Ascutney Springfield Hospital 30
North Country Copley Hospital
Northeastern Regional 60
Northeastern RegionalCopley Hospital 56
Northwestern Medical
Center UVM Medical Center 30
Porter Medical Center Rutland Regional 55
Rutland Regional Porter Medical Center 55
Southwestern Vermont
Medical Center Brattleboro Memorial Hospital 65
Springfield Hospital Mt. Ascutney 30
UVM Medical Center Northwestern Medical Center 30
Red = Greater than 30 min
Yellow = 30 min
Green = less than 30 min

I N TE L L I G E N C E TH AT W O R K S
Criteria #9:Age of Plant
43
• The age of plant for each of the
hospitals was assessed
• A higher age of plant may reflect
deferred maintenance and higher
need for capital investment
• Studies have shown that hospitals
with newer physical plans perform
better on value-based purchasing
measures*
Hospital Age of Plant
Brattleboro Memorial
Hospital 11.9
Central Vermont
Medical Center 12.2
Copley Hospital 11.6
Gifford Medical Center19.3
Grace Cottage Hospital
21.1
Mt. Ascutney 12.6
North Country 12.9
Northeastern Regional12.7
Northwestern Medical
Center 10.1
Porter Medical Center 12.8
Rutland Regional 13.9
Southwestern Vermont
Medical Center 18.2
Springfield Hospital 17.2
UVM Medical Center 13.2
Red = greater than state average
Yellow = state average
Green = less than state average
Average = 14.3 years
*Source: https://pubmed.ncbi.nlm.nih.gov/30379712/

I N TE L L I G E N C E TH AT W O R K S
THINKBRG.COM
I N T E L L I G E N C E T H AT W O R K S
Opportunities
44

I N TE L L I G E N C E TH AT W O R K S
Areas of Opportunity
• In reviewing potential areas of opportunity, BRG identified four
distinct categories:
• Steady State
• Potential opportunities given the current demand for inpatient services, demographics, etc.
• These opportunities exist even without additional care delivery reforms.
• Acute Care Model Changes
• Opportunities to change the acute care delivery model based on reimagining existing facilities, sites, and clinical models
• Value-Based Care• Opportunities focusing on care that does not need to be provided in the hospital
if different resources were available
• Regulatory Enhancements• Opportunities to utilize regulatory tools to promote hospital stability and the shift
to value-based payments

I N TE L L I G E N C E TH AT W O R K S
Area of Opportunity #1 – Steady State
Potential Opportunity Rationale
Transition inpatient
services from Grace
Cottage to Brattleboro
Hospital
• Occupancy rate
• Both facilities have low occupancy rates
• Brattleboro (36.1%)
• Grace Cottage (56.6%)
• Projected bed need. Both hospitals are
projecting a reduced bed need by 2026
• Grace Cotttage (-18)
• Brattleboro (-26)
• Travel time - less than 30 min drive time
between the two facilities
• Cost per discharge – Grace Cottage has
one of the highest costs per discharge in the
state ($18,485)
• Age of plant
• Brattleboro’s (11.9 years)
• Grace Cottage (21.1 years)
• Both serve the same HSA

I N TE L L I G E N C E TH AT W O R K S
Area of Opportunity #2 – Steady State
Potential Opportunity Rationale
Transition inpatient
services from Springfield
to Mt. Ascutney
• Occupancy rate - Springfield
has a low occupancy rate
(45.8%)
• Quality rating – Mt. Ascutney
has a higher quality rating (4
stars)
• Travel time – 30 min drive time
between facilities
• Age of plant
• Mt. Ascutney (12.6)
• Springfield (17.2)

I N TE L L I G E N C E TH AT W O R K S
Area of Opportunity #3 – Steady State
Potential Opportunity Rationale
Transition Gifford ICU
services to Central VT
• Occupancy rate
• Gifford has a small ICU (2 beds)
and low occupancy (32.3%)
• Central VT ICU has a higher
occupancy (56.1%) but still has
capacity
• Cost per discharge – Comparable
between Gifford ($13,947) and
Central VT ($14,846)
• Quality rating - Central VT has a
higher quality rating (5 stars)
• Travel time - 30 min drive time
between the facilities
• Age of plant
• Central VT (12.2)
• Gifford (19.3)

I N TE L L I G E N C E TH AT W O R K S
Area of Opportunity #4 – Steady State
Potential Opportunity Rationale
Transition North Country
ICU services:
• Move ICU services
to Northeastern
Hospital; or
• Develop transfer
protocol to UVM
• Occupancy rate
• North Country has a low
occupancy (8%)
• Travel time
• Nearest hospitals are Copley
(no ICU) and Northeastern
(46% ICU occupancy) – both
are 60 min drives
• Alternative approach could be
to create a transfer protocol to
UVM – medevac, etc.

I N TE L L I G E N C E TH AT W O R K S
Area of Opportunity #5 – Steady State
Potential Opportunity Rationale
Transition Northwestern
ICU services to UVM
• Occupancy rate
• Northwestern has a low number
of ICU beds (4) and a low
occupancy rate
• Travel time – 30 min drive to UVM
• Quality rating – UVM has higher
quality (5 stars)

I N TE L L I G E N C E TH AT W O R K S
Area of Opportunity #6 – Steady StatePotential Opportunity Rationale
Create Centers of
Excellence for certain
types of care
(Example – orthopedic
surgery – 2019 data)
• Most of VT’s hospitals perform
orthopedic procedures
• Several hospitals do not meet
hospital volume standards as
established by The Leapfrog Group
• Total hip (50 annually)• Copley (42)
• Gifford (8)
• North Country (22)
• Springfield (10)
• Total knee (50 annually)• Gifford (14)
• North Country (<6)
• Northwestern (9)
• Porter (48)
• Springfield (19)
I N TE L L I G E N C E TH AT W O R K S
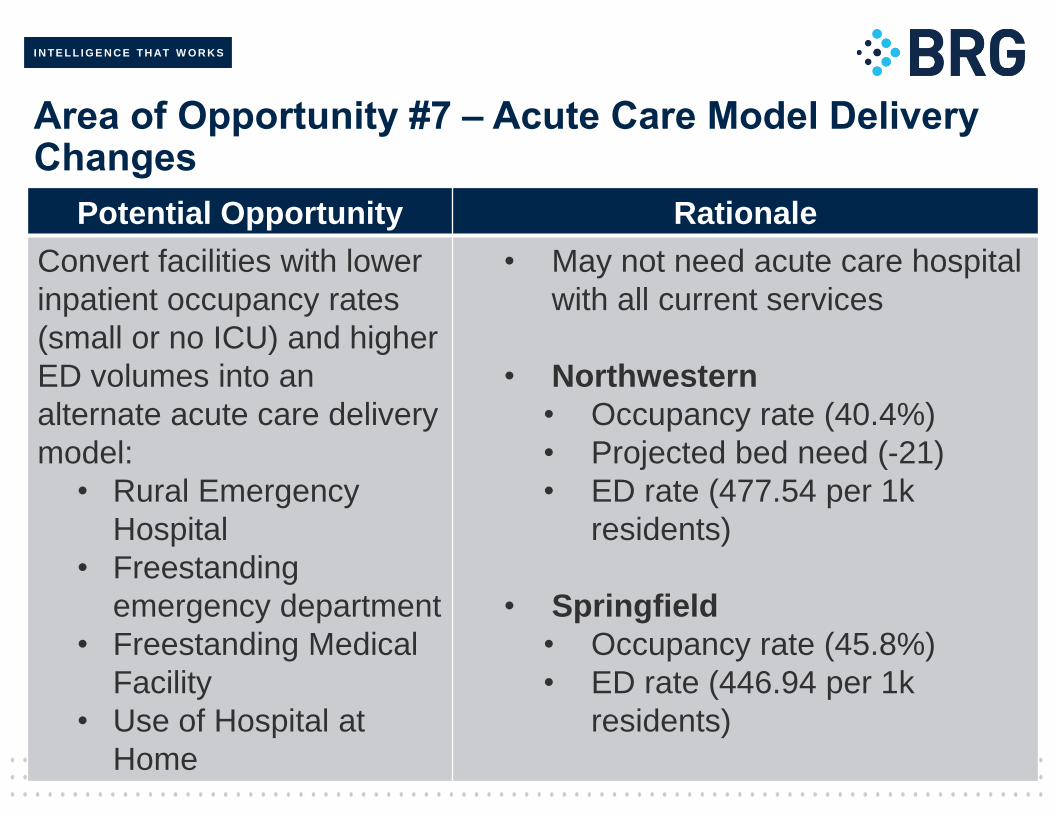
Area of Opportunity #7 – Acute Care Model Delivery Changes
Potential Opportunity Rationale
Convert facilities with lower
inpatient occupancy rates
(small or no ICU) and higher
ED volumes into an
alternate acute care delivery
model:
• Rural Emergency
Hospital
• Freestanding
emergency department
• Freestanding Medical
Facility
• Use of Hospital at
Home
• May not need acute care hospital
with all current services
• Northwestern
• Occupancy rate (40.4%)
• Projected bed need (-21)
• ED rate (477.54 per 1k
residents)
• Springfield
• Occupancy rate (45.8%)
• ED rate (446.94 per 1k
residents)

I N TE L L I G E N C E TH AT W O R K S
Area of Opportunity #8 – Value Based Care
Potential Opportunity Rationale
Conduct a study to
quantify low value care
being provided in
Vermont’s hospitals and
utilize regulatory tools to
create financial incentives
to reduce it
• Low-value care can be defined as
“services that provide little or no
benefit to patients, have potential to
cause harm, incur unnecessary cost
to patients, or waste limited
healthcare resources.”
• Examples include low back imaging
within 6 weeks of onset, branded
drugs when generics are available,
etc.
• In 2014, The Commonwealth of
Virginia reported spending $586
million in unnecessary costs using
data from their All-Payer Claims
Database

I N TE L L I G E N C E TH AT W O R K S
Area of Opportunity #9 – Value Based Care
Potential Opportunity Rationale
Conduct a study to
quantify low intensity
services and Potentially
Avoidable Utilization
(PAU) being treated in
Vermont’s hospitals and
utilize regulatory tools to
create financial incentives
to reduce them
• Low intensity services include outpatient
procedures that could be done in an
ambulatory surgery center (endoscopy,
colonoscopy, etc.) at lower cost
• PAU is defined as acute inpatient
admissions and emergency department
visits that can be reduced by timely
primary and preventive care
• Several VT hospitals have higher than
the State average for PAU associated
revenue – Copley, Gifford, Grace
Cottage, North Country,
Northwestern, and Springfield
Source: https://ruralhealth.mathematica.org/search?stateId=1044

I N TE L L I G E N C E TH AT W O R K S
Area of Opportunity #10 – Value Based Care
Potential Opportunity Rationale
Consider enhancements
to Vermont’s All-Payer
ACO Model when
negotiations with CMS
begin, such as:
• Global budgets for
hospitals
• Increased payer and
provider participation
• VT’s All-Payer ACO Model can be a
tool to create increased alignment in
a value-based care payment system
• Additional tools should be explored
that continue to align financial
incentives, not only for hospitals but
for other providers that can support
the goals of the Model
• Global budgets change financial
incentives from the emphasis on
volume under FFS payments and
offer predictable revenue streams,
particularly for rural hospitals
Source: https://jamanetwork.com/journals/jama/fullarticle/2767263

I N TE L L I G E N C E TH AT W O R K S
Area of Opportunity #11 – Regulatory Enhancements
Potential Opportunity Rationale
Expand the data
reporting of hospitals to
include additional data
points such as
• Expanded reporting on
hospital-based
outpatient services,
ancillaries, and drugs
• non-hospital based
services such as
ambulatory surgery
centers
• Average cost by
service line
• The goal is establishing a
comprehensive understanding of
the entire capacity of the
healthcare delivery system,
particularly where less expensive
non-hospital services could
substitute for hospital-based
services.
• For items such as drugs, it is
important to understand cost
pressures driven by input prices
outside the providers’ control.

I N TE L L I G E N C E TH AT W O R K S
Area of Opportunity #12 – Regulatory Enhancements
Potential Opportunity Rationale
Increase quality data
reporting requirements to
better capture data
across payers and
providers.
• Not all data fields in VHCURES
are available for all payer;
Medicare is most complete
• Consistency and accuracy of
documentation and coding across
providers and hospitals will impact
risk adjustment

I N TE L L I G E N C E TH AT W O R K S
Area of Opportunity #13 – Regulatory Enhancements
Potential Opportunity Rationale
Require hospital
performance improvement
plans for any hospital that
is higher than the average
for their peer group for
cost per admission.
These plans would
specifically look for areas
of opportunity to reduce
cost.
• Some facilities are higher than
average compared to other hospitals
within their peer group
• PPS
• Rutland
• CAH
• Grace Cottage
• Mt. Ascutney
• Northeastern

I N TE L L I G E N C E TH AT W O R K S
Conclusions
• VT has a unique opportunity to transform the healthcare delivery
system given it’s focus on hospital sustainability and value-based
care
• Current value-based programs such as VT’s All-Payer ACO can be
complementary to hospital “right-sizing” efforts, balancing the need
to reduce cost within the system while still maintaining access to
care
• VT should consider new care delivery models being utilized around
the country, including some recently proposed by CMS, when
making determinations regarding the future services provided by
VT’s hospitals
59