Green Jobs Survey Report
40
Colorado Department of Labor and Employment Interim Report on Green Jobs in the Colorado Economy Conducted by: Colorado Department of Labor and Emp loyment Labor Market Informaon And by: Business Research Division Leeds School of Business University of Colorado Boulder Report prepared by: Brian Lewandowski Ralph Longobardi Barbara Wills : 2011
-
Upload
michael-sandoval -
Category
Documents
-
view
220 -
download
0
Transcript of Green Jobs Survey Report

8/4/2019 Green Jobs Survey Report
http://slidepdf.com/reader/full/green-jobs-survey-report 1/40
Colorado Department of Labor and Employment
Interim Report on Green Jobs in the Colorado Economy
Conducted by:
Colorado Department of Labor and Employment
Labor Market Informaon
And by:
Business Research Division
Leeds School of Business
University of Colorado Boulder
Report prepared by:Brian Lewandowski
Ralph Longobardi
Barbara Wills
: 2011

8/4/2019 Green Jobs Survey Report
http://slidepdf.com/reader/full/green-jobs-survey-report 2/40
This page intentionally left blank.
8/4/2019 Green Jobs Survey Report
http://slidepdf.com/reader/full/green-jobs-survey-report 3/40
Page i
ACKNOWLEDGEMENTS
Ellen Golombek, Executive Director, Colorado Department of Labor and EmploymentAlexandra Hall, Director, Labor Market Information
Paul Schacht, Operations Manager, Labor Market Information
Joseph Winter, Senior Economist, Colorado Department of Labor and Employment
Todd Younkin, LMI Director, Montana Department of Labor and Industry
Barbara Wagner, Senior Economist, Montana Department of Labor and Industry
SUPPORTERS
Governor’s Energy Office
Colorado Municipal League
Metro Denver Economic Development CorporationEconomic Development Council of Colorado
CDLE PROJECT TEAM
Ralph Longobardi, Program Manager
Barbara Wills, Statistical Analyst
BUSINESS RESEACH DIVISION PROJECT TEAM
Richard Wobbekind, Executive Director
Brian Lewandowski, Research Associate
Cindy DiPersio, Project CoordinatorNoah Hahn, Student Research Assistant
Matt Wolfe, Student Research Assistant
Rachel Ford, Student Research Assistant
Ryan Streit, Student Research Assistant
8/4/2019 Green Jobs Survey Report
http://slidepdf.com/reader/full/green-jobs-survey-report 4/40
Page ii
‘‘This workforce solution was funded by a grant awarded by the U.S. Department of
Labor’s Employment and Training Administration. The solution was created by the
grantee and does not necessarily reflect the off icial position of the U.S. Department of
Labor. The Department of Labor makes no guarantees, warranties, or assurances of any
kind, express or implied, with respect to such information, including any information on
linked sites and including, but not limited to, accuracy of the information or its
completeness, timeliness, usefulness, adequacy, continued availability, or ownership.
This solution is copyrighted by the institution that created it. Internal use by an
organization and/or personal use by an individual for non -commercial purposes is
permissible. All other uses require the prior authorization of the copyright owner.’’
8/4/2019 Green Jobs Survey Report
http://slidepdf.com/reader/full/green-jobs-survey-report 5/40
Page ii i
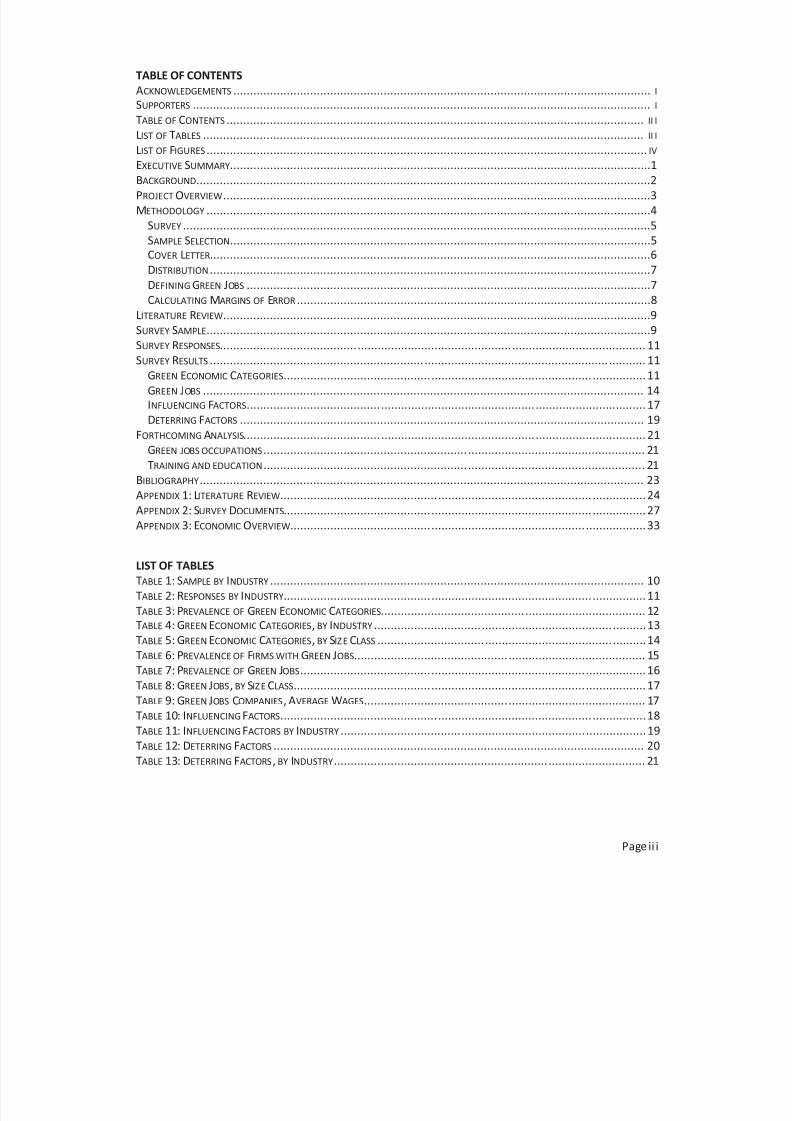
TABLE OF CONTENTS
ACKNOWLEDGEMENTS ............................................................................................................................. I SUPPORTERS ......................................................................................................................................... I
TABLE OF CONTENTS ............................................................................................................................. II I
LIST OF TABLES .................................................................................................................................... II I
LIST OF FIGURES .................................................................................................................................... IV
EXECUTIVE SUMMARY..............................................................................................................................1BACKGROUND........................................................................................................................................2
PROJECT OVERVIEW................................................................................................................................3
METHODOLOGY .....................................................................................................................................4
SURVEY ............................................................................................................................................5
SAMPLE SELECTION..............................................................................................................................5COVER LETTER....................................................................................................................................6
DISTRIBUTION ....................................................................................................................................7
DEFINING GREEN JOBS .........................................................................................................................7
CALCULATING MARGINS OF ERROR ..........................................................................................................8
LITERATURE REVIEW................................................................................................................................9
SURVEY SAMPLE.....................................................................................................................................9
SURVEY RESPONSES......................................... .............................................. ........................................ 11SURVEY RESULTS ................................................................ ....................................................... ........... 11
GREEN ECONOMIC CATEGORIES............................................ ................................................ ................ 11
GREEN JOBS .................................................................................................................................... 14INFLUENCING FACTORS........................................ .............................................. ................................. 17
DETERRING FACTORS ......................................................................................................................... 19
FORTHCOMING ANALYSIS......................................... .............................................. ................................. 21
GREEN JOBS OCCUPATIONS............................................................. ..................................................... 21
TRAINING AND EDUCATION ............................................................. ..................................................... 21
BIBLIOGRAPHY..................................................................................................................................... 23
APPENDIX 1: LITERATURE REVIEW............................................... .............................................. ................ 24
APPENDIX 2: SURVEY DOCUMENTS............................................ ................................................ ................ 27APPENDIX 3: ECONOMIC OVERVIEW.......................................... .............................................. .................. 33
LIST OF TABLES
TABLE 1: SAMPLE BY INDUSTRY ................................................................................................................ 10
TABLE 2: RESPONSES BY INDUSTRY............................................ ................................................ ................ 11
TABLE 3: PREVALENCE OF GREEN ECONOMIC CATEGORIES........................................... .................................... 12TABLE 4: GREEN ECONOMIC CATEGORIES, BY INDUSTRY ................................ ....................................... .......... 13
TABLE 5: GREEN ECONOMIC CATEGORIES, BY SIZE CLASS ................................ ...................................... .......... 14
TABLE 6: PREVALENCE OF FIRMS WITH GREEN JOBS.............................................. ......................................... 15
TABLE 7: PREVALENCE OF GREEN JOBS....................................... .............................................. .................. 16
TABLE 8: GREEN JOBS, BY SIZE CLASS......................................... .............................................. .................. 17TABLE 9: GREEN JOBS COMPANIES, AVERAGE WAGES........................................... ......................................... 17
TABLE 10: INFLUENCING FACTORS............................................... .............................................. ................ 18
TABLE 11: INFLUENCING FACTORS BY INDUSTRY .................................... ..................................... .................. 19
TABLE 12: DETERRING FACTORS ............................................................................................................... 20
TABLE 13: DETERRING FACTORS, BY INDUSTRY................................................................ ............................. 21

8/4/2019 Green Jobs Survey Report
http://slidepdf.com/reader/full/green-jobs-survey-report 6/40
Page iv
LIST OF FIGURESFIGURE 1: FACTORS INFLUENCING EXPANSION OF GREEN JOBS ...................................................... ................... 18
FIGURE 2: FACTORS DETERRING EXPANSION OF GREEN JOBS........................................ .................................... 20
FIGURE 3: INITIAL POSTCARD (FRONT SIDE) ................................................................................................. 27
FIGURE 4: INITIAL POSTCARD (BACK SIDE) ........................................... .............................................. .......... 27
FIGURE 5: SURVEY INSTRUMENT (PAGE 1 AND PAGE 4) ............................................. ..................................... 28FIGURE 6: SURVEY INSTRUMENT (PAGE 2 AND PAGE 3) ............................................. ..................................... 29
FIGURE 7: ENVELOPE....................................... .............................................. ........................................ 30
FIGURE 8: POSTAGE-PAID RETURN ENVELOPE.............................................. ............................................... . 30
FIGURE 9: WHAT WE MEAN BY GREEN...................................... .............................................. .................. 31
FIGURE 10: COVER LETTER....................................... .............................................. ................................. 32FIGURE 11: COLORADONON-AGRICULTURAL WAGE AND EMPLOYMENT, 2000-2010 .................................... ....... 33
FIGURE 12: COLORADO POPULATION, COMPONENTS OF CHANGE, 2002-2011................................ .................... 34
FIGURE 13: COLORADO RETAIL TRADE SALES, 2002-2009................................ .............................................. 34
8/4/2019 Green Jobs Survey Report
http://slidepdf.com/reader/full/green-jobs-survey-report 7/40
Page 1
EXECUTIVE SUMMARY
The Colorado Department of Labor and Employment, Office of Labor Market Information (LMI), in
association with the Business Research Division in the Leeds School of Business at the University of
Colorado Boulder, conducted a comprehensive survey to estimate the number of green jobs in Colorado
and to obtain information on industry distribution, and the types and wages of these green jobs. The survey
also was designed to gauge perceptions about the factors that might influence or deter Colorado business
units as they consider increasing their presence in the green economy.
Beginning in January 2011, a paper survey was mailed to 29,596 Colorado establishments randomly
selected from the Quarterly Census of Employment & Wages (QCEW) database for the fourth quarter of
2009. Responses were collected over a period of five months through mail, telephone, and internet
surveys. The survey asked employers about the green economic categories they might be involved with and
the number, types, and wages of green jobs they have. Employers were also asked to rank sets of factors
that may influence or deter their expansion into the green economy.
The estimated overall prevalence of green jobs in Colorado was 2.8% (+/- 0.07%) and ranged from 0.2% (+/-
0.01%) in the Health Care and Social Assistance sector to 12.3% (+/- 0.37%) in the Agriculture, Forestry,
Fishing, and Hunting sector. Overall, 18.1% of respondents reported that they were involved in one of six
broad categories of green economic activity. Respondents indicated that financial factors, such as profit
margin and customer demand, were most influential factors determining their wi llingness to increase their
involvement in green activities.
This preliminary analysis found a prevalence of green jobs that is similar to recent studies conducted in
other states. The data collected from this survey may be helpful in providing a context for future analysis
and further exploratory research, and in assisting Individuals, policy makers, and the business community in
assessing the impact of the green economy in Colorado.
8/4/2019 Green Jobs Survey Report
http://slidepdf.com/reader/full/green-jobs-survey-report 8/40
Page 2
BACKGROUND
Labor Market Information provides information and research to help businesses, individual citizens, and
policy makers understand the Colorado economy. Historically, LMI has conducted research on business
clusters such as health care, manufacturing, the creative industries, as well as provided industry and
occupational employment projections and wage estimates.
In summer 2010, LMI received an invitation to join a group of western states in a project to help gauge the
extent of the green economy by surveying companies to determine the prevalence of green jobs in the
state. LMI saw the invitation to join the Northern Plains and Rocky Mountain Green Jobs Survey Consortium
(the “Consortium”) as an opportunity to conduct exploratory research on the topic of environmentally
friendly jobs and on the factors that might lead to the creation of a new and potentially significant segment
of the economy. LMI has, for some years, fielded an increasing number of inquir ies about the nature and
characteristics of that segment of the economy. The topic of the green economy is highly debated and
widely promoted as a new and potentially important direction for job creation in the state, and the subject
is one that extends to various domains, including government and academia, and, most importantly, to
business and commerce in Colorado. As the lead agency charged with providing economic data to the
state’s business community, it was incumbent upon LMI to begin to explore the topic.
LMI also saw this research opportunity as an important supplement to the Bureau of Labor Statistics (BLS)
impending green goods and services survey to be implemented by the Occupational Employment Statistics
(OES) program in the latter half of 2011. The outcomes of the two studies will supply complementary
perspectives for a better understanding of the green economy.
It is important to note at the outset that the study results reported in this document are exploratory in
nature and are not intended as a definitive statement describing the green economy in Colorado. In fact, i t
should be understood that the precise accounting of green jobs existing in Colorado is highly dependent on
the abili ty to classify any particular job (which can be a subjective), on the interpretation and opinion of
survey participants, as well as on the evolving, broad definition of what constitutes a green job. As with
every survey, a bias toward inclusion may affect the resulting responses as respondents may or may not
desire to be a part of the study. It is also important to note that in this initial analysis of the survey data, a
job reported by an employer as falling within the provided definition of a green job was considered valid. In
order to compare the Colorado results with those of the other Consortium states, this unfiltered method of
measuring jobs was selected as the most reasonable procedure for comparing results. Further analysis of
these data in the coming months may employ more refined screening and interpretation methods and will
be considered in the revised context and methodology of any supplementary study.
8/4/2019 Green Jobs Survey Report
http://slidepdf.com/reader/full/green-jobs-survey-report 9/40
Page 3
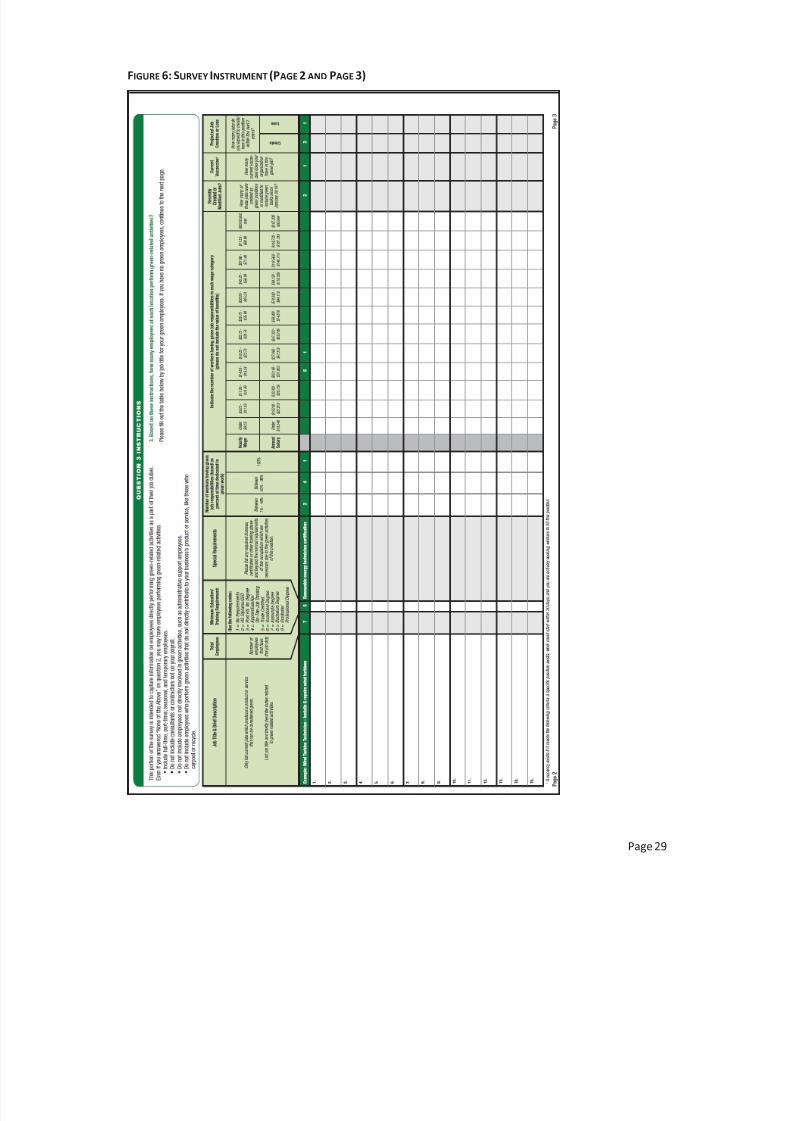
While this study captured the number of employees performing green jobs, these jobs occur within many
occupational categories and range in diversity from construction to engineering to management
occupations. Most of these occupations pre-date the green economy, but have been adapted to fit the
green niche. These jobs produce tangible goods, offer real services, and pay substantial wages. Classifying
these jobs as green simply identifies a shared objective (minimizing environmental impact), similar toidentifying the multiple industries that contribute to the aerospace cluster.
PROJECT OVERVIEW
In response to a request by LMI, the Business Research Division (BRD) of the University of Colorado Boulder
assisted in conducting a baseline survey of green jobs in the state of Colorado. The purpose of the study is
to advance LMI’s mission to provide timely and relevant economic data to the citizens of the state. Results
from this survey may be compared to other states in the Consortium, including Iowa, Montana, Nebraska,
North Dakota, South Dakota, Utah, and Wyoming.
The green economy is composed of many industry and occupational classifications, making green
businesses a cluster in the sense that biosciences, aerospace, and tourism are clusters. Therein lies the
challenge in quantifying the size and scope of the cluster—it comprises a relatively small slice of many
industries. This study set out to examine the green economy in Colorado by:
1) Quantifying the number of green jobs by industry in Colorado,
2) Qualifying the types of green occupations in Colorado,3) Identifying the training needs for green jobs in Colorado,
4) Quantifying wage categories for green jobs in Colorado,
5) Identifying and ranking factors that influence the growth of green jobs, and
6) Identifying and ranking factors that inhibit the growth of green jobs.
With those stated objectives, it is again important to note that in this initial analysis, the data coll ected
have not yet been finalized. This status report is intended to present the preliminary results of the study at
a pre-specified point in time and to elicit responses and suggestions in order to inform further analyses and
final products.
Although prel iminary in nature, this report allows for a quality analysis to be conducted of the overall
prevalence of green jobs in the Colorado economy, as well as of the factors that employers cite as those
influencing or deterring their expansion into the green economy. Additional analysis was performed by
industry and size class.
8/4/2019 Green Jobs Survey Report
http://slidepdf.com/reader/full/green-jobs-survey-report 10/40
Page 4
It is also worth noting that, as with any survey of this size and scope, the quality and number of responses
will vary between questions. Specifically, the number of responses providing the necessary detail on the
questions about wages and percentages of time spent on green activities is not sufficient to report with
confidence. The responses to this survey, specifically as they relate to wages, may be supplemented in
future analyses by information collected in the statewide OES survey and the BLS green goods and servicesstudy. Analyses by size class will also be more comprehensively addressed in future reports.
METHODOLOGY
LMI joined the Consortium late in the survey project process. Therefore, both the methodology and the
survey instrument had been created and were in service. In order to ensure that the Colorado results were
comparable to the survey results of other Consortium members, it was incumbent upon the Colorado
research team to use the existing process and instrument. The LMI and BRD research teams worked directly
with project leaders from the Consortium in order to closely adopt the methodology deployed in the seven
other states that conducted similar studies.
The existing green jobs survey was modified and adopted to solicit information from Colorado companies
regarding green jobs in the Colorado economy. An LMI statistician pulled a random sample of all industries
of nearly 30,000 Colorado companies from the Quarterly Census of Employment and Wage’s (QCEW)
database for quarter four 2009. The sample was drawn across all industries and size classes without pre-
judgment regarding the industry or size distribution of companies with green jobs. This design was selected
in order to enable the most accurate estimates of green jobs within the overall Colorado economy. The
Colorado survey followed the Consortium’s methodology that was designed to include a sufficient number
of firms within each industry and size class in order to enable the reporting of green jobs at the industry
level. The survey was not designed to elicit data on the distribution of green jobs by geographical area
within Colorado.
The Colorado green jobs survey was drafted, shared, and tested for validity and clarity with various
academic, government, and research groups. The survey was then programmed in an online survey
program, and a webpage was devoted to the project on the Leeds School of Business website at the
University of Colorado Boulder.
The project team reached out to companies in the sample up to five times. First, companies were sent a
“heads-up” postcard introducing the study, which included the URL to the online survey and a unique

8/4/2019 Green Jobs Survey Report
http://slidepdf.com/reader/full/green-jobs-survey-report 11/40
Page 5
password. Next, companies were sent a paper survey with a cover letter that further explained the study,
giving company representatives the option to complete the paper survey, or go online to complete the
survey. A reminder postcard was then sent to all nonrespondents, which also included the URL and unique
password. Simultaneously, telephone calls were made to nonrespondents. Finally, a short version of survey
was sent to all nonrespondents.
Survey
The Consortium provided electronic versions of the survey to the BRD research team. The BRD research
team sourced additional survey examples that were used in other states outside of the Consortium and
talked with researchers at other institutions for purposes of due di ligence and comparative research. The
Colorado survey was created to have the same look and feel as the Consortium’s. The company information
and green jobs questions were identical to the Montana survey. The final section of the survey was left to
the discretion of each state project team to gather additional information deemed important to that state.
(See Appendix 2 to view the survey instrument.)
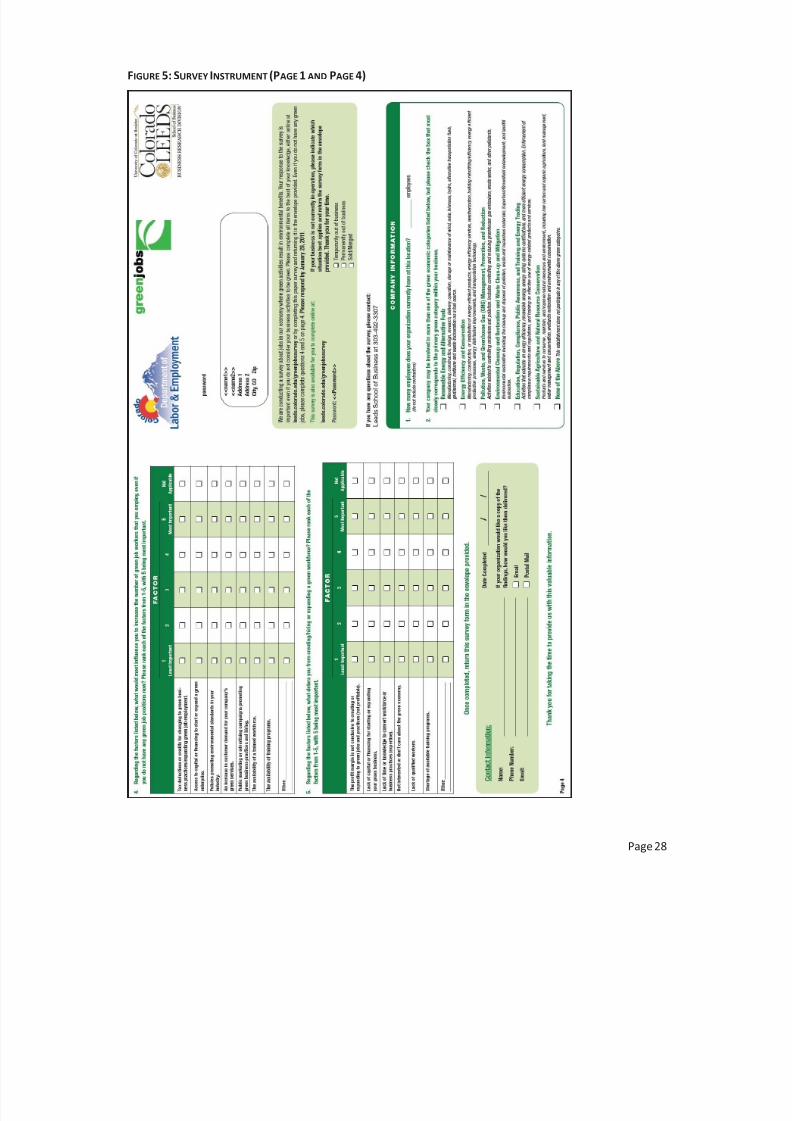
The Colorado project team used discretionary questions to capture information regarding influences and
inhibitors to cluster growth. Specifically, two sections in the Montana survey requesting information about
employment benefits and green business practices were replaced with two sections of questions about the
factors that would influence or deter businesses from expanding into the green economy.
The survey instrument was tested for accuracy and understanding. After making minor modifications, the
survey was programmed into Qualtrics, an online survey program. This version of the survey required the
same password provided on the postcards and paper survey to ensure one survey response per company.
Sample Selection
The CDLE green jobs survey drew its sample from the QCEW file for Q4 2009. That file contains all covered
employment1
in the state of Colorado. Of the 169,126 business establishments in that file, 29,596 were
randomly selected for this study.
The Q4 2009 file was stratified by NAICS sector and size class. Based on the Consortium’s methodology for
minimum sample units needed to publish results by NAICS sector and size class stratum with a standard
1Employment covered by state unemployment i nsurance laws or, for federal workers, covered by the Unemployment
Compensation for Federal Employees program.
8/4/2019 Green Jobs Survey Report
http://slidepdf.com/reader/full/green-jobs-survey-report 12/40
Page 6
error of 3% or less at a 95% level of confidence, certainty cells were identified, and units in the remaining
(noncertainty) cells were randomly selected to achieve the target unit allocation for each cell.
The sample was selected to report findings for five size classes. Those size classes include firms with the
following number of employees:
x From greater than 0 to less than 10
x From 10 to less than 50
x From 50 to less than 100
x From 100 to less than 250
x 250 or greater
In order to better ensure the delivery of the survey to the intended recipients, the addresses were re fined
as much as possible in the time frame relegated for the study. A key factor was the del ivery of surveys to
businesses with multiple operating sites in the state (“multis”). In the case of multis, delivery to the main
administrative branch is the optimal method for targeting the information request to appropriate contact
persons.
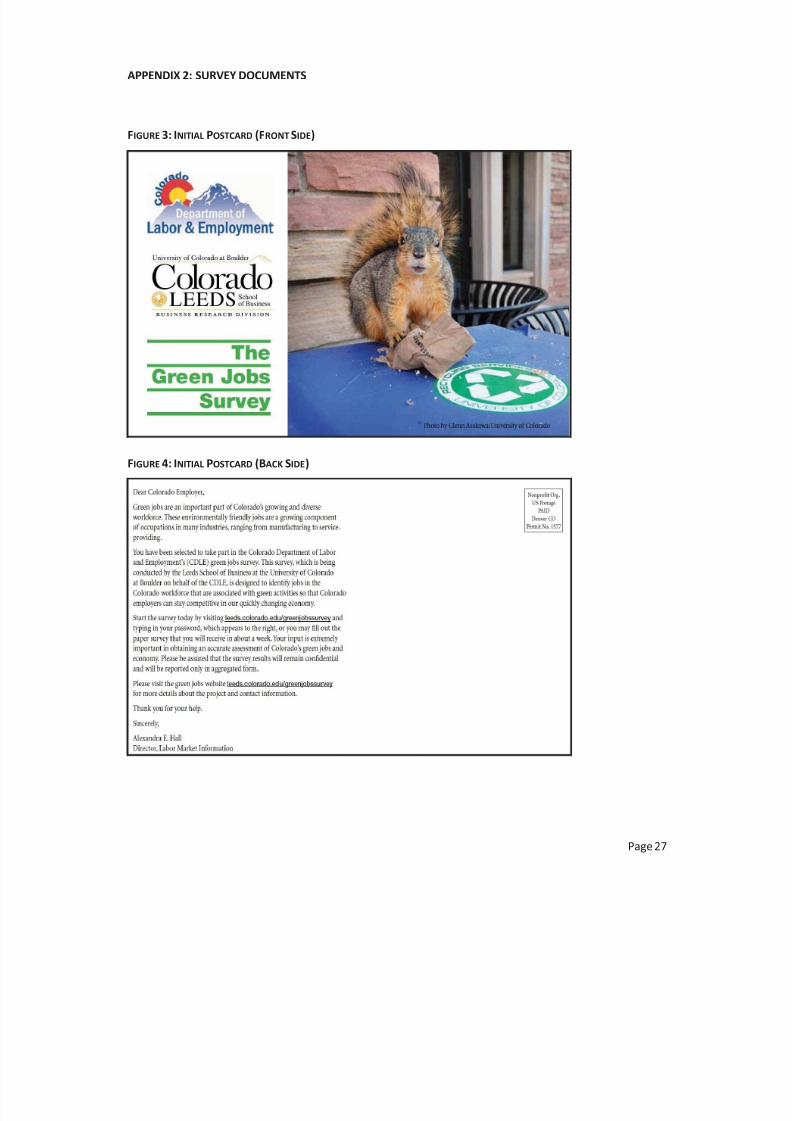
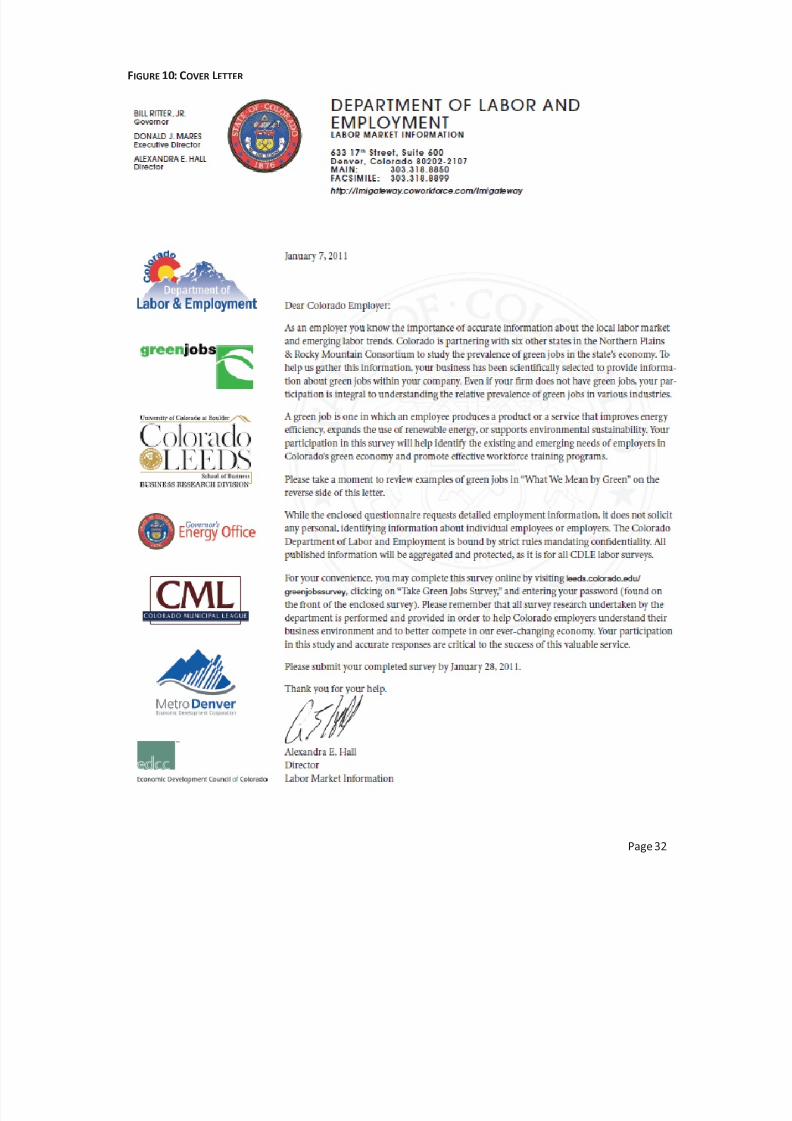
Cover Letter
The cover letter described the purpose of the study and provided a URL for the green jobs survey hosted by
the Leeds School of Business website. On the front of the cover letter were eight logos: those of the
organizations conducting the project and those that were endorsing the project. These organizations
included:
x State of Colorado
x Colorado Department of Labor and Employment
x Northern Plains and Rocky Mountain Green Jobs Consortium
x Leeds School of Business
x Governor’s Energy Office
x Colorado Municipal League
x Metro Denver Economic Development Corporation
x Economic Development Council of Colorado
8/4/2019 Green Jobs Survey Report
http://slidepdf.com/reader/full/green-jobs-survey-report 13/40
Page 7
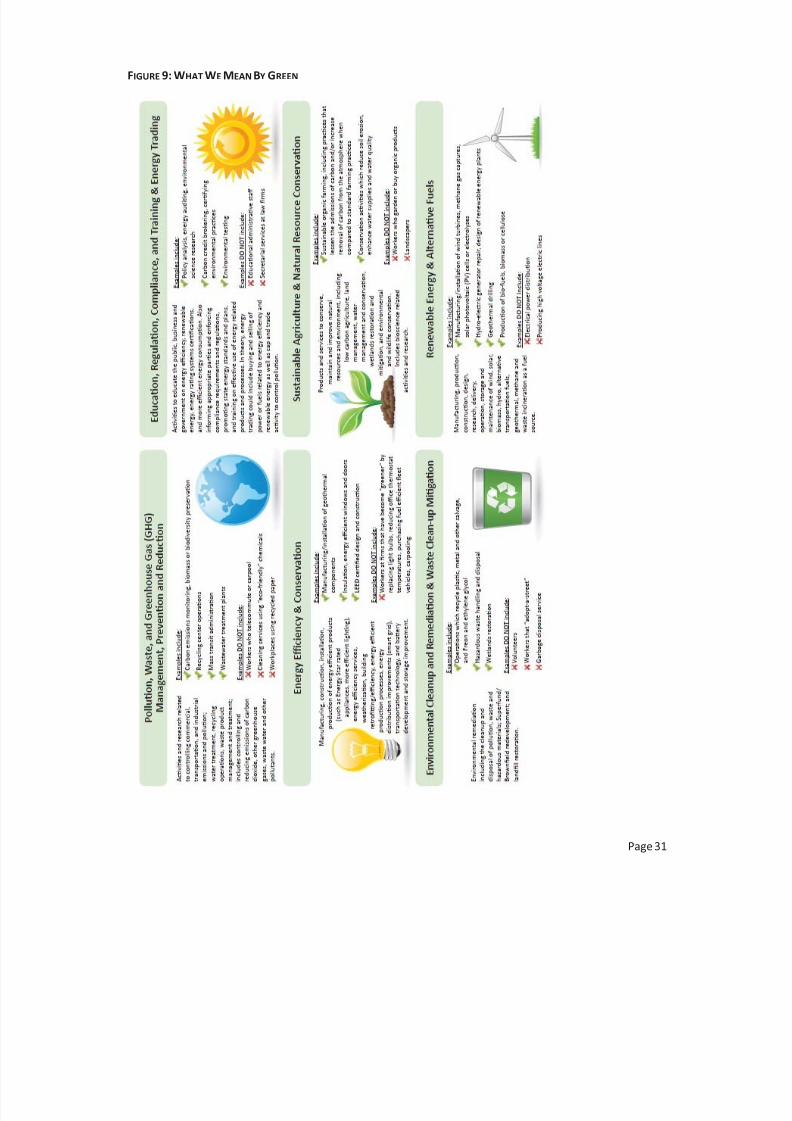
The back side of the cover letter was an il lustration of “What We Mean by Green,” which was also util ized
by the Consortium. (See Appendix 2 to view the survey instrument.)
Distribution
The survey was mailed in an envelope with the CDLE and Leeds School of Business logos in the return-
address area. A postage-paid return envelope accompanied the survey. Surveys were mailed first class in
order to capture return-to-sender address changes. (See Appendix 2 to view the survey instrument.)
An Excel-based version of the survey was posted on the website as a convenient alternative option created
for companies with multiple entities.
A pre-notification postcard informing respondents of the impending survey was mailed to all sample units
in December 2010. The survey was mailed in January 2011, with a follow-up sent in February and a final
request for information in March.
The Leeds School of Business hosted a webpage for the green jobs survey
(leeds.colorado.edu/greenjobssurvey), which outlined the purpose of the study and provided contact
information, descriptions of green jobs, and a link to the online survey.
Defining Green Jobs
The green jobs survey based its definition on the categorization of green occupations put forward by the
BLS. According to the BLS, green jobs are either:
1) Jobs in businesses that produce goods or provide s ervices that benefit the environment or conserve
natural resources.
2) Jobs in which workers’ duties involve making their establishment’s production processes more
environmentally friendly or use fewer natural resources.2
From these larger categories, BLS constructed six occupational function descriptions, which were then used
to inform Colorado’s green jobs survey respondents.
Those functions are:
2Bureau of Labor Statistics . “ Overview of the BLS Green Jobs Ini tiative, Developing the Green Jobs Definiti on.”
www.bls.gov/green, access ed May 27, 2011.

8/4/2019 Green Jobs Survey Report
http://slidepdf.com/reader/full/green-jobs-survey-report 14/40
Page 8
x Pollution, waste, and greenhouse gas management, prevention, and reduction.
x Energy efficiency and conservation.
x Environmental clean-up and remediation and waste clean-up mitigation.
x Renewable energy and alternative fuels.
x Education, regulation, compliance and training, and energy trading.
x Sustainable agriculture and natural resource conservation.3
These six green categories, along with the guidance provided to respondents to identify green jobs,4
represent the current categorization of green economic activity as determined by BLS, the study’s funding
authority. These categories and associated guidelines were formulated, in part, to collect data that wil l help
further clarify green job definitions for future research. The intent of this survey, and the definitions used in
it, is to gather information on jobs that fall into the green categories. It is not intended to capture green
practices, volunteerism, or marketing efforts. That is, the job itself must have, as part of its function, paid
activities that produce an environmentally friendly product or service . For example, an employee who
voluntarily recycles office paper while on the job would not, based solely on that criterion and for the
purpose of this study, be considered a green job. Conversely, an electrician who installs photovoltaic cells
would be considered a green job. Any attempt to collect and measure various ancillary green efforts that
employees engage in at their jobs would greatly overstate the estimate of green jobs.
Furthermore, because the green jobs survey was constructed and delivered as a point-in-time survey of
existing green jobs and wages, the data collected cannot be interpreted to determine any relative growth
or decline in the number or quality of jobs in Colorado over a period of time.
Calculating Margins of Error
Two methods were uti lized for calculating the margin of error: one for analys es for the primary sampling
units (firms), and one for analysis based on the secondary sampling units (jobs).5
The margin of error for the firms was a simple estimate of the standard error of a proportion:
3Bureau of Labor Statistics . “Overview of the BLS Green Jobs Ini tiative, the BLS Green Jobs Definiti on.”
www.bls.gov/green, access ed May 27, 2011.
4“What we Mean by Green” document in Appendix 2.
5Lohr, Sharon L. (1999). Sampling: Design and Analysis, Brooks/Cole, p. 61.
8/4/2019 Green Jobs Survey Report
http://slidepdf.com/reader/full/green-jobs-survey-report 15/40
Page 9
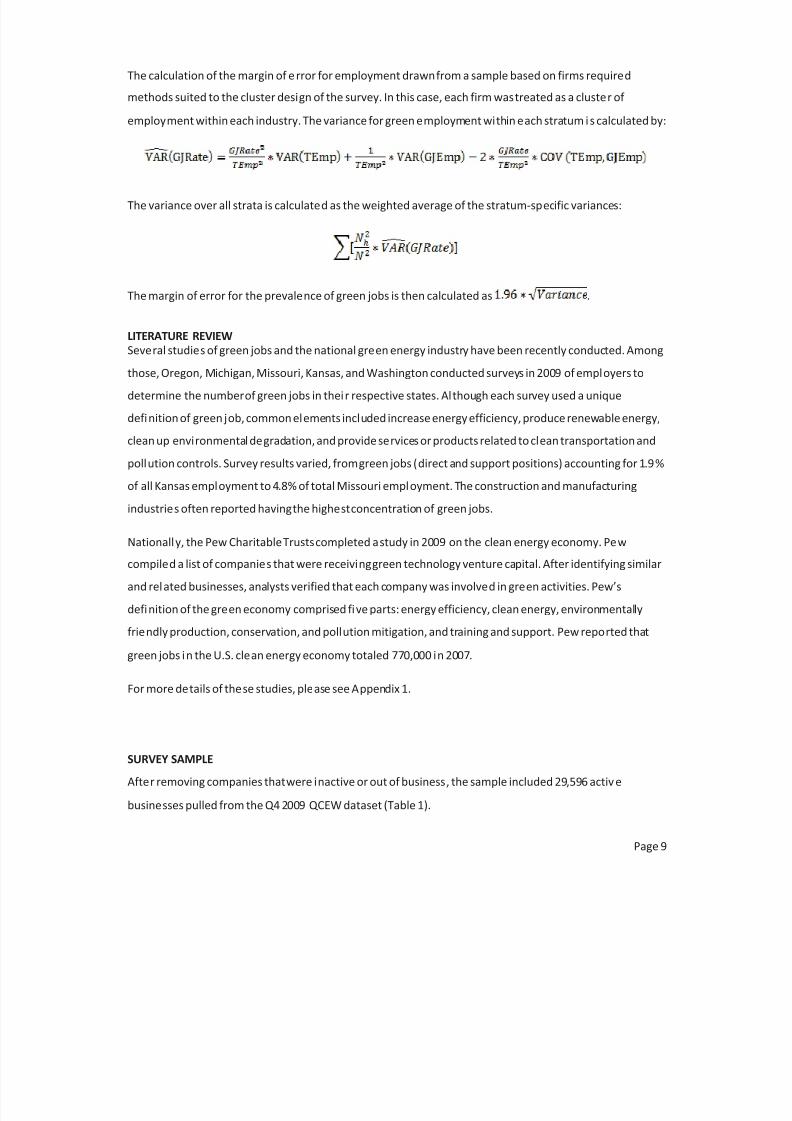
The calculation of the margin of e rror for employment drawn from a sample based on firms required
methods suited to the cluster design of the survey. In this case, each firm was treated as a cluster of
employment within each industry. The variance for green employment within each stratum is calculated by:
The variance over all strata is calculated as the weighted average of the stratum-specific variances:
The margin of error for the prevalence of green jobs is then calculated as .
LITERATURE REVIEWSeveral studies of green jobs and the national green energy industry have been recently conducted. Among
those, Oregon, Michigan, Missouri, Kansas, and Washington conducted surveys in 2009 of employers to
determine the number of green jobs in their respective states. Although each survey used a unique
definition of green job, common elements included increase energy efficiency, produce renewable energy,
clean up environmental degradation, and provide services or products related to clean transportation and
pollution controls. Survey results varied, from green jobs (direct and support positions) accounting for 1.9%
of all Kansas employment to 4.8% of total Missouri employment. The construction and manufacturing
industries often reported having the highest concentration of green jobs.
Nationally, the Pew Charitable Trusts completed a study in 2009 on the clean energy economy. Pew
compiled a list of companies that were receiving green technology venture capital. After identifying similar
and related businesses, analysts verified that each company was involved in green activities. Pew’s
definition of the green economy comprised five parts: energy efficiency, clean energy, environmentally
friendly production, conservation, and pollution mitigation, and training and support. Pew reported that
green jobs in the U.S. clean energy economy totaled 770,000 in 2007.
For more details of these studies, please see Appendix 1.
SURVEY SAMPLE
After removing companies that were inactive or out of business, the sample included 29,596 activ e
businesses pulled from the Q4 2009 QCEW dataset (Table 1).
8/4/2019 Green Jobs Survey Report
http://slidepdf.com/reader/full/green-jobs-survey-report 16/40
Page 10
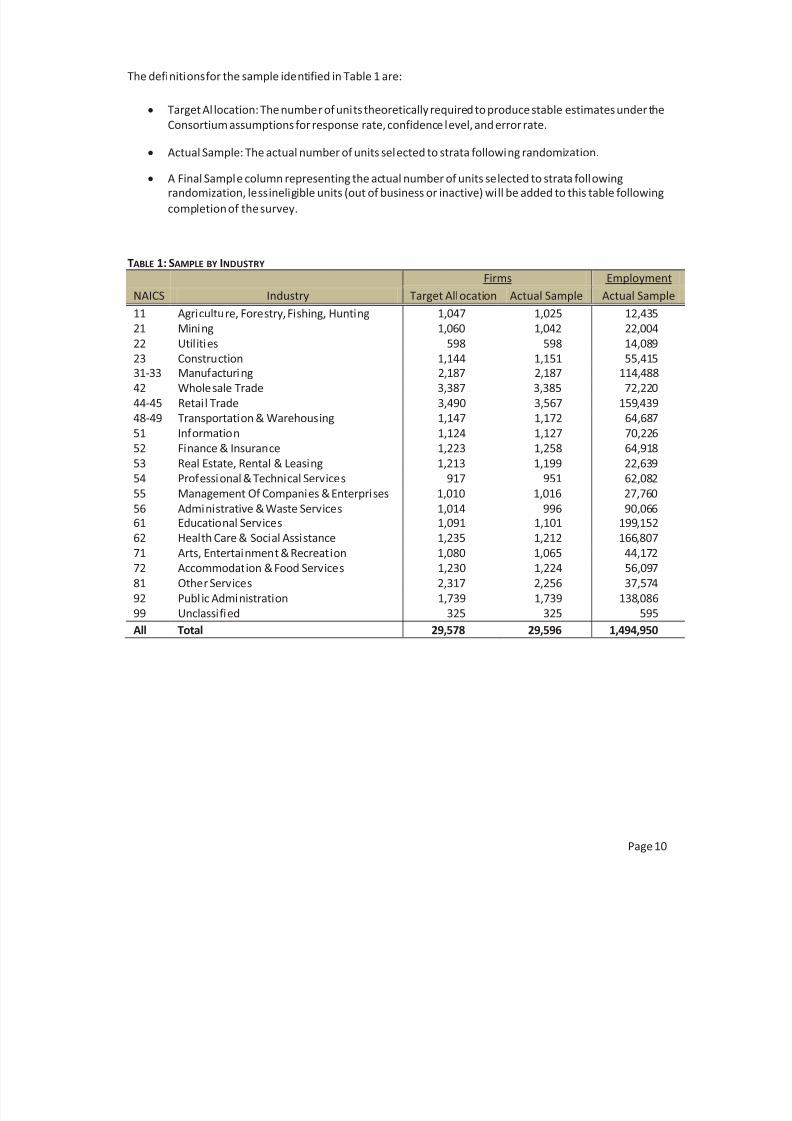
The definitions for the sample identified in Table 1 are:
x Target Al location: The number of units theoretically required to produce stable estimates under the
Consortium assumptions for response rate, confidence level, and error rate.
x Actual Sample: The actual number of units selected to strata following randomization.
x A Final Sample column representing the actual number of units selected to strata followingrandomization, less ineligible units (out of business or inactive) will be added to this table following
completion of the survey.
TABLE 1: SAMPLE BY INDUSTRY
NAICS Industry
Firms Employment
Target Allocation Actual Sample Actual Sample
11 Agriculture, Forestry, Fishing, Hunting 1,047 1,025 12,435
21 Mining 1,060 1,042 22,004
22 Utilities 598 598 14,08923 Construction 1,144 1,151 55,41531-33 Manufacturing 2,187 2,187 114,488
42 Wholesale Trade 3,387 3,385 72,220
44-45 Retail Trade 3,490 3,567 159,439
48-49 Transportation & Warehousing 1,147 1,172 64,687
51 Information 1,124 1,127 70,226
52 Finance & Insurance 1,223 1,258 64,918
53 Real Estate, Rental & Leasing 1,213 1,199 22,639
54 Professional & Technical Services 917 951 62,082
55 Management Of Companies & Enterprises 1,010 1,016 27,760
56 Administrative & Waste Services 1,014 996 90,06661 Educational Services 1,091 1,101 199,152
62 Health Care & Social Assistance 1,235 1,212 166,807
71 Arts, Entertainment & Recreation 1,080 1,065 44,172
72 Accommodation & Food Services 1,230 1,224 56,097
81 Other Services 2,317 2,256 37,574
92 Publ ic Administration 1,739 1,739 138,086
99 Unclassified 325 325 595
All Total 29,578 29,596 1,494,950
8/4/2019 Green Jobs Survey Report
http://slidepdf.com/reader/full/green-jobs-survey-report 17/40
Page 11
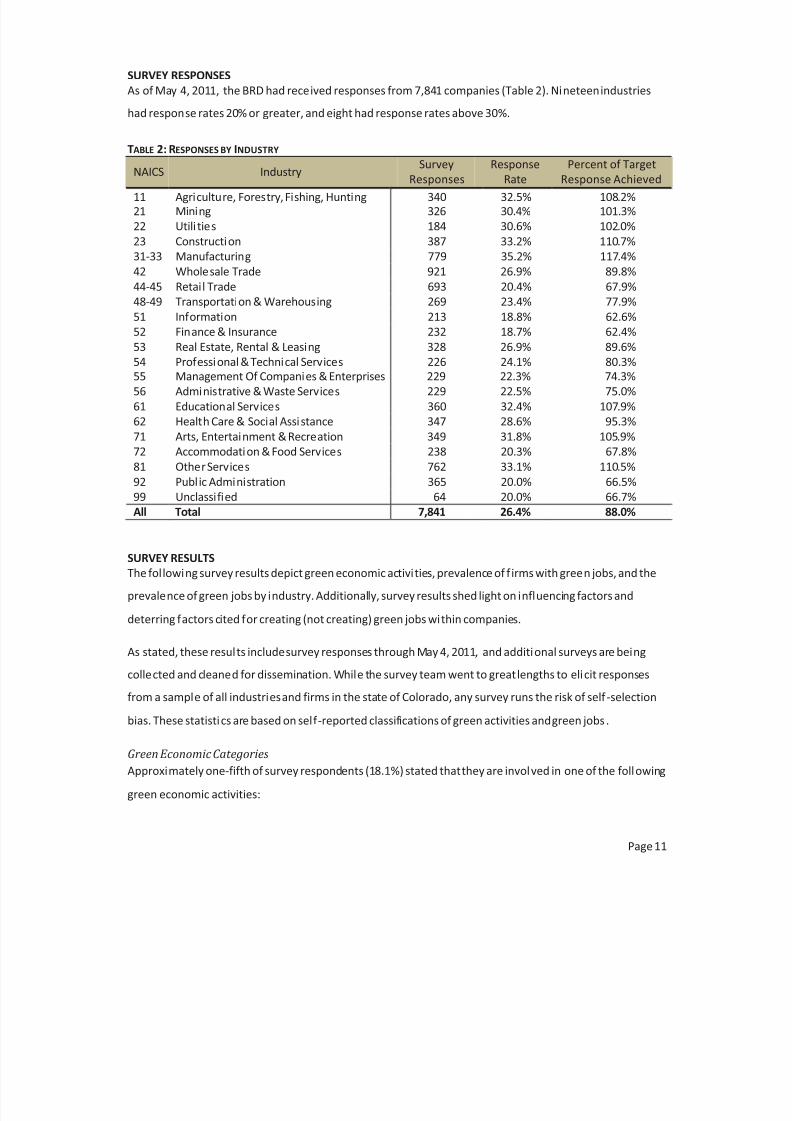
SURVEY RESPONSES
As of May 4, 2011, the BRD had received responses from 7,841 companies (Table 2). Nineteen industries
had response rates 20% or greater, and eight had response rates above 30%.
TABLE 2: RESPONSES BY INDUSTRY
NAICS Industry SurveyResponses ResponseRate Percent of TargetResponse Achieved
11 Agriculture, Forestry, Fishing, Hunting 340 32.5% 108.2%21 Mining 326 30.4% 101.3%
22 Utili ties 184 30.6% 102.0%
23 Construction 387 33.2% 110.7%
31-33 Manufacturing 779 35.2% 117.4%
42 Wholesale Trade 921 26.9% 89.8%
44-45 Retail Trade 693 20.4% 67.9%
48-49 Transportation & Warehousing 269 23.4% 77.9%
51 Information 213 18.8% 62.6%
52 Finance & Insurance 232 18.7% 62.4%
53 Real Estate, Rental & Leasing 328 26.9% 89.6%
54 Professional & Technical Services 226 24.1% 80.3%55 Management Of Companies & Enterprises 229 22.3% 74.3%
56 Administrative & Waste Services 229 22.5% 75.0%
61 Educational Services 360 32.4% 107.9%
62 Health Care & Social Assistance 347 28.6% 95.3%
71 Arts, Entertainment & Recreation 349 31.8% 105.9%
72 Accommodation & Food Services 238 20.3% 67.8%
81 Other Services 762 33.1% 110.5%
92 Public Administration 365 20.0% 66.5%
99 Unclassified 64 20.0% 66.7%
All Total 7,841 26.4% 88.0%
SURVEY RESULTS
The following survey results depict green economic activities, prevalence of firms with green jobs, and the
prevalence of green jobs by industry. Additionally, survey results shed light on influencing factors and
deterring factors cited for creating (not creating) green jobs within companies.
As stated, these results include survey responses through May 4, 2011, and additional surveys are being
collected and cleaned for dissemination. While the survey team went to great lengths to elicit responses
from a sample of all industries and firms in the state of Colorado, any survey runs the risk of self -selection
bias. These statistics are based on self-reported classifications of green activities and green jobs .
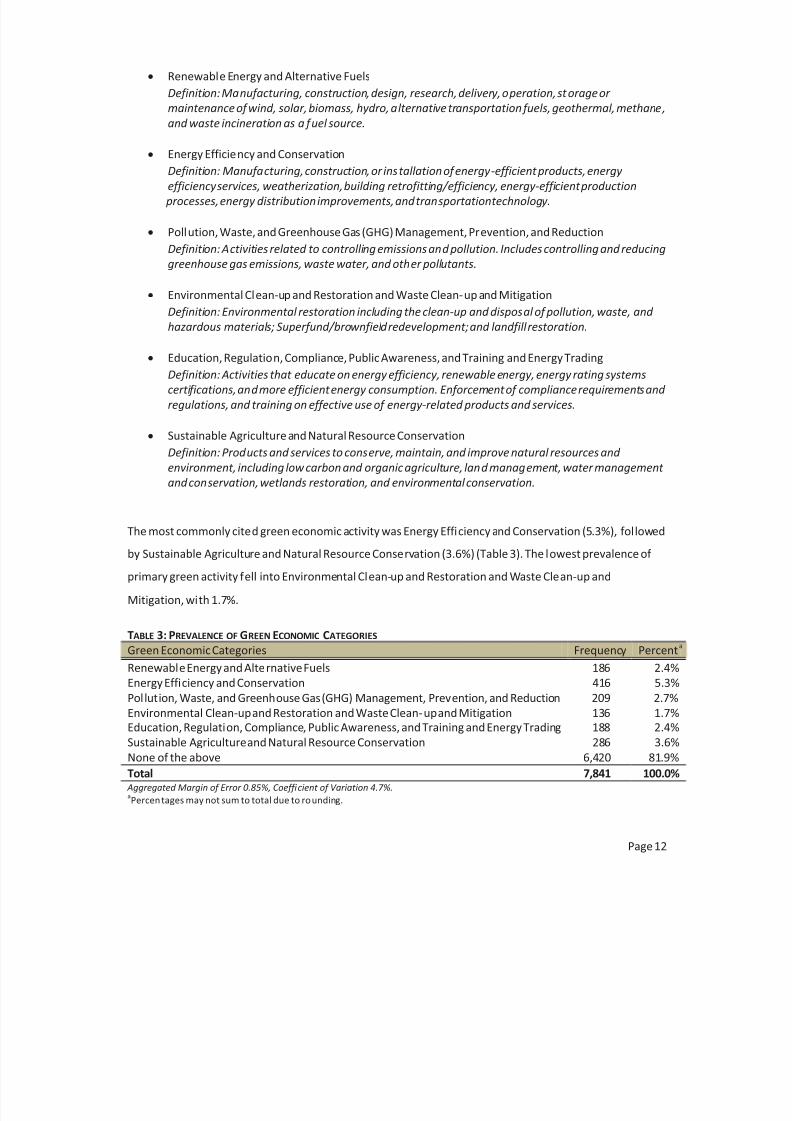
Green Economic Categories
Approximately one-fifth of survey respondents (18.1%) stated that they are involved in one of the following
green economic activities:
8/4/2019 Green Jobs Survey Report
http://slidepdf.com/reader/full/green-jobs-survey-report 18/40
Page 12
x Renewable Energy and Alternative Fuels
Definition: Manufacturing, construction, design, research, delivery, operation, storage or
maintenance of wind, solar, biomass, hydro, alternative transportation fuels, geothermal, methane,
and waste incineration as a fuel source.
x Energy Efficiency and Conservation
Definition: Manufacturing, construction, or installation of energy-efficient products, energy efficiency services, weatherization, building retrofitting/efficiency, energy-efficient production
processes, energy distribution improvements, and transportation technology.
x Pollution, Waste, and Greenhouse Gas (GHG) Management, Prevention, and Reduction
Definition: Activities related to controlling emissions and pollution. Includes controlling and reducing
greenhouse gas emissions, waste water, and other pollutants.
x Environmental Clean-up and Restoration and Waste Clean-up and Mitigation
Definition: Environmental restoration including the clean-up and disposal of pollution, waste, and
hazardous materials; Superfund/brownfield redevelopment; and landfill restoration.
x Education, Regulation, Compliance, Public Awareness, and Training and Energy Trading
Definition: Activities that educate on energy efficiency, renewable energy, energy rating systems
certifications, and more efficient energy consumption. Enforcement of compliance requirements and
regulations, and training on effective use of energy-related products and services.
x Sustainable Agriculture and Natural Resource Conservation
Definition: Products and services to conserve, maintain, and improve natural resources and
environment, including low carbon and organic agriculture, land management, water management
and conservation, wetlands restoration, and environmental conservation.
The most commonly cited green economic activity was Energy Efficiency and Conservation (5.3%), followed
by Sustainable Agriculture and Natural Resource Conservation (3.6%) (Table 3). The lowest prevalence of
primary green activity fell into Environmental Clean-up and Restoration and Waste Clean-up and
Mitigation, with 1.7%.
TABLE 3: PREVALENCE OF GREEN ECONOMIC CATEGORIES
Green Economic Categories Frequency Percenta
Renewable Energy and Alternative Fuels 186 2.4%
Energy Efficiency and Conservation 416 5.3%Pollution, Waste, and Greenhouse Gas (GHG) Management, Prevention, and Reduction 209 2.7%
Environmental Clean-up and Restoration and Waste Clean-up and Mitigation 136 1.7%Education, Regulation, Compliance, Public Awareness, and Training and Energy Trading 188 2.4%
Sustainable Agriculture and Natural Resource Conservation 286 3.6%
None of the above 6,420 81.9%
Total 7,841 100.0% Aggregated Margin of Error 0.85%, Coefficient of Variation 4.7%.aPercentages may not sum to total due to rounding.

8/4/2019 Green Jobs Survey Report
http://slidepdf.com/reader/full/green-jobs-survey-report 19/40
Page 13
Industry-specific results showed that businesses in the Agriculture sector indicated that their overall involvement in green activities is greater than
35% (Table 4). More than 30% of the surveyed employers in both the Utili ties sector and the Construction sector reported that they engaged in some
economic activity that fell into one of the green economic categories. A relatively hi gh percentage of business units in the Publi c Administration
sector indicated that they were involved in one of the green economic activities (27.4%). The lowest incidence of business un its reporting green
activity fel l in the Finance and Insurance sector and the Information sector, with 3.4% and 8.9%, respectively.
TABLE 4: GREEN ECONOMIC CATEGORIES, BY INDUSTRY
NAICS Industry Renewable Efficiency PollutionClean-up Education Sustainable
AnyCategory NA
TotCou
11 Agriculture, Forestry, Fishing, Hunting 3.2% 1.8% 1.2% 0.6% 0.3% 30.6% 37.6% 62.4% 34
21 Mining 4.6% 0.9% 3.1% 4.0% 1.2% 0.9% 14.7% 85.3% 32
22 Utilities 7.6% 3.3% 7.6% 0.5% 8.2% 6.0% 33.2% 66.8% 18
23 Construction 4.7% 25.1% 1.3% 1.6% 0.8% 0.3% 33.6% 66.4% 38
31-33 Manufacturing 3.6% 5.4% 3.7% 1.9% 1.2% 3.3% 19.1% 80.9% 77
42 Wholesale Trade 3.8% 6.8% 1.8% 1.2% 0.8% 3.8% 18.2% 81.8% 9244-45 Retail Trade 1.2% 4.6% 1.4% 1.2% 1.4% 1.6% 11.4% 88.6% 69
48-49 Transportation & Warehousing 3.7% 3.3% 3.7% 3.3% 0.4% 1.5% 16.0% 84.0% 26
51 Information 0.0% 1.4% 1.4% 0.0% 5.2% 0.9% 8.9% 91.1% 21
52 Finance & Insurance 0.0% 1.3% 0.4% 0.0% 0.4% 1.3% 3.4% 96.6% 23
53 Real Estate, Rental & Leasing 1.2% 9.1% 0.9% 0.3% 2.1% 1.2% 14.9% 85.1% 32
54 Professional & Technical Services 3.5% 6.2% 2.7% 2.2% 3.1% 0.9% 18.6% 81.4% 22
55 Management Of Companies & Enterprises 2.2% 3.5% 2.2% 2.2% 0.9% 2.2% 13.1% 86.9% 22
56 Administrative & Waste Services 0.9% 2.2% 1.3% 4.8% 1.3% 5.7% 16.2% 83.8% 22
61 Educational Services 0.6% 3.6% 0.3% 1.4% 13.1% 0.6% 19.4% 80.6% 36
62 Health Care & Social Assistance 0.6% 2.6% 1.2% 3.7% 1.4% 0.3% 9.8% 90.2% 34
71 Arts, Entertainment & Recreation 1.4% 3.2% 1.7% 1.1% 1.4% 3.2% 12.0% 88.0% 3472 Accommodation & Food Services 0.8% 4.6% 1.3% 1.7% 1.3% 2.5% 12.2% 87.8% 23
81 Other Services 1.3% 4.5% 7.7% 2.1% 2.4% 1.7% 19.7% 80.3% 76
92 Public Administration 1.6% 4.4% 4.1% 1.9% 7.7% 7.7% 27.4% 72.6% 36
99 Unclassified 1.6% 1.6% 1.6% 0.0% 1.6% 1.6% 7.8% 92.2% 6
All Total 2.4% 5.3% 2.7% 1.7% 2.4% 3.6% 18.1% 81.9% 7,84
8/4/2019 Green Jobs Survey Report
http://slidepdf.com/reader/full/green-jobs-survey-report 20/40
Page 14
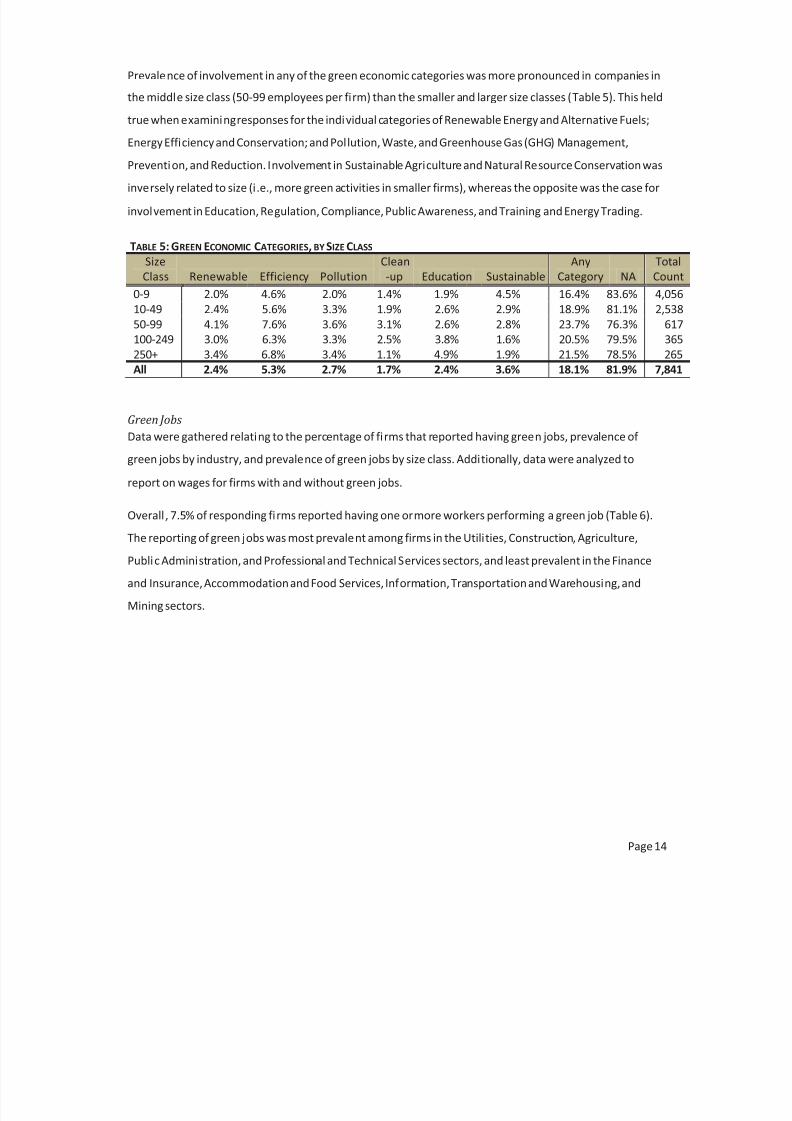
Prevalence of involvement in any of the green economic categories was more pronounced in companies in
the middle size class (50-99 employees per firm) than the smaller and larger size classes (Table 5). This held
true when examining responses for the individual categories of Renewable Energy and Alternative Fuels;
Energy Efficiency and Conservation; and Pollution, Waste, and Greenhouse Gas (GHG) Management,
Prevention, and Reduction. Involvement in Sustainable Agriculture and Natural Resource Conservation wasinversely related to size (i.e., more green activities in smaller firms), whereas the opposite was the case for
involvement in Education, Regulation, Compliance, Public Awareness, and Training and Energy Trading.
TABLE 5: GREEN ECONOMIC CATEGORIES, BY SIZE CLASS
Size
Class Renewable Efficiency Pollution
Clean
-up Education Sustainable
Any
Category NA
Total
Count
0-9 2.0% 4.6% 2.0% 1.4% 1.9% 4.5% 16.4% 83.6% 4,056
10-49 2.4% 5.6% 3.3% 1.9% 2.6% 2.9% 18.9% 81.1% 2,538
50-99 4.1% 7.6% 3.6% 3.1% 2.6% 2.8% 23.7% 76.3% 617
100-249 3.0% 6.3% 3.3% 2.5% 3.8% 1.6% 20.5% 79.5% 365250+ 3.4% 6.8% 3.4% 1.1% 4.9% 1.9% 21.5% 78.5% 265
All 2.4% 5.3% 2.7% 1.7% 2.4% 3.6% 18.1% 81.9% 7,841
Green Jobs
Data were gathered relating to the percentage of firms that reported having green jobs, prevalence of
green jobs by industry, and prevalence of green jobs by size class. Additionally, data were analyzed to
report on wages for firms with and without green jobs.
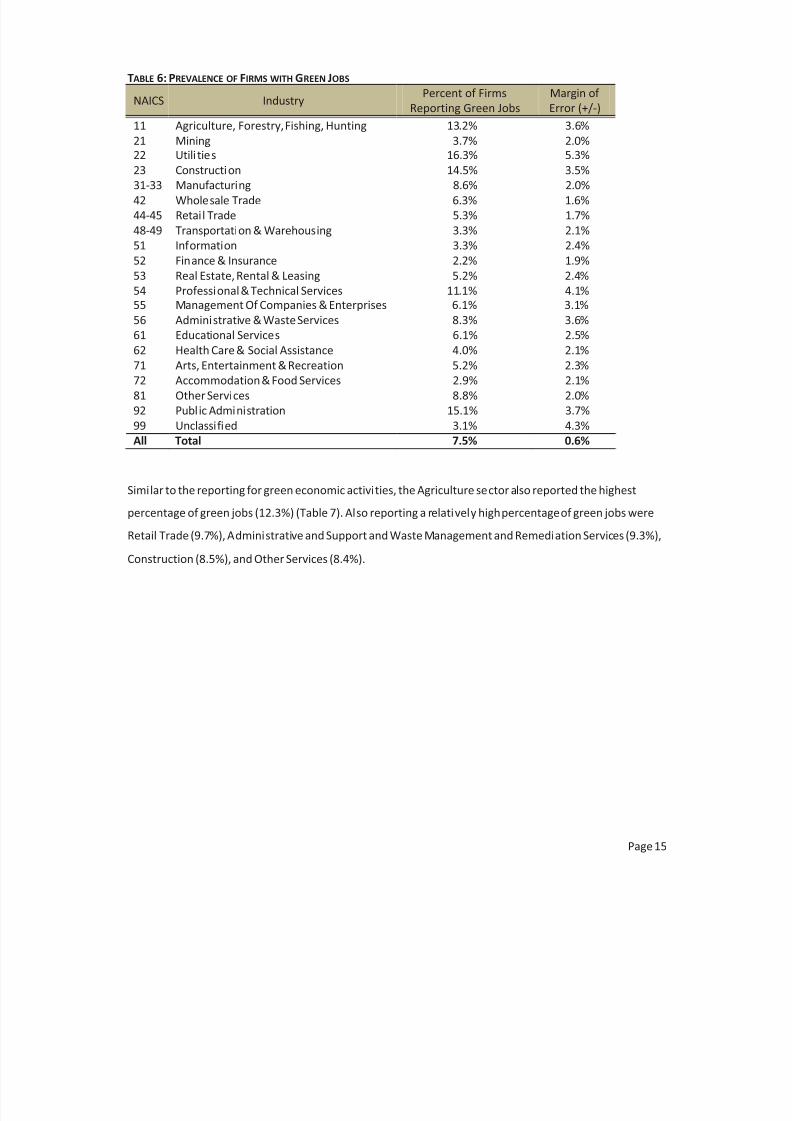
Overall , 7.5% of responding firms reported having one or more workers performing a green job (Table 6).
The reporting of green jobs was most prevalent among firms in the Utilities, Construction, Agriculture,
Public Administration, and Professional and Technical Services sectors, and least prevalent in the Finance
and Insurance, Accommodation and Food Services, Information, Transportation and Warehousing, and
Mining sectors.
8/4/2019 Green Jobs Survey Report
http://slidepdf.com/reader/full/green-jobs-survey-report 21/40
Page 15
TABLE 6: PREVALENCE OF FIRMS WITH GREEN JOBS
NAICS IndustryPercent of Firms
Reporting Green Jobs
Margin of
Error (+/-)
11 Agriculture, Forestry, Fishing, Hunting 13.2% 3.6%
21 Mining 3.7% 2.0%22 Utili ties 16.3% 5.3%
23 Construction 14.5% 3.5%31-33 Manufacturing 8.6% 2.0%
42 Wholesale Trade 6.3% 1.6%
44-45 Retail Trade 5.3% 1.7%
48-49 Transportation & Warehousing 3.3% 2.1%
51 Information 3.3% 2.4%
52 Finance & Insurance 2.2% 1.9%
53 Real Estate, Rental & Leasing 5.2% 2.4%
54 Professional & Technical Services 11.1% 4.1%55 Management Of Companies & Enterprises 6.1% 3.1%
56 Administrative & Waste Services 8.3% 3.6%
61 Educational Services 6.1% 2.5%62 Health Care & Social Assistance 4.0% 2.1%
71 Arts, Entertainment & Recreation 5.2% 2.3%
72 Accommodation & Food Services 2.9% 2.1%
81 Other Services 8.8% 2.0%
92 Public Administration 15.1% 3.7%
99 Unclassified 3.1% 4.3%
All Total 7.5% 0.6%
Similar to the reporting for green economic activities, the Agriculture sector also reported the highest
percentage of green jobs (12.3%) (Table 7). Also reporting a relatively high percentage of green jobs were
Retail Trade (9.7%), Administrative and Support and Waste Management and Remediation Services (9.3%),
Construction (8.5%), and Other Services (8.4%).

8/4/2019 Green Jobs Survey Report
http://slidepdf.com/reader/full/green-jobs-survey-report 22/40
Page 16
TABLE 7: PREVALENCE OF GREEN JOBS
NAICS Industry Green Jobs Total Jobs Percentage
Colorado Total
Employment
Estimated
Green Jobs
Margin of
Error (+/-)
11 Agriculture, Forestry, Fishing, Hunting 369 3,001 12.3% 13,229 1,626 0.37%
21 Mining 58 4,430 1.3% 25,060 328 0.07%
22 Util ities 118 5,759 2.0% 14,190 291 0.13%
23 Construction 1,004 11,834 8.5% 118,173 10,026 0.19%
31-33 Manufacturing 843 25,910 3.3% 127,163 4,137 0.04%42 Wholesale Trade 301 19,088 1.6% 87,854 1,385 0.02%
44-45 Retail Trade 1,284 13,302 9.7% 242,743 23,431 0.58%
48-49 Transportation & Warehousing 242 8,097 3.0% 71,862 2,148 0.16%
51 Information 47 14,236 0.3% 71,259 235 0.03%
52 Finance & Insurance 56 10,870 0.5% 98,332 507 0.05%
53 Real Estate, Rental & Leasing 77 6,821 1.1% 41,996 474 0.05%
54 Professional & Technical Servi ces 244 12,103 2.0% 166,941 3,359 0.10%
55 Management Of Companies & Enterprises 173 8,750 2.0% 28,430 562 0.13%
56 Administrative & Waste Services 1,647 17,783 9.3% 133,104 12,328 0.91%
61 Educational Services 162 43,176 0.4% 202,234 759 0.02%
62 Health Care & Social Assistance 73 38,260 0.2% 264,112 507 0.01%
71 Arts, Entertainment & Recreation 245 13,632 1.8% 46,553 837 0.07%
72 Accommodation & Food Services 108 10,246 1.1% 217,984 2,298 0.07%81 Other Services 829 9,839 8.4% 65,035 5,479 0.25%
92 Publ ic Administration 603 23,597 2.6% 138,189 3,531 0.15%
99 Unclassi fied 8 782 1.0% 173 2 0.28%
All Total 8,491 301,516 2.8% 2,174,614 61,239 0.07%
8/4/2019 Green Jobs Survey Report
http://slidepdf.com/reader/full/green-jobs-survey-report 23/40
Page 17
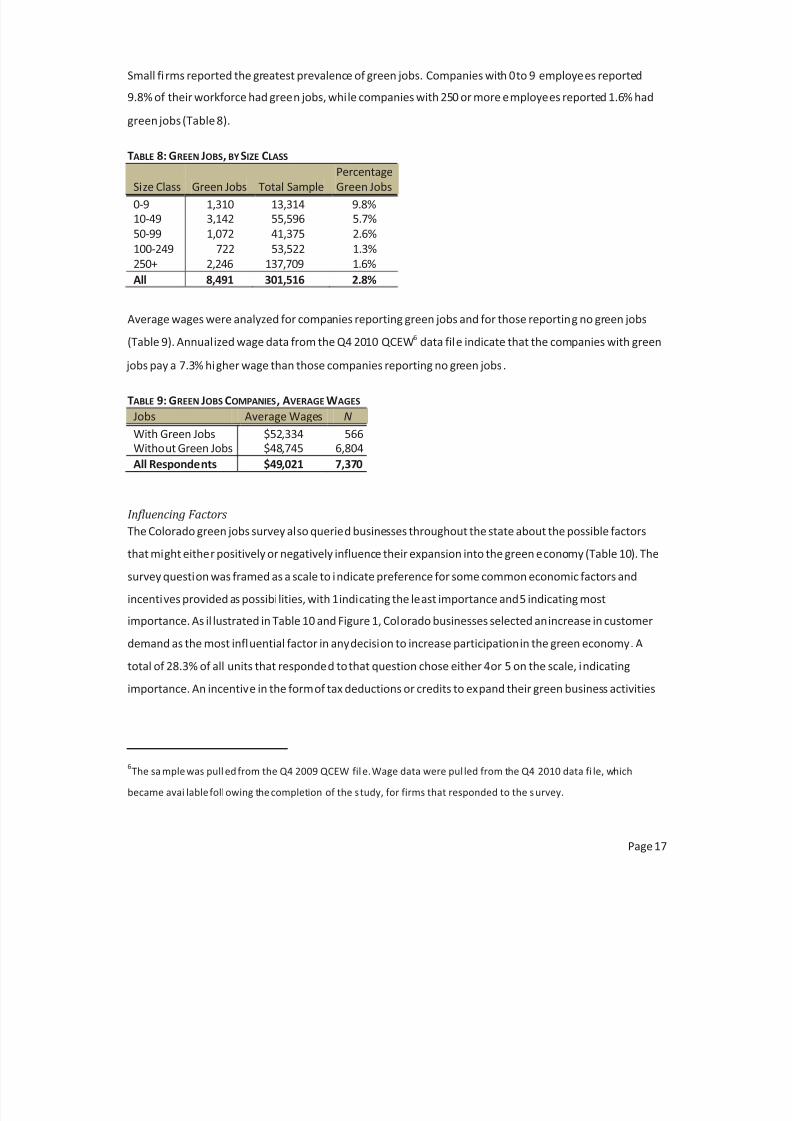
Small fi rms reported the greatest prevalence of green jobs. Companies with 0 to 9 employees reported
9.8% of their workforce had green jobs, while companies with 250 or more employees reported 1.6% had
green jobs (Table 8).
TABLE 8: GREEN JOBS, BY SIZE CLASS
Size Class Green Jobs Total SamplePercentageGreen Jobs
0-9 1,310 13,314 9.8%10-49 3,142 55,596 5.7%
50-99 1,072 41,375 2.6%
100-249 722 53,522 1.3%
250+ 2,246 137,709 1.6%
All 8,491 301,516 2.8%
Average wages were analyzed for companies reporting green jobs and for those reporting no green jobs
(Table 9). Annualized wage data from the Q4 2010 QCEW6 data file indicate that the companies with green
jobs pay a 7.3% higher wage than those companies reporting no green jobs.
TABLE 9: GREEN JOBS COMPANIES, AVERAGE WAGES
Jobs Average Wages N
With Green Jobs $52,334 566Without Green Jobs $48,745 6,804
All Respondents $49,021 7,370
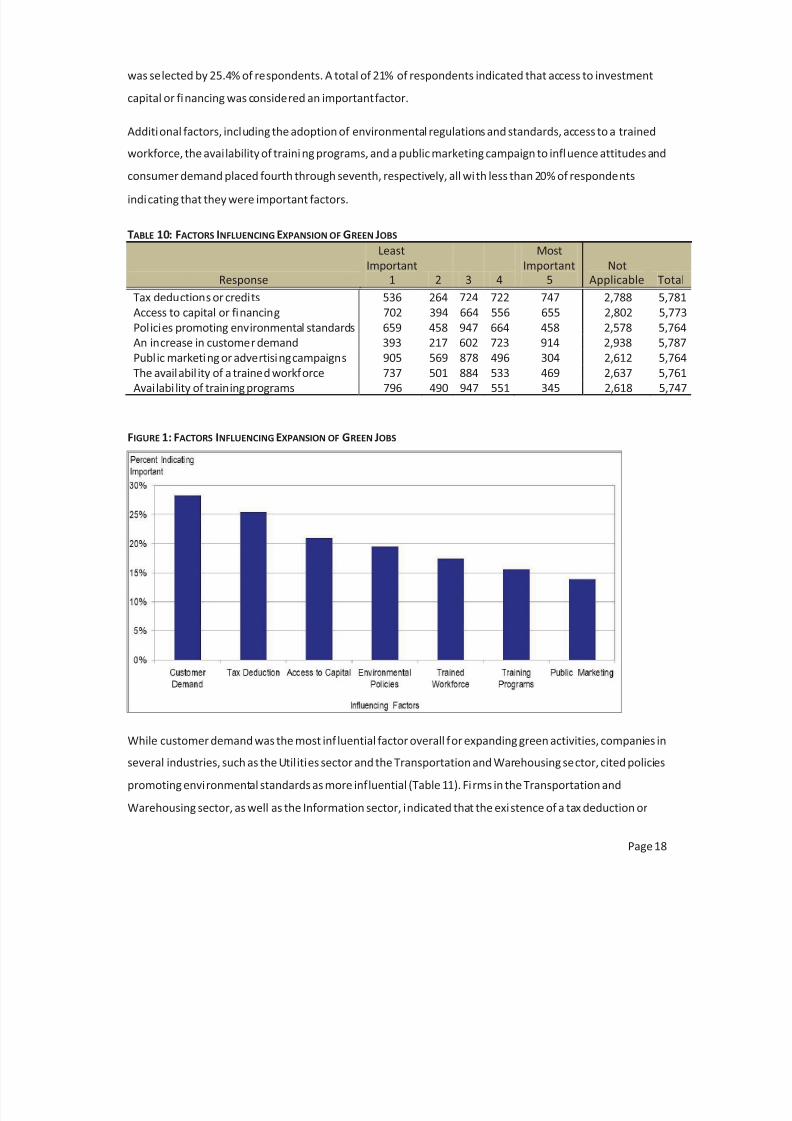
Influencing Factors
The Colorado green jobs survey also queried businesses throughout the state about the possible factors
that might either positively or negatively influence their expansion into the green economy (Table 10). The
survey question was framed as a scale to indicate preference for some common economic factors and
incentives provided as possibilities, with 1 indicating the least importance and 5 indicating most
importance. As il lustrated in Table 10 and Figure 1, Colorado businesses selected an increase in customer
demand as the most influential factor in any decision to increase participation in the green economy. A
total of 28.3% of all units that responded to that question chose either 4 or 5 on the scale, indicating
importance. An incentive in the form of tax deductions or credits to expand their green business activities
6The sa mple was pull ed from the Q4 2009 QCEW fil e. Wage data were pul led from the Q4 2010 data fi le, which
became avai lable foll owing the completion of the study, for firms that responded to the s urvey.
8/4/2019 Green Jobs Survey Report
http://slidepdf.com/reader/full/green-jobs-survey-report 24/40
Page 18
was selected by 25.4% of respondents. A total of 21% of respondents indicated that access to investment
capital or financing was considered an important factor.
Additional factors, including the adoption of environmental regulations and standards, access to a trained
workforce, the availability of training programs, and a public marketing campaign to influence attitudes and
consumer demand placed fourth through seventh, respectively, all with less than 20% of respondents
indicating that they were important factors.
TABLE 10: FACTORS INFLUENCING EXPANSION OF GREEN JOBS
Response
Least
Important1 2 3 4
Most
Important5
NotApplicable Total
Tax deductions or credits 536 264 724 722 747 2,788 5,781
Access to capital or financing 702 394 664 556 655 2,802 5,773
Policies promoting environmental standards 659 458 947 664 458 2,578 5,764
An increase in customer demand 393 217 602 723 914 2,938 5,787Public marketing or advertising campaigns 905 569 878 496 304 2,612 5,764
The availabil ity of a trained workforce 737 501 884 533 469 2,637 5,761
Availabi lity of training programs 796 490 947 551 345 2,618 5,747
FIGURE 1: FACTORS INFLUENCING EXPANSION OF GREEN JOBS
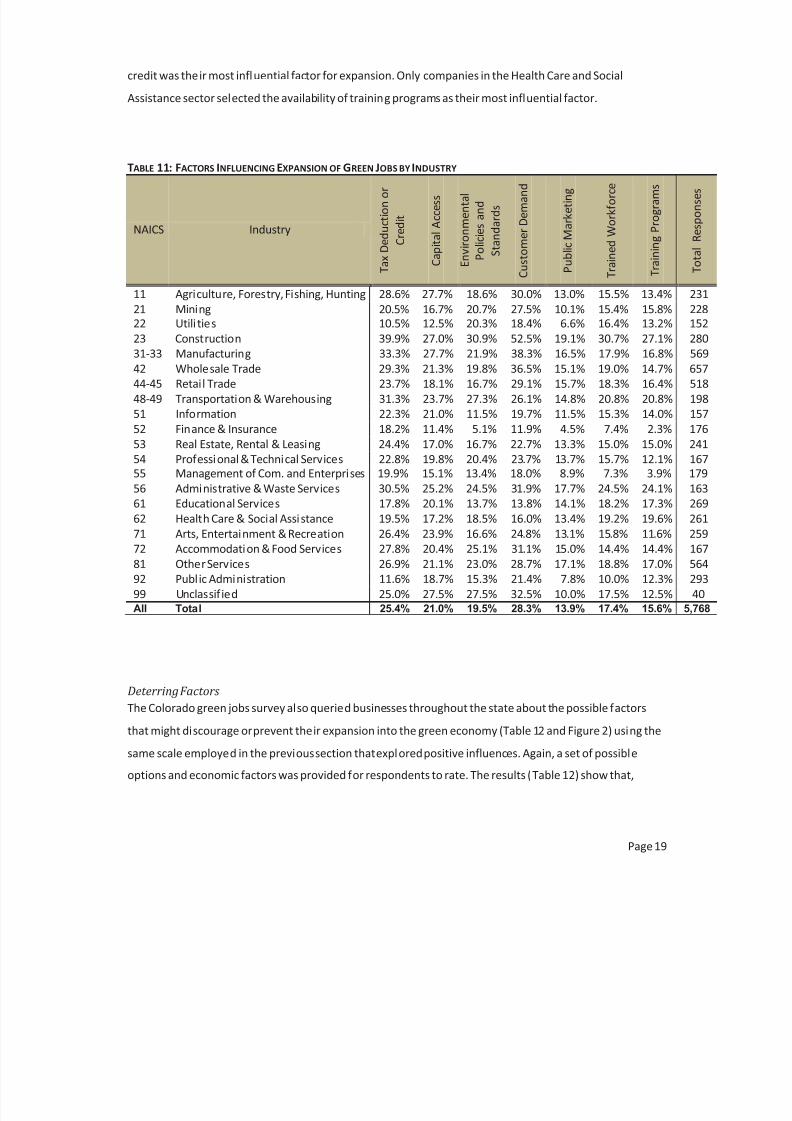
While customer demand was the most inf luential factor overall for expanding green activities, companies in
several industries, such as the Utilities sector and the Transportation and Warehousing sector, cited policies
promoting environmental standards as more influential (Table 11). Firms in the Transportation and
Warehousing sector, as well as the Information sector, indicated that the existence of a tax deduction or
8/4/2019 Green Jobs Survey Report
http://slidepdf.com/reader/full/green-jobs-survey-report 25/40
Page 19
credit was their most influential factor for expansion. Only companies in the Health Care and Social
Assistance sector selected the availability of training programs as their most influential factor.
TABLE 11: FACTORS INFLUENCING EXPANSION OF GREEN JOBS BY INDUSTRY
NAICS Industry
T a x D e d u c t i o n o r
C r e d i t
C a p i t a l A c c e s s
E n v i r o n m e n t a l
P o l i c i e s a n d
S t a n d a r d s
C u s t o m e r D e m a n d
P u b l i c M a r k e t i n g
T r a i n e d W o r k f o r c e
T r a i n i n g P r o g r a m s
T o t a l R e s p o n s e s
11 Agriculture, Forestry, Fishing, Hunting 28.6% 27.7% 18.6% 30.0% 13.0% 15.5% 13.4% 2
21 Mining 20.5% 16.7% 20.7% 27.5% 10.1% 15.4% 15.8% 222 Utili ties 10.5% 12.5% 20.3% 18.4% 6.6% 16.4% 13.2% 1
23 Construction 39.9% 27.0% 30.9% 52.5% 19.1% 30.7% 27.1% 231-33 Manufacturing 33.3% 27.7% 21.9% 38.3% 16.5% 17.9% 16.8% 5
42 Wholesale Trade 29.3% 21.3% 19.8% 36.5% 15.1% 19.0% 14.7% 6
44-45 Retail Trade 23.7% 18.1% 16.7% 29.1% 15.7% 18.3% 16.4% 5
48-49 Transportation & Warehousing 31.3% 23.7% 27.3% 26.1% 14.8% 20.8% 20.8% 1
51 Information 22.3% 21.0% 11.5% 19.7% 11.5% 15.3% 14.0% 1
52 Finance & Insurance 18.2% 11.4% 5.1% 11.9% 4.5% 7.4% 2.3% 1
53 Real Estate, Rental & Leasing 24.4% 17.0% 16.7% 22.7% 13.3% 15.0% 15.0% 2
54 Professional & Technical Services 22.8% 19.8% 20.4% 23.7% 13.7% 15.7% 12.1% 155 Management of Com. and Enterprises 19.9% 15.1% 13.4% 18.0% 8.9% 7.3% 3.9% 1
56 Administrative & Waste Services 30.5% 25.2% 24.5% 31.9% 17.7% 24.5% 24.1% 1
61 Educational Services 17.8% 20.1% 13.7% 13.8% 14.1% 18.2% 17.3% 2
62 Health Care & Social Assistance 19.5% 17.2% 18.5% 16.0% 13.4% 19.2% 19.6% 2
71 Arts, Entertainment & Recreation 26.4% 23.9% 16.6% 24.8% 13.1% 15.8% 11.6% 2
72 Accommodation & Food Services 27.8% 20.4% 25.1% 31.1% 15.0% 14.4% 14.4% 1
81 Other Services 26.9% 21.1% 23.0% 28.7% 17.1% 18.8% 17.0% 5
92 Public Administration 11.6% 18.7% 15.3% 21.4% 7.8% 10.0% 12.3% 2
99 Unclassified 25.0% 27.5% 27.5% 32.5% 10.0% 17.5% 12.5% 4All Total 25.4% 21.0% 19.5% 28.3% 13.9% 17.4% 15.6% 5,7
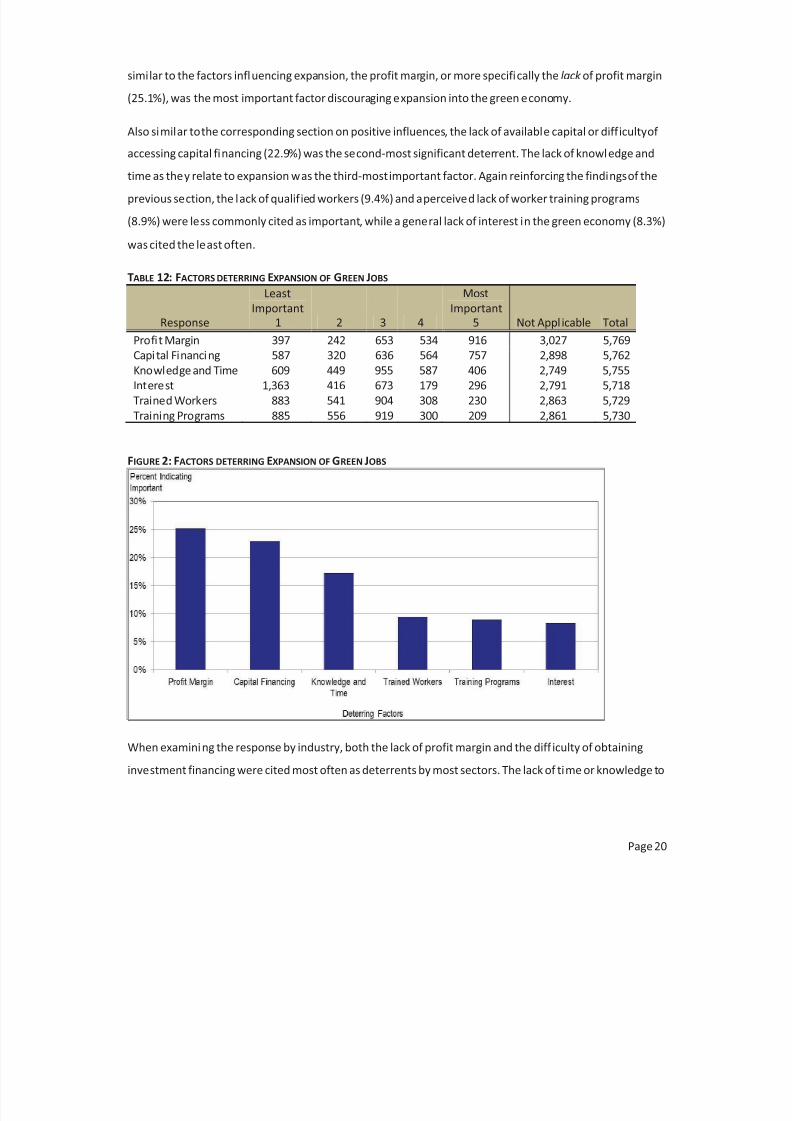
Deterring Factors
The Colorado green jobs survey also queried businesses throughout the state about the possible factors
that might discourage or prevent their expansion into the green economy (Table 12 and Figure 2) using the
same scale employed in the previous section that explored positive influences. Again, a set of possible
options and economic factors was provided for respondents to rate. The results (Table 12) show that,
8/4/2019 Green Jobs Survey Report
http://slidepdf.com/reader/full/green-jobs-survey-report 26/40
Page 20
similar to the factors influencing expansion, the profit margin, or more specifically the lack of profit margin
(25.1%), was the most important factor discouraging expansion into the green economy.
Also similar to the corresponding section on positive influences, the lack of available capital or difficulty of
accessing capital financing (22.9%) was the second-most significant deterrent. The lack of knowledge and
time as they relate to expansion was the third-most important factor. Again reinforcing the findings of the
previous section, the lack of qualified workers (9.4%) and a perceived lack of worker training programs
(8.9%) were less commonly cited as important, while a general lack of interest in the green economy (8.3%)
was cited the least often.
TABLE 12: FACTORS DETERRING EXPANSION OF GREEN JOBS
Response
Least
Important1 2 3 4
Most
Important5 Not Appl icable Total
Profit Margin 397 242 653 534 916 3,027 5,769Capital Financing 587 320 636 564 757 2,898 5,762
Knowledge and Time 609 449 955 587 406 2,749 5,755
Interest 1,363 416 673 179 296 2,791 5,718
Trained Workers 883 541 904 308 230 2,863 5,729
Training Programs 885 556 919 300 209 2,861 5,730
FIGURE 2: FACTORS DETERRING EXPANSION OF GREEN JOBS
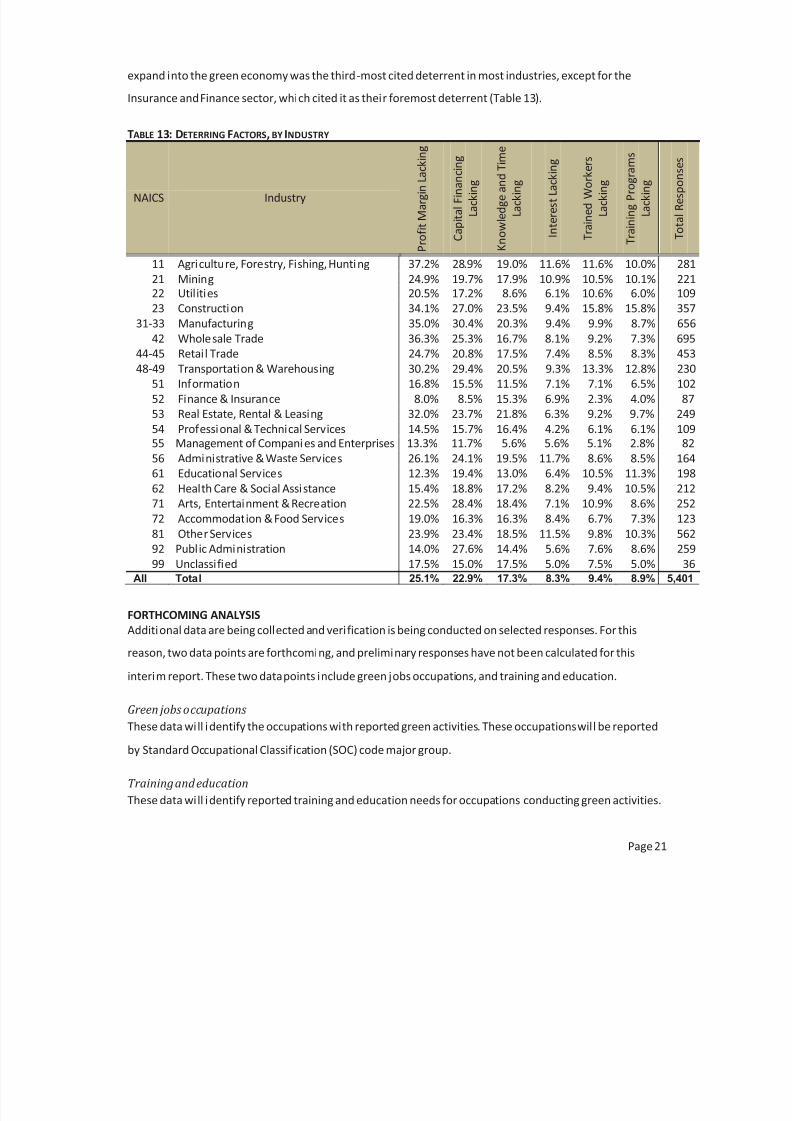
When examining the response by industry, both the lack of profit margin and the diff iculty of obtaining
investment financing were cited most often as deterrents by most sectors. The lack of time or knowledge to
8/4/2019 Green Jobs Survey Report
http://slidepdf.com/reader/full/green-jobs-survey-report 27/40
Page 21
expand into the green economy was the third-most cited deterrent in most industries, except for the
Insurance and Finance sector, which cited it as their foremost deterrent (Table 13).
TABLE 13: DETERRING FACTORS, BY INDUSTRY
NAICS Industry
P r o f i t M a r g i n L a c
k i n g
C a p i t a l F i n a n c i n g
L a c k i n g
K n o w l e d g e a n d T
i m e
L a c k i n g
I n t e r e s t L a c k i n
g
T r a i n e d W o r k e
r s
L a c k i n g
T r a i n i n g P r o g r a
m s
L a c k i n g
T o t a l R e s p o n s e s
11 Agriculture, Forestry, Fishing, Hunting 37.2% 28.9% 19.0% 11.6% 11.6% 10.0% 281
21 Mining 24.9% 19.7% 17.9% 10.9% 10.5% 10.1% 22122 Utilities 20.5% 17.2% 8.6% 6.1% 10.6% 6.0% 109
23 Construction 34.1% 27.0% 23.5% 9.4% 15.8% 15.8% 357
31-33 Manufacturing 35.0% 30.4% 20.3% 9.4% 9.9% 8.7% 656
42 Wholesale Trade 36.3% 25.3% 16.7% 8.1% 9.2% 7.3% 69544-45 Retail Trade 24.7% 20.8% 17.5% 7.4% 8.5% 8.3% 453
48-49 Transportation & Warehousing 30.2% 29.4% 20.5% 9.3% 13.3% 12.8% 230
51 Information 16.8% 15.5% 11.5% 7.1% 7.1% 6.5% 102
52 Finance & Insurance 8.0% 8.5% 15.3% 6.9% 2.3% 4.0% 87
53 Real Estate, Rental & Leasing 32.0% 23.7% 21.8% 6.3% 9.2% 9.7% 249
54 Professional & Technical Services 14.5% 15.7% 16.4% 4.2% 6.1% 6.1% 10955 Management of Companies and Enterprises 13.3% 11.7% 5.6% 5.6% 5.1% 2.8% 82
56 Administrative & Waste Services 26.1% 24.1% 19.5% 11.7% 8.6% 8.5% 164
61 Educational Services 12.3% 19.4% 13.0% 6.4% 10.5% 11.3% 198
62 Health Care & Social Assistance 15.4% 18.8% 17.2% 8.2% 9.4% 10.5% 212
71 Arts, Entertainment & Recreation 22.5% 28.4% 18.4% 7.1% 10.9% 8.6% 252
72 Accommodation & Food Services 19.0% 16.3% 16.3% 8.4% 6.7% 7.3% 123
81 Other Services 23.9% 23.4% 18.5% 11.5% 9.8% 10.3% 562
92 Public Administration 14.0% 27.6% 14.4% 5.6% 7.6% 8.6% 259
99 Unclassified 17.5% 15.0% 17.5% 5.0% 7.5% 5.0% 36All Total 25.1% 22.9% 17.3% 8.3% 9.4% 8.9% 5,401
FORTHCOMING ANALYSIS
Additional data are being collected and verification is being conducted on selected responses. For this
reason, two data points are forthcoming, and preliminary responses have not been calculated for this
interim report. These two data points include green jobs occupations, and training and education.
Green jobs occupations
These data will identify the occupations with reported green activities. These occupations will be reported
by Standard Occupational Classification (SOC) code major group.
Training and education
These data will identify reported training and education needs for occupations conducting green activities.
8/4/2019 Green Jobs Survey Report
http://slidepdf.com/reader/full/green-jobs-survey-report 28/40
Page 22
CONCLUSION
LMI was pleased to join the Northern Plains and Rocky Mountain Green Jobs Survey Consortium by
invitation in the summer of 2010. As a late addition to the Consortium and with the largest sample size
among participating states, Colorado was, for reasons of consistency and comparability, obligated to adopt
the Consortium’s survey methodology and process.
The intent of the Colorado survey was to produce an accurate and realistic estimate of jobs considered
green. This prel iminary analysis found a prevalence of green jobs in Colorado of 2.8%—similar to the
findings of our partners in the Consortium and of studies conducted in other states.
Some industry by industry results identified in this paper are not surprising, specifically, greater
concentrations of green jobs in the Agriculture, Administrative and Waste Services, and Construction
sectors; and low concentrations in the Health Care and Social Assistance, Information, and Finance and
Insurance sectors. Also not surprisingly, small firms tended to identify greater concentrations of green
employment than large firms. One interesting result is the relatively high prevalence of green jobs reported
by the Retail Trade sector.
Overall , employers indicated the greatest influencing and deterring factors for increasing green
employment to be financial considerations. The factors most often cited as important for increasing green
employment were customer demand, incentives such as tax deductions or credits, and access to capital or
financing. Similarly, factors cited as deterring the growth of green jobs were profit margin (profitability) and
a lack of capital or financing.
The data collected from this survey wil l be helpful in providing a context for future analysis and further
exploratory research, and in assisting the business community in accurately assessing the size and impact of
the green economy in Colorado. The research team is continuing to coll ect and analyze survey responses
that will expand upon and refine results; this report is expected to be made available in the summer of
2011.

8/4/2019 Green Jobs Survey Report
http://slidepdf.com/reader/full/green-jobs-survey-report 29/40
Page 23
BIBLIOGRAPHY
Ayre, Art, Nick Beleiciks, Ron Conrad, et al. June 2009. The Greening of Oregon’s Workforce: Jobs, Wages,
and Training. Oregon Employment Department Workforce and Economic Research Division.
http://www.qualityinfo.org/pubs/green/greening.pdf (accessed October 1, 2010).
Bureau of Labor Statistics. “ Overview of the BLS Green Jobs Initiative, Developing the Green Jobs
Definition.”www.bls.gov/green. (accessed May 10, 2011).
____________. “Overview of the BLS Green Jobs Initiative, the BLS Green Jobs Definition.”
www.bls.gov/green. (accessed May 10, 2011).
Hardcastle, Alan, et al. March 2010. 2009 Washington State Green Economy Jobs.
http://www.workforceexplorer.com/admin/uploadedPublications/10258_Green_Jobs_Report_for_
Web_2009.pdf (accessed October 13, 2010).
Kansas Department of Labor (Labor Market Information Services). 2009. 2009 Kansas Green Jobs Report .
http://www.dol.ks.gov/LMIS/GoingGreen/KansasGreenJobsReport.pdf (accessed October 11,
2010).
Missouri Economic Research and Information Center . 2009. The Missouri Green Jobs Report .
http://www.missourieconomy.org/pdfs/mo_green_jobs_report.pdf (accessed October 11, 2010).
The Pew Charitable Trusts. 2009. The Clean Energy Economy: Repowering Jobs, Investments and Businesses
Across America .
http://www.pewcenteronthestates.org/uploadedfiles/clean_economy_report_web.pdf. (accessed
February 9, 2011).
Waclawek, Richard, Bruce Weaver, Rhea Acuna, et al. May 2009. Michigan Green Jobs Report 2009:
Occupations and Employment in the New Green Economy. Michigan Department of Energy, Labor &
Economic Growth (prepared by the Bureau of Labor Market Information and Strategic Initiatives).
http://www.michigan.gov/documents/nwlb/GJC_GreenReport_Print_277833_7.pdf (accessed
October 1, 2010).

8/4/2019 Green Jobs Survey Report
http://slidepdf.com/reader/full/green-jobs-survey-report 30/40
Page 24
APPENDIX 1: LITERATURE REVIEW
Oregon Green Jobs Survey—2009
In 2009, the Oregon Employment Department completed a survey that asked a sample of Oregon
employers to report the number of employees they hired to do green jobs. The survey defined green jobs
as jobs that increase energy efficiency; produce renewable energy; prevent or diminish environmental
degradation; clean up the natural environment; or provide education, accreditation, or policy support for
the other services listed. The results of the survey showed over 50,000 green jobs in Oregon, about 3% of
total employment in the state. The jobs were spread across 226 occupations but were most concentrated in
Construction (17%), Wholesale and Retail Trade (16%), and Administrative and Waste Services (14%). The
survey also found that the mean wage for green jobs ($22.61 per hour) was slightly higher than the state
average but that green jobs had comparable minimum education requirements to the rest of the sta te
(Ayre, Beleiciks, Conrad, et al., 2009).
Michigan Green Jobs Report—2009
In May 2009, the Michigan Department of Energy, Labor & Economic Growth released a report on the
number and growth of green jobs in the state. The study consisted primarily of a survey (where
respondents reported the number of employees hired for green jobs) and an analysis of the growth trends
of industries considered green related. The report defined green jobs as jobs that provide products or
services in “agriculture and natural resource conservation, clean transportation and fuels, increased energy
eff iciency, pollution prevention or environmental clean-up, and renewable energy production” (Waclawek,
Weaver, and Acuna, et al., 2009). The report concluded that Michigan has 109,067 green jobs, 12,300 of
which are support green jobs. The total number of support and direct green jobs amounts to 3% of
Michigan’s overall employment. Of the green-related industries analyzed, Semiconductor Manufacturing,
Wholesale Trade of Recyclable Material, and Environmental Consulting were the only sampled industries
that showed growth, while the economy as a whole lost jobs. The employment expansion of these three
green industries was 7.7%, while the Michigan economy had a 5.4% loss of employment (Waclawek,
Weaver, Acuna, et al., 2009).
8/4/2019 Green Jobs Survey Report
http://slidepdf.com/reader/full/green-jobs-survey-report 31/40
Page 25
Missouri Green Jobs Report—2009
The Missouri Economic Research and Information Center (MERIC) conducted a survey in 2009 to determine
the number of green jobs in the state. For the purpose of the survey, jobs were considered green if the
employee was “directly involved in generating or supporting a firm’s green related products or services”
(Missouri Economic Research and Information Center, 2009). To clarify further, the study listed industries
considered green-related: reduction of environmental impacts, energy efficiency, renewable energy,
production of organic products, and research and development related to the green industries. The study
identified 131,103 green jobs in the state, 28,720 primary green jobs and 102,383 support green jobs. Both
types of green jobs account for 4.8% of Missouri’s total employment. Some sectors of Missouri’s green
economy have growth potential up to 16% in the next six years. However, growth rates appeared to be tied
to economic conditions. More than 70% of employers identified current economic conditions as the largest
barrier to hiring more green workers (Missouri Economic Research and Information Center, 2009).
Kansas Green Jobs Report—2009
The Kansas Department of Labor surveyed just over 6,000 businesses in 2009 to calculate the number of
green jobs in the state. The survey defined green jobs as jobs that make products or provide services in
renewable energy, natural resource conservation, clean up or prevention of environmental degradation,
clean transportation, and energy efficiency. The survey results showed the primary job responsibilities of
20,047 employees were primarily devoted to green activities, totaling 1.5% of all Kansas employment. In
addition, the number of employees working to support primary green jobs accounted for 1.9% of total
employment. The survey also collected data on minimum education requirements for primary green jobs.
Almost 70% of primary green jobs required a high school diploma or less. This concentration was potentially
due to the fact that 30% of primary green jobs were in Construction and Maintenance, Installation, and
Manufacturing (Kansas Department of Labor, 2009).
Washington Survey of Green Jobs—2009
To follow up a green jobs survey conducted in 2008, the Washington State Employment Security
Department conducted a second survey of green jobs in 2009. The 2009 study polled over 13,000
businesses and calculated that Washington state has 76,137 green jobs. Green jobs accounted for 3.3% of
Washington’s employment in 2009, a large increase from 2008 when green jobs were estimated to be 1.6%
8/4/2019 Green Jobs Survey Report
http://slidepdf.com/reader/full/green-jobs-survey-report 32/40
Page 26
of employment. The larger pool of respondents in 2009 accounted for some of this growth, as well as the
addition of green jobs in businesses that had not reported any during the 2008 survey. The 2009 study
divided green jobs into four key areas: preventing and reducing environmental pollution (46% of total green
jobs), increasing energy efficiency (38.9%), mitigating or cleaning up environmental pollution (11.6%), and
producing renewable energy (4.3%). The median earnings of green workers were between $40,000 and$55,000 per year. In addition, the study found that the average green employee needed one to four years
of post-high school education and potentially on-the-job training as well (Hardcastle, et al., 2010).
Clean Energy Economy Study—2009
The Pew Charitable Trusts completed a study in 2009 on the national clean energy economy. To identify
clean energy businesses, Pew compiled a list of companies that were receiving green technology venture
capital. After identifying similar and related businesses, analysts verified online that each company was
involved in green activities. The nature of the research methodology potentially lowered the number of
businesses and jobs the study identified. Pew’s definition of the green economy had five parts: energy
eff iciency, clean energy, environmentally friendly production, conservation and pollution mitigation, and
training and support. Nationally, Pew reported 770,000 green jobs .
8/4/2019 Green Jobs Survey Report
http://slidepdf.com/reader/full/green-jobs-survey-report 33/40
Page 27
APPENDIX 2: SURVEY DOCUMENTS
FIGURE 3: INITIAL POSTCARD (FRONT SIDE)
FIGURE 4: INITIAL POSTCARD (BACK SIDE)
8/4/2019 Green Jobs Survey Report
http://slidepdf.com/reader/full/green-jobs-survey-report 34/40
Page 28
FIGURE 5: SURVEY INSTRUMENT (PAGE 1 AND PAGE 4)
8/4/2019 Green Jobs Survey Report
http://slidepdf.com/reader/full/green-jobs-survey-report 35/40
Page 29
FIGURE 6: SURVEY INSTRUMENT (PAGE 2 AND PAGE 3)

8/4/2019 Green Jobs Survey Report
http://slidepdf.com/reader/full/green-jobs-survey-report 36/40
Page 30
FIGURE 7: ENVELOPE
FIGURE 8: POSTAGE-PAID RETURN ENVELOPE
8/4/2019 Green Jobs Survey Report
http://slidepdf.com/reader/full/green-jobs-survey-report 37/40
Page 31
FIGURE 9: WHAT WE MEAN BY GREEN
8/4/2019 Green Jobs Survey Report
http://slidepdf.com/reader/full/green-jobs-survey-report 38/40
Page 32
FIGURE 10: COVER LETTER
8/4/2019 Green Jobs Survey Report
http://slidepdf.com/reader/full/green-jobs-survey-report 39/40
Page 33
APPENDIX 3: ECONOMIC OVERVIEW
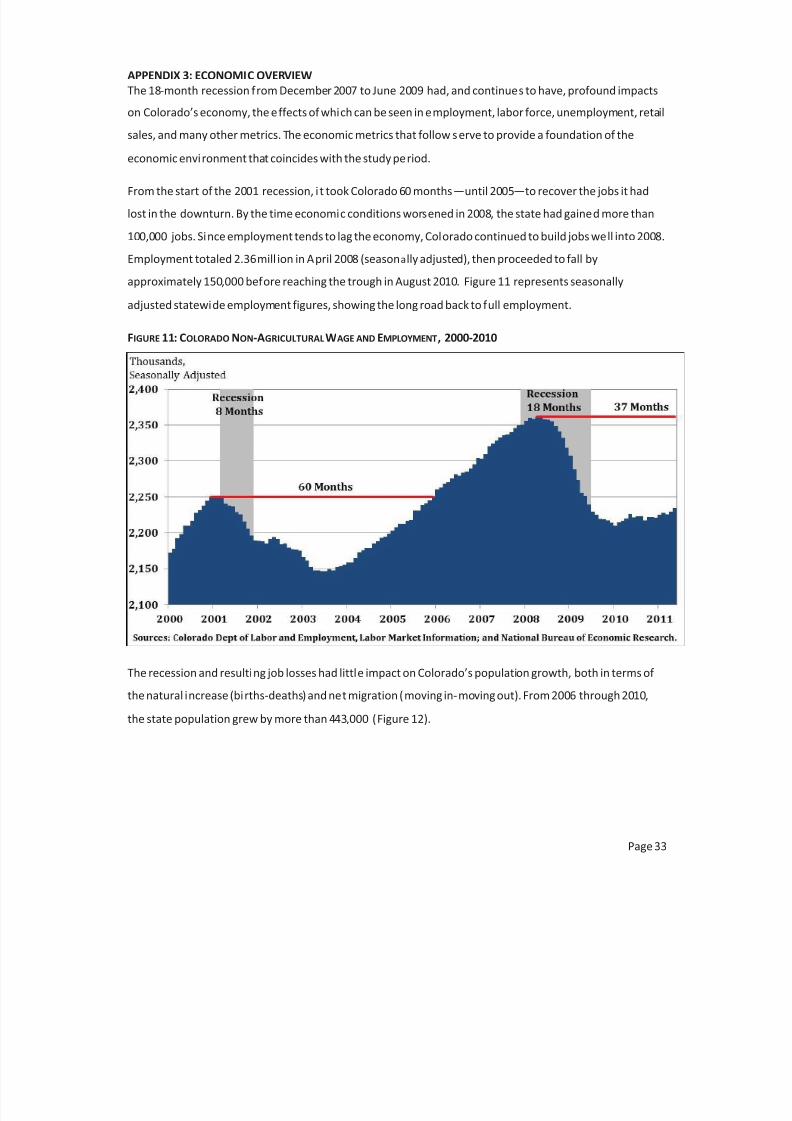
The 18-month recession from December 2007 to June 2009 had, and continues to have, profound impacts
on Colorado’s economy, the effects of which can be seen in employment, labor force, unemployment, retail
sales, and many other metrics. The economic metrics that follow serve to provide a foundation of the
economic environment that coincides with the study period.
From the start of the 2001 recession, i t took Colorado 60 months—until 2005—to recover the jobs it had
lost in the downturn. By the time economic conditions worsened in 2008, the state had gained more than
100,000 jobs. Since employment tends to lag the economy, Colorado continued to build jobs well into 2008.
Employment totaled 2.36 mill ion in April 2008 (seasonally adjusted), then proceeded to fall by
approximately 150,000 before reaching the trough in August 2010. Figure 11 represents seasonally
adjusted statewide employment figures, showing the long road back to full employment.
FIGURE 11: COLORADO NON-AGRICULTURALWAGE AND EMPLOYMENT, 2000-2010
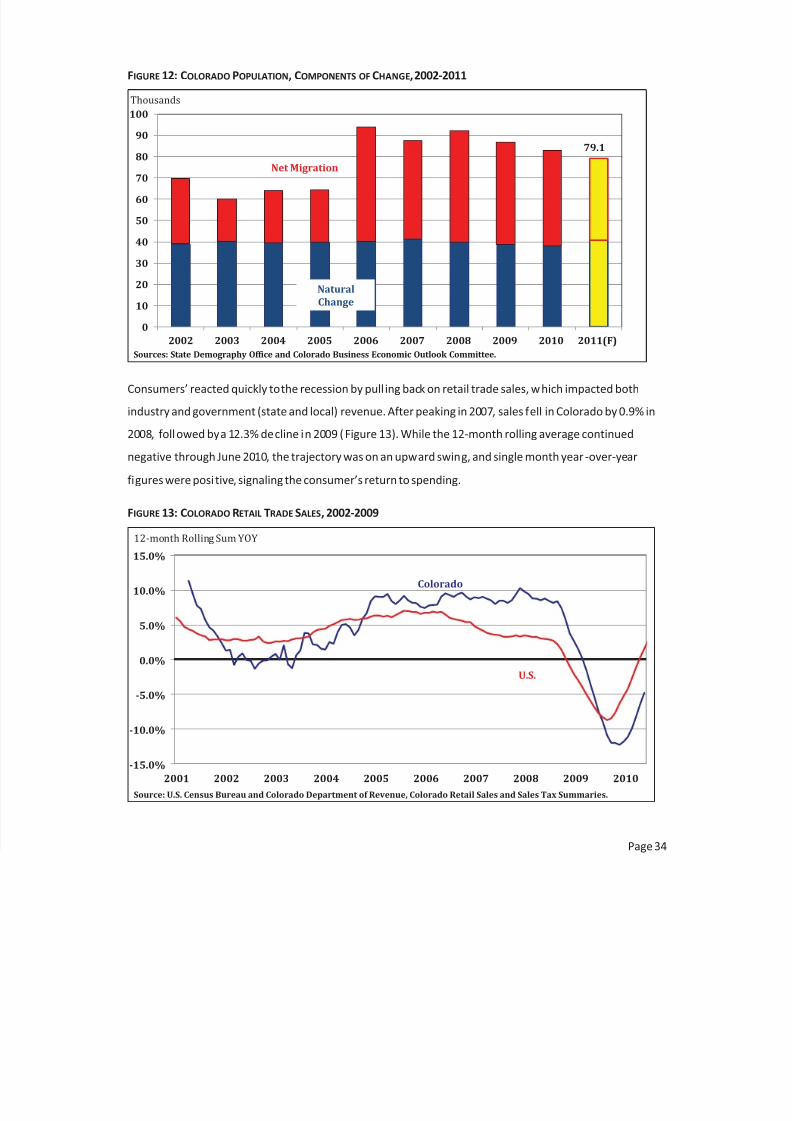
The recession and resulting job losses had little impact on Colorado’s population growth, both in terms of
the natural increase (births-deaths) and net migration (moving in-moving out). From 2006 through 2010,
the state population grew by more than 443,000 (Figure 12).
8/4/2019 Green Jobs Survey Report
http://slidepdf.com/reader/full/green-jobs-survey-report 40/40
FIGURE 12: COLORADO POPULATION, COMPONENTS OF CHANGE, 2002-2011
0
10
20
30
40
50
60
70
80
90
100
2002 2003 2004 2005 2006 2007 2008 2009 2010 2011(F)
Thousands
Natural
Change
Net Migration
79.1
Sources: State Demography Office and Colorado Business Economic Outlook Committee.
Consumers’ reacted quickly to the recession by pull ing back on retail trade sales, which impacted both
industry and government (state and local) revenue. After peaking in 2007, sales fell in Colorado by 0.9% in
2008, followed by a 12.3% decline in 2009 (Figure 13). While the 12-month rolling average continued
negative through June 2010, the trajectory was on an upward swing, and single month year -over-year
figures were positive, signaling the consumer’s return to spending.
FIGURE 13: COLORADO RETAIL TRADE SALES, 2002-2009
-15.0%
-10.0%
-5.0%
0.0%
5.0%
10.0%
15.0%
2001 2002 2003 2004 2005 2006 2007 2008 2009 2010
Colorado
U.S.
12-month Rolling Sum YOY