Green Growth: The 2015 Election and the Environment
31
-
Upload
ipsos-mori -
Category
Environment
-
view
525 -
download
0
Transcript of Green Growth: The 2015 Election and the Environment


35 33
10
7 8
0
10
20
30
40
50
60
Fe
b 1
0
Au
g 1
0
Fe
b 1
1
Au
g 1
1
Fe
b 1
2
Au
g 1
2
Fe
b 1
3
Au
g 1
3
Fe
b 1
4
Au
g 1
4
Fe
b 1
5
Base: c.1,000 British adults certain to vote each month through February 2008; c. 500 British adults thereafter
3 HOW WOULD YOU VOTE IF THERE WERE A GENERAL ELECTION TOMORROW?
Source: Ipsos MORI Political Monitor
2010 General Election
CONSERVATIVE LABOUR UKIP GREEN LIB DEM

4
14,179
55,775
43,451 45,455
36,000
10000
15000
20000
25000
30000
35000
40000
45000
50000
55000
60000
Feb 1
4
Aug
14
Feb 1
5
GREEN PARTY
MEMBERSHIP
LIB DEM
MEMBERSHIP UKIP MEMBERSHIP
Sources: http://www.libdemvoice.org/tag/party-membership
http://www.ukip.org/ukip_is_delighted_to_announce_yet_another_record_membership_figure
http://en.wikipedia.org/wiki/UK_Independence_Party
http://www.theguardian.com/politics/2014/dec/02/green-party-membership-doubles-ukip-
mainstream-politics
http://www.channel4.com/news/green-party-membership-growth-ukip-natalie-bennett

15% 11%
3%
18-34 35-54 55+
6
And they are more likely
than supporters of any
other major party to use…..*
More likely to
be female…
FEMALE
56% MALE
44%
Younger voters are more likely
to vote Green
76% 39%
Source: Political Monitor (737 adults aged 18+ who say they are certain to vote in May 2015. Interviewed by telephone, fieldwork dates 12th - 15th April)
Source *: Political Monitor (Aggregated data from January – December 2014. 388 adults aged 18+ who say they are certain to vote in May 2015 and plan to vote for the Green Party.
All interviewed by telephone)
7
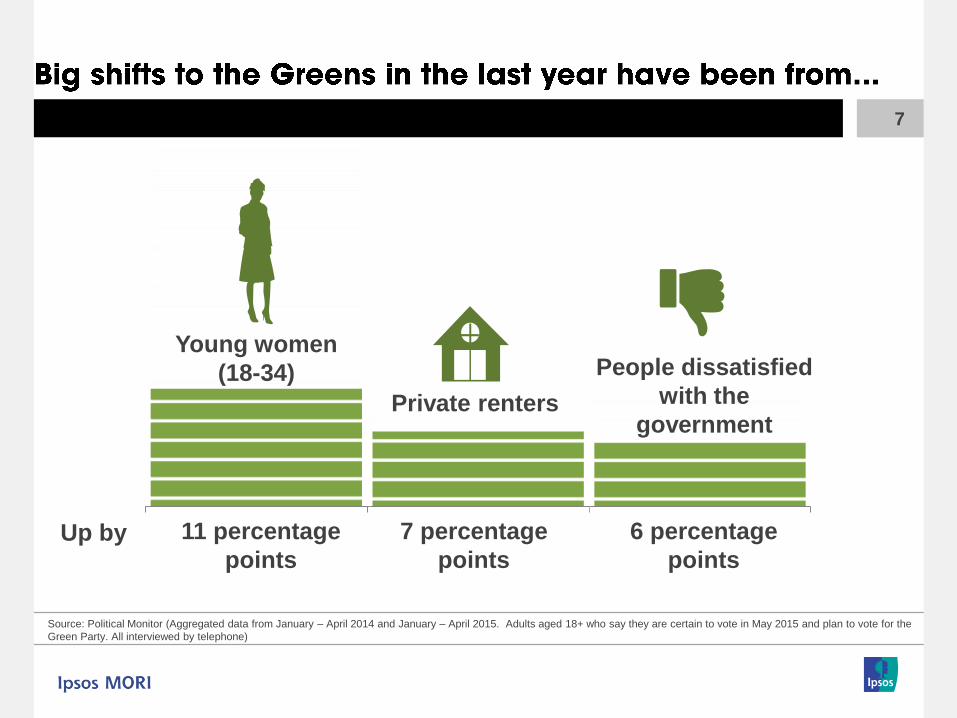
11 percentage
points
6 percentage
points
7 percentage
points
Private renters
Young women
(18-34) People dissatisfied
with the
government
Source: Political Monitor (Aggregated data from January – April 2014 and January – April 2015. Adults aged 18+ who say they are certain to vote in May 2015 and plan to vote for the
Green Party. All interviewed by telephone)
Up by

30%
26%
14%
5%
11%
11% 3%
Lib Dem
Green
Labour
Conservatrive
Other
Did not vote
Too young
8 HOW WOULD YOU VOTE IF THERE WERE A GENERAL ELECTION TOMORROW? / WHICH PARTY DID YOU VOTE FOR AT THE GENERAL ELECTION ON MAY 6TH 2010?
How those planning to vote Green in 2015 voted in 2010
Source: Political Monitor (Aggregated data from January – December 2014. 388 adults aged 18+ who say they are certain to vote in May 2015 and plan to vote for the Green Party. All
interviewed by telephone)
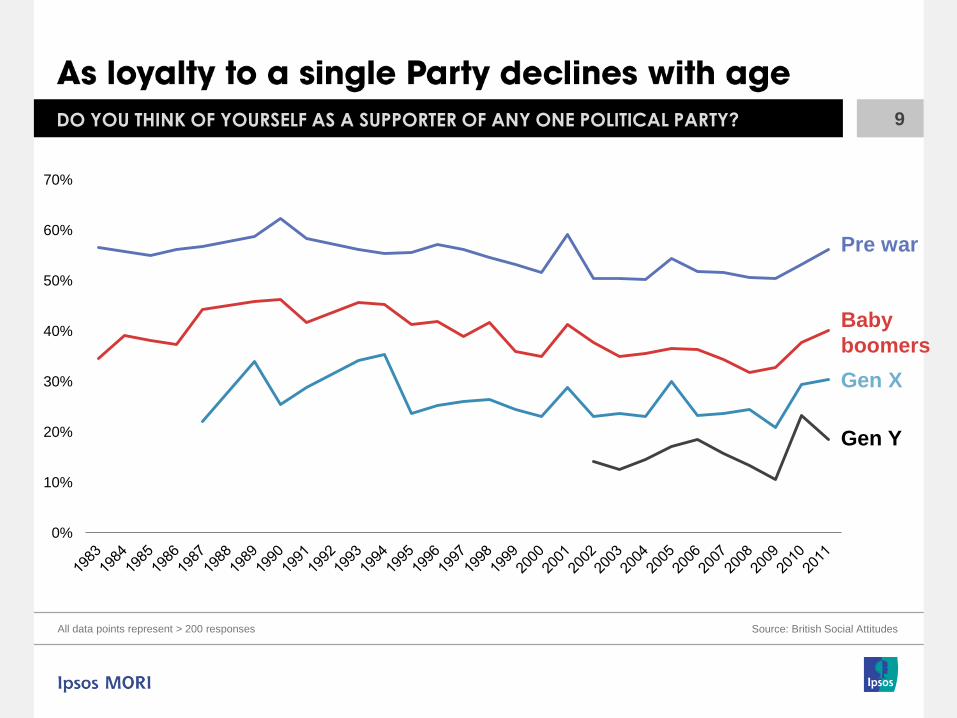
All data points represent > 200 responses
9 DO YOU THINK OF YOURSELF AS A SUPPORTER OF ANY ONE POLITICAL PARTY?
Source: British Social Attitudes
0%
10%
20%
30%
40%
50%
60%
70%
Pre war
Baby
boomers
Gen X
Gen Y

Data shows 2010 recalled past vote and current voting intentions of 3,045 British adults aged 18+ interviewed January-March 2015. Current voting intentions are based only on those who say they are absolutely certain to vote, while those who were unable or refused to say how they voted in 2010 are not shown.
Source: Ipsos MORI Political Monitor
10

11
% Mentions
*selected issues
Green
Party
Conservative Labour Liberal
Democrats
UKIP
Economy 35% 44% 34% 47% 26%
Environment 30% 5% 7% 13% 3%
Poverty/Equality 30% 8% 20% 18% 8%
NHS 28% 29% 27% 31% 28%
Unemployment 23% 19% 34% 18% 21%
Education 21% 16% 16% 21% 10%
Immigration 19% 50% 27% 34% 77%
WHAT DO YOU SEE AS THE MOST/OTHER IMPORTANT ISSUES FACING BRITAIN TODAY?
Source: Ipsos MORI Issues Index, base: GB Adults aged 18+ (10,746) Aggregated from January-December 2014

12
LOOKING AHEAD TO THE NEXT GENERAL ELECTION, WHICH, IF ANY, ISSUES DO YOU THINK WILL BE VERY IMPORTANT TO YOU IN HELPING YOU DECIDE WHICH PARTY TO VOTE FOR?
Source: Political Monitor (1,000 adults aged 18+ interviewed by telephone, fieldwork dates 12th - 15th April):
0%
100%
10% 5%
30%
3% 1%
Protecting the natural environment / climate change


0
10
20
30
40
50
60
70
Jan
98
Jan
99
Jan
00
Jan
01
Jan
02
Jan
03
Jan
04
Jan
05
Jan
06
Jan
07
Jan
08
Jan
09
Jan
10
Jan
11
Jan
12
Jan
13
Jan
14
Jan
15
Source: Issues Index, c.1,000 adults aged 18+ interviewed face-to-face in home across Great Britain per month. Data based on annual averages for each issue, including January –
April in 2015
14 WHAT DO YOU SEE AS THE MOST/OTHER IMPORTANT ISSUES FACING BRITAIN TODAY?
Economy
immigration
NHS Environment
Unemployment

15
WHAT ARE THE ISSUES RELATING TO THE ENVIRONMENT THAT YOU THINK ARE MOST IMPORTANT FOR THE UK AT THE MOMENT?
Source: BBC / Ipsos MORI Election uncut community
Notes:
Word cloud based on 1,168 survey responses from adults aged
18-75 from Election Uncut. 17th – 21st April 2015
Removed common English words and single mentions, otherwise
image shows unedited verbatim, top 100 words. Data is
qualitative and unweighted

16
Source: BBC / Ipsos MORI Election uncut community
AND WHAT ARE THE ISSUES RELATING TO THE ENVIRONMENT THAT YOU THINK ARE MOST IMPORTANT FOR THE WORLD AT THE MOMENT?
Notes:
Word cloud based on 1,168 survey
responses from adults aged 18-75
from Election Uncut. 17th – 21st April
2015
Removed common English words
and single mentions, otherwise
image shows unedited verbatim, top
100 words. Data is qualitative and
unweighted

17 HOW CONCERNED, IF AT ALL, ARE YOU ABOUT CLIMATE CHANGE, WHICH IS SOMETIMES REFERRED TO AS ‘GLOBAL WARNING?
87
78
78
46
43
43
36
35
35
27
24
22
19
17
16
10
9
8
6
Very concerned Fairly concerned Don’t know Not very concerned Not at all concerned
40
40
2
11
7
66
27
2 4 2
18% are not
concerned
(Con. = 34%
Lab. = 6%)
31%
are not
concerned
(Con. = 31%
Lab. = 33%)
8
57 2
21
13
18
49
1
24
7 16
49
1
25
8 15
53
1
27
4
80% are
concerned
(Con. = 64%
Lab. = 92%)
68%
are
concerned
(Con. = 68%
Lab. = 65%)
PUBLIC
Sources: Base: All MPs (104), Conservative MPs (46), Labour MPs (45) asked, Winter 2014
MPs
Public: Ipsos MORI and Cardiff University. 1,002 adults aged 16+ interviewed face-to-face in home across Great Britain

18
Source: Ipsos MORI and Cardiff University. 1,002 adults aged 16+ interviewed face-to-face in home across Great Britain
68 %
overall 83%
84%
68%
65%
HOW CONCERNED, IF AT ALL, ARE YOU ABOUT CLIMATE CHANGE, WHICH IS SOMETIMES REFERRED TO AS ‘GLOBAL WARNING?
66%

19 WHICH OF THE SUBJECTS ON THIS LIST, IF ANY, DO YOU RECEIVE MOST LETTERS ABOUT IN YOUR POST BAG, OR RECEIVE MOST APPROACHES ABOUT FROM INDIVIDUALS IN CLINICS OR OTHER WAYS?
64
64
64
50
48
38
38
35
34
32
28
28
25
24
20
Benefits
Housing
Health Service
Child Support/Child Support…
Asylum/Immigration/ refugees
Badger culls
Tax Credits
Pensions
Public transport
Education/schools
Care of the elderly
Social security
Rail services
Animal Research/ Experimentation
Energy
:
‘Climate
change’
features as the
21st most
mentioned
subject,
mentioned by
17% of MPs
Base: All MPs (99), Conservative MPs (45), Labour MPs (43) asked, Winter 2014:

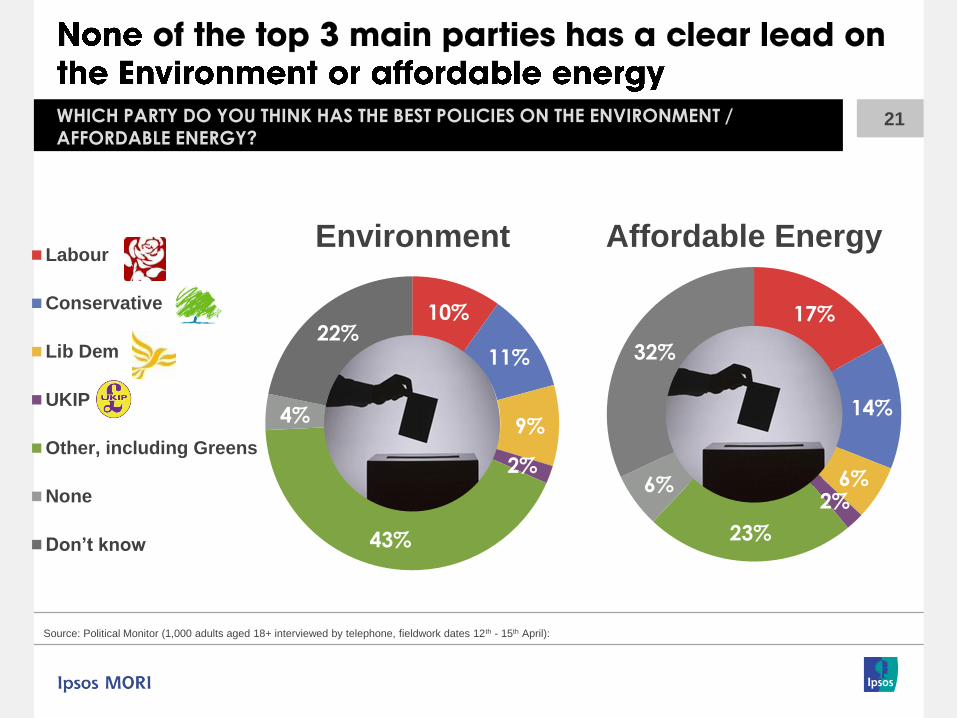
21 WHICH PARTY DO YOU THINK HAS THE BEST POLICIES ON THE ENVIRONMENT /
AFFORDABLE ENERGY?
10%
11%
9%
2%
43%
4%
22%
Labour
Conservative
Lib Dem
UKIP
Other, including Greens
None
Don’t know
Environment
17%
14%
6% 2%
23%
6%
32%
Affordable Energy
Source: Political Monitor (1,000 adults aged 18+ interviewed by telephone, fieldwork dates 12th - 15th April):
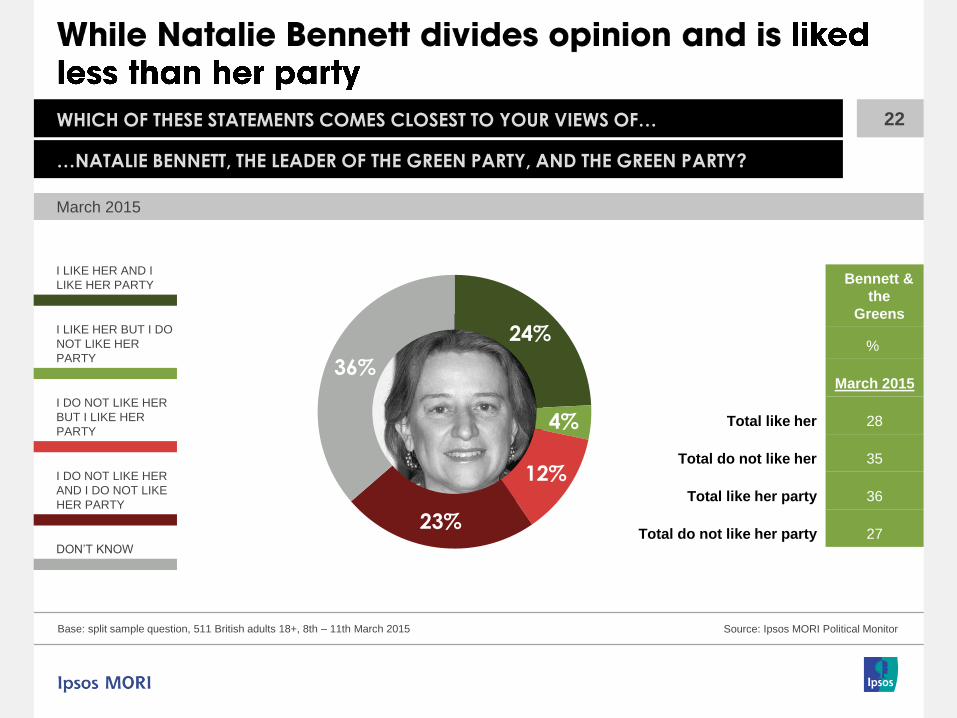
24%
4%
12%
23%
36%
22 WHICH OF THESE STATEMENTS COMES CLOSEST TO YOUR VIEWS OF…
…NATALIE BENNETT, THE LEADER OF THE GREEN PARTY, AND THE GREEN PARTY?
Base: split sample question, 511 British adults 18+, 8th – 11th March 2015 Source: Ipsos MORI Political Monitor
Bennett &
the
Greens
%
March 2015
Total like her 28
Total do not like her 35
Total like her party 36
Total do not like her party 27
March 2015
I LIKE HER AND I
LIKE HER PARTY
I LIKE HER BUT I DO
NOT LIKE HER
PARTY
I DO NOT LIKE HER
BUT I LIKE HER
PARTY
I DO NOT LIKE HER
AND I DO NOT LIKE
HER PARTY
DON’T KNOW

-35
-59
-57
-62
-54
28
30
31
30
39
Greens
UKIP
Lib Dem
Labour
Conservative
64%
23 WHICH OF THESE STATEMENTS COMES CLOSEST TO YOUR VIEWS OF … LEADER AND … PARTY?
:
Base: split sample question, 511 British adults 18+, 8th – 11th March 2015 Source: Ipsos MORI Political Monitor
36
25
40
52
33
-27
-64
-48
-40
-60
Greens
UKIP
Lib Dem
Labour
Conservative
Don’t like leader (%) Like leader (%)
Don’t like party (%) Like party (%)

24 YOU SAID THAT YOU WOULD VOTE FOR/BE INCLINED TO SUPPORT THE CONSERVATIVES/LABOUR/LIBERAL DEMOCRATS/UKIP IF THERE WERE A GENERAL ELECTION TOMORROW. SUPPOSE THAT NO PARTY HAS AN OVERALL MAJORITY AFTER THE ELECTION.
HOW STRONGLY WOULD YOU SUPPORT OR OPPOSE THE CONSERVATIVES/LABOUR/LIBERAL DEMOCRATS/UKIP FORMING A COALITION GOVERNMENT WITH …XXX IF THEY HAD ENOUGH SEATS BETWEEN THEM FOR A MAJORITY?
57
17
36
22
25
26
20
31
68
48
64
58
62
65
Source: Ipsos MORI Political Monitor Base: 267 Conservative, 285 Labour and 66 Liberal Democrat supporters*, all British adults 18+, 8th -10th
February 2014. *Small base sizes indicative only
Conservative
supporters
Labour supporters
Liberal Democrat
supporters
...UKIP
...Liberal Democrats
...Liberal Democrats
…Green Party
% Oppose % Support Form a coalition with…
…Conservatives
…Labour
…SNP

29
57
49
15
76
35
63
31
34
73
10
49
25 YOU SAID THAT YOU WOULD VOTE FOR/BE INCLINED TO SUPPORT THE CONSERVATIVES/LABOUR/LIBERAL DEMOCRATS/UKIP IF THERE WERE A GENERAL ELECTION TOMORROW. SUPPOSE THAT NO PARTY HAS AN OVERALL MAJORITY AFTER THE ELECTION.
HOW STRONGLY WOULD YOU SUPPORT OR OPPOSE THE CONSERVATIVES/LABOUR/LIBERAL DEMOCRATS/UKIP FORMING A COALITION GOVERNMENT WITH …XXX IF THEY HAD ENOUGH SEATS BETWEEN THEM FOR A MAJORITY?
Source: Ipsos MORI Political Monitor Base: 267 Conservative, 285 Labour and 66 Liberal Democrat supporters*, all British adults 18+, 8 th -10th February 2014.
*Small base sizes indicative only
% Oppose % Support Form a coalition with…
UKIP supporters
Green Party supporters
Scottish National Party
supporters
...Conservatives
...Labour
... Conservatives
…Labour
…Conservatives
…Labour
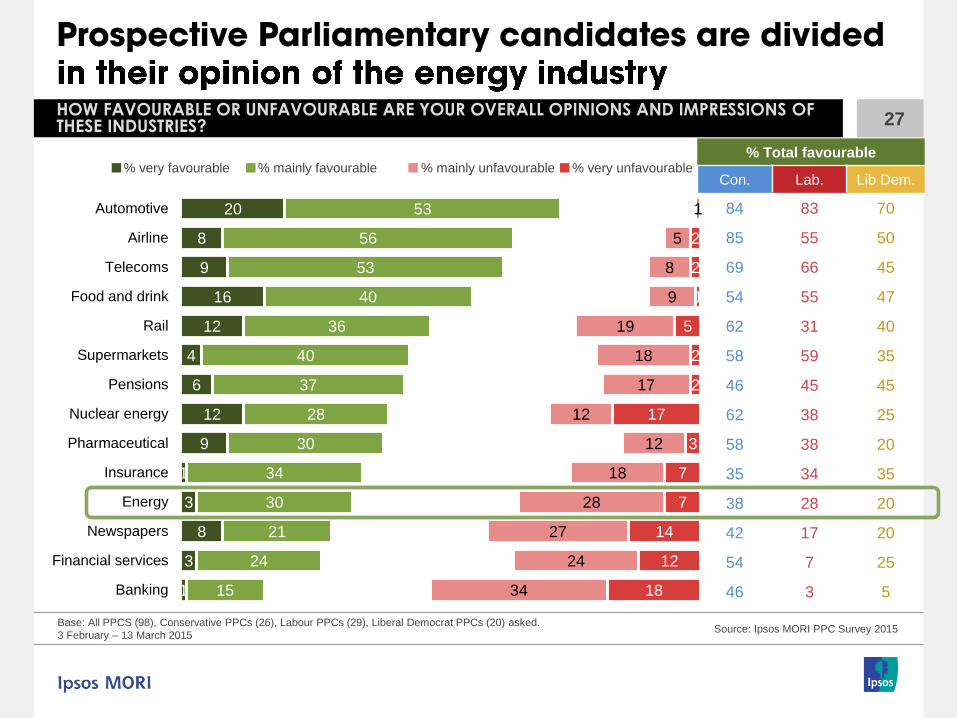
HOW FAVOURABLE OR UNFAVOURABLE ARE YOUR OVERALL OPINIONS AND IMPRESSIONS OF THESE INDUSTRIES?
Base: All PPCS (98), Conservative PPCs (26), Labour PPCs (29), Liberal Democrat PPCs (20) asked.
3 February – 13 March 2015 Source: Ipsos MORI PPC Survey 2015
20
8
9
16
12
4
6
12
9
1
3
8
3
1
53
56
53
40
36
40
37
28
30
34
30
21
24
15
1
5
8
9
19
18
17
12
12
18
28
27
24
34
2
2
1
5
2
2
17
3
7
7
14
12
18
Automotive
Airline
Telecoms
Food and drink
Rail
Supermarkets
Pensions
Nuclear energy
Pharmaceutical
Insurance
Energy
Newspapers
Financial services
Banking
% Total favourable
Con. Lab. Lib Dem.
84 83 70
85 55 50
69 66 45
54 55 47
62 31 40
58 59 35
46 45 45
62 38 25
58 38 20
35 34 35
38 28 20
42 17 20
54 7 25
46 3 5
% very favourable % mainly favourable % mainly unfavourable % very unfavourable
27
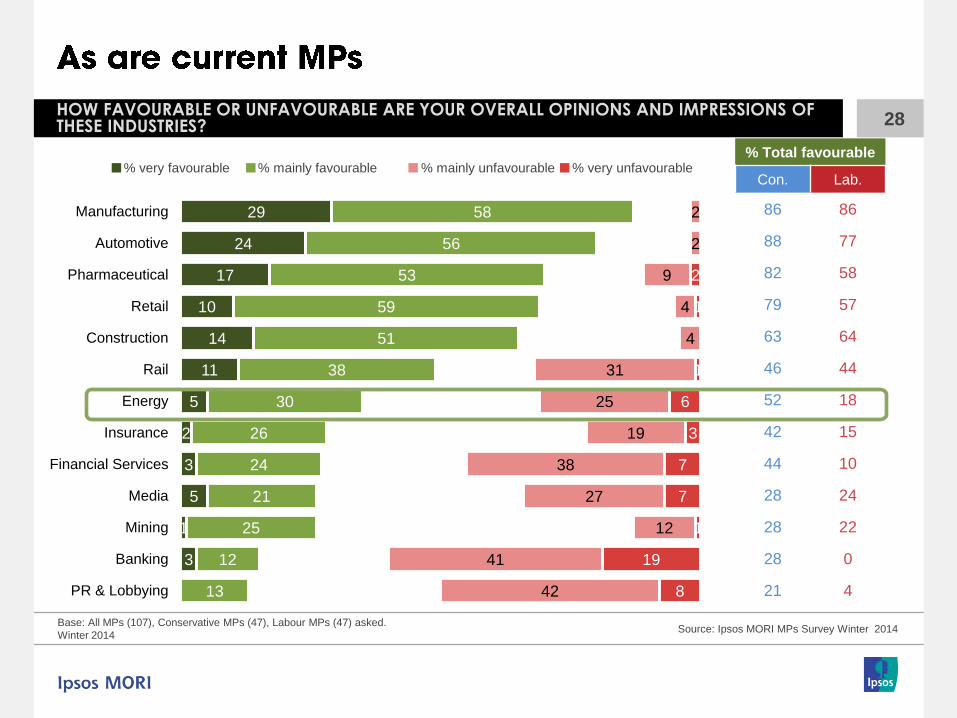
HOW FAVOURABLE OR UNFAVOURABLE ARE YOUR OVERALL OPINIONS AND IMPRESSIONS OF THESE INDUSTRIES?
Base: All MPs (107), Conservative MPs (47), Labour MPs (47) asked.
Winter 2014 Source: Ipsos MORI MPs Survey Winter 2014
29
24
17
10
14
11
5
2
3
5
1
3
58
56
53
59
51
38
30
26
24
21
25
12
13
2
2
9
4
4
31
25
19
38
27
12
41
42
2
1
1
6
3
7
7
1
19
8
Manufacturing
Automotive
Pharmaceutical
Retail
Construction
Rail
Energy
Insurance
Financial Services
Media
Mining
Banking
PR & Lobbying
% Total favourable
Con. Lab.
86 86
88 77
82 58
79 57
63 64
46 44
52 18
42 15
44 10
28 24
28 22
28 0
21 4
% very favourable % mainly favourable % mainly unfavourable % very unfavourable
28
3
11
23
9
21
14
31
17
24
54
60
16
12
6
22
12
22
12
35
38
25
60
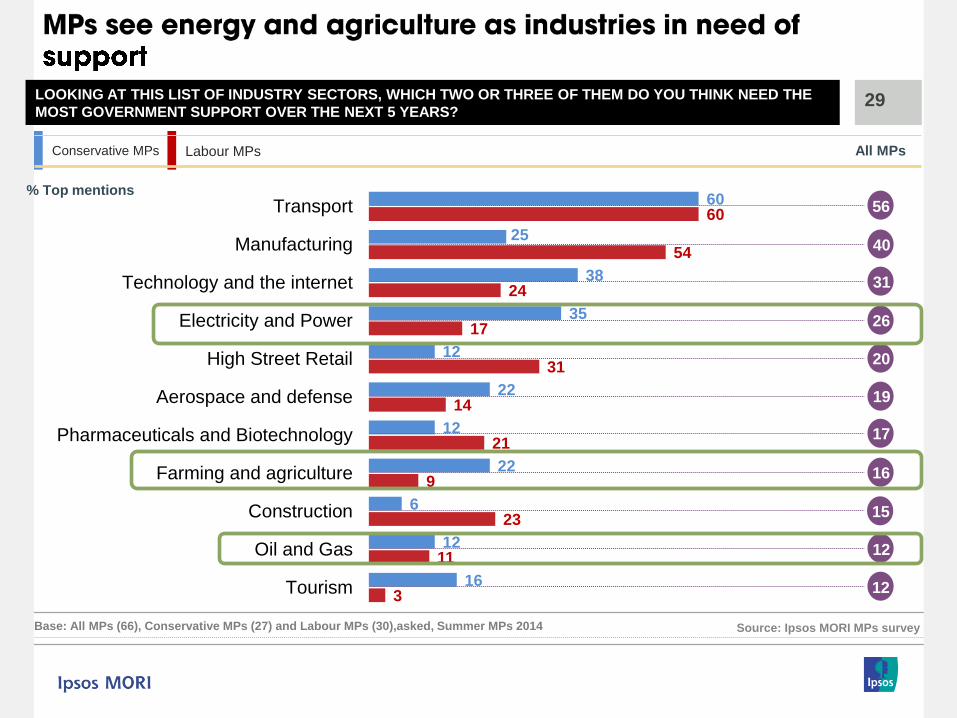
Tourism
Oil and Gas
Construction
Farming and agriculture
Pharmaceuticals and Biotechnology
Aerospace and defense
High Street Retail
Electricity and Power
Technology and the internet
Manufacturing
Transport
Conservative MPs Labour MPs
LOOKING AT THIS LIST OF INDUSTRY SECTORS, WHICH TWO OR THREE OF THEM DO YOU THINK NEED THE
MOST GOVERNMENT SUPPORT OVER THE NEXT 5 YEARS?
Base: All MPs (66), Conservative MPs (27) and Labour MPs (30),asked, Summer MPs 2014
56
40
31
26
20
19
17
16
15
12
12
All MPs
% Top mentions
Source: Ipsos MORI MPs survey
29

17
10
19
10
19
13
41
40
32
61
6
15
15
31
33
34
12
27
52
42
Aerospace and Defence
Oil and Gas
Transport
Electricity and Power
Financial services
Banking
Pharmaceuticals and Biotechnology
Construction
Technology and the internet
Manufacturing
Conservative MPs Labour MPs
AND WHICH TWO OR THREE OF THEM DO YOU THINK ARE THE MOST IMPORTANT FOR GROWING THE UK
ECONOMY OVER THE NEXT 5 YEARS?
Base: All MPs (68), Conservative MPs (28) and Labour MPs (31),asked, Summer MPs 2014
55
41
31
24
24
24
22
17
14
13
All MPs
% Top mentions
Source: Ipsos MORI MPs survey
30

For any questions about the content of this slide deck or the infographic that it
supports, please contact one of:
Matthew Evans ([email protected] | 020 7347 3004)
Antonia Dickman ([email protected] | 020 7347 3157)