Green Global NCAP Labelling / Green Scoring … - HowMuchInfo.pdfHow Much Information Is Enough?...
13
How Much Information Is Enough? Green Global NCAP Labelling / Green Scoring Workshop Global Fuel Economy Initiative Gloria Esposito Programme Manager Low Carbon Vehicle Partnership [email protected]
Transcript of Green Global NCAP Labelling / Green Scoring … - HowMuchInfo.pdfHow Much Information Is Enough?...

How Much Information Is Enough?
Green Global NCAP Labelling / Green Scoring Workshop
Global Fuel Economy Initiative
Gloria Esposito
Programme Manager
Low Carbon Vehicle Partnership

� How does the information shown on fuel economy labels differ
internationally?
� Outline of research studies exploring presentation of environmental
information on product labels
� Examples of multi criteria environmental labels
� What insights have been gained from LowCVP research
� Conclusion – how to balance information
Outline of Presentation
Information processing theories
suggest there is a limit to the
amount of information a human can
absorb over a specific period of time.
(Born et al 2011)

Examples of information presented on fuel economy labels – benefits and drawbacks
Reduction in information
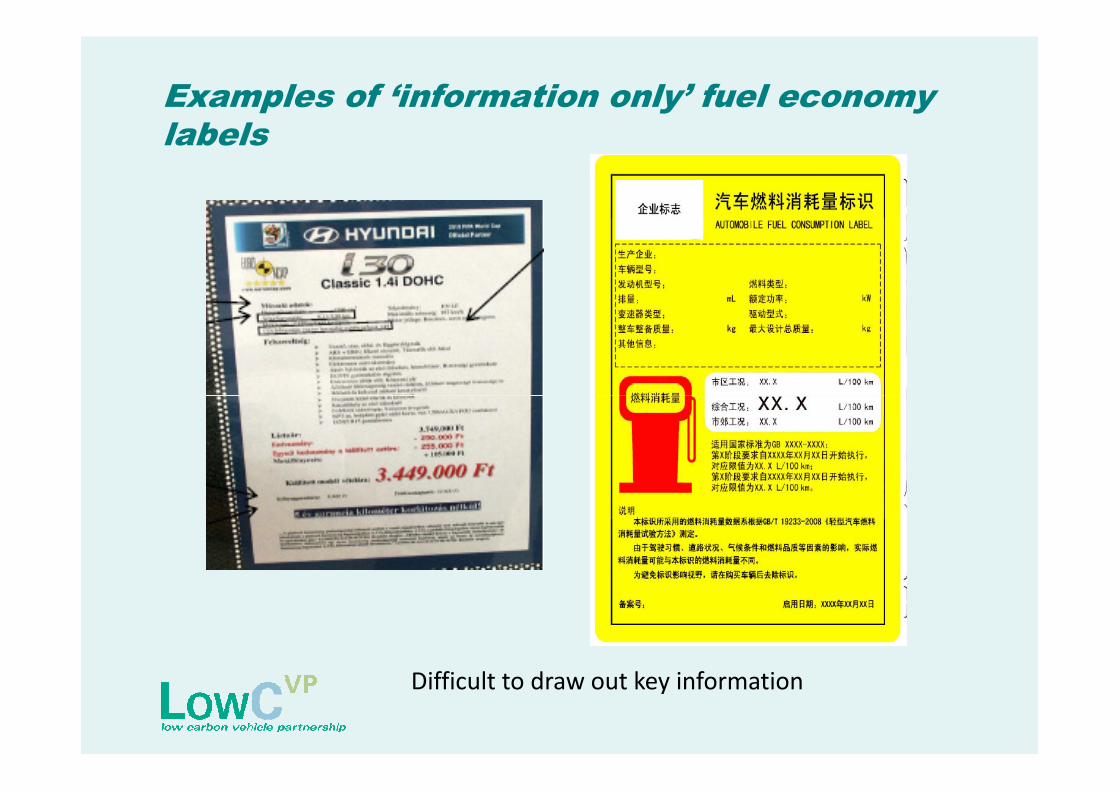
Examples of ‘information only’ fuel economy labels
Difficult to draw out key information

‘Hybrid’ Comparative Fuel Economy Labels
� Highly numerical
� High volume of information for
PHEV
� Smog rating (smaller size)?
� MPGe simplifies comparisons
� QR code & URL leads consumer
to further informationto further information
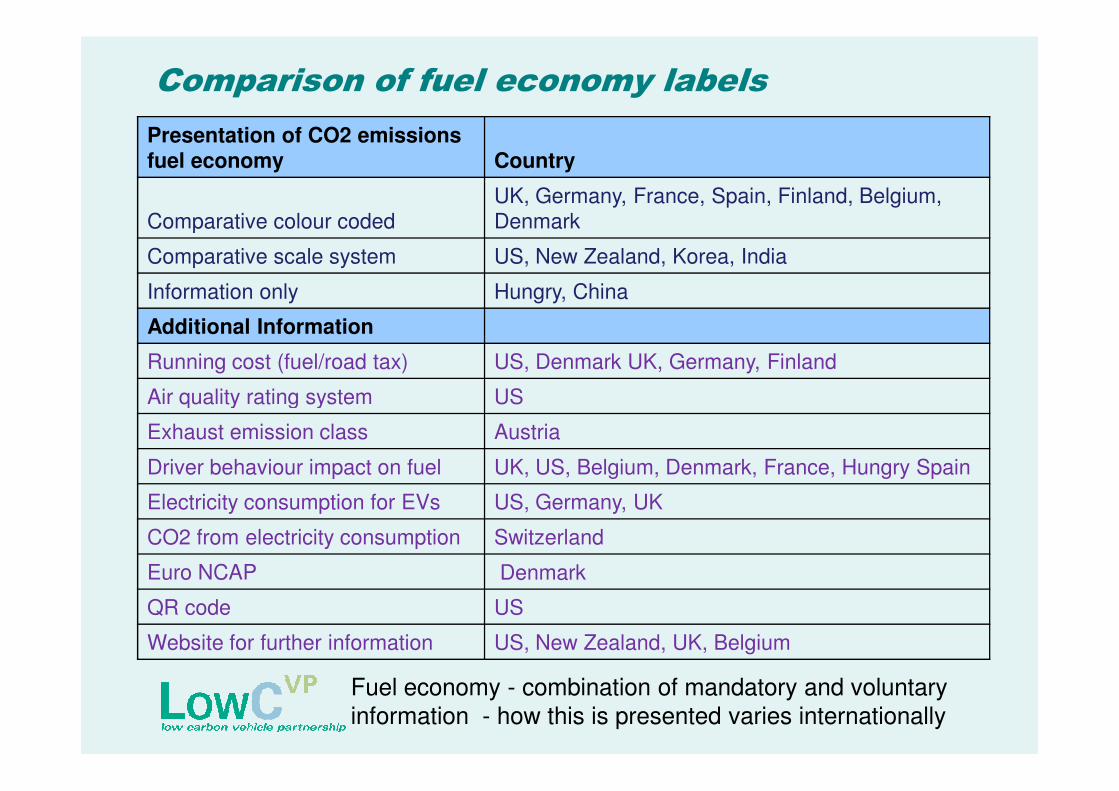
Comparison of fuel economy labels
Presentation of CO2 emissions fuel economy Country
Comparative colour codedUK, Germany, France, Spain, Finland, Belgium, Denmark
Comparative scale system US, New Zealand, Korea, India
Information only Hungry, China
Additional Information
Running cost (fuel/road tax) US, Denmark UK, Germany, Finland
Air quality rating system USAir quality rating system US
Exhaust emission class Austria
Driver behaviour impact on fuel UK, US, Belgium, Denmark, France, Hungry Spain
Electricity consumption for EVs US, Germany, UK
CO2 from electricity consumption Switzerland
Euro NCAP Denmark
QR code US
Website for further information US, New Zealand, UK, Belgium
Fuel economy - combination of mandatory and voluntary
information - how this is presented varies internationally
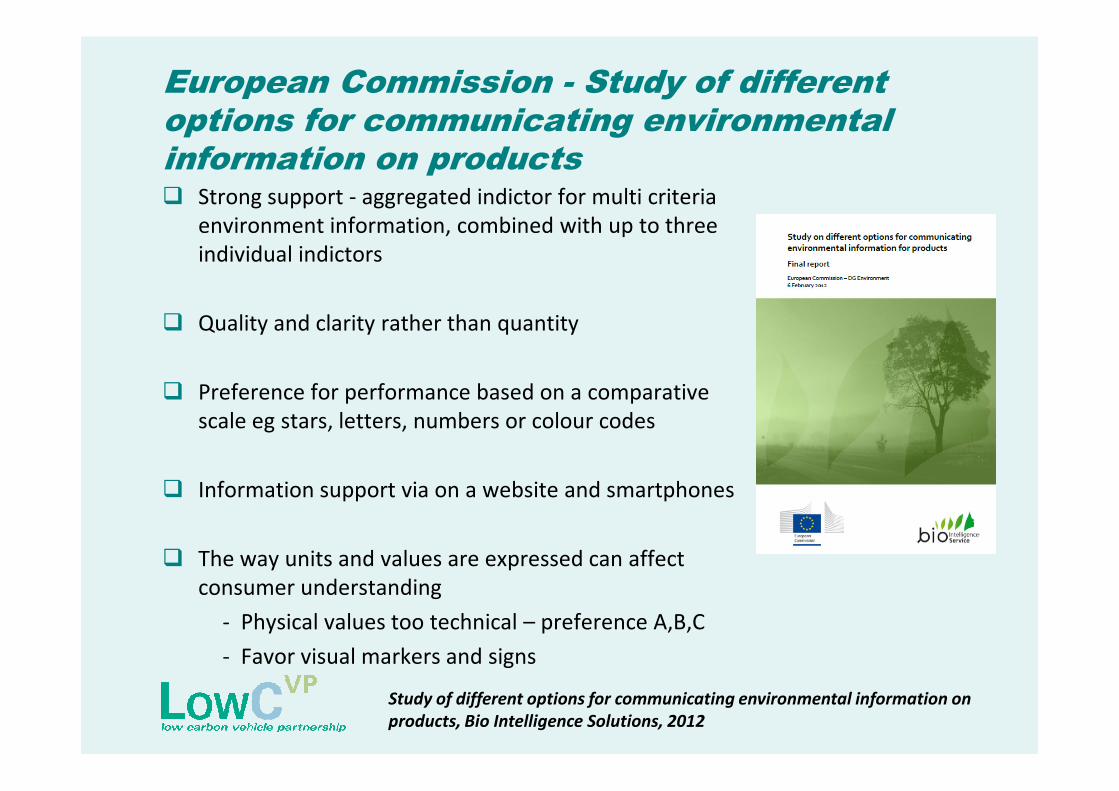
European Commission - Study of different options for communicating environmental information on products� Strong support - aggregated indictor for multi criteria
environment information, combined with up to three
individual indictors
� Quality and clarity rather than quantity
� Preference for performance based on a comparative � Preference for performance based on a comparative
scale eg stars, letters, numbers or colour codes
� Information support via on a website and smartphones
� The way units and values are expressed can affect
consumer understanding
- Physical values too technical – preference A,B,C
- Favor visual markers and signs
Study of different options for communicating environmental information on
products, Bio Intelligence Solutions, 2012

Three Optimal Environmental Designs Identified
Balance between level of technical information
and how it can be communicated to consumers to
be easily understood
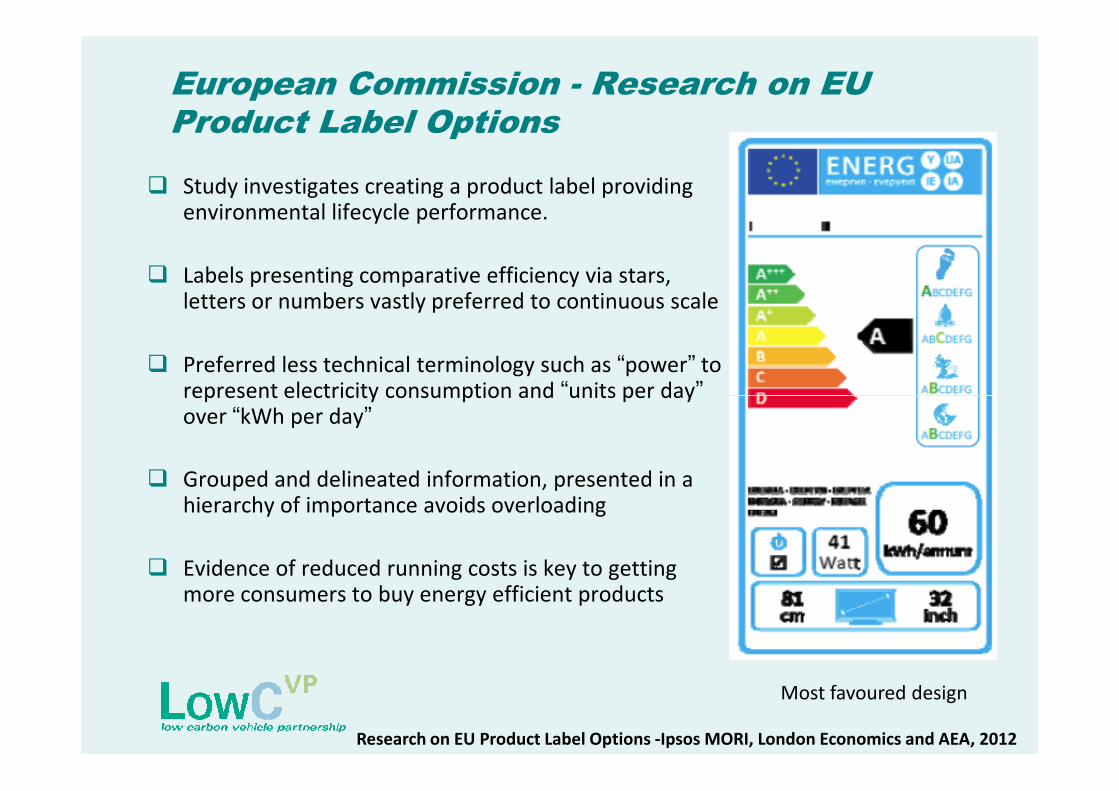
European Commission - Research on EU Product Label Options
� Study investigates creating a product label providing environmental lifecycle performance.
� Labels presenting comparative efficiency via stars, letters or numbers vastly preferred to continuous scale
� Preferred less technical terminology such as “power” to represent electricity consumption and “units per day”represent electricity consumption and “units per day”over “kWh per day”
� Grouped and delineated information, presented in a hierarchy of importance avoids overloading
� Evidence of reduced running costs is key to getting more consumers to buy energy efficient products
Most favoured design
Research on EU Product Label Options -Ipsos MORI, London Economics and AEA, 2012

Environmental Life Cycle Rating Label
� A weighted overall score and scores for four life
cycle impact stages
� Layered approach allows readers to choose
between abbreviated and detailed information
� Star rating systems - simplist for people to
Indicating Impact: The Environmental life-cycle rating label – Laron & Farkes, 2010
� Star rating systems - simplist for people to
understand, positive connotation across cultures
� Consumer survey – well received, expand
consumer awareness and contribute to
environmental purchasing decisions
‘The label is clearly laid out and
conveys a lot of information simply, I
would prefer a more concrete scale’

Do any of these labels risk information overload?

LowCVP Car Labeling Research Insights
� MPG important
� Fuel cost important
� CO2 figure less important, link to cost (tax)
� Recognise colour coded comparative scale
� Require more practical information on EV/PHEV
� Metrics related to EV/PHEV challenging
� Internet, and smart phones, dominant research � Internet, and smart phones, dominant research
method for consumers when buying a car
� Support for a QR code and URL on label
� Future proof the label to allow integration with
an increasingly digital world
By 2015 more people will access content and
services via the mobile web on smart phones
and tablets than laptops and computers
(International Telecommunication Union ).
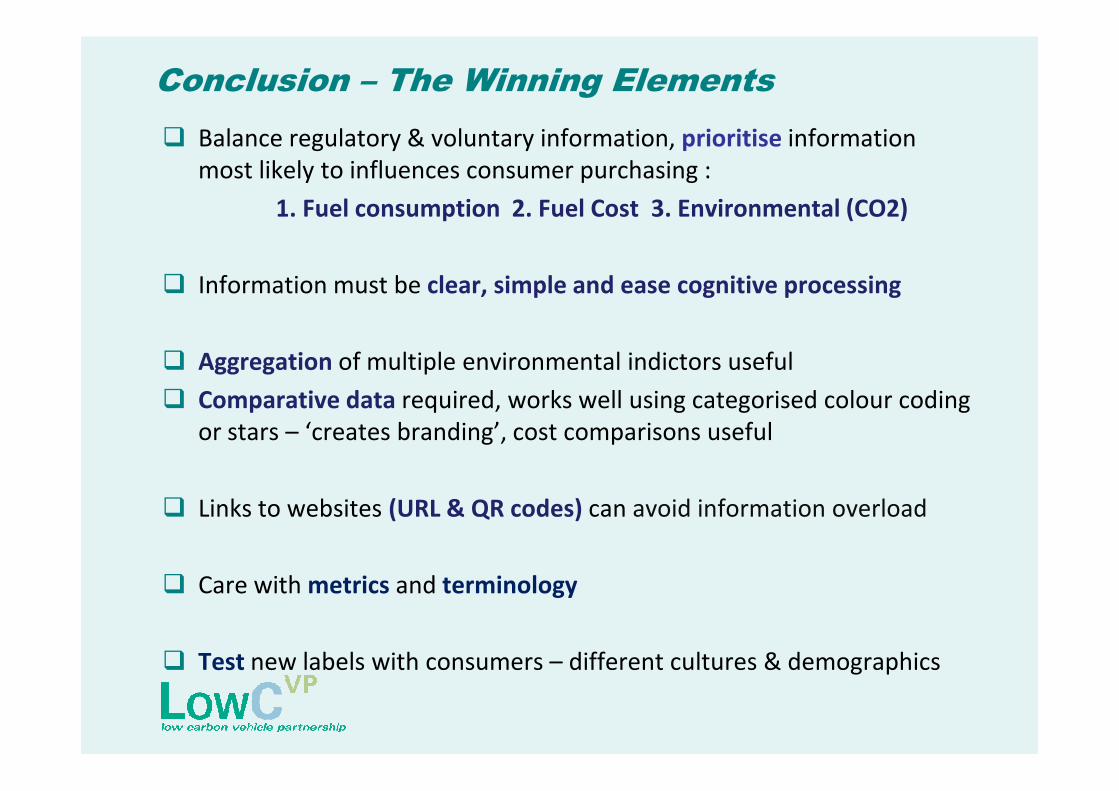
Conclusion – The Winning Elements
� Balance regulatory & voluntary information, prioritise information
most likely to influences consumer purchasing :
1. Fuel consumption 2. Fuel Cost 3. Environmental (CO2)
� Information must be clear, simple and ease cognitive processing
� Aggregation of multiple environmental indictors useful
� Comparative data required, works well using categorised colour coding � Comparative data required, works well using categorised colour coding
or stars – ‘creates branding’, cost comparisons useful
� Links to websites (URL & QR codes) can avoid information overload
� Care with metrics and terminology
� Test new labels with consumers – different cultures & demographics