Green and Blue Water Accounting in the Limpopo and … · Green and Blue Water Accounting in the...
48
IFPRI Discussion Paper 00907 October 2009 Green and Blue Water Accounting in the Limpopo and Nile Basins Implications for Food and Agricultural Policy Timothy B. Sulser Claudia Ringler Tingju Zhu Siwa Msangi Elizabeth Bryan Mark W. Rosegrant Environment and Production Technology Division
Transcript of Green and Blue Water Accounting in the Limpopo and … · Green and Blue Water Accounting in the...

IFPRI Discussion Paper 00907
October 2009
Green and Blue Water Accounting in the Limpopo and Nile Basins
Implications for Food and Agricultural Policy
Timothy B. Sulser Claudia Ringler
Tingju Zhu Siwa Msangi
Elizabeth Bryan Mark W. Rosegrant
Environment and Production Technology Division
INTERNATIONAL FOOD POLICY RESEARCH INSTITUTE
The International Food Policy Research Institute (IFPRI) was established in 1975. IFPRI is one of 15 agricultural research centers that receive principal funding from governments, private foundations, and international and regional organizations, most of which are members of the Consultative Group on International Agricultural Research (CGIAR).
FINANCIAL CONTRIBUTORS AND PARTNERS IFPRI’s research, capacity strengthening, and communications work is made possible by its financial contributors and partners. IFPRI receives its principal funding from governments, private foundations, and international and regional organizations, most of which are members of the Consultative Group on International Agricultural Research (CGIAR). IFPRI gratefully acknowledges the generous unrestricted funding from Australia, Canada, China, Finland, France, Germany, India, Ireland, Italy, Japan, Netherlands, Norway, South Africa, Sweden, Switzerland, United Kingdom, United States, and World Bank.
AUTHORS Timothy B. Sulser, International Food Policy Research Institute Scientist, Environment and Production Technology Division [email protected] Claudia Ringler, International Food Policy Research Institute Senior Research Fellow, Environment and Production Technology Division Tingju Zhu, International Food Policy Research Institute Scientist, Environment and Production Technology Division Siwa Msangi, International Food Policy Research Institute Senior Research Fellow, Environment and Production Technology Division Elizabeth Bryan, International Food Policy Research Institute Research Analyst, Environment and Production Technology Division Mark W. Rosegrant, International Food Policy Research Institute Division Director, Environment and Production Technology Division
Notices 1 Effective January 2007, the Discussion Paper series within each division and the Director General’s Office of IFPRI were merged into one IFPRI–wide Discussion Paper series. The new series begins with number 00689, reflecting the prior publication of 688 discussion papers within the dispersed series. The earlier series are available on IFPRI’s website at http://www.ifpri.org/category/publication-type/discussion-papers. 2 IFPRI Discussion Papers contain preliminary material and research results, and have been peer reviewed by at least two reviewers—internal and/or external. They are circulated in order to stimulate discussion and critical comment.
Copyright 2009 International Food Policy Research Institute. All rights reserved. Sections of this document may be reproduced for noncommercial and not-for-profit purposes without the express written permission of, but with acknowledgment to, the International Food Policy Research Institute. For permission to republish, contact [email protected].
iii
Contents
Abstract vii
1. Introduction 1
2. Background on the Limpopo and Nile River Basins 2
3. The International Model for Policy Analysis of Agricultural Commodities and Trade (IMPACT) 3
4. Baseline Scenario 5
5. Alternative Scenarios of Investment in Agricultural Technology, Research, and Development 15
6. Policy Implications and Conclusion 34
Appendix 35
References 36
iv
List of Tables
1. Global per capita income growth under the Baseline scenario (Year 2000 US$ per capita per year, thousands) 5
2. IMPACT’s Baseline projections of global total irrigated and rainfed harvested area (in million hectares) and annual growth rates 6
3. Key irrigated crops of the Limpopo and Nile Basins by area, Baseline projections 2000-2050 (in thousand hectares) 7 4. Key rainfed crops of the Limpopo and Nile Basins by area, Baseline projections 2000-2050 (in thousand hectares) 7 5. Annual growth rates of total consumptive blue and green water use in irrigated and rainfed agriculture of the Limpopo Basin, Nile Basin and entire globe under the Baseline and alternative
scenarios over two periods: 2000 to 2025 and 2025 to 2050 10 6. Water productivity for cereal production in the irrigated and rainfed systems of the Limpopo Basin,
Nile Basin, and entire globe (kilograms of harvested commodity per m3 of consumptive water use) 11 7. Baseline projections to 2050 of country-level net trade (=exports minus imports) for aggregate cereal and meat in the Limpopo and Nile River Basins (in million metric tons) 11 8. Baseline projections to 2050 of country-level malnourishment indicators, per capita kilocalorie
availability, total malnourished children, and percent malnourished children (by weight, ages 0-5) 14 9. Scenario details: agricultural technology investments and development (2000-2050) 15 10. Alternative scenario projections† to 2050 of country-level net trade (=exports-imports) for aggregate cereal in the Limpopo and Nile River Basins (in million metric tons) 17 11. Alternative scenario projections† to 2050 of country-level net trade (=exports-imports) for aggregate meat in the Limpopo and Nile River Basins (in million metric tons) 17 12. Absolute changes to per capita kilocalorie availability in alternative scenario projections to 2050 at the country level in the Limpopo and Nile River Basins 18 14. Alternative scenario projections to 2050 of percent changes in consumptive water use productivity for cereal production in the irrigated and rainfed systems of the Limpopo Basin, Nile Basin, and
entire globe (kilograms of harvested commodity per m3 of consumptive water use) 26
List of Figures
1a. Total consumptive blue and green water use (in km3) by irrigated and rainfed agriculture in the Limpopo Basin under the Baseline scenario in 2000, 2025, and 2050 8
1b. Total consumptive blue and green water use (in km3) by irrigated and rainfed agriculture in the Nile Basin under the Baseline scenario in 2000, 2025, and 2050 9 1c. Total consumptive blue and green water use (in km3) by irrigated and rainfed agriculture in the entire globe under the Baseline scenario in 2000, 2025, and 2050 9 2a. Production-weighted average global commodity-level prices for cereals for the Baseline and three
alternative technology scenarios 12 2b. Production-weighted average global commodity-level prices for (a) cereals and (b) meats for the
Baseline and three alternative technology scenarios 13

v
3a. Baseline and scenario projections (2000, 2025, 2050) of irrigated and rainfed blue/green consumptive water use by major grain production for maize in the Limpopo Basin 20
3b. Baseline and scenario projections (2000, 2025, 2050) of irrigated and rainfed blue/green consumptive water use by major grain production for sorghum in the Limpopo Basin 20
3c. Baseline and scenario projections (2000, 2025, 2050) of irrigated and rainfed blue/green consumptive water use by major grain production for rice in the Limpopo Basin 21
3d. Baseline and scenario projections (2000, 2025, 2050) of irrigated and rainfed blue/green consumptive water use by major grain production for wheat in the Limpopo Basin 21
4a. Baseline and scenario projections (2000, 2025, 2050) of irrigated and rainfed blue/green consumptive water use by sub-tropical fruit in the Limpopo Basin 22
4b. Baseline and scenario projections (2000, 2025, 2050) of irrigated and rainfed blue/green consumptive water use by temperate fruit in the Limpopo Basin 23
4c. Baseline and scenario projections (2000, 2025, 2050) of irrigated and rainfed blue/green consumptive water use by vegetables in the Limpopo Basin 23
4d. Baseline and scenario projections (2000, 2025, 2050) of irrigated and rainfed blue/green consumptive water use by groundnuts in the Limpopo Basin 24
5a. Baseline and scenario projections (2000, 2025, 2050) of irrigated and rainfed blue/green consumptive water use by cotton in the Limpopo Basin 24
5b. Baseline and scenario projections (2000, 2025, 2050) of irrigated and rainfed blue/green consumptive water use by sugarcane in the Limpopo Basin 25
5c. Baseline and scenario projections (2000, 2025, 2050) of irrigated and rainfed blue/green consumptive water use by cassava in the Limpopo Basin 25
6a. Baseline and scenario projections (2000, 2025, 2050) of irrigated and rainfed blue/green consumptive water use by major grain production for maize in the Nile Basin 27
6b. Baseline and scenario projections (2000, 2025, 2050) of irrigated and rainfed blue/green consumptive water use by major grain production for millet in the Nile Basin 27
6c. Baseline and scenario projections (2000, 2025, 2050) of irrigated and rainfed blue/green consumptive water use by major grain production for rice in the Nile Basin 28
6d. Baseline and scenario projections (2000, 2025, 2050) of irrigated and rainfed blue/green consumptive water use by major grain production for sorghum in the Nile Basin 28
6e. Baseline and scenario projections (2000, 2025, 2050) of irrigated and rainfed blue/green consumptive water use by major grain production for wheat in the Nile Basin. 29
7a. Baseline and scenario projections (2000, 2025, 2050) of irrigated and rainfed blue/green consumptive water use by sub-tropical fruits in the Nile Basin 30 7b. Baseline and scenario projections (2000, 2025, 2050) of irrigated and rainfed blue/green consumptive water use by vegetables in the Nile Basin 30 7c. Baseline and scenario projections (2000, 2025, 2050) of irrigated and rainfed blue/green consumptive water use by groundnuts in the Nile Basin 31 8a. Baseline and scenario projections (2000, 2025, 2050) of irrigated and rainfed blue/green consumptive water use by cassava in the Nile Basin 32 8b. Baseline and scenario projections (2000, 2025, 2050) of irrigated and rainfed blue/green consumptive water use sugarcane in the Nile Basin 32
vi
ACKNOWLEDGMENTS
This work was supported by the Federal Ministry for Economic Cooperation and Development, Germany under the project “Food and Water Security under Global Change: Developing Adaptive Capacity with a Focus on Rural Africa,” which forms part of the Consultative Group on International Agricultural Research Challenge Program on Water and Food (http://www.waterforfood.org/).

vii
ABSTRACT
Globally, most food is produced using soil moisture that comes from precipitation (i.e., “green” water). Moreover, most of the water that reaches plants in irrigated systems also stems from precipitation. Despite this, irrigation (or “blue”) water has typically been the focus for policy analysis, largely because it is possible for humans to manipulate blue water. This paper analyzes alternative water futures using a combined green and blue water accounting framework embedded within the water simulation components of IFPRI’s International Model for Policy Analysis of Agricultural Commodities and Trade (IMPACT). Future scenarios recently developed for the International Assessment of Agricultural Knowledge, Science and Technology for Development (IAASTD) and other studies are assessed with respect to this adjusted green/blue water accounting framework. The results reveal that accounting explicitly for green water resources broadens the scope of options for decision-makers who are seeking to improve agricultural production in the face of rising food and energy prices, a degrading water and land resource base, and increasing demands. This analysis highlight the importance of green/blue water accounting and presents a wider range of agricultural science and technology policy options for increasing global crop productivity across a span of potential futures.
Keywords: green water , blue water , ir r igation, rainfed, agr iculture, technology, investment, IMPACT

viii
ABBREVIATIONS AND ACRONYMS
IMPACT International Model for Policy Analysis of Agricultural Commodities and Trade IAASTD International Assessment of Agricultural Knowledge, Science and Technology for
Development CPWF Challenge Program for Water and Food SSA Sub-Saharan Africa FPU Food Producing Units UN United Nations MEA Millennium Ecosystem Assessment FAO Food and Agricultural Organization SRES Special Report on Emissions Scenarios IWSR Irrigation Water Supply Reliability
1
1. INTRODUCTION
Water scarcity is an increasingly critical issue for food production around the world (Rosegrant et al. 2002a; CPWF 2005). This is particularly true for the poorest region in the world: (SSA). The SSA region depends almost completely on rainfed agriculture, and malnutrition levels in the region are expected to increase (Rosegrant et al. 2005; World Bank 2007). Given that agriculture is the primary consumer of freshwater around the globe, and the demands from other sectors of society (e.g., domestic, industrial, livestock production, and environmental flows) are on the rise, strategies for the sustainable use of water in agriculture are urgently required.
Globally, most food is produced from soil moisture that comes from precipitation, or “green” water (Rockstrom et al. 2007; Schiermeier 2008). Moreover, most of the water that reaches plants in irrigated systems also stems from precipitation. Irrigation water accounts for the majority of crop water use only in areas subject to a dry season (during that season) or in systems located in arid areas (such as Egypt or Saudi Arabia). However, many production systems classified as rainfed involve small-scale applications of supplemental water intended to alleviate plant stress at critical stages of production (e.g., rainwater harvesting schemes). Thus, water applications for crop production follow a continuum from purely rainfed to purely irrigated, with the majority of crops produced from rainwater.
Given that the land resources available for agriculture are limited and declining in many parts of the world, the majority of future crop production growth is expected to come from improvements in crop yields. As irrigated cereal yields are 60 percent higher, on average, than rainfed yields, strategies for yield improvements often focus on how to improve or expand access to irrigation water (also known as “blue” water), ideally in combination with fertilizers and other crop inputs (Rosegrant et al. 2008a; World Bank 2007). In the mid-1990s, 38 percent of the cereal harvested area in developing countries was irrigated, accounting for 59 percent of total cereal production in those countries. In developed countries, where irrigation plays a smaller role, 18 percent of cereal area was irrigated during that same period accounting for 23 percent of total cereal production (Rosegrant et al. 2002a). While expansion of irrigated agriculture is expected to significantly increase crop yields, it is directly constrained by the limited development of water resources in some regions and the growing problem of physical water scarcity in other parts of the world.
In addition to country-level economic expansion and population growth and the dietary changes associated with these shifts, a number of other factors are predicted to affect the balance of rainfed and irrigated food production in the future. These factors include: global warming, which will likely lead to greater uncertainty regarding water supplies and increased investment in water control; higher energy prices, which will increase the cost of “high-tech” irrigated food production; the increased use of agricultural commodities for biofuels, which will reduce the water and land resources available for food crops; and technological changes, such as the introduction of new crop varieties with increased drought resistance, flood resistance, and heat tolerance under both rainfed and irrigated cultivation. Given the high level of uncertainty regarding the potential interplay of these factors, an analysis of the changing contribution of both green and blue water for food production under alternative scenarios will be crucial for the development of appropriate policy and investment responses.
This paper describes the blue-green water accounting framework embedded in the International Model for Policy Analysis of Agricultural Commodities and Trade (IMPACT), followed by a series of scenario results out to 2050 for the Limpopo and Nile River Basins, which are representative of the wide range of irrigation and rainfed agricultural conditions in SSA and South Asia. These discussions are followed by conclusions and policy recommendations.

2
2. BACKGROUND ON THE LIMPOPO AND NILE RIVER BASINS
The Limpopo and Nile River Basins, two key basins of SSA, are studied as part of the CGIAR Challenge Program on Water and Food (CPWF 2005). The Limpopo River of southern Africa covers 1.3 percent of the continent and spreads across four countries: Botswana, Mozambique, South Africa and Zimbabwe. The basin comprises an area of 416,296 km2; a large share of the basin lies in South Africa (45 percent), while the rest is divided roughly equally among Botswana (19 percent), Mozambique (21 percent), and Zimbabwe (15 percent).
The Limpopo Basin is a medium-sized basin that is home to a relatively small population of approximately 14 million individuals more or less evenly divided between rural (52 percent) and urban (48 percent) areas. Malnutrition is less prevalent in the Limpopo Basin countries than elsewhere in SSA. Using the malnutrition indicator of stunting by weight for preschool children (ages 0-5), national averages range between 12 and 19 percent in the Limpopo Basin compared with an average of almost 30 percent for SSA.
The annual rainfall in the Limpopo Basin varies between 250 mm in the hot, dry western and central areas to 1,050 mm in the high-rainfall eastern escarpment areas. The majority of the basin receives less than 400 mm of rainfall per annum. Rainfall is highly seasonal; 95 percent occurs between October and April, and there is often a midseason dry spell during critical periods of crop growth. Precipitation typically occurs on a number of isolated rainy days and in isolated locations, with seldom more than 50 rainy days per year. Rainfall varies significantly between years (CPWF 2005), and droughts and floods are common. The estimated total harvested area in the basin is 2,899,650 ha, 91 percent of which is rainfed. The most important food crop is maize, followed by wheat, cassava, sorghum, and groundnuts. While the Limpopo River supports impressive mangrove vegetation and freshwater ecosystems that provide an important source of food and income for local communities, food security is still a problem in the basin.
The Nile Basin flows through 12 countries in northeastern Africa. The river has two main tributaries: the White Nile, which originates in Burundi; and the Blue Nile, which originates in Ethiopia. These are joined by the Atbara River north of Khartoum, Sudan. The basin covers an area of 3,257,434 km2, much of which is contained within the borders of Sudan (64 percent), Ethiopia (11 percent), Egypt (9 percent), and Uganda (7 percent), with small portions contained within Tanzania, Kenya, Congo, Rwanda, Burundi, Eritrea, Chad, and the Central African Republic. Approximately 171 million people live in the basin (53 people per km2), with 57 percent living in rural areas. The cultivated area comprises more than 26 million ha, 84 percent of which is rainfed. The major crops include sorghum, millet, maize, groundnuts, and wheat. Livestock is also an important source of livelihood in the Nile Basin.
The most serious challenges for those living in the Nile Basin are poverty, food and water insecurity, land degradation, and water pollution. Furthermore, deforestation and cultivation of steep slopes have led to heavy soil erosion, loss of biodiversity, and sedimentation of lakes and reservoirs. Despite these problems, however, the resources of this large and complex water system have enormous potential to address poverty. Given the high levels of population growth predicted for the near future in the Nile Basin, enhanced agricultural development (e.g., through increased investment in water storage and irrigation) and a more equitable distribution of water resources are key areas of interest to governments and donor agencies. Some of these improvements are currently being implemented through the Nile Basin Initiative, which was formally launched in 1999 by the Council of Ministers of Water Affairs of nine out of the ten Nile Basin States (Eritrea currently participates as an observer).
3
3. THE INTERNATIONAL MODEL FOR POLICY ANALYSIS OF AGRICULTURAL COMMODITIES AND TRADE (IMPACT)
Model Structure The International Model for Policy Analysis of agricultural Commodities and Trade (IMPACT) is a partial equilibrium agricultural sector model that was developed in the early 1990s in response to the lack of a long-term vision and consensus regarding the actions necessary to feed the world and protect its natural resource base in the future (Rosegrant et al. 1995). IMPACT models the behavior of a competitive world agricultural market for crops and livestock, and is specified as a set of country or regional sub-models. Within each of these sub-models, IMPACT determines the supply, demand, and prices for agricultural commodities. The country and regional agricultural sub-models are linked through trade, and a global equilibrium is obtained through iteration, such that the sum of the global net trade balances is driven to zero for each commodity.
The model has been used for analyzing the current and future roles of agricultural commodities, and their impacts on food security and rural livelihoods. IMPACT has been applied for regional analyses and select country-level studies. Extensive details on the implementation of IMPACT in many different studies may be found in Rosegrant et al. (2008c).
In 2002, the model was expanded to include a Water Simulation Model, in an effort to better assess water as a key constraint to future food production and human well-being (Rosegrant et al. 2002a). A further update of IMPACT in 2006 included spatial disaggregation into 281 Food Producing Units (FPUs) and improved connections between the food and water simulation components (Rosegrant et al. 2008c). The FPU map in the Appendix shows the regions and river basins covered by the model for reader reference. Moreover, in the latest version of IMPACT it is possible to simulate water availability under climate change scenarios. This is done through a semi-distributed global hydrology model (underlying the Water Simulation Model) that parameterizes the dominant hydro-meteorological processes taking place at the land surface-atmosphere interface on a global scale.
This latest version of IMPACT is used for the present analysis. For each FPU, the model annually and seasonally simulates how water supply meets demand with long-term monthly climatology and hydrology predictions, projected water infrastructure capacities, and projected water demands for the domestic, industrial, livestock and irrigation sectors. The latter are based on various drivers, including population and income growth, changes in irrigated areas and cropping patterns, and improvements in water-use efficiencies. For large river basins that include multiple FPUs, sub-models for FPUs within the same basin are coupled through upstream-downstream water routing. With these capacities, the model can take into account precipitation, evapotranspiration, runoff, water-use efficiency, flow regulation through reservoirs and groundwater storage, nonagricultural water demand, water supply infrastructure and withdrawal capacity, and environmental requirements at the river basin, country, and regional levels.
The combined water-food modeling framework provides a wide range of opportunities for analyzing water availability, food security, and environmental conservation at the basin, country, and global scales. Due to the complexity of modeling at this scale, however, a number of elements that are important to food and water security are held implicitly constant (e.g., water pollution, land degradation, and even political governance). The assessment of these issues will require a more refined modeling setup that focuses only on a particular water basin or sub-region, any use of IMPACT outputs should be tempered with the consideration that these localized processes will influence the actual outcomes.
Accounting for Green and Blue Water Both blue and green water are represented in the water module of IMPACT. However, because studies and metrics typically focus on irrigation water, the water accounting does not incorporate total precipitation; rather, IMPACT represents green water as the effective precipitation (that which is intercepted and used by crops) for each crop.
4
Crop water demand may be satisfied wholly or in part by green water. For irrigated areas, the net crop demand for blue water is the remainder that is not met by effective precipitation. The total effective blue water demand (or depletion) is calculated based on crop water demands and location-specific basin water use efficiencies. Details on this irrigation/blue water accounting can be found in Appendix A of Rosegrant et al. (2002a).
The annual green water consumption (GWC) for a crop in a given basin is calculated as follows:
This is the minimum (min) of either the annual sum (∑m) of the monthly evapotranspiration (ETm) requirements, or the annual sum of the monthly effective precipitation (PEm) provided that there are crop requirements in any given month (KCm>0). The former is the case for purely rainfed crop production, while the latter represents crops that might receive irrigation water.

5
4. BASELINE SCENARIO
Assumptions Underlying the Baseline1
The Baseline scenario uses the UN medium variant projections (United Nations, 2005), in which the global population increases from slightly more than 6 billion in 2000 to about 9 billion in 2050. Most of this growth is concentrated in middle- and low-income countries (e.g., Brazil, India, China and Russia), while this parameter continues to slow in high-income countries. Population growth drives changes in food demand and is an indirect driver of investments in agricultural technology, research, and development.
The economic growth assumptions used in the Baseline scenario are based on the TechnoGarden scenario of the Millennium Ecosystem Assessment (MEA, 2005), with adjustments reflecting the authors’ assessments of growth potential in different regions (Table 1). Incomes are expressed as year-2000 US dollars. The economic growth assumptions of the TechnoGarden scenario are similar to the mid-range growth scenarios available in the literature for the world as a whole and for most of the relevant regions. Baseline agricultural productivity values are based on the TechnoGarden scenario (MEA, 2005), recent FAO interim report projections to 2030/2050 (FAO, 2006), and other work synthesized for the International Assessment of Agricultural Knowledge, Science and Technology for Development (Rosegrant et al., 2008a).
Table 1. Global per capita income growth under the Baseline scenario (Year 2000 US$ per capita per year, thousands)
2000 2010 2020 2030 2040 2050 Growth Rate
2000-2050
East Asia 1.2 2.1 3.6 5.7 9.2 14.4 5.2%
Southeast Asia 1.3 1.8 3.0 4.7 7.4 11.8 4.6%
South Asia 0.5 0.7 1.2 1.8 3.1 5.5 5.1%
Sub-Saharan Africa 0.6 0.7 0.8 1.1 1.5 2.3 2.8%
Latin America & Caribbean 4.0 4.6 6.2 9.1 14.1 22.3 3.5%
Eastern Europe & Central Asia 2.6 4.1 5.5 7.5 11.0 16.6 3.8%
Middle East & North Africa 1.6 1.9 2.3 2.9 3.8 5.6 2.5%
Developing World 1.3 1.8 2.6 3.8 5.9 9.1 4.1%
High Income 28.4 32.9 40.7 49.9 59.4 68.6 1.8%
World 5.6 6.5 8.1 10.3 13.1 17.0 2.3%
Source: Authors
Climate change not only drives the outcomes of key variables in the Baseline scenario (e.g., crop productivity and water availability), it is an outcome of the agricultural projections (through land-use changes and agricultural emissions, mainly from the livestock sector). The Baseline climate change scenario is based on the “B2” scenario specified in the Intergovernmental Panel on Climate Change
1 The full specification of model assumptions is presented in Rosegrant et al. (2008b, 2008c); only key elements are presented here.

6
Special Report on Emissions Scenarios (SRES) (Nakicenovic and Swart, 2000) and uses the ensemble mean results of the HadCM3 model and applies the pattern-scaling method of the Climate Research Unit of the University of East Anglia. The SRES B2 HadCM3 climate scenario is a transient scenario depicting gradual climate evolution from 2000 through 2100. In the present work, medium energy outcomes are assumed in the Baseline, based on the SRES B2 scenario. SRES B2 HadCM3 is relatively benign in terms of climate change compared to other SRES scenarios; the results discussed in this paper might have been less favorable if a more severe scenario were used as the basis.
Regarding assumptions for biofuel expansion, the Baseline posits continued biofuel expansion through 2020 based on actual national biofuel plans, with the rate of expansion declining after 2010 for early rapid-growth countries (e.g., the United States and Brazil). Under this scenario, significant increases of biofuel feedstock demand occur in many countries for commodities such as maize, wheat, cassava, sugar, and oil seeds. By 2020, the United States is projected to put 130 million metric tons (mt) of maize into biofuel production annually; European countries are expected to use 10.7 million mt of wheat and 14.5 million mt of oil seeds for biofuel production; and Brazil is projected to use 9.0 million mt of sugar equivalent for biofuel production. The volume of biofuel feedstock demand plateaus starting in 2025; this represents a predicted relaxation in the demand for feedstock crops, due to the rise of second- and third-generation technologies capable of using nonfood grasses, forest products, and other products (e.g., algae) to meet biofuel demands.
Baseline Results Overall Baseline results are presented in Rosegrant et al. (2008b). The present work focuses specifically on the results that are specific to green and blue water use.
Globally, the irrigated harvested area is expected to increase by 0.24 percent annually during 2000-2050, while the rainfed harvested area is projected to increase by 0.13 percent per year. Total area is projected to expand rapidly during 2000-2025, followed by a contraction during 2025-2050 as population pressure declines (Table 2). The results specific to the Limpopo and Nile Basins show how this global total translates to specific basin-level developments.
Table 2. IMPACT’s Baseline projections of global total irrigated and rainfed harvested area (in million hectares) and annual growth rates
Areas Annual Growth Rates
2000 2025 2050 2000-2025 2025-2050
Irrigated 421 476 474 0.49% -0.02%
Rainfed 823 896 877 0.34% -0.09%
Source: Authors
The top five irrigated and rainfed crops in terms of area for the Limpopo and Nile Basins are presented in Tables 3 and 4. Rainfed production accounts for the majority of agricultural production in the Nile Basin both at present and in the projected future, expanding slightly from 76 percent of total harvested area in year 2000 to about 80 percent by 2050. Notably, expansion of the irrigated harvested area is not expected to keep pace with the faster expansion of the rainfed area. In the Limpopo Basin, on the other hand, the rainfed harvested area is projected to contract slightly (by 1.2 percent) while the irrigated harvested area is expected to increase (by nearly 4.5 percent). This keeps the total agricultural area in the basin roughly constant out to 2050.

7
Table 3. Key irrigated crops of the Limpopo and Nile Basins by area, Baseline projections 2000-2050 (in thousand hectares)
2000 2025 2050
Limpopo Maize 155 141 80
Wheat 91 84 57
Sugarcane 58 78 96
Cotton 22 28 52
Rice 12 21 33
Total 406 437 422
Nile Maize 992 1,088 1,067
Sorghum 565 766 878
Wheat 497 694 709
Millet 561 546 636
Vegetables 357 490 563
Total 5,750 6,519 6,907
Source: Authors
Table 4. Key rainfed crops of the Limpopo and Nile Basins by area, Baseline projections 2000-2050 (in thousand hectares)
2000 2025 2050
Limpopo Maize 1,441 1,247 1,011
Cassava 237 297 298
Sorghum 193 243 279
Wheat 153 121 97
Groundnut 116 139 144
Total 3,114 3,197 3,092
Nile Sorghum 4,836 6,853 7,800
Millet 1,935 1,941 2,255
Groundnuts 1,133 902 987
Maize 967 1,055 910
Sub-tropical Fruits 664 854 1,035
Total 17,775 23,574 28,357
Source: Authors
Grains dominate agricultural production in both basins on the rainfed and irrigated areas. Raw sugarcane dominates in sheer tonnage across irrigated and rainfed production in both the Limpopo and Nile Basins. Fruits and vegetables are also large factors in the bulk of production, though much more so in the irrigated Nile Basin. In both basins, the key cereals are mostly rainfed, with the exceptions of wheat

8
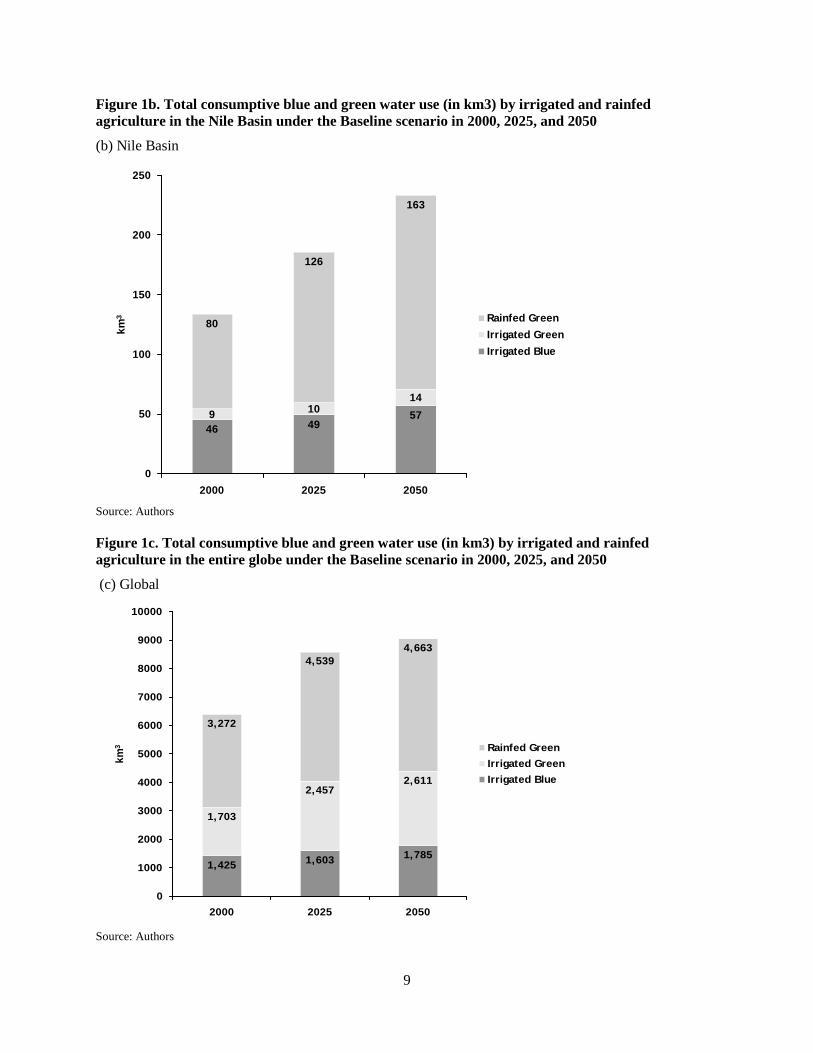
in the Nile Basin, where irrigation dominates, and maize, where the irrigated and rainfed areas are similar. Roots and tubers (particularly cassava, followed by potato) are essential staples in both basins. Globally, crop water consumption is expected to increase at 0.7 percent per year, from 6400 km3 in 2000 to 8600 km3 by 2025 and 9060 km3 by 2050 (Figure 1 and Table 5). Globally, blue water use in irrigated areas accounted for 22 percent of total crop water depletion in 2000. This share is expected to decline to 20 percent of total crop water depletion by 2050, despite higher expansion of irrigated versus rainfed areas. The underlying reason for this is the higher projected relative expansion of irrigated area in wetter locations, where a relatively smaller share of total crop water comes from irrigation water. Thus, global crop water use satisfied by precipitation onto irrigated land is projected to account for 36 percent of total crop water use by 2050 (up from 34 percent in 2000).
Figure 1a. Total consumptive blue and green water use (in km3) by irrigated and rainfed agriculture in the Limpopo Basin under the Baseline scenario in 2000, 2025, and 2050.
(a) Limpopo Basin
Source: Authors
9
Figure 1b. Total consumptive blue and green water use (in km3) by irrigated and rainfed agriculture in the Nile Basin under the Baseline scenario in 2000, 2025, and 2050
(b) Nile Basin
Source: Authors
Figure 1c. Total consumptive blue and green water use (in km3) by irrigated and rainfed agriculture in the entire globe under the Baseline scenario in 2000, 2025, and 2050
(c) Global
Source: Authors
46 49579 1014
80
126
163
0
50
100
150
200
250
2000 2025 2050
km3 Rainfed Green
Irrigated GreenIrrigated Blue
1,425 1,603 1,785
1,703
2,4572,611
3,272
4,5394,663
0
1000
2000
3000
4000
5000
6000
7000
8000
9000
10000
2000 2025 2050
km3 Rainfed Green
Irrigated GreenIrrigated Blue
10
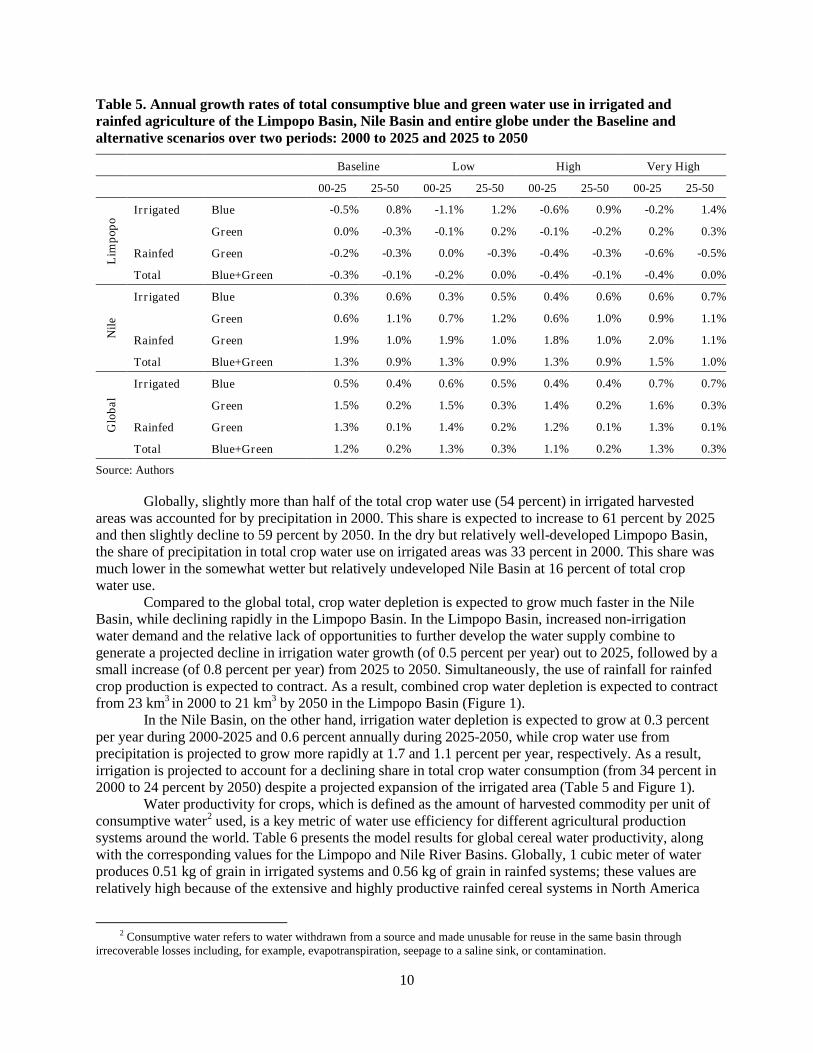
Table 5. Annual growth rates of total consumptive blue and green water use in irrigated and rainfed agriculture of the Limpopo Basin, Nile Basin and entire globe under the Baseline and alternative scenarios over two periods: 2000 to 2025 and 2025 to 2050
Baseline Low High Very High
00-25 25-50 00-25 25-50 00-25 25-50 00-25 25-50
Lim
popo
Ir r igated Blue -0.5% 0.8% -1.1% 1.2% -0.6% 0.9% -0.2% 1.4%
Green 0.0% -0.3% -0.1% 0.2% -0.1% -0.2% 0.2% 0.3%
Rainfed Green -0.2% -0.3% 0.0% -0.3% -0.4% -0.3% -0.6% -0.5%
Total Blue+Green -0.3% -0.1% -0.2% 0.0% -0.4% -0.1% -0.4% 0.0%
Nile
Ir r igated Blue 0.3% 0.6% 0.3% 0.5% 0.4% 0.6% 0.6% 0.7%
Green 0.6% 1.1% 0.7% 1.2% 0.6% 1.0% 0.9% 1.1%
Rainfed Green 1.9% 1.0% 1.9% 1.0% 1.8% 1.0% 2.0% 1.1%
Total Blue+Green 1.3% 0.9% 1.3% 0.9% 1.3% 0.9% 1.5% 1.0%
Glo
bal
Ir r igated Blue 0.5% 0.4% 0.6% 0.5% 0.4% 0.4% 0.7% 0.7%
Green 1.5% 0.2% 1.5% 0.3% 1.4% 0.2% 1.6% 0.3%
Rainfed Green 1.3% 0.1% 1.4% 0.2% 1.2% 0.1% 1.3% 0.1%
Total Blue+Green 1.2% 0.2% 1.3% 0.3% 1.1% 0.2% 1.3% 0.3%
Source: Authors
Globally, slightly more than half of the total crop water use (54 percent) in irrigated harvested areas was accounted for by precipitation in 2000. This share is expected to increase to 61 percent by 2025 and then slightly decline to 59 percent by 2050. In the dry but relatively well-developed Limpopo Basin, the share of precipitation in total crop water use on irrigated areas was 33 percent in 2000. This share was much lower in the somewhat wetter but relatively undeveloped Nile Basin at 16 percent of total crop water use.
Compared to the global total, crop water depletion is expected to grow much faster in the Nile Basin, while declining rapidly in the Limpopo Basin. In the Limpopo Basin, increased non-irrigation water demand and the relative lack of opportunities to further develop the water supply combine to generate a projected decline in irrigation water growth (of 0.5 percent per year) out to 2025, followed by a small increase (of 0.8 percent per year) from 2025 to 2050. Simultaneously, the use of rainfall for rainfed crop production is expected to contract. As a result, combined crop water depletion is expected to contract from 23 km3 in 2000 to 21 km3 by 2050 in the Limpopo Basin (Figure 1).
In the Nile Basin, on the other hand, irrigation water depletion is expected to grow at 0.3 percent per year during 2000-2025 and 0.6 percent annually during 2025-2050, while crop water use from precipitation is projected to grow more rapidly at 1.7 and 1.1 percent per year, respectively. As a result, irrigation is projected to account for a declining share in total crop water consumption (from 34 percent in 2000 to 24 percent by 2050) despite a projected expansion of the irrigated area (Table 5 and Figure 1).
Water productivity for crops, which is defined as the amount of harvested commodity per unit of consumptive water2
2 Consumptive water refers to water withdrawn from a source and made unusable for reuse in the same basin through
irrecoverable losses including, for example, evapotranspiration, seepage to a saline sink, or contamination.
used, is a key metric of water use efficiency for different agricultural production systems around the world. Table 6 presents the model results for global cereal water productivity, along with the corresponding values for the Limpopo and Nile River Basins. Globally, 1 cubic meter of water produces 0.51 kg of grain in irrigated systems and 0.56 kg of grain in rainfed systems; these values are relatively high because of the extensive and highly productive rainfed cereal systems in North America

11
and Europe. Water productivity is expected to increase over time for both irrigated and rainfed systems, with 2050 productivity levels predicted to be 0.64 kg and 0.73 kg of grain per cubic meter of water, respectively.
Table 6. Water productivity for cereal production in the irrigated and rainfed systems of the Limpopo Basin, Nile Basin, and entire globe (kilograms of harvested commodity per m3 of consumptive water use)
2000 2025 2050 Limpopo Irrigated 0.28 0.41 0.45 Rainfed 0.32 0.47 0.61 Nile Irrigated 0.41 0.53 0.53 Rainfed 0.18 0.26 0.27 Global Irrigated 0.51 0.59 0.64 Rainfed 0.56 0.62 0.73
Source: Authors
Table 7. Baseline projections to 2050 of country-level net trade (=exports minus imports) for aggregate cereal and meat in the Limpopo and Nile River Basins (in million metric tons)
Cereals Meats
2000 2025 2050 2000 2025 2050 Limpopo Botswana -0.20 -0.17 -0.20 0.02 0.03 0.02 Mozambique -0.63 -0.14 -1.23 -0.01 -0.19 -0.83 South Africa -1.94 -1.83 -5.85 -0.15 -0.14 -0.59 Zimbabwe -0.49 -0.33 -0.86 0.01 0.13 0.11 Nile Burundi -0.05 -0.06 -0.56 0.00 -0.03 -0.15 Cent. Afr. Rep. -0.04 0.13 0.14 0.00 0.03 -0.03 Chad -0.17 -0.37 -1.56 0.00 -0.24 -0.71 Congo - DRC -0.63 -0.95 -4.12 -0.02 -0.13 -0.49 Egypt -8.08 -17.53 -33.16 -0.30 -0.52 -1.66 Eritrea -0.43 -0.70 -1.23 0.00 -0.04 -0.12 Ethiopia -1.81 2.45 -5.88 -0.01 -0.55 -1.57 Kenya -1.50 0.11 -3.14 -0.13 -0.52 -1.79 Rwanda -0.12 0.06 -0.20 -0.01 -0.04 -0.18 Sudan -0.98 2.43 1.81 0.00 -0.41 -1.52 Tanzania -0.99 -0.58 -2.59 -0.10 -0.47 -1.32 Uganda -0.12 0.39 -3.77 -0.04 -0.55 -2.70
Source: Authors
The water productivity levels in the Limpopo and Nile Basins are lower than the global average. In the Limpopo Basin, the irrigated and rainfed water productivities are only 0.28 kg and 0.32 kg per cubic meter of water, respectively. However, both rainfed and irrigated crop water productivities are expected to significantly improve over the projected horizon. In the Nile Basin, irrigated water productivity was close to the global average at 0.41 kg in 2000 and is expected to increase to 0.53 kg by 2050. Rainfed water productivity in the Nile Basin, on the other hand, was only 0.18 kg in 2000 (even lower than that in the Limpopo Basin). Improvements in rainfed crop yields are projected to increase
12
rainfed productivity to 0.27 kg by 2050, but this is still below the level achieved in the Limpopo Basin in 2000.
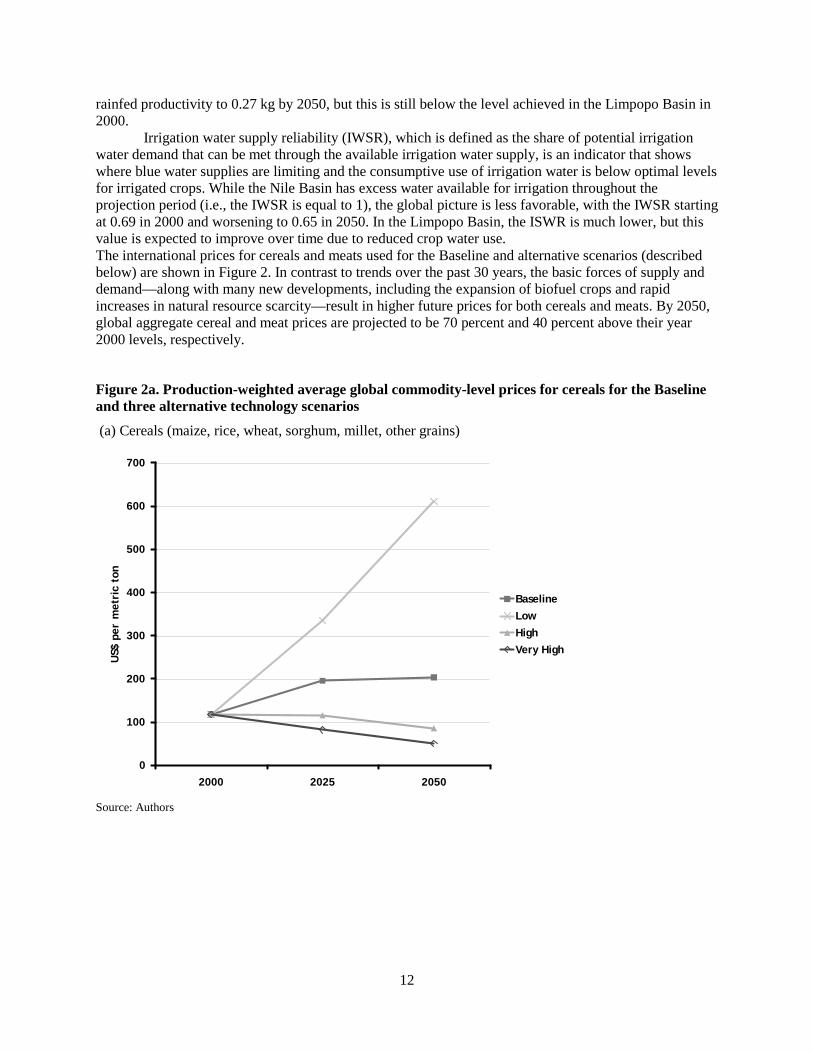
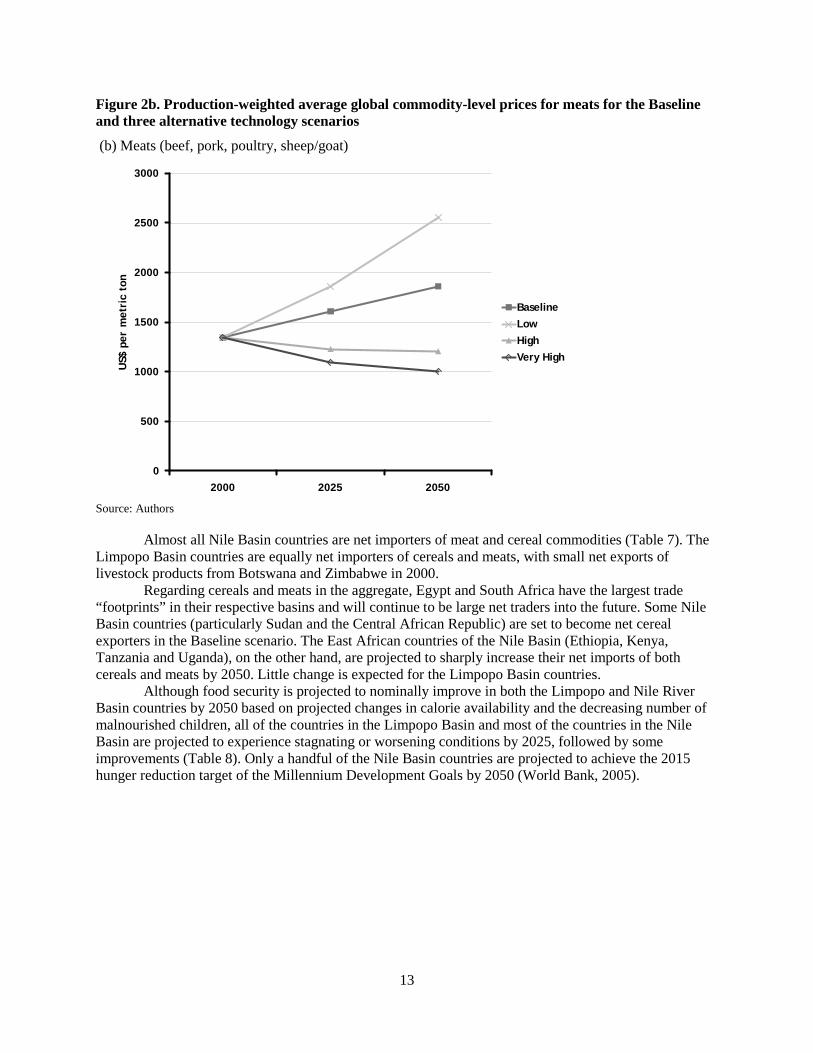
Irrigation water supply reliability (IWSR), which is defined as the share of potential irrigation water demand that can be met through the available irrigation water supply, is an indicator that shows where blue water supplies are limiting and the consumptive use of irrigation water is below optimal levels for irrigated crops. While the Nile Basin has excess water available for irrigation throughout the projection period (i.e., the IWSR is equal to 1), the global picture is less favorable, with the IWSR starting at 0.69 in 2000 and worsening to 0.65 in 2050. In the Limpopo Basin, the ISWR is much lower, but this value is expected to improve over time due to reduced crop water use. The international prices for cereals and meats used for the Baseline and alternative scenarios (described below) are shown in Figure 2. In contrast to trends over the past 30 years, the basic forces of supply and demand—along with many new developments, including the expansion of biofuel crops and rapid increases in natural resource scarcity—result in higher future prices for both cereals and meats. By 2050, global aggregate cereal and meat prices are projected to be 70 percent and 40 percent above their year 2000 levels, respectively.
Figure 2a. Production-weighted average global commodity-level prices for cereals for the Baseline and three alternative technology scenarios
(a) Cereals (maize, rice, wheat, sorghum, millet, other grains)
Source: Authors
0
100
200
300
400
500
600
700
2000 2025 2050
US$
per
met
ric
ton
BaselineLowHighVery High
13
Figure 2b. Production-weighted average global commodity-level prices for meats for the Baseline and three alternative technology scenarios
(b) Meats (beef, pork, poultry, sheep/goat)
Source: Authors
Almost all Nile Basin countries are net importers of meat and cereal commodities (Table 7). The Limpopo Basin countries are equally net importers of cereals and meats, with small net exports of livestock products from Botswana and Zimbabwe in 2000.
Regarding cereals and meats in the aggregate, Egypt and South Africa have the largest trade “footprints” in their respective basins and will continue to be large net traders into the future. Some Nile Basin countries (particularly Sudan and the Central African Republic) are set to become net cereal exporters in the Baseline scenario. The East African countries of the Nile Basin (Ethiopia, Kenya, Tanzania and Uganda), on the other hand, are projected to sharply increase their net imports of both cereals and meats by 2050. Little change is expected for the Limpopo Basin countries.
Although food security is projected to nominally improve in both the Limpopo and Nile River Basin countries by 2050 based on projected changes in calorie availability and the decreasing number of malnourished children, all of the countries in the Limpopo Basin and most of the countries in the Nile Basin are projected to experience stagnating or worsening conditions by 2025, followed by some improvements (Table 8). Only a handful of the Nile Basin countries are projected to achieve the 2015 hunger reduction target of the Millennium Development Goals by 2050 (World Bank, 2005).
0
500
1000
1500
2000
2500
3000
2000 2025 2050
US$
per
met
ric
ton
BaselineLowHighVery High

14
Table 8. Baseline projections to 2050 of country-level malnourishment indicators, per capita kilocalorie availability, total malnourished children, and percent malnourished children (by weight, ages 0-5)
Per Capita Kilocalor ies Available Total Malnour ished (thousands)
2000 2025 2050 2000 2025 2050 Limpopo Botswana 2,181 2,472 3,327 29 48 15 Mozambique 1,999 2,193 2,606 591 715 360 South Africa 2,890 2,859 3,212 605 1,076 562 Zimbabwe 2,039 1,619 2,158 234 408 146 Nile Burundi 1,879 1,859 2,045 519 1,031 1,327 Cent. Afr. Rep. 1,941 1,954 2,501 119 140 66 Chad 2,170 2,434 2,747 437 730 732 Congo - DRC 1,665 1,617 1,698 2,955 5,376 5,694 Egypt 3,355 3,260 3,861 328 252 - Eritrea 1,559 1,504 1,942 119 182 105 Ethiopia 1,946 1,972 2,408 5,709 7,507 6,397 Kenya 2,179 2,144 2,690 950 1,087 527 Rwanda 2,136 2,344 2,889 331 417 313 Sudan 2,286 2,293 3,167 2,035 2,098 1,452 Tanzania 1,947 2,078 2,681 1,686 1,735 953 Uganda 2,386 2,492 3,041 1,141 1,846 1,393
Source: Authors

15
5. ALTERNATIVE SCENARIOS OF INVESTMENT IN AGRICULTURAL TECHNOLOGY, RESEARCH, AND DEVELOPMENT
Three Alternative Scenario Specifications The scenario approach associated with the projections presented herein focuses on alternative paths (policy options) for technological development and investments in agricultural productivity compared to the Baseline scenario described above. Three alternatives are considered (for general details, see Table 9). These scenarios are distinct from the elements specified in the above section detailing the underlying model assumptions, and are crafted to focus the present analysis on possible policy interventions.
• The “Low” scenario presents a fairly pessimistic view of future developments promoting agricultural production around the world, and includes a further reduction in the already slowing rates of investment in agricultural research and development.
• The “High” scenario inverts the trends of the Low scenario. This is an optimistic outlook assuming that governments and other decision-makers around the world will prioritize investment in the foundations of agricultural productivity, particularly in the developing world.
• The “Very High” scenario augments the improved situation found in the High scenario with increased investment in yield improvements and the intensification of existing agricultural systems. Agricultural productivity investments are further enhanced with investments in irrigation infrastructure and in other critical poverty- and malnutrition-reducing investments.
Table 9. Scenario details: agricultural technology investments and development (2000-2050)
Reference Scenar io
(global average)
Alternative Scenar ios of Investment in Agr icultural Technology, Research, and Development
(change from Baseline Scenar io)
Parameter s Reference Low Ag. R&D High Ag. R&D
Very High plus other pover ty
reduction investments
Global GDP growth (global, % per year) 3.07% annual 2.86 3.31 3.31
Livestock numbers and yield growth 0.71% annual -20% +20% +30%
Food crop yield growth 1.14% annual -40% +40% +60%
Irrigated area growth 1.07% annual n.c. n.c. +25%
Rainfed area growth 0.12% annual n.c. n.c. -15%
Basin water use efficiency 0.57 in 2050 n.c. n.c. Increase by 0.15 by
2050 (max 0.85)
Access to water (66% of regions have full access) 0.45 to 0.99 for regions
w/out full access n.c. n.c. Increase by 50% relative to Baseline
by 2050

16
Table 9. Continued
Reference Scenar io
(global average)
Alternative Scenar ios of Investment in Agr icultural Technology, Research, and Development
(change from Baseline Scenar io)
Parameter s Reference Low Ag. R&D High Ag. R&D
Very High plus other pover ty
reduction investments
Female secondary education (40% of regions have full parity)
0.19 to 0.99 for regions w/out full parity n.c. n.c. Overall improvement
by 50% by 2050
Source: Authors ‘n.c.’ = no change
Alternative Scenario Outcomes
Prices, Net Trade, and Food Security in the Limpopo and Nile Basin Countries
The trajectories of global, commodity-level, and aggregate cereal and meat prices differ markedly across the alternative futures, indicating the importance of appropriate policy choices and investments (Figure 2). While the Low scenario yields cereal prices that are three times higher and meat prices that are 40 percent higher than those obtained under the Baseline scenario in 2050, the High/Very High scenarios show much more favorable outcomes. Compared to the Baseline outcome in 2050, aggregate cereal prices are cut in half in the High scenario and by another 25 percent in the Very High scenario. The impact on meat prices is smaller in percentage terms, but more important in absolute values: the High and Very High scenarios cut 2050 meat prices by over a third and nearly in half, respectively.
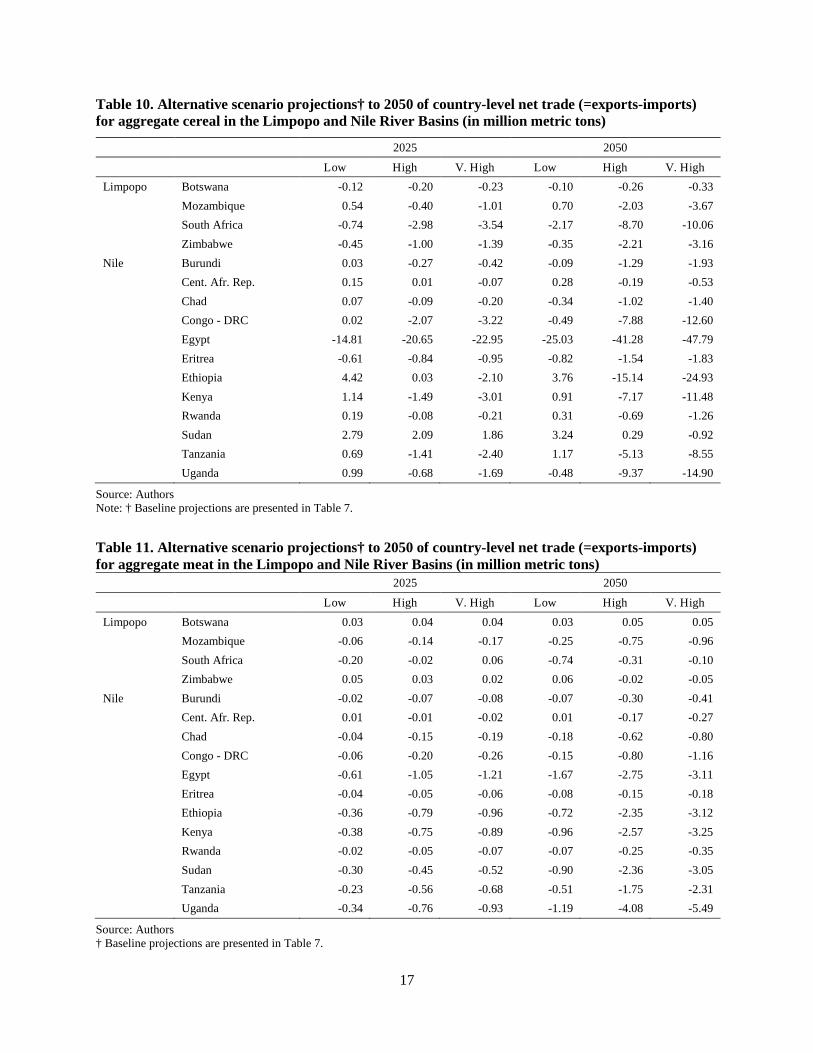
Given the dramatic price increases in the Low scenario, the net trade picture also shifts significantly (Tables 10 and 11). Many of the Nile Basin countries that were projected to be net importers of cereals shift to net exporter positions due to the high prices of agricultural commodities. In the Limpopo Basin, Mozambique is projected to become a net exporter under the Low scenario. As higher food prices negatively impact consumers’ relative abilities to buy food, both Limpopo and Nile Basin countries decrease their net meat imports. Compared to the Baseline, the High and Very High scenarios yield sharp increases in net cereal imports in nearly all of the Limpopo and Nile Basin countries. Countries that are net exporters under the Baseline scenario reduce their net export levels as a result of higher imports. In terms of livestock trade in the Limpopo Basin, Zimbabwe switches to being a net importer by 2050, while Botswana retains its net export position. Net imports increase in Mozambique, but decline in South Africa. In contrast, the Nile Basin countries—as a block—dramatically increase their net imports of meat as a result of the increased affordability of food.
17
Table 10. Alternative scenario projections† to 2050 of country-level net trade (=exports-imports) for aggregate cereal in the Limpopo and Nile River Basins (in million metric tons)
2025 2050
Low High V. High Low High V. High Limpopo Botswana -0.12 -0.20 -0.23 -0.10 -0.26 -0.33 Mozambique 0.54 -0.40 -1.01 0.70 -2.03 -3.67 South Africa -0.74 -2.98 -3.54 -2.17 -8.70 -10.06 Zimbabwe -0.45 -1.00 -1.39 -0.35 -2.21 -3.16 Nile Burundi 0.03 -0.27 -0.42 -0.09 -1.29 -1.93 Cent. Afr. Rep. 0.15 0.01 -0.07 0.28 -0.19 -0.53 Chad 0.07 -0.09 -0.20 -0.34 -1.02 -1.40 Congo - DRC 0.02 -2.07 -3.22 -0.49 -7.88 -12.60 Egypt -14.81 -20.65 -22.95 -25.03 -41.28 -47.79 Eritrea -0.61 -0.84 -0.95 -0.82 -1.54 -1.83 Ethiopia 4.42 0.03 -2.10 3.76 -15.14 -24.93 Kenya 1.14 -1.49 -3.01 0.91 -7.17 -11.48 Rwanda 0.19 -0.08 -0.21 0.31 -0.69 -1.26 Sudan 2.79 2.09 1.86 3.24 0.29 -0.92 Tanzania 0.69 -1.41 -2.40 1.17 -5.13 -8.55 Uganda 0.99 -0.68 -1.69 -0.48 -9.37 -14.90
Source: Authors Note: † Baseline projections are presented in Table 7.
Table 11. Alternative scenario projections† to 2050 of country-level net trade (=exports-imports) for aggregate meat in the Limpopo and Nile River Basins (in million metric tons) 2025 2050
Low High V. High Low High V. High Limpopo Botswana 0.03 0.04 0.04 0.03 0.05 0.05 Mozambique -0.06 -0.14 -0.17 -0.25 -0.75 -0.96 South Africa -0.20 -0.02 0.06 -0.74 -0.31 -0.10 Zimbabwe 0.05 0.03 0.02 0.06 -0.02 -0.05 Nile Burundi -0.02 -0.07 -0.08 -0.07 -0.30 -0.41 Cent. Afr. Rep. 0.01 -0.01 -0.02 0.01 -0.17 -0.27 Chad -0.04 -0.15 -0.19 -0.18 -0.62 -0.80 Congo - DRC -0.06 -0.20 -0.26 -0.15 -0.80 -1.16 Egypt -0.61 -1.05 -1.21 -1.67 -2.75 -3.11 Eritrea -0.04 -0.05 -0.06 -0.08 -0.15 -0.18 Ethiopia -0.36 -0.79 -0.96 -0.72 -2.35 -3.12 Kenya -0.38 -0.75 -0.89 -0.96 -2.57 -3.25 Rwanda -0.02 -0.05 -0.07 -0.07 -0.25 -0.35 Sudan -0.30 -0.45 -0.52 -0.90 -2.36 -3.05 Tanzania -0.23 -0.56 -0.68 -0.51 -1.75 -2.31 Uganda -0.34 -0.76 -0.93 -1.19 -4.08 -5.49
Source: Authors † Baseline projections are presented in Table 7.
18
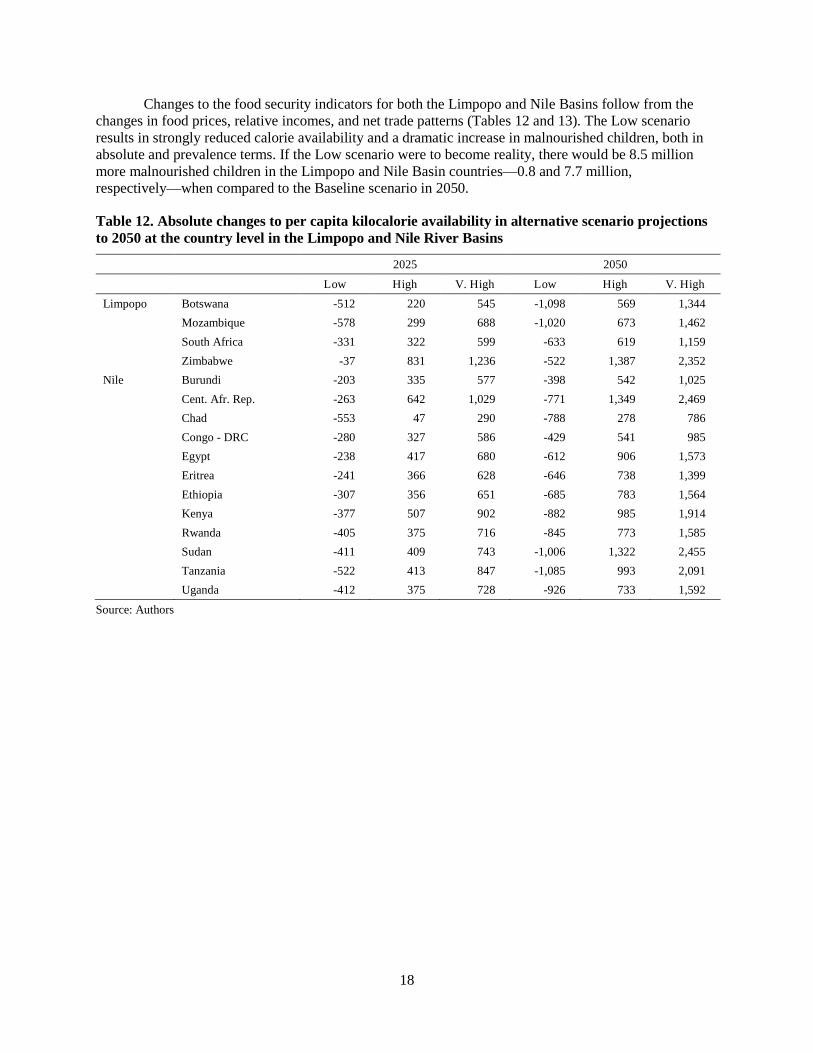
Changes to the food security indicators for both the Limpopo and Nile Basins follow from the changes in food prices, relative incomes, and net trade patterns (Tables 12 and 13). The Low scenario results in strongly reduced calorie availability and a dramatic increase in malnourished children, both in absolute and prevalence terms. If the Low scenario were to become reality, there would be 8.5 million more malnourished children in the Limpopo and Nile Basin countries—0.8 and 7.7 million, respectively—when compared to the Baseline scenario in 2050.
Table 12. Absolute changes to per capita kilocalorie availability in alternative scenario projections to 2050 at the country level in the Limpopo and Nile River Basins
2025 2050
Low High V. High Low High V. High Limpopo Botswana -512 220 545 -1,098 569 1,344 Mozambique -578 299 688 -1,020 673 1,462 South Africa -331 322 599 -633 619 1,159 Zimbabwe -37 831 1,236 -522 1,387 2,352 Nile Burundi -203 335 577 -398 542 1,025 Cent. Afr. Rep. -263 642 1,029 -771 1,349 2,469 Chad -553 47 290 -788 278 786 Congo - DRC -280 327 586 -429 541 985 Egypt -238 417 680 -612 906 1,573 Eritrea -241 366 628 -646 738 1,399 Ethiopia -307 356 651 -685 783 1,564 Kenya -377 507 902 -882 985 1,914 Rwanda -405 375 716 -845 773 1,585 Sudan -411 409 743 -1,006 1,322 2,455 Tanzania -522 413 847 -1,085 993 2,091 Uganda -412 375 728 -926 733 1,592
Source: Authors

19
Table 13. Absolute changes to total malnourished children (in thousands, by weight, ages 0-5) in alternative scenario projections to 2050 at the country level in the Limpopo and Nile River Basins
2025 2050
Low High V. High Low High V. High Limpopo Botswana 11 -4 -12 15 -6 -14 Mozambique 290 -121 -361 474 -219 -360 South Africa 141 -122 -278 206 -165 -315 Zimbabwe 10 -172 -286 98 -146 -146 Nile Burundi 70 -100 -231 188 -204 -521 Cent. Afr. Rep. 25 -49 -86 61 -66 -66 Chad 200 -15 -188 346 -99 -506 Congo - DRC 865 -839 -1,976 1,550 -1,474 -3,495 Egypt 175 -252 -252 206 0 0 Eritrea 44 -54 -131 109 -87 -105 Ethiopia 687 -673 -1,880 1,395 -1,172 -3,480 Kenya 348 -382 -865 777 -527 -527 Rwanda 82 -64 -166 149 -102 -277 Sudan 275 -229 -557 509 -465 -1,046 Tanzania 454 -285 -668 669 -406 -922 Uganda 629 -301 -1,163 1,754 -678 -1,393
Source: Authors
The High and Very High scenarios yield possible outcomes that are in stark contrast to the Low scenario. Per capita calorie availability increases across the Limpopo and Nile Basin countries by an average of 800 and 1600 kilocalories in the High and Very High scenarios, and the number of malnourished children decreases by 5.8 and 13.2 million, respectively, by 2050.
Limpopo Basin crop production and water use
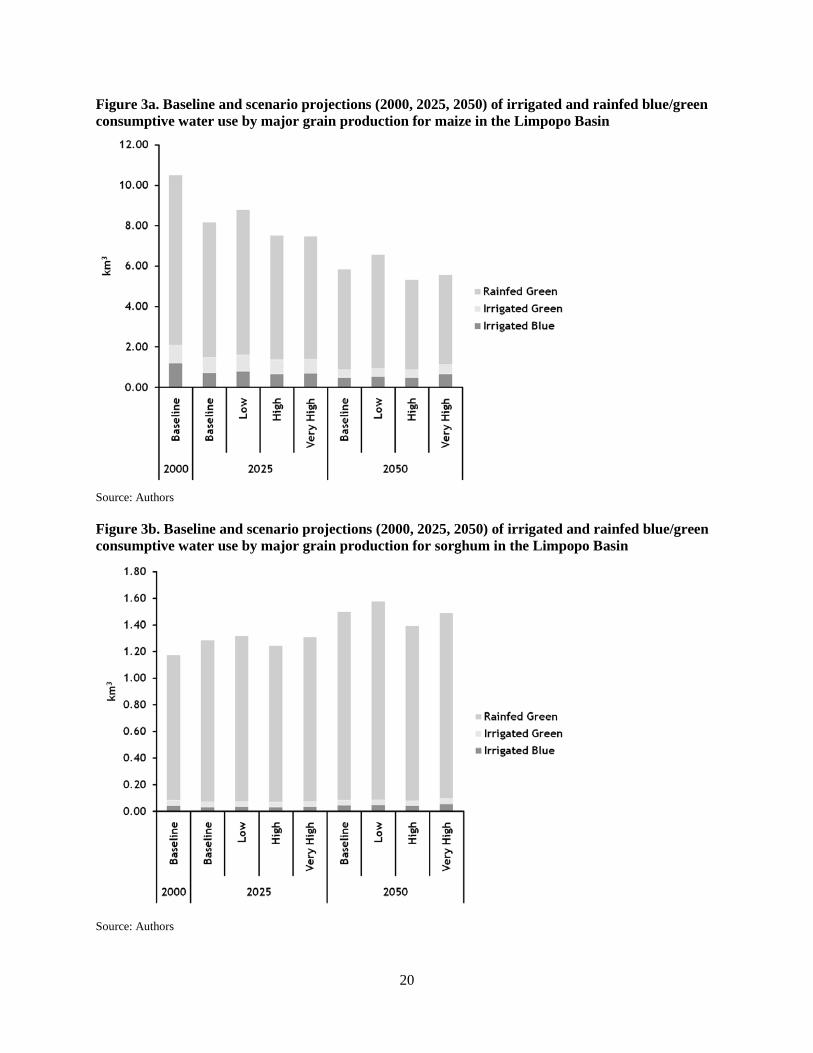
Figures 3-5 present crop water use projections for the major agricultural crops in the Limpopo Basin (identified in Tables 2 and 3). The majority of consumptive water used for grain production in the Limpopo Basin is green, given that maize (Figure 3a) and other grains, such as sorghum (Figure 3b) and other minor grains, are predominantly rainfed in this region. As a result of a slowdown in yield growth under the Low scenario, both the irrigated and rainfed harvested areas must increase to meet future demands. As a consequence, consumptive water use out to 2050 increases compared to the Baseline scenario for all crops except rice, for which the largest consumption increase occurs for the Very High investment scenario. In contrast, the productivity increases in both the High and Very High scenarios require less expansion (compared to the Baseline scenario) in irrigated area, rainfed area, and consumptive water use. The Very High scenario posits an expansion of irrigation infrastructure that displaces some of the rainfed area compared to the other scenarios. This causes an increase in blue water use for rice and wheat production. However, total consumptive use remains below the levels seen for the other scenarios.
20
Figure 3a. Baseline and scenario projections (2000, 2025, 2050) of irrigated and rainfed blue/green consumptive water use by major grain production for maize in the Limpopo Basin
Source: Authors
Figure 3b. Baseline and scenario projections (2000, 2025, 2050) of irrigated and rainfed blue/green consumptive water use by major grain production for sorghum in the Limpopo Basin
Source: Authors

21
Figure 3c. Baseline and scenario projections (2000, 2025, 2050) of irrigated and rainfed blue/green consumptive water use by major grain production for rice in the Limpopo Basin
Source: Authors
Figure 3d. Baseline and scenario projections (2000, 2025, 2050) of irrigated and rainfed blue/green consumptive water use by major grain production for wheat in the Limpopo Basin
Source: Authors

22
Production of rice and wheat in the Limpopo Basin is oriented more towards irrigated production compared to the production of other grains (Figures 3c and 3d), but the overall areas accounted for by rice and wheat are small compared to that cultivated under maize, for which rainfed production prevails. In the Limpopo Basin, tropical and subtropical fruits are mostly produced under rainfed conditions (Figures 4a and 4b). About 70 percent of the area used for vegetables is rainfed, and a little over 70 percent of this consumptive water use corresponds to green water. According the model, irrigated vegetables expand in the Limpopo Basin and blue water use effectively doubles by 2050. Almost all groundnuts are produced on rainfed land throughout the entire projection period. In 2000, just under half of all sugarcane was produced on rainfed land. By 2050, about 54 percent of sugarcane is projected to come from irrigated production, with most of the water consumption on irrigated lands corresponding to blue water.
Figure 4a. Baseline and scenario projections (2000, 2025, 2050) of irrigated and rainfed blue/green consumptive water use by sub-tropical fruit in the Limpopo Basin
Source: Authors

23
Figure 4b. Baseline and scenario projections (2000, 2025, 2050) of irrigated and rainfed blue/green consumptive water use by temperate fruit in the Limpopo Basin
Source: Authors
Figure 4c. Baseline and scenario projections (2000, 2025, 2050) of irrigated and rainfed blue/green consumptive water use by vegetables in the Limpopo Basin
Source: Authors

24
Figure 4d. Baseline and scenario projections (2000, 2025, 2050) of irrigated and rainfed blue/green consumptive water use by groundnuts in the Limpopo Basin
Source: Authors
Figure 5a. Baseline and scenario projections (2000, 2025, 2050) of irrigated and rainfed blue/green consumptive water use by cotton in the Limpopo Basin
Source: Authors

25
Figure 5b. Baseline and scenario projections (2000, 2025, 2050) of irrigated and rainfed blue/green consumptive water use by sugarcane in the Limpopo Basin
Source: Authors
Figure 5c. Baseline and scenario projections (2000, 2025, 2050) of irrigated and rainfed blue/green consumptive water use by cassava in the Limpopo Basin
Source: Authors

26
The water productivity impacts of the different scenarios are shown in Table 14. As could be expected, the yield decreases under the Low scenario lead to similar declines in the amount of crop harvested per unit of consumptive water used. The area expansion necessary in the Low scenario exacerbates this productivity impact. In contrast, the High scenario leads to an opposing trend. Under the Very High scenario, irrigated crop water productivity for cereal production is expected to increase by 18 percent and rainfed productivity by 28 percent by 2050.
Table 14. Alternative scenario projections to 2050 of percent changes in consumptive water use productivity for cereal production in the irrigated and rainfed systems of the Limpopo Basin, Nile Basin, and entire globe (kilograms of harvested commodity per m3 of consumptive water use)
Low High Very High
2025 2050 2025 2050 2025 2050 Limpopo Irrigated -12.7% -12.9% 13.9% 19.2% 20.6% 18.2% Rainfed -12.7% -10.6% 14.2% 17.6% 27.3% 27.5%
Nile Irrigated -2.7% -3.2% 2.4% 8.1% -1.5% 5.5% Rainfed -11.4% -17.2% 12.6% 25.8% 17.7% 38.3%
Global Irrigated -6.0% -9.3% 6.0% 14.1% 5.7% 17.3% Rainfed -5.6% -8.5% 5.8% 14.4% 7.5% 20.8%
Source: Authors Note: see Table 6 for Baseline projections
Nile Basin Crop Production and Water Use
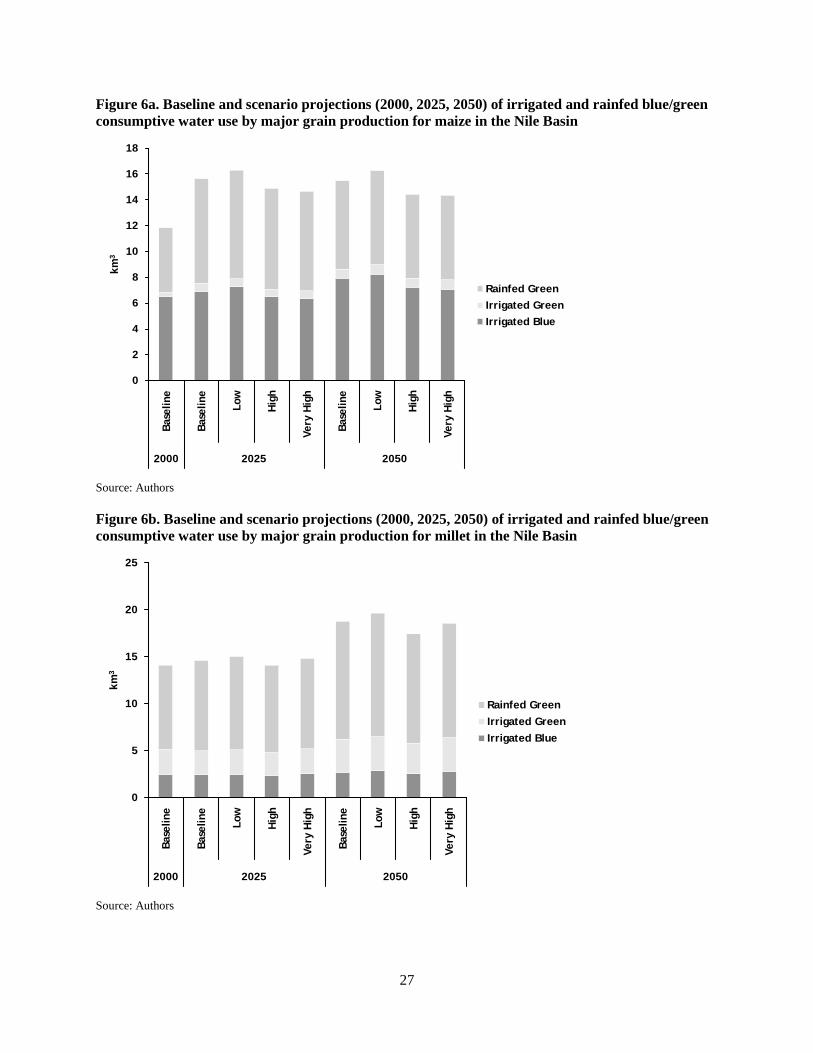
Similar to the situation in the Limpopo Basin, agricultural production in the Nile Basin shows a wide range of consumptive water use by the different crops (Figures 6-8). Rainfed grain accounts for 75 percent of the grain-harvested area, but produces less than 40 percent of the annual grain tonnage (Figure 6).
27
Figure 6a. Baseline and scenario projections (2000, 2025, 2050) of irrigated and rainfed blue/green consumptive water use by major grain production for maize in the Nile Basin
Source: Authors
Figure 6b. Baseline and scenario projections (2000, 2025, 2050) of irrigated and rainfed blue/green consumptive water use by major grain production for millet in the Nile Basin
Source: Authors
0
2
4
6
8
10
12
14
16
18
Base
line
Base
line
Low
Hig
h
Very
Hig
h
Base
line
Low
Hig
h
Very
Hig
h2000 2025 2050
km3
Rainfed GreenIrrigated GreenIrrigated Blue
0
5
10
15
20
25
Base
line
Base
line
Low
Hig
h
Very
Hig
h
Base
line
Low
Hig
h
Very
Hig
h
2000 2025 2050
km3
Rainfed GreenIrrigated GreenIrrigated Blue

28
Figure 6c. Baseline and scenario projections (2000, 2025, 2050) of irrigated and rainfed blue/green consumptive water use by major grain production for rice in the Nile Basin
Source: Authors
Figure 6d. Baseline and scenario projections (2000, 2025, 2050) of irrigated and rainfed blue/green consumptive water use by major grain production for sorghum in the Nile Basin
Source: Authors
0
2
4
6
8
10
12
14
16Ba
selin
e
Base
line
Low
Hig
h
Very
Hig
h
Base
line
Low
Hig
h
Very
Hig
h
2000 2025 2050
km3
Rainfed GreenIrrigated GreenIrrigated Blue
0
10
20
30
40
50
60
Base
line
Base
line
Low
Hig
h
Very
Hig
h
Base
line
Low
Hig
h
Very
Hig
h
2000 2025 2050
km3
Rainfed GreenIrrigated GreenIrrigated Blue
29
Figure 6e. Baseline and scenario projections (2000, 2025, 2050) of irrigated and rainfed blue/green consumptive water use by major grain production for wheat in the Nile Basin
Source: Authors
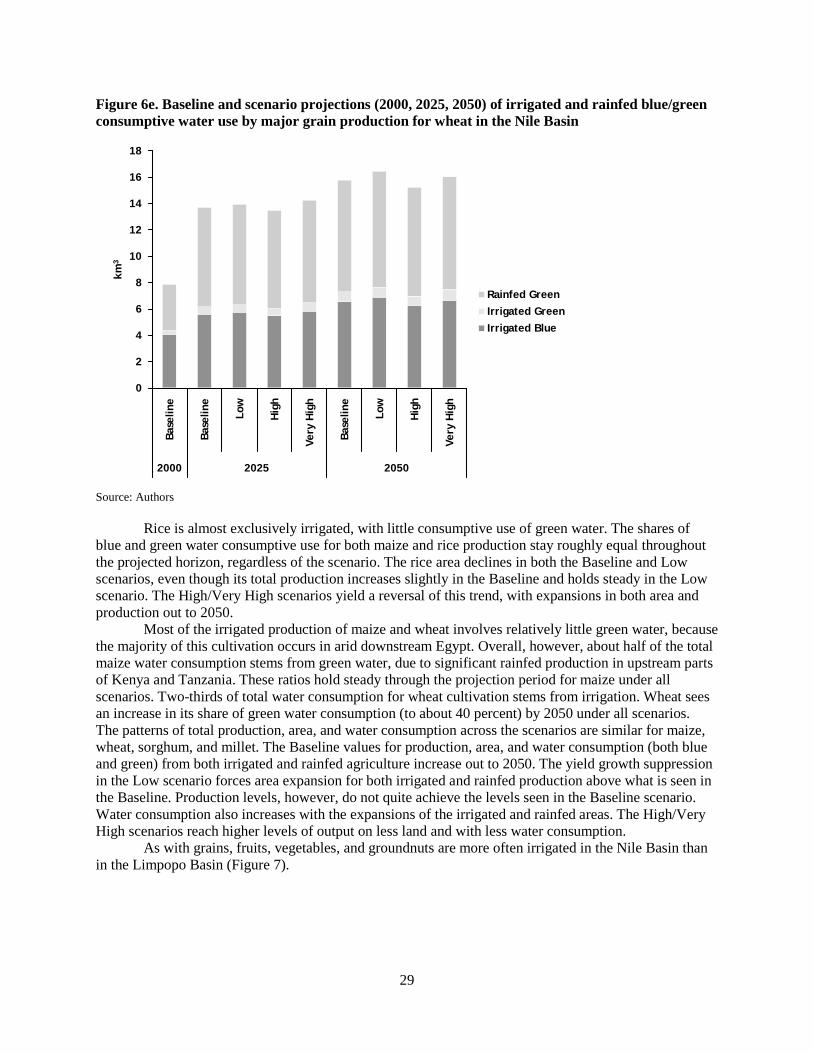
Rice is almost exclusively irrigated, with little consumptive use of green water. The shares of blue and green water consumptive use for both maize and rice production stay roughly equal throughout the projected horizon, regardless of the scenario. The rice area declines in both the Baseline and Low scenarios, even though its total production increases slightly in the Baseline and holds steady in the Low scenario. The High/Very High scenarios yield a reversal of this trend, with expansions in both area and production out to 2050.
Most of the irrigated production of maize and wheat involves relatively little green water, because the majority of this cultivation occurs in arid downstream Egypt. Overall, however, about half of the total maize water consumption stems from green water, due to significant rainfed production in upstream parts of Kenya and Tanzania. These ratios hold steady through the projection period for maize under all scenarios. Two-thirds of total water consumption for wheat cultivation stems from irrigation. Wheat sees an increase in its share of green water consumption (to about 40 percent) by 2050 under all scenarios. The patterns of total production, area, and water consumption across the scenarios are similar for maize, wheat, sorghum, and millet. The Baseline values for production, area, and water consumption (both blue and green) from both irrigated and rainfed agriculture increase out to 2050. The yield growth suppression in the Low scenario forces area expansion for both irrigated and rainfed production above what is seen in the Baseline. Production levels, however, do not quite achieve the levels seen in the Baseline scenario. Water consumption also increases with the expansions of the irrigated and rainfed areas. The High/Very High scenarios reach higher levels of output on less land and with less water consumption.
As with grains, fruits, vegetables, and groundnuts are more often irrigated in the Nile Basin than in the Limpopo Basin (Figure 7).
0
2
4
6
8
10
12
14
16
18
Base
line
Base
line
Low
Hig
h
Very
Hig
h
Base
line
Low
Hig
h
Very
Hig
h
2000 2025 2050
km3
Rainfed GreenIrrigated GreenIrrigated Blue

30
Figure 7a. Baseline and scenario projections (2000, 2025, 2050) of irrigated and rainfed blue/green consumptive water use by sub-tropical fruits in the Nile Basin
Source: Authors
Figure 7b. Baseline and scenario projections (2000, 2025, 2050) of irrigated and rainfed blue/green consumptive water use by vegetables in the Nile Basin
Source: Authors
0
1
2
3
4
5
6
7
8Ba
selin
e
Base
line
Low
Hig
h
Very
Hig
h
Base
line
Low
Hig
h
Very
Hig
h
2000 2025 2050
km3
Rainfed GreenIrrigated GreenIrrigated Blue
0
1
2
3
4
5
6
7
Base
line
Base
line
Low
Hig
h
Very
Hig
h
Base
line
Low
Hig
h
Very
Hig
h
2000 2025 2050
km3
Rainfed GreenIrrigated GreenIrrigated Blue

31
Figure 7c. Baseline and scenario projections (2000, 2025, 2050) of irrigated and rainfed blue/green consumptive water use by groundnuts in the Nile Basin
Source: Authors
About 60 percent of the water consumption by sub-tropical fruit and groundnut production is green, while nearly 70 percent of water consumption by vegetable production comes from irrigation. These shares remain consistent across all of the scenarios out to 2050. The Baseline scenario sees increasing areas and production for sub-tropical fruits and vegetables, while for groundnut, the areas contract and the production levels are maintained. To achieve a roughly consistent production of groundnuts in 2050 under the Low scenario, more area is required than in the Baseline scenario. Purely rainfed cassava and the mostly irrigated sugarcane in the Nile Basin follow crop water use trajectories similar to those obtained for the Limpopo Basin (Figure 8).
0
1
2
3
4
5
6
7
8
9
10Ba
selin
e
Base
line
Low
Hig
h
Very
Hig
h
Base
line
Low
Hig
h
Very
Hig
h
2000 2025 2050
km3
Rainfed GreenIrrigated GreenIrrigated Blue

32
Figure 8a. Baseline and scenario projections (2000, 2025, 2050) of irrigated and rainfed blue/green consumptive water use by cassava in the Nile Basin
Source: Authors
Figure 8b. Baseline and scenario projections (2000, 2025, 2050) of irrigated and rainfed blue/green consumptive water use sugarcane in the Nile Basin
Source: Authors
0
1
1
2
2
3
3
4
4Ba
selin
e
Base
line
Low
Hig
h
Very
Hig
h
Base
line
Low
Hig
h
Very
Hig
h2000 2025 2050
km3
Rainfed Green
0
1
2
3
4
5
6
7
8
9
Base
line
Base
line
Low
Hig
h
Very
Hig
h
Base
line
Low
Hig
h
Very
Hig
h
2000 2025 2050
km3
Rainfed GreenIrrigated GreenIrrigated Blue
33
Compared to the Limpopo Basin, changes in water productivity are much lower in the Nile River Basin. Moreover, under the Very High scenario, water productivity in the Nile River Basin declines as lower food prices and resulting higher food demands induce rapid crop area expansion that cannot be fully met with the available resources.
34
6. POLICY IMPLICATIONS AND CONCLUSION
Including an accounting framework that distinguishes between green and blue water into a global water and food projections model presents opportunities for enhanced analysis of alternative policies for improving agricultural production under the threat of growing water scarcity. An examination of the relative contribution of precipitation to total water consumption and that by irrigated areas can help identify policy options where specific gains could be made through technologies aimed at improving crop use of green water. This could complement and enhance the research and development accomplishments achieved to date in the fields of irrigation and blue water use.
In global terms, the irrigated harvested area is expected to increase much faster than rainfed harvested area, while overall water consumption from precipitation is projected to grow faster than consumption from irrigation withdrawals. Alternative investments, particularly those in agricultural productivity and irrigation expansion, can significantly alter these outcomes. Major water savings from both irrigation and precipitation are seen for the Very High investment scenario along with complementary poverty-reducing expenditures. The present basin-level results emphasize the importance of more disaggregated analyses, as shown in the opposing trends observed for consumptive water use in the Limpopo and Nile Basins, respectively. In the Limpopo Basin, growing water scarcity suggests the need for investment in technologies aimed at enhancing irrigated and rainfed crop yields. In the Nile Basin, on the other hand, irrigated crop productivities are fairly high, and are achieved with little complementary precipitation. In this basin, the focus needs to be on expanding irrigated areas and improving rainfed crop productivity.
With many of the benefits from the Green Revolution fading and the potential for improving high-input agriculture becoming fairly limited in parts of Asia (where high yield levels have already been reached) and in SSA (which is characterized by insufficient investment in complementary infrastructure and inputs), there is good potential for green water development in both environments.
Rural areas of the developing world, where great numbers of poor households are living on marginal or degraded land, could particularly benefit from research and development addressing rainfed crop water use. Many existing technologies should be embedded into the support and extension systems, and there is great potential for new research and development. It could be highly useful to develop new technologies aimed at improving effective precipitation and rainfall capture, conservation tillage (minimum and no-till), further developing rainfed precision agriculture, targeted crop breeding, and focused research and development for unfavorable environments (Rosegrant et al. 2002b).
An approach that combines blue- and green-targeted water management strategies with other complementary rural agricultural development investments, such as those detailed in Rosegrant et al. (2005) and World Bank (2005, 2007), has the potential to positively impact the lives of many poor people around the world. In the face of increasing land and water constraints, expanding demands will have to be met with production increases that rely more on yield improvements and intensification than the expansion of harvested areas. An integrated approach also represents a good option for the development of strategies aimed at helping humanity adapt to climate change and increased climate variability.

35
APPENDIX
Spatial Disaggregation in IMPACT: 281 Food Producing Units (FPUs) with a focus on the Nile and Limpopo Basins of Africa

36
REFERENCES
Challenge Program on Water and Food (CPWF). 2005. CGIAR Challenge Program on Water and Food: Research Strategy 2005–2008. Colombo, Sri Lanka: CPWF.
Food and Agriculture Organization of the United Nations (FAO). 2006. World agriculture: Towards 2030/2050. Interim report. Rome: FAO.
Millennium Ecosystem Assessment (MEA). 2005. Millennium Ecosystem Assessment, ecosystems and human well-being: synthesis. Washington, D.C.: Island Press. www.millenniumassessment.org/en/Synthesis.
Nakicenovic, N. and R. Swart, eds. 2000. Intergovernmental panel on climate change special report on emissions scenarios. Cambridge, U.K.: Cambridge University Press.
Rockstrom, J., M. Lannerstad, and M. Falkenmark. 2007. Assessing the water challenge of a new green revolution in developing countries. Proceedings of the National Academy of Sciences 104 (15): 6253–6260.
Rosegrant, M.W., M. Agcaoili-Sombilla, and N.D. Perez. 1995. Global food projections to 2020: Implications for investment. 2020 Discussion Paper No. 5. Washington, D.C.: International Food Policy Research Institute.
Rosegrant, M.W., X. Cai, and S.A. Cline. 2002a. World water and food to 2025: Dealing with scarcity. Washington, D.C. and Colombo, Sri Lanka: International Food Policy Research Institute and International Water Management Institute.
Rosegrant, M.W., X. Cai, S.A. Cline and N. Nakagawa. 2002b. The role of rainfed agriculture in the future of global food production. Environment and Production Technology Division Discussion Paper 90. Washington, D.C.: International Food Policy Research Institute.
Rosegrant, M.W., S.A. Cline, W. Li, T.B. Sulser, R.A. Valmonte-Santos. 2005. Looking ahead: Long-term prospects for Africa’s agricultural development and food security. 2020 Discussion Paper 41. Washington, D.C.: International Food Policy Research Institute.
Rosegrant, M.W., M. Fernandez., A. Sinha, J. Alder, H. Ahammad, C. de Fraiture, B. Eickhout, J. Fonseca, J. Huang, O. Koyama, A.M. Omezzine, P. Pingali, R. Ramirez, C. Ringler, S. Robinson, H. Shapiro, P. Thornton, D. van Vuuren, K. Ebi, R. Kruska, P. Munjal, C. Narrod, T. Raney, S. Ray, T.B. Sulser, C. Tamagno, M. van Oorschot, and T. Zhu. 2008a. Looking into the future for agriculture and AKST. In Agriculture at a crossroads: Global report, B.D. McIntyre, H.R. Herren, J.W. Wakhungu, and R.T. Watson, eds. Washington, D.C.: Island Press, for International Assessment of Agricultural Knowledge, Science, and Technology for Development.
Rosegrant, M.W., J. Huang, A. Sinha, H. Ahammad, C. Ringler, T. Zhu, T.B. Sulser, S. Msangi, and M. Batka. 2008b. Exploring Alternative Futures for Agricultural Knowledge, Science, and Technology (AKST). ACIAR Project Report ADP/2004/045. Washington, D.C.: International Food Policy Research Institute.
Rosegrant, M.W., S. Msangi, C. Ringler, T.B. Sulser, T. Zhu, and S.A. Cline. 2008c. International Model for Policy Analysis of Agricultural Commodities and Trade (IMPACT): Model description. Washington, D.C.: International Food Policy Research Institute. http://www.ifpri.org/themes/impact/impactwater.pdf.
Schiermeier, Q. 2008. A long dry summer. Nature 452 (7185): 270-273.
United Nations. 2005. World population prospects: 2004 revisions. New York: United Nations.
World Bank. 2005. Agriculture and Achieving the Millennium Development Goals. Washington, D.C.: International Food Policy Research Institute and World Bank.
World Bank. 2007. World development report 2008: Agriculture for development. Washington, D.C.: World Bank.


RECENT IFPRI DISCUSSION PAPERS
For earlier discussion papers, please go to www.ifpri.org/pubs/pubs.htm#dp. All discussion papers can be downloaded free of charge.
906. The growth-poverty convergence agenda: Optimizing social expenditures to maximize their impact on agricultural labor productivity, growth, and poverty reduction in Africa. Ousmane Badiane and John Ulimwengu, 2009.
905. HIV and mobility in the Lake Victoria Basin agricultural sector: A literature review. Scott Drimie, Julia Weinand, Stuart Gillespie, and Margaret Wagah, 2009.
904. Institutional change, rural services, and agricultural performance in Kyrgyzstan. Kamiljon T. Akramov and Nurbek Omuraliev, 2009.
903. A picture of tariff protection across the world in 2004: MAcMap-HS6, version 2. Houssein Boumellassa, David Laborde Debucquet, and Cristina Mitaritonna, 2009.
902. Governance decentralization and local infrastructure provision in Indonesia. Shyamal Chowdhury, Futoshi Yamauchi, and Reno Dewina, 2009.
901. Estimating the impact of agricultural technology on poverty reduction in rural Nigeria. Babatunde Omilola, 2009.
900. Greenhouse gas mitigation: Issues for India agriculture. Gerald Nelson, Richard Robertson, Siwa Msangi, Tingju Zhu, Xiaoli Liao, Puja Jawajar, 2009.
899. Rural non-farm income and inequality in Nigeria. Babatunde Omilola, 2009.
898. Lagging regions and development strategies: The case of Peru. James Thurlow, Samuel Morley, and Alejandro Nin Pratt, 2009.
897. Spatial networks, labor supply, and income dynamics: Evidence from Indonesian villages. Futoshi Yamauchi, Megumi Muto, Shyamal Chowdhury, Reno Dewina, and Sony Sumaryanto, 2009.
896. The evolution of an industrial cluster in China. Belton Fleisher, Dinghuan Hu, William McGuire, and Xiaobo Zhang, 2009.
895. Commodity price volatility and nutrition vulnerability. Monika Verma and Thomas W. Hertel, 2009
894. Measuring irrigation performance in Africa. Mark Svendsen, Mandy Ewing, and Siwa Msangi, 2009
893. Managing future oil revenues in Ghana: An assessment of alternative allocation options. Clemens Breisinger, Xinshen Diao, Rainer Schweickert, and Manfred Wiebelt, 2009.
892. Impact of water user associations on agricultural productivity in Chile. Nancy McCarthy and Tim Essam, 2009.
891. China’s growth and the agricultural exports of southern Africa. Nelson Villoria, Thomas Hertel, and Alejandro Nin-Pratt, 2009.
890. The impact of climate variability and change on economic growth and poverty in Zambia. James Thurlow, Tingju Zhu, and Xinshen Diao, 2009.
889. Navigating the perfect storm: Reflections on the food, energy, and financial crises. Derek Headey, Sangeetha Malaiyandi, and Shenggen Fan, 2009.
888. How important is a regional free trade area for southern Africa? Potential impacts and structural constraints. Alejandro Nin Pratt, Xinshen Diao, and Yonas Bahta, 2009.
887. Determinant of smallholder farmer labor allocation decisions in Uganda. Fred Bagamba, Kees Burger, and Arie Kuyvenhoven, 2009.
886. The potential cost of a failed Doha Round. Antoine Bouët and David Laborde, 2009.
INTERNATIONAL FOOD POLICY RESEARCH INSTITUTE
www.ifpri.org
IFPRI HEADQUARTERS
2033 K Street, NW Washington, DC 20006-1002 USA Tel.: +1-202-862-5600 Fax: +1-202-467-4439 Email: [email protected]
IFPRI ADDIS ABABA
P. O. Box 5689 Addis Ababa, Ethiopia Tel.: +251 11 6463215 Fax: +251 11 6462927 Email: [email protected]
IFPRI NEW DELHI
CG Block, NASC Complex, PUSA New Delhi 110-012 India Tel.: 91 11 2584-6565 Fax: 91 11 2584-8008 / 2584-6572 Email: [email protected]