Greece’s need of durable rebalancing...ees. However, the high drama should not de-tract from the...
12
ECONOMIC POLICY NOTE 27/4/2015 Greece’s need of durable rebalancing AGNIESZKA GEHRINGER The discussion about Greece has intensified in recent months. Greece is running out of time in its search for fresh cash to serve its external debt and to pay wages to public sector employ- ees. However, the high drama should not de- tract from the fundamental problem of the Greek economy. In the present paper, we have a closer look at the development of the country’s current ac- count. The key findings are: (i) The deterioration of the current account before the debt crisis was largely due to excess demand. Thanks to productivity growth, exports were stable or even in- creased. (ii) The subsequent decline of the current ac- count deficit was primarily achieved by ag- gregate demand contraction. Only more recently, the real exchange rate fell owing to a decline in nominal wages and prices. (iii) To support growth, expenditure reducing policies should be supplemented with ex- penditure switching policies. Generally, this is best achieved through a nominal devalu- ation. As this is not possible in EMU, intro- duction of a parallel currency for domestic use might help. 1 (iv) To make the gain in competitiveness per- manent, the Greek economy needs more investment in new capacities and technol- ogies. In order to enable such investment, the business environment must be im- proved. The nature of the Greek current account defi- cits Starting in 1994, the Greek economy entered a period of high and persistent current account deficits. Easy credit conditions after the intro- duction of the euro in 2001 induced ever higher deficits (Fig. 1 and 2). 1 See Thomas Mayer (2015), A Parallel Currency for Greece, Flossbach von Storch AG Research Institute, Eco- nomic policy note 4/2015.
Transcript of Greece’s need of durable rebalancing...ees. However, the high drama should not de-tract from the...

ECONOMIC POLICY NOTE 27/4/2015
Greece’s need of durable rebalancing
AGNIESZKA GEHRINGER
The discussion about Greece has intensified in
recent months. Greece is running out of time in
its search for fresh cash to serve its external
debt and to pay wages to public sector employ-
ees. However, the high drama should not de-
tract from the fundamental problem of the
Greek economy.
In the present paper, we have a closer look at
the development of the country’s current ac-
count. The key findings are:
(i) The deterioration of the current account
before the debt crisis was largely due to
excess demand. Thanks to productivity
growth, exports were stable or even in-
creased.
(ii) The subsequent decline of the current ac-
count deficit was primarily achieved by ag-
gregate demand contraction. Only more
recently, the real exchange rate fell owing
to a decline in nominal wages and prices.
(iii) To support growth, expenditure reducing
policies should be supplemented with ex-
penditure switching policies. Generally, this
is best achieved through a nominal devalu-
ation. As this is not possible in EMU, intro-
duction of a parallel currency for domestic
use might help. 1
(iv) To make the gain in competitiveness per-
manent, the Greek economy needs more
investment in new capacities and technol-
ogies. In order to enable such investment,
the business environment must be im-
proved.
The nature of the Greek current account defi-
cits
Starting in 1994, the Greek economy entered a
period of high and persistent current account
deficits. Easy credit conditions after the intro-
duction of the euro in 2001 induced ever higher
deficits (Fig. 1 and 2).
1 See Thomas Mayer (2015), A Parallel Currency for
Greece, Flossbach von Storch AG Research Institute, Eco-
nomic policy note 4/2015.

2
Easy credit permitted Greek households, firms
and the government to finance consumption
and all kinds of investment, not all of it produc-
tive. As a result, domestic demand rose dispro-
portionally faster than supply.
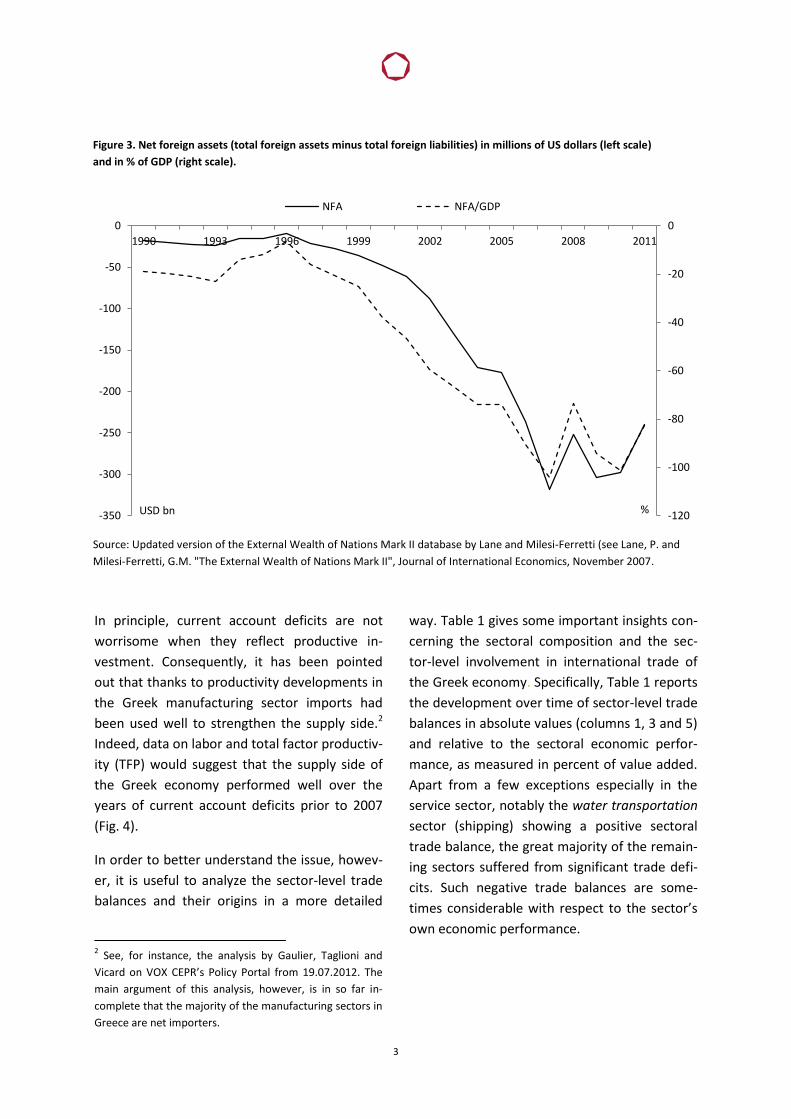
As this excess of demand was covered by net
inflows of financial capital from abroad year
after year, Greece saw its external debt worsen-
ing substantially over time (Fig. 3).
Figure 1. Ten years bond yields (right scale) and current account balance (left scale) in Greece.
Source: IMF World Economic Outlook and Eurostat.
Figure 2. MFI lending to the private sector in Greece.
Source: Haver.
0
5
10
15
20
25
30
-15
-13
-11
-9
-7
-5
-3
-1
1
3
1990 1994 1998 2002 2006 2010 2014
% % of GDP Current account balance bond yields
0
50
100
150
200
250
300
1990 1993 1996 1999 2002 2005 2008 2011 2014
EUR bn
3
In principle, current account deficits are not
worrisome when they reflect productive in-
vestment. Consequently, it has been pointed
out that thanks to productivity developments in
the Greek manufacturing sector imports had
been used well to strengthen the supply side.2
Indeed, data on labor and total factor productiv-
ity (TFP) would suggest that the supply side of
the Greek economy performed well over the
years of current account deficits prior to 2007
(Fig. 4).
In order to better understand the issue, howev-
er, it is useful to analyze the sector-level trade
balances and their origins in a more detailed
2 See, for instance, the analysis by Gaulier, Taglioni and
Vicard on VOX CEPR’s Policy Portal from 19.07.2012. The
main argument of this analysis, however, is in so far in-
complete that the majority of the manufacturing sectors in
Greece are net importers.
way. Table 1 gives some important insights con-
cerning the sectoral composition and the sec-
tor-level involvement in international trade of
the Greek economy. Specifically, Table 1 reports
the development over time of sector-level trade
balances in absolute values (columns 1, 3 and 5)
and relative to the sectoral economic perfor-
mance, as measured in percent of value added.
Apart from a few exceptions especially in the
service sector, notably the water transportation
sector (shipping) showing a positive sectoral
trade balance, the great majority of the remain-
ing sectors suffered from significant trade defi-
cits. Such negative trade balances are some-
times considerable with respect to the sector’s
own economic performance.
Figure 3. Net foreign assets (total foreign assets minus total foreign liabilities) in millions of US dollars (left scale)
and in % of GDP (right scale).
Source: Updated version of the External Wealth of Nations Mark II database by Lane and Milesi-Ferretti (see Lane, P. and
Milesi-Ferretti, G.M. "The External Wealth of Nations Mark II", Journal of International Economics, November 2007.
-120
-100
-80
-60
-40
-20
0
-350
-300
-250
-200
-150
-100
-50
0
1990 1993 1996 1999 2002 2005 2008 2011
% USD bn
NFA NFA/GDP

4
This is shown in the second, fourth and sixth
column of Table 1, where the sectoral trade
balance is reported in percentage of sectoral
value added. Finally and most importantly, for
many sectors the situation deteriorated be-
tween 1995 and 2007. This was especially the
case for both chronic deficit sectors, like coke &
petroleum, construction, hotels & restaurants3,
public administration and health, as well as ear-
lier surplus sectors, like agriculture – all of
which weigh considerably in the economy-wide
trade balance. These data show that prior to the
financial crisis most sectors of the economy
were running current account deficits. In princi- 3 The strongly negative numbers for this sector, which
constitutes a large part of the tourism activities, are quite
surprising. They imply that much more Greek citizens
abroad than foreigners in Greece bought hotel and restau-
rant services.
ple, three different forces could play a role
here: diminishing exports but stable imports, in-
creasing imports but stable exports, or imports
increasing faster than exports. The data suggest
that for the majority of sectors, the fast growing
imports were accompanied by stable or even
increasing exports (Fig. 5). Imports thus clearly
reflected growing domestic expenditures driven
by easy credit conditions. For exports, the pic-
ture is in line with the growing aggregate
productivity shown in Figure 4. Export sectors
were overall able to compete internationally
and offer stable or growing amounts of goods
and services abroad.
Figure 4. Productivity developments in Greece.
Note: Total factor productivity (TFP) and labor productivity are indexes with 2010=100 for TFP and 2005=100 for labor
productivity. TFP is calculated as a Solow residual and expresses the part of output growth that cannot be explained by
growth in standard inputs (labor and capital). Labor productivity is expressed in terms of output per employed person.
Source: TFP is taken from AMECO Macroeconomic Database; labor productivity is taken from Haver.
70
75
80
85
90
95
100
105
110
115
1990 1993 1996 1999 2002 2005 2008 2011 2014
Index values
TFP Labor productivity

5
Table 1. Sectoral trade balance (exports – imports).
1995 2007 2011
Mio. € % VA Mio. € % VA Mio. € % VA
Agriculture 438 4.1 -65 -0.7 -52 -0.6
Mining 79 11.8 -1.424 -115.0 -38 -3.5
Food 77 2.0 -869 -12.5 -741 -7.8
Textiles -3 -0.1 326 17.7 -74 -3.0
Leather -57 -30.9 -29 -11.0 12 5.6
Wood -74 -16.4 -157 -31.7 -67 -16.7
Pulp & Paper -420 -45.3 -476 -26.2 -475 -22.3
Coke & Petroleum -1.123 -281.9 -7.958 -487.1 -6.088 -293.8
Chemicals -445 -42.4 540 35.3 439 27.1
Rubber & Plastics -168 -35.1 -59 -5.8 -10 -1.1
Other Non-minerals 55 6.1 -132 -7.1 33 2.3
Metals -134 -10.9 -1.377 -41.8 -141 -4.4
Machinery -102 -20.3 -68 -5.8 188 21.2
Electrical & Optical Eq. -440 -100.9 -157 -11.8 112 13.4
Transport Eq. -295 -53.0 -369 -36.9 22 2.2
Other Manufact. -57 -6.7 182 18.4 -337 -25.9
Electricity, Gas & Water Supply -227 -6.6 -583 -8.1 -391 -5.5
Construction -1.661 -23.2 -4.458 -25.0 -3.118 -25.7
Sale, Maintenance & Repair 16 0.5 99 1.3 102 1.5
Wholesale Trade 4 0.0 -104 -0.5 -107 -0.5
Retail Trade 122 2.0 348 2.2 312 2.0
Hotels & Restaurants -562 -7.2 -2.022 -10.5 -1.654 -8.4
Inland Transport -356 -16.9 -836 -24.5 -797 -22.0
Water Transport 1.197 273.6 18.329 129.7 13.614 121.1
Air Transport -61 -4.9 963 59.8 453 35.0
Other Transport 77 16.6 152 6.0 1.659 78.0
Post & Telecommunications 49 1.7 230 2.8 205 2.7
Financial Interm. -7 -0.1 2 0.0 -113 -0.8
Real Estate -86 -0.6 -264 -0.9 -316 -1.1
Renting & Business Activities -154 -3.5 -51 -0.6 99 1.1
Public Administration -1.331 -13.1 -3.123 -13.4 -2.830 -10.8
Education -12 -0.2 -190 -1.1 -161 -0.9
Health -563 -12.8 -2.936 -24.1 -3.427 -27.8
Other Services -180 -4.0 -917 -8.7 -810 -6.9
Note: See Appendix for a detailed list of sectoral full names.

6
Figure 5. Sectoral trade balances (solid line), imports (dotted line) and exports (dashed line), in
millions of euro.
-400
0
400
800
1200
1600
2000
1995 1998 2001 2004 2007 2010
Agriculture
trade balance exports imports
-2000
-1000
0
1000
2000
3000
4000
1995 1998 2001 2004 2007 2010
Food
-500
0
500
1000
1500
2000
1995 1998 2001 2004 2007 2010
Textiles
-1000
-500
0
500
1000
1995 1998 2001 2004 2007 2010
Pulp & Paper
-15000
-10000
-5000
0
5000
10000
15000
1995 1998 2001 2004 2007 2010
Coke & Petroleum
-1000
-500
0
500
1000
1500
2000
2500
3000
1995 1998 2001 2004 2007 2010
Chemicals
-400
-200
0
200
400
600
1995 1998 2001 2004 2007 2010
Other Non-minerals
-2000
-1000
0
1000
2000
3000
4000
5000
6000
1995 1998 2001 2004 2007 2010
Metals

7
Figure 5. Cont.
-1000
-500
0
500
1000
1995 1998 2001 2004 2007 2010
Electricity, Gas & Water Suppl.
-6000
-4000
-2000
0
2000
4000
6000
8000
1995 1998 2001 2004 2007 2010
Construction
-100
0
100
200
300
400
500
600
1995 1998 2001 2004 2007 2010
Sales, Maintenance & Repair
-500
0
500
1000
1500
2000
2500
3000
3500
1995 1998 2001 2004 2007 2010
Wholesale Trade
-500
0
500
1000
1500
2000
1995 1998 2001 2004 2007 2010
Retail Trade
-3000
-2000
-1000
0
1000
2000
3000
1995 1998 2001 2004 2007 2010
Hotels & Restaurants
-1500
-1000
-500
0
500
1000
1500
2000
1995 1998 2001 2004 2007 2010
Inland Trasport
-500
0
500
1.000
1.500
2.000
2.500
1995 1998 2001 2004 2007 2010
Air Trasport

8
Figure 5. Cont.
Note: The Figure shows data relative to the sectors which produce more than one percent of the economy-wide output (as for 1995; the relative importance of the sectors remains almost invariant over time). Source: Own elaborations based on World Input Output Database.
-100
0
100
200
300
400
500
600
700
1995 1998 2001 2004 2007 2010
Post & Telecommunications
-400
-200
0
200
400
600
800
1000
1995 1998 2001 2004 2007 2010
Financial Interm.
-400
-300
-200
-100
0
100
200
300
400
1995 1998 2001 2004 2007 2010
Real Estate
-500
0
500
1000
1500
2000
1995 1998 2001 2004 2007 2010
Renting and Business Activities
-6000
-4000
-2000
0
2000
4000
6000
1995 1998 2001 2004 2007 2010
Public Administration
-300
-200
-100
0
100
200
300
400
1995 1998 2001 2004 2007 2010
Education
-6000
-4000
-2000
0
2000
4000
6000
1995 1998 2001 2004 2007 2010
Health
-1500
-1000
-500
0
500
1000
1500
1995 1998 2001 2004 2007 2010
Other Services

9
There are, however, a few important excep-
tions from this general pattern. In the case of
coke & petroleum, electricity, gas & water
supply, construction, hotels & restaurants, and
public administration imports were much
stronger and outperforming exports substan-
tially. This suggests that a quite considerable
part of imports flew towards sectors not able to
contribute to a future rebalancing of the
economy-wide current account.
The way ahead for Greece
The analysis of the sectoral trade balances and
their origins confirm that the past current
account deficits in Greece were strongly driven
by excessive demand dynamics, which reflected
the artificially low interest rates in the wake of
accession to EMU and loose fiscal policies.
Exports, by contrast, followed an overall stable
development, which reflected the positive
productivity dynamics of the Greek economy.
Although the current account deficits
disappeared in the recent crisis period, the risk
of reversal is still present, once the economy
recovers. A rebalancing of the Greek current
account is therefore strongly required.
How can such a rebalancing be achieved? There
are not many options left for Greece.
If Greece remains in EMU, the only possibility is
an internal devaluation accompanied by
decisive austerity.
The only alternative to painful internal
devaluation is complete or partial (i.e., through
the introduction of a parallel currency for
domestic use) EMU exit and external
devaluation. In the end, the new Greek
government will have to make a choice between
these two options.
Durably rebalancing the current account
While external devaluation would help in the
indispensable transformation process, it is at
the same time insufficient for a durable
rebalancing of the Greek current account and
long-lasting growth. The rebalancing
immediately following the external devaluation
can only be seen as a first and temporary effect
due to changing relative prices. A durable
rebalancing requires a long-term perspective
and dedicated entrepreneurial efforts to search,
select and undertake profitable investments for
the creation of an economic structure, able to
compete internationally. The crucial ingredient
of such a dynamic process should be the
continuous involvement in innovation activities,
according to the highest international
standards.
In this respect, Greece is much lagging behind
the EU average. The recent results of the EU
Innovation Union Scoreboard 2014 show that in
terms of a composite indicator, the Summary
Innovation Index, Greece scores at around 70%
of the EU average and belongs to the group of
the so called “moderate innovators”, behind
Portugal, Spain, Czech Republic and Italy.
Although in absolute terms of the innovation
index Greece has been improving over time, the
performance relative to the EU average has
declined in the crisis years. Similarly, R&D
expenditures by business are among the lowest
in the EU. Finally, in terms of knowledge-
intensive exports, Greece remains among the
worst performing member states.
Since innovative ventures are characterized by a
high degree of uncertainty over the final
outcome of entrepreneurial activity and
additionally are connected with high costs,
there is a need for the creation and
maintenance of a stable and friendly business
environment. In this respect, efforts should be

10
directed towards the removal of the residual
barriers to business activities in Greece. These
barriers are of different nature. Specifically,
firms in Greece have problems getting financing,
face difficulties in establishing collaborations,
struggle with barriers to commercialization, pay
high costs of accessing new markets etc. The
results of the most recent issue of Community
Innovation Survey reports that 37% of
innovative firms in industrial sectors, 38% in
core innovative activities and 39% in core in-
novative service activities consider the lack of
adequate finance as a highly important barrier
to innovation. In contrast, only around 13% of
innovative firms from across all sectors
considered the access to adequate finance as
not being relevant. Similarly, high costs of
access to new markets were a highly important
barrier to innovation for 32% of innovative firms
in the industrial sectors, for 25% in core
innovation activities and for 20% in core
innovation service activities.
Substantial improvements in microeconomic
structure are required also elsewhere.
Regarding the ease of doing business Greece
ranks 61 in the total of 189 countries
worldwide.
Among the different categories of difficulties
that firms face, enforcing contracts (rank 155)
and registering property (rank 116) constitute
the most serious ones. Other important
adjustments should be directed towards the
improvement in country’s governance
landscape. According to the World Bank’s
estimates, Greece scores poorly in terms of
almost all dimensions: control of corruption (in
2013 the country ranked in the 55.5 percentile),
political stability and no violence (39.3), rule of
law (63.5), government effectiveness (67.0) and
regulatory quality (72.7). Finally, closed
professions, low labor force participation and
corruption open further fields of necessary
interventions.
Conclusion
In our view, Greece needs a two-pronged
strategy: a reduction of excess demand (which
has been largely achieved) and an improvement
of economic efficiency and competitiveness
(which so far has proven elusive). Exchange rate
depreciation, through full or partial EMU exit,
could bring necessary relief. But comprehensive
reform of the supply side is needed to achieve
lasting economic growth.

11
Appendix
Full names of industrial sectors
Abbreviated names Full names
Agriculture Agriculture, Hunting, Forestry and Fishing
Mining Mining and Quarrying
Food Food, Beverages and Tobacco
Textiles Textiles and Textile Products
Leather Leather, Leather and Footwear
Wood Wood and Products of Wood and Cork
Pulp & Paper Pulp, Paper, Paper , Printing and Publishing
Coke & Petroleum Coke, Refined Petroleum and Nuclear Fuel
Chemicals Chemicals and Chemical Products
Rubber & Plastic Rubber and Plastics
Other Non-minerals Other Non-Metallic Mineral
Metals Basic Metals and Fabricated Metal
Machinery Machinery, Nec
Electrical & Optical Eq. Electrical and Optical Equipment
Transport Eq. Transport Equipment
Other Manufact. Manufacturing, Nec; Recycling
Electricity, Gas & Water Supply Electricity, Gas and Water Supply
Construction Construction
Sales, Maintenance & Repair Sale, Maintenance and Repair of Motor Vehicles and Motorcycles; Retail Sale of Fuel
Wholesale Trade Wholesale Trade and Commission Trade, Except of Motor Vehicles and Motorcycles
Retail Trade Retail Trade, Except of Motor Vehicles and Motorcycles; Repair of Household Goods
Hotels & Restaurants Hotels and Restaurants
Inland Transport Inland Transport
Water Transport Water Transport
Air Transport Air Transport
Other Transport Other Supporting and Auxiliary Transport Activities; Activities of Travel Agencies
Post & Telecommunications Post and Telecommunications
Finance Financial Intermediation
Real Estate Real Estate Activities
Renting & Business Activities Renting of M&Eq and Other Business Activities
Public Administration Public Admin and Defence; Compulsory Social Security
Education Education
Health Health and Social Work
Other Services Other Community, Social and Personal Services
12
Reprinting or making the content publicly available – in particular by including it in third-party websites – together with
reproduction on data storage devices of any kind requires the prior written consent of Flossbach von Storch AG.
Legal notice
The information contained and opinions expressed in this document reflect the views of the author at the time of publica-
tion and are subject to change without prior notice. Forward-looking statements reflect the judgement and future expecta-
tions of the author. The opinions and expectations found in this document may differ from estimations found in other
documents of Flossbach von Storch AG. The above information is provided for informational purposes only and without any
obligation, whether contractual or otherwise. This document does not constitute an offer to sell, purchase or subscribe to
securities or other assets. The information and estimates contained herein do not constitute investment advice or any
other form of recommendation. All information has been compiled with care. However, no guarantee is given as to the
accuracy and completeness of information and no liability is accepted. Past performance is not a reliable indicator of fu-
ture performance.
All authorial rights and other rights, titles and claims (including copyrights, brands, patents, intellectual property rights and
other rights) to, for and from all the information in this publication are subject, without restriction, to the applicable provi-
sions and property rights of the registered owners. You do not acquire any rights to the contents. Copyright for contents
created and published by Flossbach von Storch AG remains solely with Flossbach von Storch AG. Such content may not be
reproduced or used in full or in part without the written approval of Flossbach von Storch AG.
© 2015 Flossbach von Storch. All rights reserved.
Site information
Publisher: Flossbach von Storch AG, Research Institute, Ottoplatz 1, 50679 Cologne, Germany; Phone +49 221 33 88-291,
[email protected], Directors: Dr. Bert Flossbach, Kurt von Storch, Dirk von Velsen; Registration: No. 30 768 in the Com-
mercial and Companies Register held at Cologne District Court; VAT-No. DE200075205; Supervisory authority: German
Federal Financial Services Supervisory Authority, Marie-Curie-Straße 24 – 28, 60439 Frankfurt / Graurheindorfer Straße 108,
53117 Bonn, www.bafin.de; Authors: Agnieszka Gehringer, PhD; Editorial deadline: 27/4/2015