Greater inequalities in dental caries treatment than in ...
13
Qin et al. BMC Oral Health (2021) 21:564 https://doi.org/10.1186/s12903-021-01935-z RESEARCH Greater inequalities in dental caries treatment than in caries experience: a concentration index decomposition approach Yuandong Qin 1 , Lin Chen 1 , Jianbo Li 1 , Yunyun Wu 2 and Shaohong Huang 1* Abstract Background: The aim of the current study was to (a) measure the socioeconomic inequalities in oral health and examine whether the inequalities are greater in disease experience or in its treatment and to (b) decompose the fac- tors that influence oral health inequalities among the adults of Guangdong Province. Methods: A cross-sectional study was conducted among 35- to 44-year-old and 65- to 74-year-old adults in Guang- dong Province. All participants underwent oral health examinations and answered questionnaires about their oral health. We measured the concentration indices of the DMFT and its separate components, namely, decayed teeth (DT), missing teeth (MT), and filled teeth (FT), to explore the inequalities in oral health status; then, we analysed its decomposition to interpret the factors that influence the inequalities. Results: The results showed that significant inequality was concentrated on FT (CI = 0.24, 95% CI = 0.14/0.33, SE = 0.05). The concentration indices for the DMFT (CI = 0.02, 95% CI = 0.02/0.06, SE = 0.02) and MT (CI = 0.02, 95% CI 0.03/0.08, SE = 0.03) were small and close to zero, while the concentration for DT (CI = − 0.04, 95% CI = − 0.01/0.02, SE = 0.03) was not statistically significant. The results from the decomposition analysis suggested that a substantial proportion of the inequality was explained by household income, high education level, regular oral examination and type of insurance (5.1%, 12.4%, 43.2%, − 39.6% (Urban Employee Basic Medical Insurance System) and 34.5% (New- Type Rural Medical Collaboration System), respectively). Conclusions: The results indicated greater inequalities in dental caries than in caries experience. Among the included factors, household income, high education level, and regular oral health examinations had the greatest impact on the inequalities in the number of FT. In addition, the current medical insurance systems, including the Urban Employee Basic Medical Insurance System, Urban Resident Basic Medical Insurance System, and the New-Type Rural Medical Collaboration System, have not been effectively used in oral treatment. Policy-making and the imple- mentation of interventions for tackling socioeconomic oral health inequalities should focus on reducing the burden of treatment and providing greater access to dental care for low-income groups. Welfare policies are skewed towards rural areas and low-income people. Keywords: Dental caries, Socioeconomic-related oral health inequality, Concentration index, Welfare policy © The Author(s) 2021. Open Access This article is licensed under a Creative Commons Attribution 4.0 International License, which permits use, sharing, adaptation, distribution and reproduction in any medium or format, as long as you give appropriate credit to the original author(s) and the source, provide a link to the Creative Commons licence, and indicate if changes were made. The images or other third party material in this article are included in the article’s Creative Commons licence, unless indicated otherwise in a credit line to the material. If material is not included in the article’s Creative Commons licence and your intended use is not permitted by statutory regulation or exceeds the permitted use, you will need to obtain permission directly from the copyright holder. To view a copy of this licence, visit http://creativecommons.org/licenses/by/4.0/. The Creative Commons Public Domain Dedication waiver (http://creativeco mmons.org/publicdomain/zero/1.0/) applies to the data made available in this article, unless otherwise stated in a credit line to the data. Background Socioeconomic-related oral health inequalities are a major concern [1] worldwide and exist in both developed and developing countries [2–5]. A study from the United States [6] reported that periodontal disease inequalities Open Access *Correspondence: [email protected] 1 Stomatological Hospital, Southern Medical University, No. 366, South of Jiangnan Avenue, Guangzhou, China Full list of author information is available at the end of the article
Transcript of Greater inequalities in dental caries treatment than in ...

Qin et al. BMC Oral Health (2021) 21:564 https://doi.org/10.1186/s12903-021-01935-z
RESEARCH
Greater inequalities in dental caries treatment than in caries experience: a concentration index decomposition approachYuandong Qin1, Lin Chen1, Jianbo Li1, Yunyun Wu2 and Shaohong Huang1*
Abstract
Background: The aim of the current study was to (a) measure the socioeconomic inequalities in oral health and examine whether the inequalities are greater in disease experience or in its treatment and to (b) decompose the fac-tors that influence oral health inequalities among the adults of Guangdong Province.
Methods: A cross-sectional study was conducted among 35- to 44-year-old and 65- to 74-year-old adults in Guang-dong Province. All participants underwent oral health examinations and answered questionnaires about their oral health. We measured the concentration indices of the DMFT and its separate components, namely, decayed teeth (DT), missing teeth (MT), and filled teeth (FT), to explore the inequalities in oral health status; then, we analysed its decomposition to interpret the factors that influence the inequalities.
Results: The results showed that significant inequality was concentrated on FT (CI = 0.24, 95% CI = 0.14/0.33, SE = 0.05). The concentration indices for the DMFT (CI = 0.02, 95% CI = 0.02/0.06, SE = 0.02) and MT (CI = 0.02, 95% CI 0.03/0.08, SE = 0.03) were small and close to zero, while the concentration for DT (CI = − 0.04, 95% CI = − 0.01/0.02, SE = 0.03) was not statistically significant. The results from the decomposition analysis suggested that a substantial proportion of the inequality was explained by household income, high education level, regular oral examination and type of insurance (5.1%, 12.4%, 43.2%, − 39.6% (Urban Employee Basic Medical Insurance System) and 34.5% (New-Type Rural Medical Collaboration System), respectively).
Conclusions: The results indicated greater inequalities in dental caries than in caries experience. Among the included factors, household income, high education level, and regular oral health examinations had the greatest impact on the inequalities in the number of FT. In addition, the current medical insurance systems, including the Urban Employee Basic Medical Insurance System, Urban Resident Basic Medical Insurance System, and the New-Type Rural Medical Collaboration System, have not been effectively used in oral treatment. Policy-making and the imple-mentation of interventions for tackling socioeconomic oral health inequalities should focus on reducing the burden of treatment and providing greater access to dental care for low-income groups. Welfare policies are skewed towards rural areas and low-income people.
Keywords: Dental caries, Socioeconomic-related oral health inequality, Concentration index, Welfare policy
© The Author(s) 2021. Open Access This article is licensed under a Creative Commons Attribution 4.0 International License, which permits use, sharing, adaptation, distribution and reproduction in any medium or format, as long as you give appropriate credit to the original author(s) and the source, provide a link to the Creative Commons licence, and indicate if changes were made. The images or other third party material in this article are included in the article’s Creative Commons licence, unless indicated otherwise in a credit line to the material. If material is not included in the article’s Creative Commons licence and your intended use is not permitted by statutory regulation or exceeds the permitted use, you will need to obtain permission directly from the copyright holder. To view a copy of this licence, visit http:// creat iveco mmons. org/ licen ses/ by/4. 0/. The Creative Commons Public Domain Dedication waiver (http:// creat iveco mmons. org/ publi cdoma in/ zero/1. 0/) applies to the data made available in this article, unless otherwise stated in a credit line to the data.
BackgroundSocioeconomic-related oral health inequalities are a major concern [1] worldwide and exist in both developed and developing countries [2–5]. A study from the United States [6] reported that periodontal disease inequalities
Open Access
*Correspondence: [email protected] Stomatological Hospital, Southern Medical University, No. 366, South of Jiangnan Avenue, Guangzhou, ChinaFull list of author information is available at the end of the article

Page 2 of 13Qin et al. BMC Oral Health (2021) 21:564
are pervasive and associated with education, income and race/ethnicity. In the United Kingdom [7], social gradi-ents in regard to dental caries are common in both chil-dren and adults. Socioeconomic disparities in oral health care are both unnecessary and avoidable, and even more important, they are considered unfair and unjust [8]. Therefore, socioeconomic inequalities in oral health have drawn extensive attention. For instance, the international Centre for Oral Health Inequalities Research and Policy (ICOHIRP) was founded in 2013, and the London Char-ter on Oral Health Inequalities was subsequently pub-lished in 2015 [4].
With a permanent resident population of 108.49 mil-lion in 2015 (Data from STATS.GD.GOV. CN: http:// stats. gd. gov. cn/ gdtjnj/ conte nt/ post_ 14248 95. html), Guangdong Province is located in southern China and covers an area of 174,246 km2 (Data from Ministry of Civil Affairs of the People’s Republic of China: http:// xzqh. mca. gov. cn/ defau ltQue ry? sheng ji=% B9% E3% B6% AB% CA% A1% 28% D4% C1% 29& diji=- 1& xianj i=-1). Since 1989, the economic aggregate of Guangdong has ranked first among the 31 provinces of China (Data from National Bureau of Statistics: http:// www. stats. gov. cn/ tjsj/ ndsj/ 2015/ index ch. htm). The province suffers from inequalities in the economic development level [9], and the socioeconomic gradient is closely associated with oral disease distribution [10–12]. As a developed region in China, the current situation of Guangdong Province can predict the future development of other regions. How-ever, there is a lack of research on socioeconomic-related oral health inequalities in this region of China. This situ-ation is not conducive to the development of policies to promote oral health equality.
Socioeconomic inequalities in oral health have been reported both internationally and nationally to explore measures to reduce oral health inequalities. Tselmuun Chinzorig [13] reported inequalities in caries expe-rience among Mongolian children. Mengru Xu [14] measured and decomposed socioeconomic-related ine-quality in the use of oral health services among Chinese adults and found that oral health care service utiliza-tion was disproportionately concentrated among bet-ter-off Chinese adults. These studies focused either on a single aspect of oral disease or on oral health care ser-vice utilization. However, oral disease and oral health care services together affect oral health outcomes, which should be considered in research on oral health inequalities. Dental caries are a long-term chronic dis-ease whose lifelong effects and management can be directly observed and measured. Dental caries are com-monly measured by the DMFT index and its compo-nents, namely, DT (decayed teeth), MT (missing teeth), and FT (filled teeth). The DMFT is the sum of DT, MT
and FT, which reflects one’s actual disease experience (past and present), while DT, MT, FT separately indi-cate the management of that disease [15]. To address social inequalities in oral health, it is very important to understand whether oral health inequalities are due to the experience of disease or to the treatment of disease.
Previous studies have usually assessed oral health ine-quality through regression-based methods [16] or vari-ation in mean health across quintiles of the oral health index [17]. Although convenient and easy to interpret, such a grouped analysis provides only a partial picture of how health varies across the full distribution of the oral health index. A complete picture can be provided using a concentration index, which displays the share of health accounted for by cumulative proportions of indi-viduals in a population ranked from poorest to richest [17]. Moreover, the decomposition of the concentration index helps to analyse which variables contribute to the inequality [17]. In this context, the use of the con-centration index and its decomposition approach has permitted an understanding of contributors to socio-economic inequalities in oral health.
The aim of this study was to explore the socio-economic inequalities of oral health in Guangdong Province that exist mainly in disease experience or treatment and to analyse the factors that influence the inequality by a concentration index decomposition approach.
MethodsStudy design and sampleThis study presents an analysis of the data from an epi-demiological survey of oral health status in Guangdong Province conducted from December 2015 to April 2016.
A cross-sectional study was conducted among two age groups (35–44-year-olds and 65–74-year-olds) of adults in Guangdong Province. In this study, we obtained a rep-resentative sample by using a multistage stratified cluster sampling method with selection probabilities propor-tional to size (PPS) [18]. In the first stage, four districts and four counties were chosen randomly by stratified sampling using the probability-proportional-to-size (PPS) method. In the second stage, the PPS method was used to select three neighbourhood committees in each district and three village committees in each county. In the third stage, the individuals who were interviewed in the selected communities were chosen using a quota sampling method [19] that excluded people with serious physical or psychological illness or disadvantages, as well as those who were unable or unwilling to finish the sur-vey. The sample size for each age group was estimated from the following formula:

Page 3 of 13Qin et al. BMC Oral Health (2021) 21:564
N represents the sample size. Considering the stratifi-cation of urban–rural and male–female, the sampling design efficiency ‘deff’ was set to 3.0. Furthermore, p rep-resents the prevalence of caries among 35–44-year-old adults of Guangdong in the Third National Oral Health Survey [20], which was 63.9%. The level of confidence is μ = 1.96, and the margin of error is δ = 10%. The required sample size for each age group was 266 according to the formula. Finally, 576 participants responded to the invita-tion and completed the survey, with 288 participants in each age group.
This study was approved by the Stomatological Ethics Committee of the Chinese Stomatological Association on July 9, 2014 (Approval No.: 2014-003). Before the study, all the participants were provided with all the details of the survey, and signed informed consent was obtained.
Data collectionData were collected through structured questionnaires and oral examinations at the corresponding communi-ties. The structured questionnaire [21, 22] solicited infor-mation on household income, education, oral health knowledge, attitudes, oral health practices and key soci-odemographic variables. Prior to the data collection, the questions were pre-tested in comparable groups of adults in order to assess reliability and validity. A sub-sample of participants who were given the same questionnaire 20–30 days after completion of the initial questionnaire and consistency rates of at least 70% were achieved [23]. Trained dentists completed the questionnaires in one-to-one interviews in Chinese, which helped overcome barri-ers of illiteracy. Furthermore, in districts where dialects were difficult to understand, a local person acted as an assistant. The training sessions for the dentists were held by the Chinese Stomatological Association and Peking University Hospital of Stomatology in Beijing before the start of the survey. Survey staffs were trained by a stand-ard survey staff on the questionnaire content, question-naire methods, questionnaire skills, details to be paid attention to. After the training, questionnaire consistency assessment was carried out from a sub-sample of par-ticipants who completed the questionnaire supervised by the same survey staff 20–30 days after completion of the initial questionnaire, and the consistency rates were more than 90%. The oral examination of the participant’s dental caries status was performed with the aid of a mirror and a ball-ended WHO Community Periodontal Index probe by three calibrated and accredited dentists with the assis-tance of trained recorders, according to World Health Organization (WHO) criteria [24]. The calibration results were 0.83–0.92, as calculated by kappa statistics. The
N = deff(µ2p(1− p)/δ2 numbers of decayed teeth and missing teeth and filled teeth were recorded based on the criteria recommended by the WHO [24].
VariablesThe variables in the study included the following.
Oral health outcomes The participants’ dental caries status was evaluated by analysing the DMFT index, which is commonly used for epidemiological studies in dental research. Teeth were classified as decayed (DT) if there was evidence of cavitation on the crown or root. Teeth do not present for any reason in people 30 years and older were classified as missing (MT). Filled teeth without secondary caries were classified as filled (FT). The total number of DTs, MTs and FTs was recorded as the DMFT score, which was used to assess the participant’s dental caries disease experience [25].
Household income Annual household income was obtained by the question: “What was your approximate total household income in the past 12 months?” Partici-pants were asked to answer with an exact number using the integer value of ¥10,000. To facilitate statistics, we categorized household income as follows: low (≤ ¥20 000/year, approximately US$2903.5/year), medium (¥30 000/year-¥40,000/year, approximately US$4353.8/year–US$5805.0/year), medium–high (¥50 000/year − ¥70,000/year, approximately US$7256.3/year − US$10,158.8/year) and high (≥ ¥80 000/year, approximately US$11,610.0/year) [26, 27] when bivariate analysis and multivariate analysis were performed. The participants were allowed to leave this question unanswered because income is a sensitive issue.
Education Education was classified as no formal school-ing, primary school, middle school, high school, technical secondary school, junior college, university completed, or postgraduate degree or above.
Health‑related behaviour variables These variables included the consumption of desserts (Yes/No), con-sumption of sugared drinks (Yes/No), tooth brushing (Yes/No), toothpick use (Yes/No), floss use (Yes/No), last time of dental attendance (never visit dentist, visited dentist 1 year ago, visited dentist 6–12 month ago, visited dentist within last 6 months).
Oral health knowledge Oral health knowledge was measured by eight questions [23], as shown in Table 1, and the quality of measurement is shown in Table 2. The correct answer for each question was coded as 1, and an incorrect answer or “don’t know” answers were coded as

Page 4 of 13Qin et al. BMC Oral Health (2021) 21:564
0. The sum of the eight answers created a single oral health knowledge variable ranging from 0 to 8. A score less than or equal to 4 was categorized as "low", and a score greater than 4 was categorized as "high".
Oral health attitudes Four questions [23], as shown in Table 1, were included as items in the oral health attitude summary score, and the quality of measurement is shown in Table 2; the answer for each question was “agree”, “disa-gree” or “neither”. Responses were coded 1 for a positive attitude and 0 for a negative attitude or neither. The final oral health attitude scores ranged from 0 to 4; scores were categorized as "low" (0–2) and "high" (3–4).
Subjective health conditions These included self-rated oral health (good, fair or poor), chronic disease (yes/no).
Socio‑demographic variables These included gender (male or female), age, type of household (non-agricultural family or agricultural family).
Insurance information variable There are three medi-cal insurance systems for citizens in China: the urban employee basic medical insurance for the urban employed, the new-type rural collaboration medical system for rural residents, and the urban resident basic medical insurance covering urban residents without formal employment.
Citizens are insured on a voluntary basis. We obtained the insurance information variable by asking the follow-ing questions:
Reimbursement for dental treatment: "Do you get reimbursement for dental treatment?" "Yes/No".Urban Employee Basic Medical Insurance System: "Do you have the urban employee basic medical insurance system?" "Yes/No".Urban Resident Basic Medical Insurance System: "Do you have the urban resident medical insurance system?" "Yes/No".The New‑Type Rural Medical Collaboration System: "Do you have the new‑type rural medical collabora‑tion system?" "Yes/No".
AnalysisConcentration IndexStatistical analyses were carried out adjusted for the complex sample. The sample weights of each sampling stage were the inverse of the probability of selection. The sample weights of each evaluated case were the product of the sample weights of each stage.
Inequalities in oral health status, including the DMFT, DT, MT, and FT, were identified by the concentration index (CI) in the study. The concentration index provides a way to assess the degree of health-related economic inequality [28–30] and is increasingly used in the den-tal literature [31]. The CI is constructed by a concentra-tion curve (CC). The CC illustrates the distribution of a health variable (Y axis) against an economic variable (X axis). The economic variable (household income) is cumulatively ranked and ranges from the poorest person/
Table 1 Questionnaire about oral health knowledge and oral health attitudes
Number Question Answer
Questions about oral health knowledge
1 Gingival bleeding is normal when brushing teeth No () Yes () Don’t know ()
2 Germs are one of the reasons for gingivitis No () Yes () Don’t know ()
3 Toothbrushing is useless to prevent gingivitis No () Yes () Don’t know ()
4 Dental caries are mainly caused by germs No () Yes () Don’t know ()
5 Sugar consumption can lead to dental caries No () Yes () Don’t know ()
6 Fluoride is useless in protecting teeth No () Yes () Don’t know ()
7 Pit and fissure sealant can protect teeth No () Yes () Don’t know ()
8 Oral disease can influence systemic health No () Yes () Don’t know ()
Questions about oral health attitudes
1 My oral health is very important to me Agree () Disagree () Neither ()
2 Regular dental check-ups are important Agree () Disagree () Neither ()
3 Tooth condition is decided at birth and is not related to self-care Agree () Disagree () Neither ()
4 Self-care is important in preventing dental problems Agree () Disagree () Neither ()
Table 2 Reliability and validity of knowledge and attitude
Measure Cronbach alpha KMO P of Bartlett Test
Knowledge 0.76 0.78 < 0.001
Attitude 0.73 0.77 < 0.001

Page 5 of 13Qin et al. BMC Oral Health (2021) 21:564
household to the richest. In fact, the curve shows among which economic groups health is mostly concentrated. If health is equally distributed across the economic groups, the curve will be a 45-degree line called the ‘equality line’. Otherwise, the curve will lie above or below the equal-ity line, thereby showing the existence of inequality in the distribution of health. The CI value is the area between equality line and the CC. In the case of equality, the CC and the equality line coincide, and the CI is zero. If the CC lies above the equality line, this indicates that health is highly concentrated among people of lower economic status, and the CI will take a negative value. If the CC lies below the equality line, this indicates that health is highly concentrated among people of higher economic status, and the CI will take a positive value [29]. The CI can be represented by following [32, 33]:
where yi and Ri are, respectively, the health status of the ith individual and the fractional rank of the ith individual in terms of the index of household economic status; μ is the mean of the health of the sample; and cov denotes the covariance.
Decomposition of the concentration indexAfter measurement of the CI, we can go further and decompose the CI to understand which variables con-tribute to the inequality [30]. To do so, a negative bino-mial model was chosen since count data showed signs of overdispersion [34, 35]. Wagstaff and colleagues [17] wrote a nonlinear model of the relationship between a health variable, y, which may be count data, and factors (x) in terms of a general functional form G:
where G takes a particular form for the negative binomial model. The concentration index for y, CI can be written as follows:
where μ is the mean of y, xk is the mean of xk , Ck is the concentration index for xk , and GCε is the generalized concentration index for the error term (ε).
Equation (b) consists of two components: (1) an explained component and (2) an unexplained compo-nent. The first component is made up of two constitu-ents: elasticity and the CI of regressors. The second component, the unexplained part, is the part of the ine-quality that cannot be explained by systematic variation
CI = 2/µ cov(yi,Ri)
(a)yi = G
(
α +
∑
i
βixi
)
+ εi
(b)CI =∑
K
(βkxk/µ)Ck + GCε/µ
in the determinants across economic groups. To perform the decomposition, the values of all variables in Eq. (b) should be calculated. First, the coefficients (βk) of the explanatory variables are calculated. To do so, a regres-sion analysis using an appropriate regression model must be conducted. In the present study, considering that FT is a continuous variable and not normally distributed, non-parametric tests, namely, the Mann–Whitney U-test and Kruskal–Wallis H(K) test, were used to evaluate the bivariate associations between each explanatory variable and FT. Then, linear regression was used to calculate the coefficient of explanatory variables. In the second step, the means of the health variable (μ) and each determi-nant ( xk ) are calculated. All the variables in Eqs. (a) and (b) are calculated, and one can reveal the contribution of each determinant to inequality by multiplying the elastic-ity of each determinant by
(
βkxkµ
)
Ck . This is the absolute contribution of each determinant to the measured ine-quality. In the last step, to calculate the percentage con-tribution, the absolute contribution of each determinant is divided by the CI of the health variable
(
βkxkµ
)
Ck/CI. The contribution of an X variable to the measured health inequality can be either positive or negative. A positive contribution shows that the variable would add to the inequality in the health variable and vice versa.
Statistical analyses were conducted using Stata MP 13. The level of statistical significance for the tests men-tioned was set at p < 0.05.
ResultsSample characteristicsThe final sample consisted of 576 participants aged 35–44 years and 65–74 years. The basic characteris-tics of dental caries in the study participants are shown in Table 3. Nearly all (95.6%) participants reported hav-ing dental caries experience (DMFT ≥ 1), and the mean DMFT score was 8.51 (95% CI 7.85/9.18). The prevalence rate for DT ≥ 1 was 66.1%, and the mean number of DTs was 2.30 (95% CI 1.94/2.66). The mean number of MTs was 5.35 (95% CI 4.68/6.01), and 84.6% of participants suffered from missing teeth. Surprisingly, only 31.1% of
Table 3 Basic characteristics of dental caries in the study participants
DMFT, decayed, missing and filled teeth; DT, decayed teeth; MT, missing teeth; FT, filled teeth
Outcome ≥ 1 (%) Mean 95% CI
DMFT 95.6 8.51 7.85 9.18
DT 66.1 2.30 1.94 2.66
MT 84.6 5.35 4.68 6.01
FT 31.1 0.87 0.51 1.22
Page 6 of 13Qin et al. BMC Oral Health (2021) 21:564
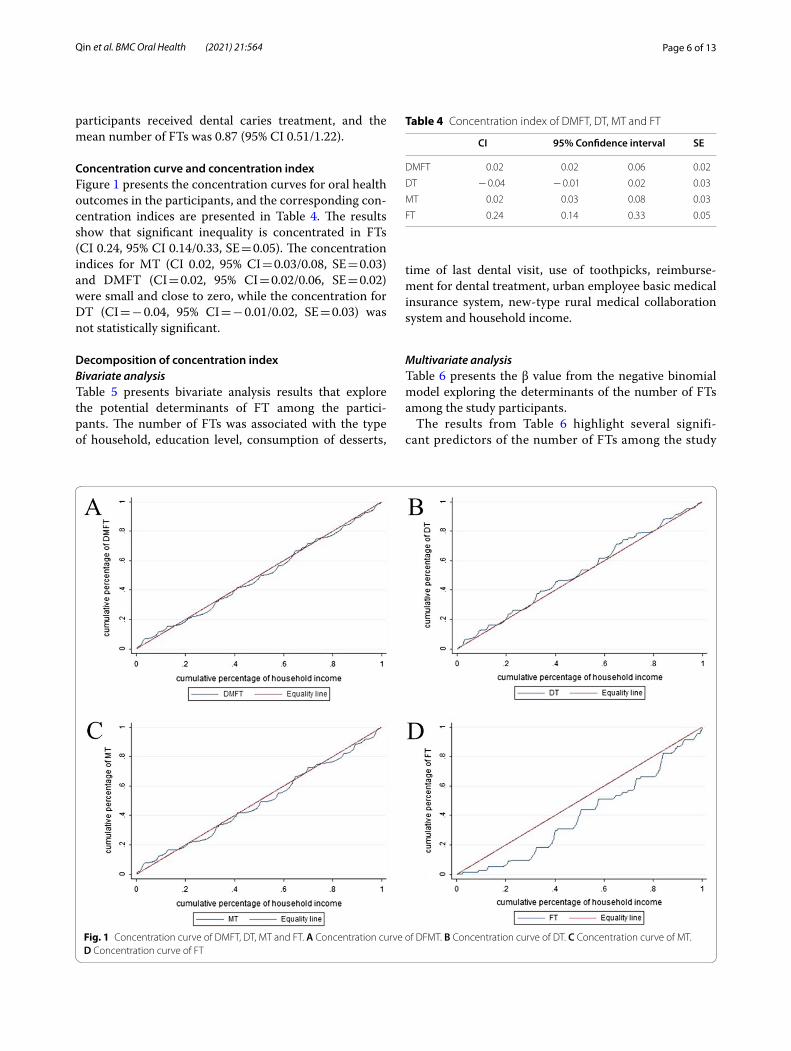
participants received dental caries treatment, and the mean number of FTs was 0.87 (95% CI 0.51/1.22).
Concentration curve and concentration indexFigure 1 presents the concentration curves for oral health outcomes in the participants, and the corresponding con-centration indices are presented in Table 4. The results show that significant inequality is concentrated in FTs (CI 0.24, 95% CI 0.14/0.33, SE = 0.05). The concentration indices for MT (CI 0.02, 95% CI = 0.03/0.08, SE = 0.03) and DMFT (CI = 0.02, 95% CI = 0.02/0.06, SE = 0.02) were small and close to zero, while the concentration for DT (CI = − 0.04, 95% CI = − 0.01/0.02, SE = 0.03) was not statistically significant.
Decomposition of concentration indexBivariate analysisTable 5 presents bivariate analysis results that explore the potential determinants of FT among the partici-pants. The number of FTs was associated with the type of household, education level, consumption of desserts,
time of last dental visit, use of toothpicks, reimburse-ment for dental treatment, urban employee basic medical insurance system, new-type rural medical collaboration system and household income.
Multivariate analysisTable 6 presents the β value from the negative binomial model exploring the determinants of the number of FTs among the study participants.
The results from Table 6 highlight several signifi-cant predictors of the number of FTs among the study
Fig. 1 Concentration curve of DMFT, DT, MT and FT. A Concentration curve of DFMT. B Concentration curve of DT. C Concentration curve of MT. D Concentration curve of FT
Table 4 Concentration index of DMFT, DT, MT and FT
CI 95% Confidence interval SE
DMFT 0.02 0.02 0.06 0.02
DT − 0.04 − 0.01 0.02 0.03
MT 0.02 0.03 0.08 0.03
FT 0.24 0.14 0.33 0.05

Page 7 of 13Qin et al. BMC Oral Health (2021) 21:564
participants. In particular, household income, gender, type of household, age, use of toothpicks, time of last- dental visit and urban resident medical insurance sys-tem were positively associated with the number of FTs. In separate univariate analyses, variables including education, consumption of desserts, reimbursement for dental treatment, urban employee basic medical insurance system, and the new-type rural medical col-laboration system were significant; however, they did not remain so in the multivariate analysis shown in Table 6. This is likely because of collinearity between variables. Despite this, we felt that the inclusion of all these variables in the multivariate model was impor-tant to capture the full effect of socioeconomic status on FT inequality.
Decomposition analysis of concentration indexTable 7 presents the results of the decomposition analysis of the variables contributing to FT inequality. The results are presented as the contribution and percentage con-tribution of each variable to the overall inequality in the concentration index. A positive contribution means that the variable increases the inequality of FT and vice versa. For socioeconomic-related FT inequalities, high-income people receive more dental fillings or low-income peo-ple receive fewer dental fillings, which can promote the inequality of FTs, and the contribution of the variable will be positive. However, only the number of low-income people who received fewer dental fillings should be recti-fied to reduce inequality. Therefore, we should combine
Table 5 Factors associated with FT: bivariate associations
FT 95% CI P
Mean SE
Gender
Male 0.67 0.12 0.44 0.90 0.17
Female 1.07 0.28 0.52 1.61
Type of household
Non-agricultural family 1.27 0.17 0.93 1.61 0.01
Agricultural family 0.54 0.11 0.32 0.77
Age
35–39 years 1.02 0.16 0.71 1.34 0.47
65–74 years 0.71 0.24 0.25 1.18
Education
Low education level 0.34 0.05 0.23 0.44 0.04
Medium education level 0.86 0.24 0.38 1.33
High education level 1.08 0.21 0.68 1.48
Consumption of desserts
No 0.59 0.12 0.36 0.82 0.04
Yes 1.08 0.21 0.68 1.48
Consumption of sugared beverages
No 0.93 0.22 0.51 1.35 0.25
Yes 0.60 0.11 0.38 0.82
Time of last dental visit
Never visited dentist 0.06 0.03 0.00 0.12 0.00
Visited dentist 1 year ago 0.87 0.15 0.57 1.17
Visited dentist 6–12 months ago 2.03 0.49 1.06 2.99
Visited dentist within last 6 months 1.75 0.39 1.00 2.51
Tooth brushing
No 0.00 0.00 0.00 0.00
Yes 0.87 0.18 0.51 1.23
Toothpick use
No 0.58 0.12 0.33 0.82 0.01
Yes 0.97 0.22 0.54 1.39
Flossing
No 0.82 0.17 0.48 1.16 0.00
Yes 1.72 0.25 1.24 2.21
Reimbursement for dental treatment
No 0.82 0.17 0.49 1.15 0.00
Yes 2.04 0.30 1.45 2.62
Urban employee basic medical insurance system
No 0.58 0.12 0.34 0.82 0.00
Yes 1.32 0.19 0.95 1.69
Urban residents medical insurance system
No 0.85 0.19 0.48 1.21 0.76
Yes 1.01 0.20 0.63 1.40
The new-type rural medical collaboration system
No 1.23 0.14 0.95 1.52 0.00
Yes 0.45 0.12 0.21 0.69
Self-rated oral health
Self-rate oral health as low 0.85 0.24 0.37 1.33 0.43
Self-rate oral health as Medium 0.98 0.22 0.56 1.41
Table 5 (continued)
FT 95% CI P
Mean SE
Self-rate oral health as High 0.64 0.08 0.47 0.80
Oral health knowledge
Low scores on oral health knowledge 0.79 0.18 0.44 1.14 0.17
High scores on oral health knowl-edge
1.17 0.29 0.60 1.75
Oral health attitude
Low scores on oral health attitude 0.50 0.08 0.34 0.66 0.17
High scores on oral health attitude 0.95 0.21 0.55 1.36
Chronic disease
No 0.85 0.14 0.57 1.12 0.70
Yes 0.92 0.32 0.29 1.55
Household income
Low 0.37 0.20 − 0.02 0.77 0.02
Medium 0.77 0.25 0.29 1.26
Medium–high 0.85 0.22 0.41 1.28
High 1.14 0.17 0.80 1.47

Page 8 of 13Qin et al. BMC Oral Health (2021) 21:564
Table 6 Multivariate analysis of determinants of FTs
Variable β P value 95% CI
Gender
Male Base category
Female 0.30 0.03 − 0.13 0.73
Type of household
Non-agricultural family Base category
Agricultural family − 0.53 0.02 − 0.99 − 0.08
Age
35–44 years Base category
65–74 years − 0.73 0.00 − 1.09 − 0.38
Education
Low education level Base category
Medium education level 0.51 0.16 − 0.30 1.32
High education level 0.25 0.55 − 0.59 1.10
Consumption of desserts
No Base category
Yes 0.03 0.36 − 0.29 0.36
Consumption of sugared beverages
No Base category
Yes − 0.26 0.19 − 0.73 0.21
Time of last dental visit
Never visit dentist Base category
Visited dentist 1 year ago 2.70 0.00 1.88 3.51
Visited dentist 6–12 months ago 3.46 0.00 2.59 4.33
Visited dentist within last 6 months 3.18 0.00 2.42 3.93
Toothpick use
No Base category
Yes 0.75 0.00 0.55 0.94
Flossing
No Base category
Yes 0.38 0.41 − 0.28 1.05
Reimbursement for dental treatment
No Base category
Yes − 0.08 0.64 − 0.61 0.46
Urban employee basic medical insurance system
No Base category
Yes − 0.45 0.13 − 1.03 0.13
Urban resident medical insurance system
No Base category
Yes − 0.78 0.01 − 1.21 − 0.35
The new-type rural medical collaboration system
No Base category
Yes − 0.91 0.18 − 1.68 − 0.14
Self-rated oral health
Self-rate oral health as low Base category
Self-rate oral health as Medium 0.00 0.51 − 0.32 0.32
Self-rate oral health as High − 0.29 0.46 − 0.52 − 0.07
Oral health knowledge
Low scores on oral health knowledge Base category
High scores on oral health knowledge − 0.20 0.46 − 0.85 0.45

Page 9 of 13Qin et al. BMC Oral Health (2021) 21:564
Table 6 (continued)
Variable β P value 95% CI
Oral health attitude
Low scores on oral health attitude Base category
High scores on oral health attitude 0.25 0.10 − 0.09 0.60
Chronic disease
No Base category
Yes 0.31 0.10 − 0.06 0.67
Log household income 0.04 0.04 − 0.28 0.35
Table 7 Concentration index and decomposition analyses for the number of FTs
The significant for Concentration index was set at 0.05, *P < 0.05, **P < 0.01, ***P < 0.001
Concentration index 0.24*** 100.0%
Projected concentration index 0.26 110.9%
Residual term − 0.03 − 10.9%
Variable Contributions Percentage contribution
Concentration index Elasticises
Gender 0.00 0.1% 0.00 0.17
Type of household 0.02 7.4% − 0.06 − 0.31
Age 0.00 − 1.1% 0.01 − 0.42
Education overall 0.01 2.2% – –
Low education level Base Base – –
Medium education level − 0.02 − 10.2% − 0.08 0.31
High education level 0.03 12.4% 0.29 0.10
Consumption of desserts 0.00 1.2% 0.13 0.02
Consumption of sugared beverages − 0.01 − 2.4% 0.13 − 0.05
Last time dental attendance overall 0.23 96.8% – –
Never visited dentist Base Base – –
Visited dentist 1 year ago 0.06 24.9% 0.04 1.55
Visited dentist 6–12 months ago 0.07 28.7% 0.14 0.48
Visited dentist within last 6 months 0.10 43.2% 0.22 0.48
Toothpick use 0.02 9.4% 0.04 0.62
Flossing 0.01 3.5% 0.27 0.03
Reimbursement for dental treatment 0.00 − 0.8% 0.50 0.00
Urban employee basic medical insurance system − 0.09 − 39.6% 0.40 − 0.23
Urban resident medical insurance system 0.00 − 0.5% 0.01 − 0.12
The new-type rural medical collaboration system 0.08 34.5% − 0.20 − 0.42
Self-rated oral health overall − 0.01 − 2.1% – –
Self-rate oral health as low Base Base – –
Self-rate oral health as medium 0.00 0.0% 0.07 0.00
Self-rate oral health as high − 0.01 − 2.1% 0.06 − 0.08
High scores of oral health knowledge − 0.02 − 6.5% 0.30 − 0.05
High scores of oral health attitude 0.00 0.7% 0.01 0.24
Chronic disease 0.01 3.0% 0.07 0.11
Log household income 0.01 5.1% 0.45 0.03
Page 10 of 13Qin et al. BMC Oral Health (2021) 21:564
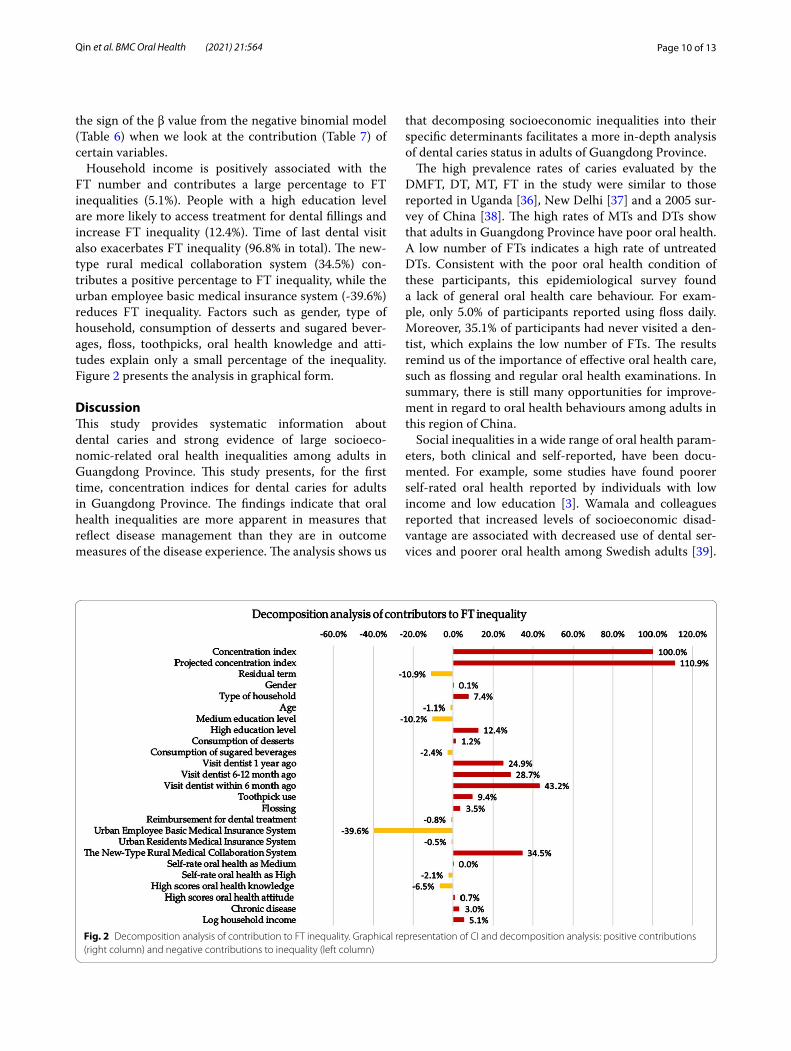
the sign of the β value from the negative binomial model (Table 6) when we look at the contribution (Table 7) of certain variables.
Household income is positively associated with the FT number and contributes a large percentage to FT inequalities (5.1%). People with a high education level are more likely to access treatment for dental fillings and increase FT inequality (12.4%). Time of last dental visit also exacerbates FT inequality (96.8% in total). The new-type rural medical collaboration system (34.5%) con-tributes a positive percentage to FT inequality, while the urban employee basic medical insurance system (-39.6%) reduces FT inequality. Factors such as gender, type of household, consumption of desserts and sugared bever-ages, floss, toothpicks, oral health knowledge and atti-tudes explain only a small percentage of the inequality. Figure 2 presents the analysis in graphical form.
DiscussionThis study provides systematic information about dental caries and strong evidence of large socioeco-nomic-related oral health inequalities among adults in Guangdong Province. This study presents, for the first time, concentration indices for dental caries for adults in Guangdong Province. The findings indicate that oral health inequalities are more apparent in measures that reflect disease management than they are in outcome measures of the disease experience. The analysis shows us
that decomposing socioeconomic inequalities into their specific determinants facilitates a more in-depth analysis of dental caries status in adults of Guangdong Province.
The high prevalence rates of caries evaluated by the DMFT, DT, MT, FT in the study were similar to those reported in Uganda [36], New Delhi [37] and a 2005 sur-vey of China [38]. The high rates of MTs and DTs show that adults in Guangdong Province have poor oral health. A low number of FTs indicates a high rate of untreated DTs. Consistent with the poor oral health condition of these participants, this epidemiological survey found a lack of general oral health care behaviour. For exam-ple, only 5.0% of participants reported using floss daily. Moreover, 35.1% of participants had never visited a den-tist, which explains the low number of FTs. The results remind us of the importance of effective oral health care, such as flossing and regular oral health examinations. In summary, there is still many opportunities for improve-ment in regard to oral health behaviours among adults in this region of China.
Social inequalities in a wide range of oral health param-eters, both clinical and self-reported, have been docu-mented. For example, some studies have found poorer self-rated oral health reported by individuals with low income and low education [3]. Wamala and colleagues reported that increased levels of socioeconomic disad-vantage are associated with decreased use of dental ser-vices and poorer oral health among Swedish adults [39].
Fig. 2 Decomposition analysis of contribution to FT inequality. Graphical representation of CI and decomposition analysis: positive contributions (right column) and negative contributions to inequality (left column)

Page 11 of 13Qin et al. BMC Oral Health (2021) 21:564
Household income and educational level are significantly associated with periodontitis and edentate status in elderly people [40, 41]. Our findings support the stand-point of the previous study. The CI of FTs was particu-larly prominent compared with those of the DMFT, DT and MT, which indicated greater inequalities in dental caries treatment than in caries experience in Guang-dong Province. The lower social status did not necessar-ily translate into higher disease experience (i.e., DMFT); however, it was associated with the nature of dental treat-ment reported to have been received in the past year. The low rates of dental visits among the study participants may explain the phenomenon. Therefore, determining specific determinants leading to dental treatment ine-qualities and providing greater access to dental care for lower-income populations is necessary.
Factors such as household income and high education level increase inequalities and play a large role in explain-ing inequalities in the number of FTs among adults in Guangdong Province. This finding was similar to that of a previous study that reported social gradients with respect to untreated dental disease in both children and adults [7]. It is interesting to note that compared with a low education level, a high education level increases the ine-quality of FTs, while a medium education level reduces the inequality. Further analysis shows that this is because the concentration index of the medium education level tends to be concentrated in low-income groups (con-centration index = − 0.08), and the low-income groups with medium education likely obtain more dental fillings. This finding indicates that universal basic compulsory education seems to promote equality in regard to dental caries filling. Education level is a predictor of health out-comes and influences individual and social levels [42]. It is possible that adults with basic compulsory education or higher education levels have greater awareness of self-health, access to resources, and understanding of how to navigate the health care system [43]. The analysis reports associations at one point in time; however, the issues of access, use, and treatment are repeated in the life course, leading to inequalities in oral health outcomes later in life. Therefore, the inequality of oral health resources is an urgent problem to be addressed. This finding reminds us of the importance of improving the overall national economy and education level to enable low-income groups to obtain more and accessible oral health care resources.
To reconstruct the public medical insurance system and widen insurance coverage to universal coverage, the Chinese government developed the following medical safeguard systems for its citizens: the urban employee basic medical insurance for the urban employed, which was initiated in 1998; the new-type rural collaboration
medical system for rural residents, which was established in 2003; and the urban resident basic medical insurance, which was piloted in 2007 and covers urban residents without formal employment [44]. Additionally, China achieved universal health coverage for over 95% of its population in 2011 with benefits that include prevention and comprehensive treatment services [45]. In this study, the new-type rural medical collaboration system contrib-uted a positive percentage to FT inequality. The results indicated that people in the new-type rural medical col-laboration system (low-income group) were not eligible to access necessary oral treatment, which widened the FT gap between people with or without the new-type rural medical collaboration system. Urban employee basic medical insurance contributed a negative percentage to FT inequality. Thus, it seemed that urban employee basic medical insurance was a measure to reduce inequality. However, further analysis found that urban employee basic medical insurance was negatively associated with the number of FTs, which means that it reduced inequal-ity because people with that insurance (high-income group) are also less likely to access dental care treatment. The findings indicated that, at present, all medical safe-guard systems in China fail to encourage people to use medical resources and reduce income-based disparities in oral health. A previous study [46] also reported that oral health care in China is delivered by a large govern-ment-controlled public sector, with over 85% of the total expenses covered by patients’ out-of-pocket payments. In recent years, the numbers of dentists and oral health service providers have increased, although oral health services are not being utilized efficiently [47]. The study indicated that the Chinese health care insurance system is intended to improve access to affordable health care for all and to alleviate inequalities in access to care that exist among rural residents and low-income households.
The current study had several limitations. First, oral health outcomes and relevant inequalities are caused by multiple factors. However, the current study discussed only some of these factors. Second, reporting bias existed in questionnaires because of the different levels of com-prehension among participants. Therefore, our results should be interpreted considering these limitations.
The strengths of the current study are as follows. First, the analyses distinguished between the occurrence and the management of dental caries, and it found that den-tal caries inequality centres on FTs. Second, the study used the concentration index and decomposition analy-sis to establish the determining factors associated with the inequality of FTs. Finally, given the national debates about dental caries inequality, these results can provide a basis for discussion about measures to reduce oral health inequalities. Future research about reducing oral health

Page 12 of 13Qin et al. BMC Oral Health (2021) 21:564
inequality should focus on how to implement appropri-ate, targeted education programs directed at all socio-economic groups, regardless of wealth and education. Meanwhile, health care reform should aim to improve access to affordable health care for all residents, espe-cially rural residents and low-income households.
ConclusionsThe study findings indicate that oral health inequalities may centre on dental disease management as opposed to dental disease experience and that a lower social posi-tion may not necessarily translate into a higher disease experience.
The results of the decomposition analysis of FT ine-quality indicated that among the studied factors, house-hold income, education level, and regular oral health examinations have the greatest contribution to the ine-qualities in the number of FTs. More importantly, the current medical insurance systems are not being effec-tively used in oral treatment. Therefore, health care reform should focus on enhancing subsidies for the lower-income groups to improve the treatment rates and narrow the inequality of oral health. These conclusions may be very useful in policy-making and in the imple-mentation of interventions for tackling socioeconomic inequality in the number of FTs.
AbbreviationsCC: Concentration curve; CI: Concentration index; 95% CI: 95% Confi-dence interval; SE: Standard error; DMFT: Decayed, missing and filled teeth; DT: Decayed teeth; MT: Missing teeth; FT: Filled teeth.
AcknowledgementsThe authors would like to thank all the participants and all the staff who assisted in the survey.
Authors’ contributionsQYD: Conception and design of the work, performing a computerized litera-ture search, analysis and interpretation of data. QYD, CL, and HSH: Drafting the article or revising it critically for important intellectual content. QYD, CL, LJB, WYY, and HSH: Agreement to be accountable for all aspects of the work. QYD and HSH: Conception and design of the work. CL, LJB, and WYY: Collection of the data. WYY: Providing assistance with data analysis. All authors have made substantive contributions to this study and/or manuscript, and all have reviewed the final paper prior to its submission. All authors read and approved the final manuscript.
FundingThis research was funded by The Clinical Research Start-up Program of Southern Medical University by High-level University Construction Funding of Guangdong Provincial Department of Education, grant number LC2017PY001 and CSA Research Fund on Innovations in Oral Health Education, grant num-ber CSA-OHE2021-04.
Availability of data and materialsThe datasets used and analysed during the current study are available from the corresponding author upon reasonable request.
Declarations
Ethics approval and consent to participateThis study was approved by the Stomatological Ethics Committee of the Chinese Stomatological Association on July 9, 2014 (Approval No.: 2014-003). All procedures performed in the study involving human participants were in accordance with the Helsinki declaration. Informed consent was obtained from all the participants and from legal guardians of illiterate participants.
Consent for publicationNot applicable.
Competing interestsThe authors declare that they have no competing interests.
Author details1 Stomatological Hospital, Southern Medical University, No. 366, South of Jiangnan Avenue, Guangzhou, China. 2 Chongqing Center for Disease Control and Prevention, The Second Changjiang Road No. 8, Chongqing 400042, China.
Received: 5 April 2021 Accepted: 25 October 2021
References 1. Lee JY, Divaris K. The ethical imperative of addressing oral health dispari-
ties: a unifying framework. J Dent Res. 2014;93(3):224–30. 2. Marmot M. Social determinants of health inequalities. Lancet (London,
England). 2005;365(9464):1099–104. 3. Sabbah W, Tsakos G, Chandola T, Sheiham A, Watt RG. Social gradients in
oral and general health. J Dent Res. 2007;86(10):992–6. 4. Watt RG, Heilmann A, Listl S, Peres MA. London charter on oral health
inequalities. J Dent Res. 2016;95(3):245–7. 5. Qin Y, Zhang R, Yuan B, Xu T, Chen H, Yang Y, Hu T. Structural equation
modelling for associated factors with dental caries among 3-5-year-old children: a cross-sectional study. BMC Oral Health. 2019;19(1):102.
6. Borrell LN, Crawford ND. Social disparities in periodontitis among United States adults 1999–2004. Commun Dent Oral Epidemiol. 2008;36(5):383–91.
7. Watt R, Sheiham A. Inequalities in oral health: a review of the evidence and recommendations for action. Br Dent J. 1999;187(1):6–12.
8. Braveman P. Health disparities and health equity: concepts and measure-ment. Annu Rev Public Health. 2006;27:167–94.
9. Gao Y. Humanities: analysis and suggestions on the factors of income gap. Pearl River. 2019;5(2):65.
10. Hobdell MH, Oliveira ER, Bautista R, Myburgh NG, Lalloo R, Narendran S, Johnson NW. Oral diseases and socio-economic status (SES). Br Dental J. 2003;194(2):91–6.
11. Lalloo R, Myburgh NG, Hobdell MH. Dental caries, socio-economic devel-opment and national oral health policies. Int Dent J. 1999;49(4):196–202.
12. Steele J, Shen J, Tsakos G, Fuller E, Morris S, Watt R, Guarnizo-Herreño C, Wildman J. The Interplay between socioeconomic inequalities and clini-cal oral health. J Dent Res. 2015;94(1):19–26.
13. Chinzorig T, Aida J, Cooray U, Nyamdorj T, Mashbaljir S, Osaka K, Garid-khuu A. Inequalities in caries experience among Mongolian children. Int J Environ Res Public Health. 2019;16(20):3892.
14. Xu M, Gao X, Wu H, Ding M, Zhang C, Du S, Wang X, Feng X, Tai B, Hu D, et al. Measuring and decomposing socioeconomic-related inequality in the use of oral health services among Chinese adults. Commun Dent Oral Epidemiol. 2021;49(1):47–54.
15. Ishii T, Yoshida S. Oral health surveys–basic methods–fundamental and practical problems of oral health surveys by WHO. Shikai Tenbo. 1978;51(4):762–72.
16. Lahelma E, Martikainen P, Laaksonen M, Aittomäki A. Pathways between socioeconomic determinants of health. J Epidemiol Community Health. 2004;58(4):327–32.

Page 13 of 13Qin et al. BMC Oral Health (2021) 21:564
• fast, convenient online submission
•
thorough peer review by experienced researchers in your field
• rapid publication on acceptance
• support for research data, including large and complex data types
•
gold Open Access which fosters wider collaboration and increased citations
maximum visibility for your research: over 100M website views per year •
At BMC, research is always in progress.
Learn more biomedcentral.com/submissions
Ready to submit your researchReady to submit your research ? Choose BMC and benefit from: ? Choose BMC and benefit from:
17. O’Donnell O, Doorslaer EV, Wagstaff A, Lindelow MJWB. Analyzing health equity using household survey data. Minor Health Health Equity Archive. 2008;86(10):816–816.
18. Lai H, Su CW, Yen AM, Chiu SY, Fann JC, Wu WY, Chuang SL, Liu HC, Chen HH, Chen LS. A prediction model for periodontal disease: modelling and validation from a National Survey of 4061 Taiwanese adults. J Clin Peri-odontol. 2015;42(5):413–21.
19. Groves RM, Fowler FJ Jr, Couper MP, Lepkowski JM, Singer E, Tourangeau R. Survey methodology. 2nd ed. New York: Wiley; 2011.
20. Yao OU, Huang SH, Fan W. Treatment: root caries in an adult guangdong cohort—a sampled investigation. 2007.
21. Wang L, Cheng L, Yuan B, Hong X, Hu T. Association between socio-economic status and dental caries in elderly people in Sichuan Province, China: a cross-sectional study. BMJ Open. 2017;7(9):e016557.
22. Lu HX, Tao DY, Lo ECM, Li R, Wang X, Tai BJ, Hu Y, Lin HC, Wang B, Si Y, et al. The 4th National Oral Health Survey in the Mainland of China: background and methodology. Chin J Dental Research Off J Sci Sect Chin Stomatol Assoc (CSA). 2018;21(3):161–5.
23. Zhu L, Petersen PE, Wang HY, Bian JY, Zhang BX. Oral health knowledge, attitudes and behaviour of adults in China. Int Dent J. 2005;55(4):231–41.
24. WHO. Oral health surveys: basic methods. Geneva: WHO; 2013. 25. Preisser JS, Stamm JW, Long DL, Kincade ME. Review and recommenda-
tions for zero-inflated count regression modeling of dental caries indices in epidemiological studies. Caries Res. 2012;46(4):413–23.
26. Tsakos G, Sabbah W, Chandola T, Newton T, Kawachi I, Aida J, Sheiham A, Marmot MG, Watt RG. Social relationships and oral health among adults aged 60 years or older. Psychosom Med. 2013;75(2):178–86.
27. Wu B, Hybels C, Liang J, Landerman L, Plassman B. Social stratification and tooth loss among middle-aged and older Americans from 1988 to 2004. Commun Dent Oral Epidemiol. 2014;42(6):495–502.
28. van Doorslaer E, Koolman X, Jones AM. Explaining income-related ine-qualities in doctor utilisation in Europe. Health Econ. 2004;13(7):629–47.
29. Wagstaff A, Paci P, van Doorslaer E. On the measurement of inequalities in health. Soc Sci Med (1982). 1991;33(5):545–57.
30. Wagstaff A, Van Doorslaer E, Watanabe N. On decomposing the causes of health sector inequalities with an application to malnutrition inequalities in Vietnam. J Econom. 2003;112(1):207–23.
31. Listl S. Inequalities in dental attendance throughout the life-course. J Dent Res. 2012;91(7 Suppl):91s–7s.
32. van Doorslaer E, Koolman X. Explaining the differences in income-related health inequalities across European countries. Health Econ. 2004;13(7):609–28.
33. Doorslaer W. Socioeconomic inequalities in health: measurement, com-putation, and statistical inference. 1997.
34. Lindén A, Mäntyniemi S. Using the negative binomial distribu-tion to model overdispersion in ecological count data. Ecology. 2011;92(7):1414–21.
35. Preisser JS, Das K, Long DL, Divaris K. Marginalized zero-inflated nega-tive binomial regression with application to dental caries. Stat Med. 2016;35(10):1722–35.
36. Kutesa A, Kasangaki A, Nkamba M, Muwazi L, Okullo I, Rwenyonyi CM. Prevalence and factors associated with dental caries among children and adults in selected districts in Uganda. Afr Health Sci. 2015;15(4):1302–7.
37. Patro BK, Ravi Kumar B, Goswami A, Mathur VP, Nongkynrih B. Prevalence of dental caries among adults and elderly in an urban resettlement colony of New Delhi. Indian J Dental Res Off Publ Indian Soc Dental Res. 2008;19(2):95–8.
38. Cao CF. Prevalences of periodontal diseases and dental caries in China: re-analysis of the data from the Third National Epidemiological Survey on Oral Health. Chin J Stomat. 2013;48(5):257–9.
39. Wamala S, Merlo J, Boström G. Inequity in access to dental care services explains current socioeconomic disparities in oral health: the Swedish National Surveys of Public Health 2004–2005. J Epidemiol Community Health. 2006;60(12):1027–33.
40. Han DH, Khang YH, Choi HJ. Association of parental education with tooth loss among Korean Elders. Commun Dent Oral Epidemiol. 2015;43(6):489–99.
41. Kim DW, Park JC, Rim TT, Jung UW, Kim CS, Donos N, Cha IH, Choi SH. Socioeconomic disparities of periodontitis in Koreans based on the KNHANES IV. Oral Dis. 2014;20(6):551–9.
42. Zimmerman EB WS, Haley A. Understanding the relationship between education and health: a review of the evidence and an examination of community perspectives. Agency for Healthcare Research and Quality. Agency for Healthcare Research and Quality 2015.
43. Gupta N, Vujicic M, Yarbrough C, Harrison B. Disparities in untreated caries among children and adults in the US, 2011–2014. BMC Oral Health. 2018;18(1):30.
44. Jing L, Chen R, Jing L, Qiao Y, Lou J, Xu J, Wang J, Chen W, Sun X. Develop-ment and enrolee satisfaction with basic medical insurance in China: a systematic review and stratified cluster sampling survey. Int J Health Plann Manage. 2017;32(3):285–98.
45. Shan L, Zhao M, Ning N, Hao Y, Li Y, Liang L, Kang Z, Sun H, Ding D, Liu B, et al. Dissatisfaction with current integration reforms of health insurance schemes in China: are they a success and what matters? Health Policy Plan. 2018;33(3):345–54.
46. Kailembo A, Preet R, Stewart Williams J. Socioeconomic inequality in self-reported unmet need for oral health services in adults aged 50 years and over in China, Ghana, and India. Int J Equity Health. 2018;17(1):99.
47. Hu DY, Hong X, Li X. Oral health in China–trends and challenges. Int J Oral Sci. 2011;3(1):7–12.
Publisher’s NoteSpringer Nature remains neutral with regard to jurisdictional claims in pub-lished maps and institutional affiliations.