Greater Cambridge Greater Peterborough Economic Assessment Data Atlas Intro
8
Greater Cambridge Greater Peterborough Economic Assessment Data Atlas User guide www.cambridgeshireinsight uk
-
Upload
cambridgeshireinsight -
Category
Economy & Finance
-
view
699 -
download
2
Transcript of Greater Cambridge Greater Peterborough Economic Assessment Data Atlas Intro
Greater Cambridge Greater Peterborough Economic Assessment Data Atlas
User guide
www.cambridgeshireinsight.org.uk
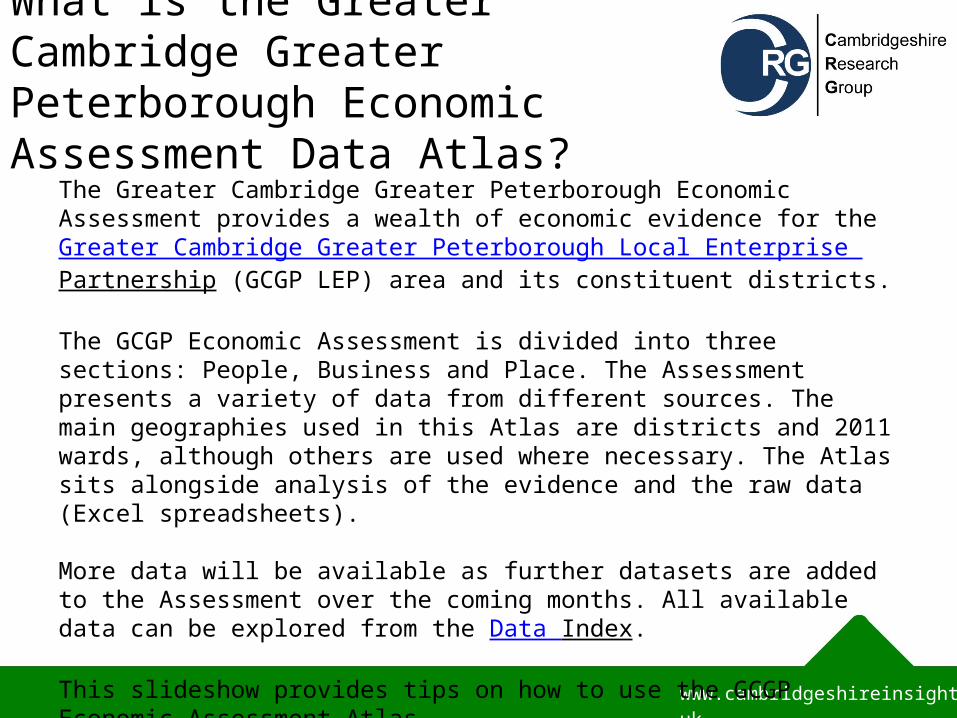
What is the Greater Cambridge Greater Peterborough Economic Assessment Data Atlas?
www.cambridgeshireinsight.org.uk
The Greater Cambridge Greater Peterborough Economic Assessment provides a wealth of economic evidence for the Greater Cambridge Greater Peterborough Local Enterprise Partnership (GCGP LEP) area and its constituent districts.
The GCGP Economic Assessment is divided into three sections: People, Business and Place. The Assessment presents a variety of data from different sources. The main geographies used in this Atlas are districts and 2011 wards, although others are used where necessary. The Atlas sits alongside analysis of the evidence and the raw data (Excel spreadsheets).
More data will be available as further datasets are added to the Assessment over the coming months. All available data can be explored from the Data Index.
This slideshow provides tips on how to use the GCGP Economic Assessment Atlas.
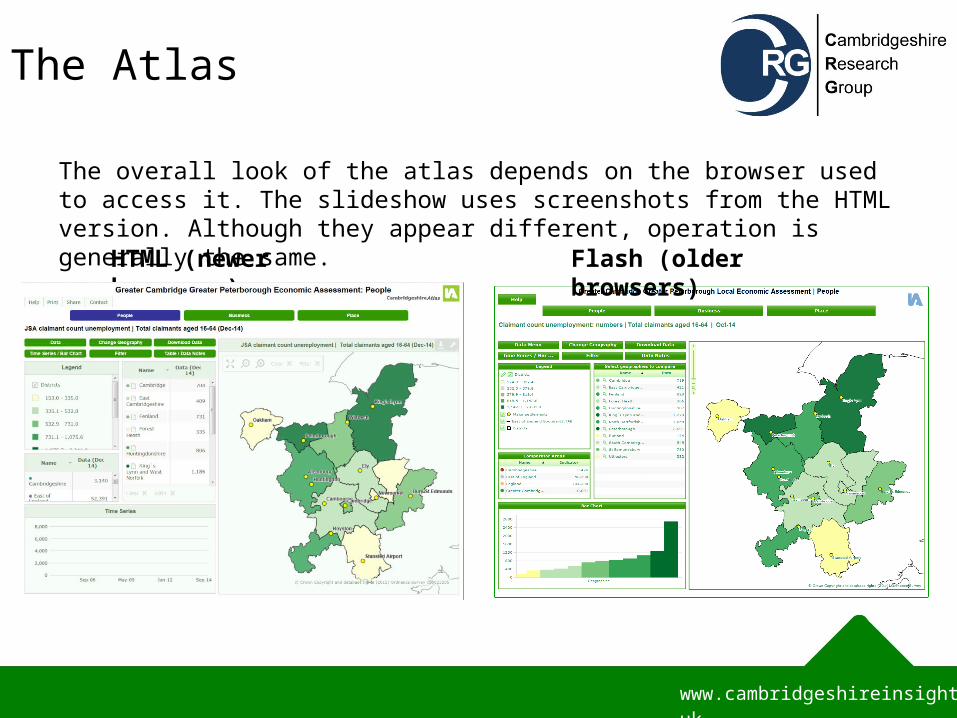
The Atlas
www.cambridgeshireinsight.org.uk
The overall look of the atlas depends on the browser used to access it. The slideshow uses screenshots from the HTML version. Although they appear different, operation is generally the same.
HTML (newer browsers) Flash (older browsers)
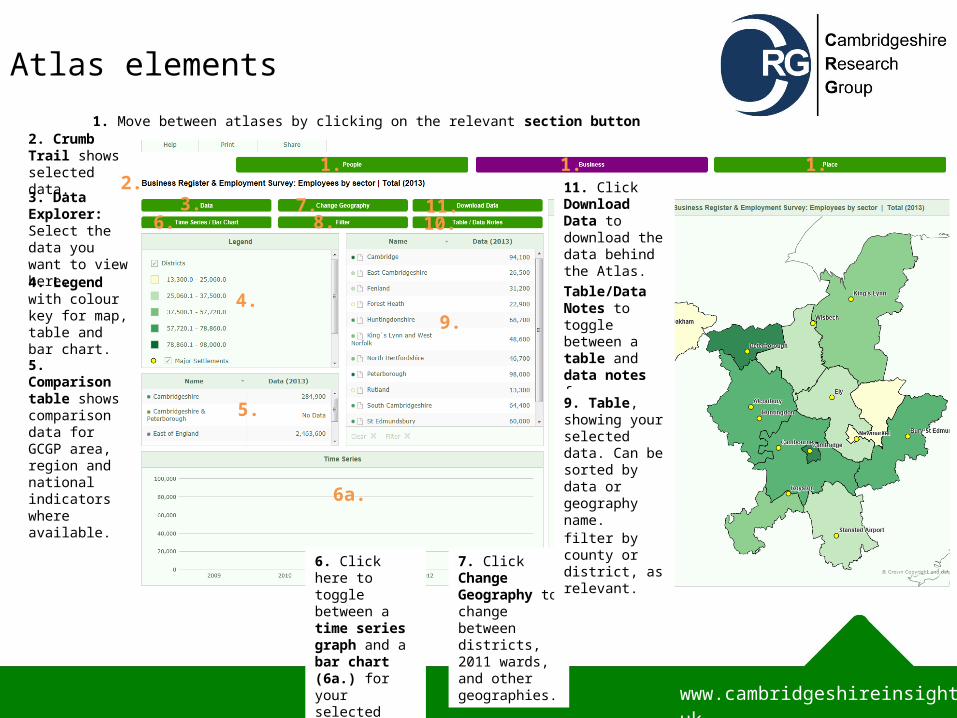
Atlas elements
www.cambridgeshireinsight.org.uk
1. Move between atlases by clicking on the relevant section button
6. Click here to toggle between a time series graph and a bar chart (6a.) for your selected data.
2. Crumb Trail shows selected data.
3. Data Explorer: Select the data you want to view here.
4. Legend with colour key for map, table and bar chart.
5. Comparison table shows comparison data for GCGP area, region and national indicators where available.
10. Click Table/Data Notes to toggle between a table and data notes for your selected data.
11. Click Download Data to download the data behind the Atlas.
7. Click Change Geography to change between districts, 2011 wards, and other geographies.
8. Click Filter to filter by county or district, as relevant.
9. Table, showing your selected data. Can be sorted by data or geography name.
1. 1. 1.2.
3.
4.
5.
6.
6a.
7.8.
9.
10.11.
Atlas elements - example
www.cambridgeshireinsight.org.uk
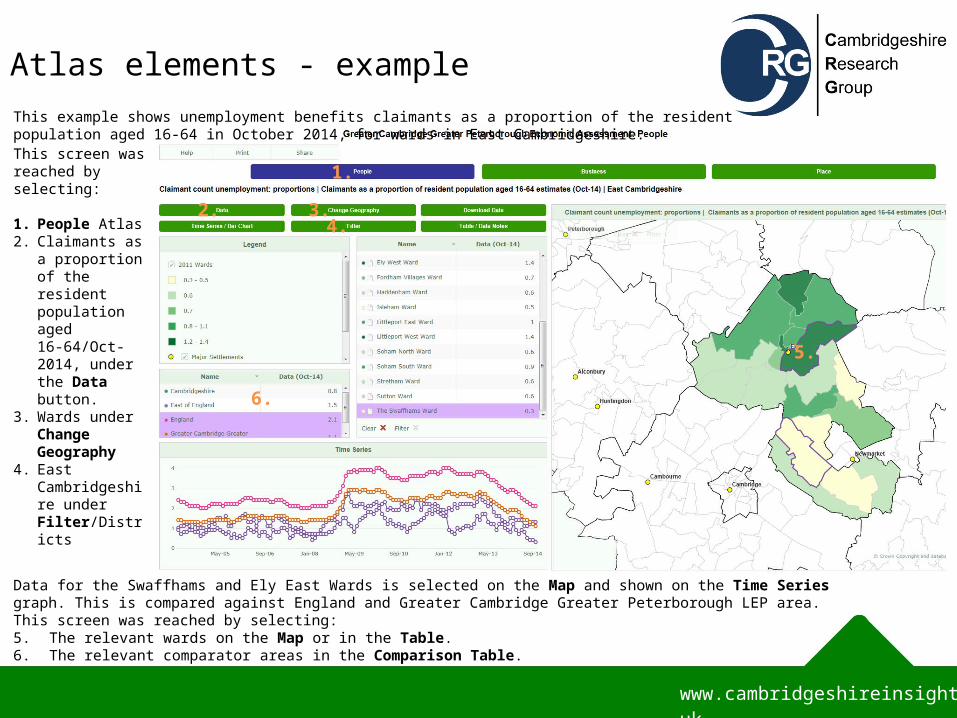
This example shows unemployment benefits claimants as a proportion of the resident population aged 16-64 in October 2014, for wards in East Cambridgeshire.This screen was reached by selecting: 1. People Atlas2. Claimants as a
proportion of the resident population aged 16-64/Oct-2014, under the Data button.
3. Wards under Change Geography
4. East Cambridgeshire under Filter/Districts
Data for the Swaffhams and Ely East Wards is selected on the Map and shown on the Time Series graph. This is compared against England and Greater Cambridge Greater Peterborough LEP area.This screen was reached by selecting:5. The relevant wards on the Map or in the Table.6. The relevant comparator areas in the Comparison Table.
1.
2. 3.4.
5.
6.
Download and resize elements
www.cambridgeshireinsight.org.uk
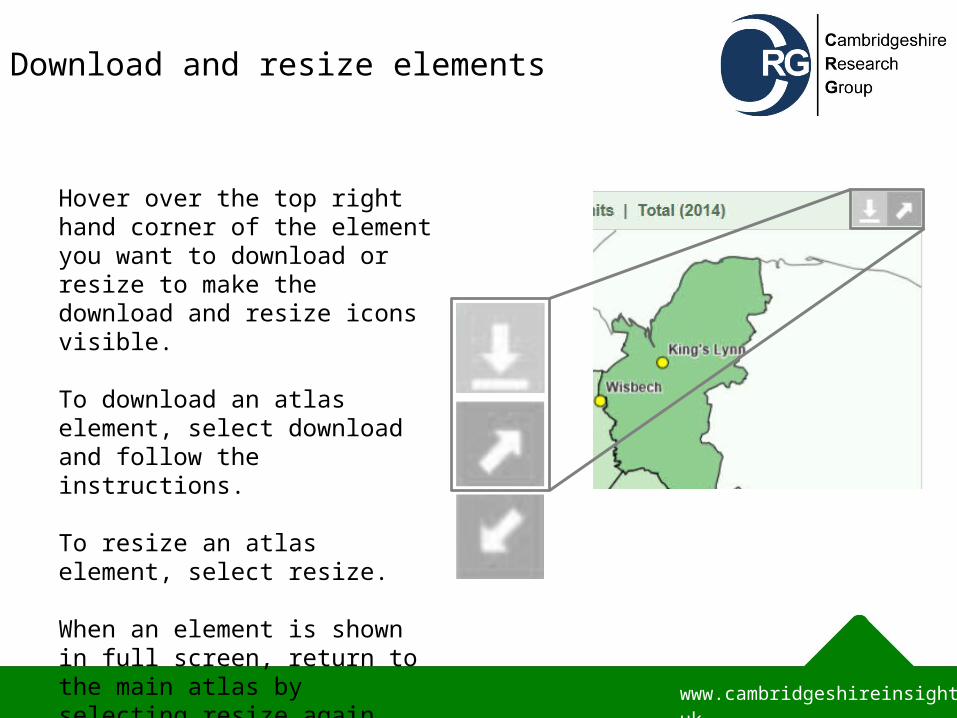
Hover over the top right hand corner of the element you want to download or resize to make the download and resize icons visible.
To download an atlas element, select download and follow the instructions.
To resize an atlas element, select resize.
When an element is shown in full screen, return to the main atlas by selecting resize again.
Interactive features in the legend
www.cambridgeshireinsight.org.uk
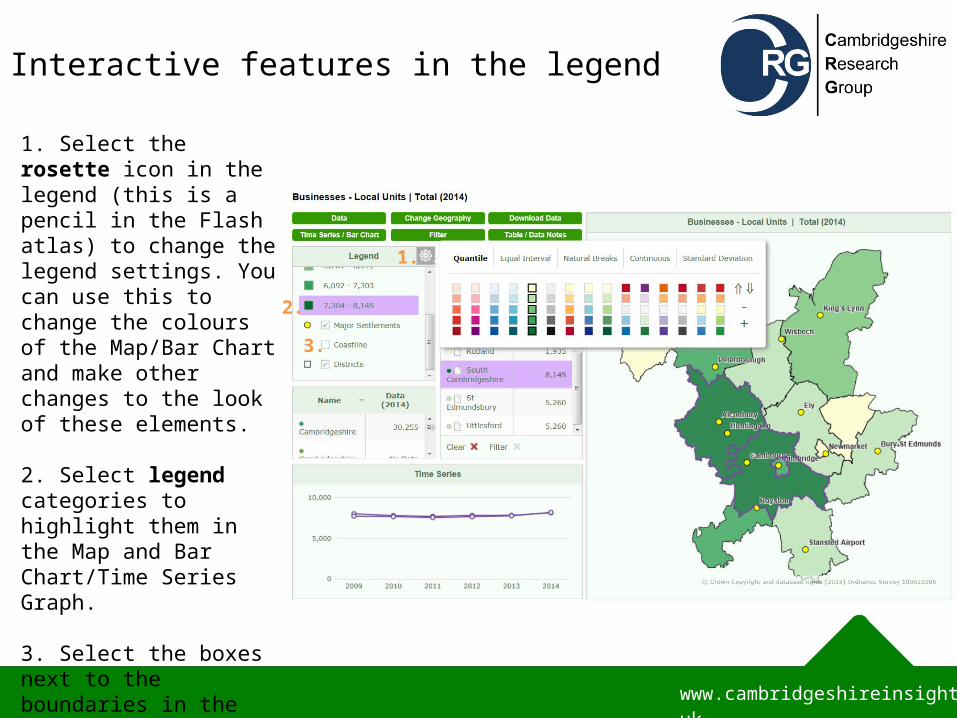
1. Select the rosette icon in the legend (this is a pencil in the Flash atlas) to change the legend settings. You can use this to change the colours of the Map/Bar Chart and make other changes to the look of these elements.
2. Select legend categories to highlight them in the Map and Bar Chart/Time Series Graph.
3. Select the boxes next to the boundaries in the legend to make the boundaries invisible.
1.
2.
3.
www.cambridgeshireinsight.org.uk
www.cambridgeshireinsight.org.uk
01223 715300
@CambsInsight
pinterest.com/cambsinsight
Cambridgeshire Insight
Cambridgeshire Insight | Informing Cambridgeshire
E:
T:
W: