Gravitational redshifts, and other wavelength shifts … · Gravitational redshifts, and other...
48
Gravitational redshifts, and other wavelength shifts in stellar spectra Dainis Dravins – Lund Observatory www.astro.lu.se/~dainis KVA ESO Santiago, February 2012
Transcript of Gravitational redshifts, and other wavelength shifts … · Gravitational redshifts, and other...
Gravitational redshifts, and other wavelength shifts in stellar spectra
Dainis Dravins – Lund Observatory
www.astro.lu.se/~dainis
KVA
ESO Santiago, February 2012

Exactly 100 years ago

A.Einstein, Annalen der Physik 340, 848 (1911)
Predicted effects by gravity on light

Historical perspectives
Predicting gravitational redshift
Unsuccessful searches
Experimental confirmations
Effects in “normal” stars?
Other wavelength shifts
Shifts across stellar disks

Already long before Einstein…

John Mitchell (1784)
Predicting gravitational effects on light

Predicting gravitational effects on light
Pierre-Simon Laplace (1796)

Verifying Einstein ?

Klaus Hentschel: Erwin Finlay Freundlich and Testing Einstein’s Theory of Relativity, Archive for History of Exact Sciences 47, 243 (1994)
Freundlich’s attempts to verify relativity theory (I)
Erwin Finlay Freundlich (1885-1964) worked to experimentally verify the predictions from Einstein’s theory of relativity and the effects of gravity on light.

Freundlich’s attempts to verify relativity theory (II)
Klaus Hentschel: Erwin Finlay Freundlich and Testing Einstein’s Theory of Relativity, Archive for History of Exact Sciences 47, 243 (1994)
Einsteinturm, Potsdam-Telegrafenberg

Nature 306, 727 (1983)
Unethical falsifications in astronomy ?

QJRAS 26, 279 (1985)
Controversial interpretations of history

Actual gravitational redshift in white dwarfs

Stellar spectroscopy

Expected gravitational redshifts
D. Dravins
IAU Symp. 210

L.Lindegren & D.Dravins: The fundamental definition of “radial velocity, A&A 401, 1185
Mechanisms causing wavelength shifts
The process includes: motion of the object; its emission of an electromagnetic signal; its propagation through space; motion of the observer; and the reception of the signal.

Radial velocities without spectroscopy

Astrometric radial velocities I
Dravins, Lindegren & Madsen, A&A 348, 1040

Astrometric radial velocities II
Dravins, Lindegren & Madsen, A&A 348, 1040

Astrometric radial
velocities from
perspective acceleration
Dravins, Lindegren & Madsen, A&A
348, 1040

Astrometric radial velocities III
Dravins, Lindegren & Madsen, A&A 348, 1040

Pleiades from Hipparcos Proper motions over 120,000 years

Hyades lineshifts Madsen, Dravins & Lindegren, A&A 381, 446

Differential velocities within open clusters

Dean Jacobsen, astrophoto.net
M 67

L.Pasquini, C.Melo, C.Chavero, D.Dravins, H.-G.Ludwig, P.Bonifacio, R.De La Reza:
Gravitational redshifts in main-sequence and giant stars, A&A 526, A127 (2011)
Searching for gravitational redshifts in M67
M67 (NGC 2682) open cluster in Cancer contains some 500 stars;
age about 2.6 Gy, distance 850 pc.
M67 color–magnitude diagram with well-developed giant branch.
Filled squares denote single stars.
Dean Jacobsen, astrophoto.net

Searching for gravitational redshifts in M67
Radial velocities in M67 with a superposed Gaussian centered on
Vr = 33.73, σ = 0.83 km s−1
Radial velocities in M67: No difference seen between giants (red)
and dwarfs (dashed)
L.Pasquini, C.Melo, C.Chavero, D.Dravins, H.-G.Ludwig, P.Bonifacio, R.De La Reza:
Gravitational redshifts in main-sequence and giant stars, A&A 526, A127 (2011)

Real line formation
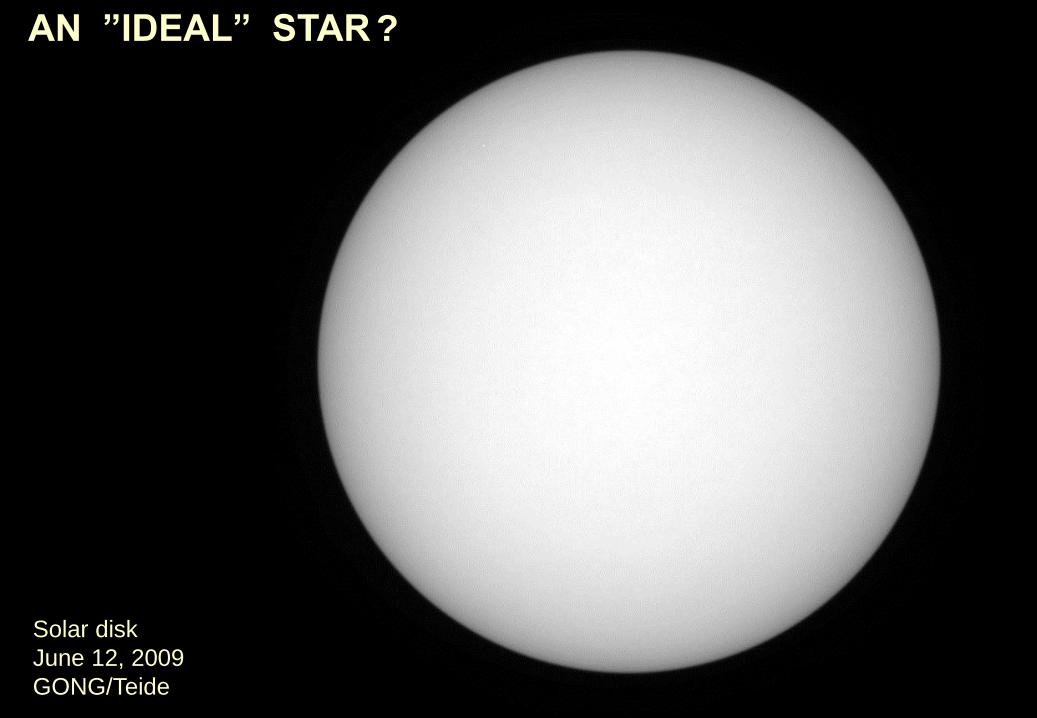
Solar disk
June 12, 2009
GONG/Teide
AN ”IDEAL” STAR ?

Solar Optical Telescope on board HINODE (Solar-B) G-band (430nm) & Ca II H (397nm) movies

Spectral scan
across the solar surface.
Left: H-alpha line
Right: Slit-jaw image
Big Bear Solar Observatory

“Wiggly” spectral lines
of stellar granulation
(modeled)
Disk-center Fe I profiles from 3-D hydrodynamic model of the metal-poor star HD 140283 in NLTE and LTE.
Top: Synthetic “wiggly-line” spectra across stellar surface. Curves show equivalent widths W along the slit.
Bottom: Spatially resolved profiles; average is red-dotted.
N.G.Shchukina, J.Trujillo Bueno, M.Asplund, Astrophys.J. 618, 939 (2005)

Cool-star granulation causes convective lineshifts on order
300 m/s

STELLAR CONVECTION – White dwarf vs. Red giant
Snapshots of emergent intensity during granular evolution on a 12,000 K white dwarf (left) and a 3,800 K red giant. Horizontal areas differ by dozen orders of magnitude: 7x7 km2
for the white dwarf, and 23x23 RSun2 for the giant. (H.-G. Ludwig)

Bisectors of the same
spectral line in different
stars Adapted from
Dravins & Nordlund, A&A 228, 203
From left:
Procyon (F5 IV-V),
Beta Hyi (G2 IV),
Alpha Cen A (G2 V),
Alpha Cen B (K1 V).
Velocity [m/s]
In stars with “corrugated”
surfaces, convective blueshifts increase
towards the stellar limb
F5
G2 I
V
G2 V
K1

L.Pasquini, C.Melo, C.Chavero, D.Dravins, H.-G.Ludwig, P.Bonifacio, R.De La Reza:
Gravitational redshifts in main-sequence and giant stars, A&A 526, A127 (2011)
Searching for gravitational redshifts in M67
Gravitational redshift predictions vs. mass/radius ratio (M/R) (dashed red)
do not agree with observations.
Calculated convective wavelength shifts for Fe I lines in dwarf (red crosses)
and giant models (squares).
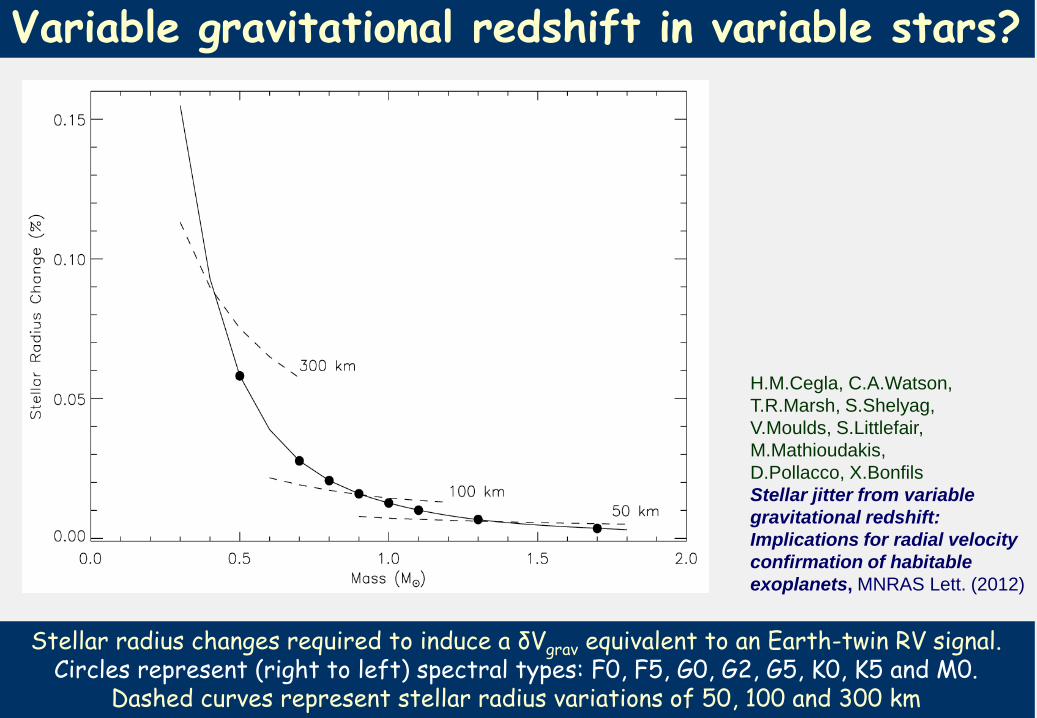
H.M.Cegla, C.A.Watson,
T.R.Marsh, S.Shelyag,
V.Moulds, S.Littlefair,
M.Mathioudakis,
D.Pollacco, X.Bonfils
Stellar jitter from variable
gravitational redshift:
Implications for radial velocity
confirmation of habitable
exoplanets, MNRAS Lett. (2012)
Variable gravitational redshift in variable stars?
Stellar radius changes required to induce a δVgrav equivalent to an Earth-twin RV signal. Circles represent (right to left) spectral types: F0, F5, G0, G2, G5, K0, K5 and M0.
Dashed curves represent stellar radius variations of 50, 100 and 300 km

Spatially resolved spectroscopy across
stellar surfaces

Exoplanet transit
Selecting a small portion of the stellar disk

Doppler imaging of stellar surfaces
For a star with a dark spot close to
the equator, spectral line profiles
are affected throughout their whole
Width, as the spot is carried around
the star by rotation.
(Jean-François Donati)

Spatially resolved stellar spectroscopy
Left: Integrated line profiles
Vrot = 2, 40, 120 km/s
Right: Line behind planet
Top: Noise-free
Bottom: S/N = 300, R=300,000
(Hiva Pazira, Lund Observatory)
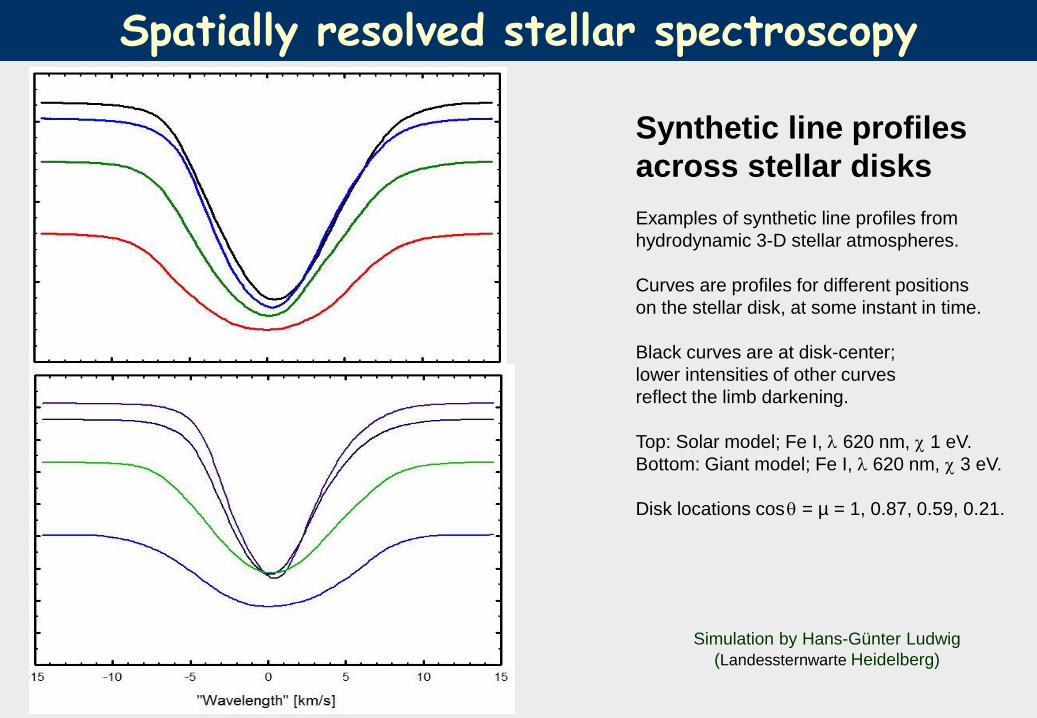
Synthetic line profiles
across stellar disks
Examples of synthetic line profiles from
hydrodynamic 3-D stellar atmospheres.
Curves are profiles for different positions
on the stellar disk, at some instant in time.
Black curves are at disk-center;
lower intensities of other curves
reflect the limb darkening.
Top: Solar model; Fe I, 620 nm, 1 eV.
Bottom: Giant model; Fe I, 620 nm, 3 eV.
Disk locations cos = µ = 1, 0.87, 0.59, 0.21.
Simulation by Hans-Günter Ludwig
(Landessternwarte Heidelberg)
Spatially resolved stellar spectroscopy

Visual high-resolution spectrometers at 8-10 m telescopes
Telescope SALT Keck I VLT
Kueyen
HET Subaru LBT
Diameter [m] 10 10 8.2 9.2 8.2 2 8.4
Spectrometer HRS HIRES UVES HRS HDS PEPSI
Maximum R 65,000 84,000 110,000 120,000 160,000 320,000
Wavelengths [µm] 0.37– 0.89 0.3 – 1.0 0.3 – 1.1 0.39 – 1.1 0.3 – 1.0 0.38 – 0.91

Potsdam Echelle Polarimetric and Spectroscopic Instrument @ Large Binocular Telescope

Hiva Pazira (Lund Observatory)
Spatially resolved spectroscopy with ELTs
Left: Hydrodynamic simulation of the supergiant Betelgeuse (B.Freytag) Right: Betelgeuse imaged with ESO’s 8.2 m VLT (Kervella et al., A&A, 504, 115)
Top right: 40-m E-ELT diffraction limits at 550 nm & 1.04 μm..

Resolving power and
spectral range of proposed
E-ELT spectrographs

Grand challenge: Design an efficient
R = 1,000,000 high-fidelity
spectrometer for E-ELT !