Graphs of Functions
40
Graphs of Functions Lesson 3
-
Upload
hall-franklin -
Category
Documents
-
view
49 -
download
4
description
Graphs of Functions. Lesson 3. Warm Up – Perform the Operations and Simplify. Solution. Solution. Solution. Solution. Domain & Range of a Function. What is the domain of the graph of the function f?. Domain & Range of a Function. What is the range of the graph of the function f?. - PowerPoint PPT Presentation
Transcript of Graphs of Functions

Graphs of Functions
Lesson 3

Warm Up – Perform the Operations and Simplify
2
412.
x
a
5420
3.
22
xx
x
xxb
352
10
5
6112.
2
23
xx
x
x
xxxc
92
7
92
7.
x
x
x
xd

2
412.
x
a
Solution
2
20122
424122
4
2
2122
412
x
xx
xxx
xx

Solution
5420
3.
22
xx
x
xxb
145
3
145
433
145
413
1545
3
2
2
xxx
xx
xxx
xxx
xxx
xxx
xx
x
xx

352
10
5
6112.
2
23
xx
x
x
xxxc
Solution
35
106
3125
10612
312
10
5
6112
352
10
5
6112
2
2
23
x
xx
xxx
xxxx
xx
x
x
xxx
xx
x
x
xxx

92
7
92
7.
x
x
x
xd
Solution
7
7
7
92
92
7
92
7
92
7
x
x
x
x
x
x
x
x
x
x
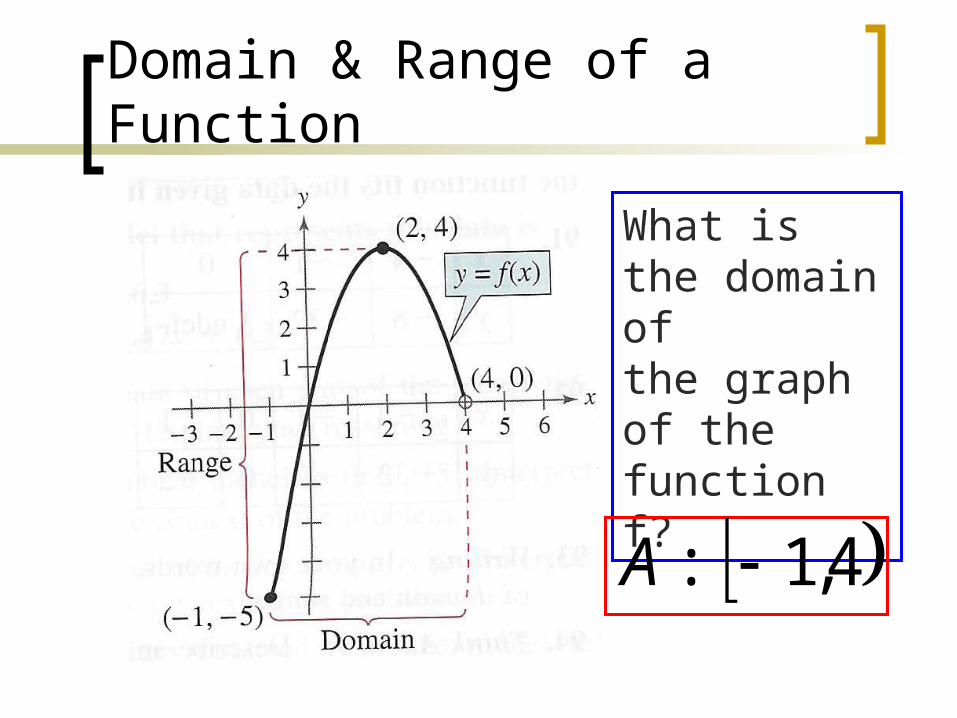
Domain & Range of a Function
What is the domain ofthe graph of the functionf?
4,1: A

Domain & Range of a Function
What is the range ofthe graph of the functionf?
4,5
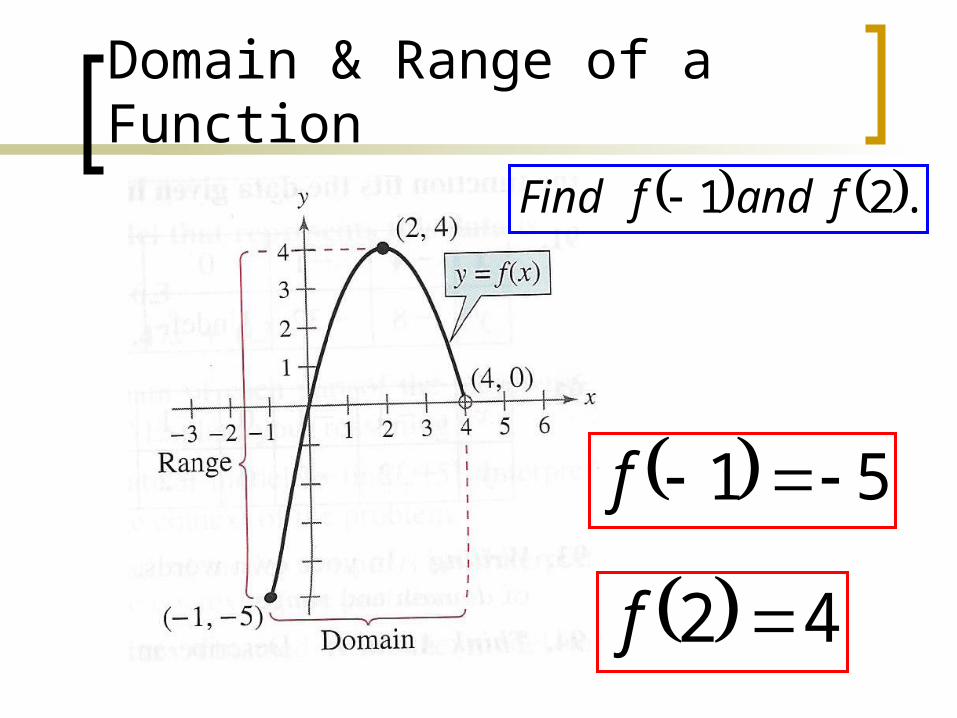
Domain & Range of a Function .21 fandfFind
51 f
42 f
Let’s look at domain and range of a function using an algebraic approach.
Then, let’s check it with a graphical approach.

Find the domain and range of
Algebraic Approach
.4 xxf
The expression under the radical can not be negative.Therefore, Domain .04 x
,4
4:
or
xA Since the domain is never negative the range is the set of all nonnegative real numbers.
,0
0:
or
yARange

Find the domain and range of
Graphical Approach
.4 xxf
Increasing and Decreasing Functions
The more you know about the graph of a function, the more you know about the function itself.
Consider the graph on the next slide.

Falls from x = -2 to x = 0.
Is constant from x = 0 to x = 2.
Rises from x = 2 to x = 4.

Ex: Find the open intervals on which the function is increasing, decreasing, or constant.
Increases over the entire real line.
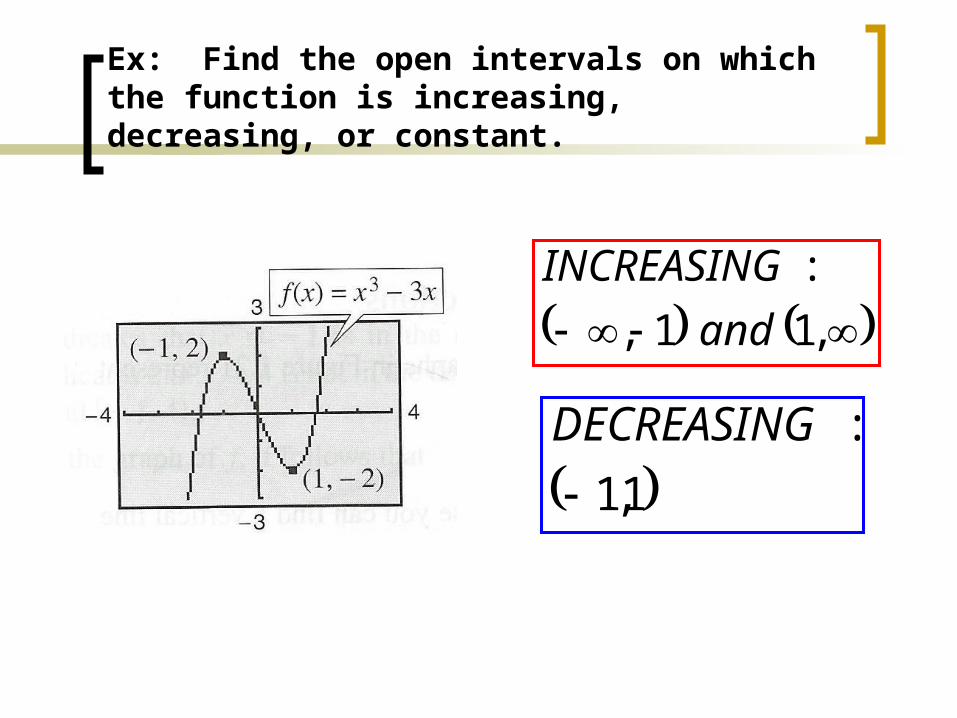
Ex: Find the open intervals on which the function is increasing, decreasing, or constant.
,11,
:
and
INCREASING
1,1
:
DECREASING

Ex: Find the open intervals on which the function is increasing, decreasing, or constant.
0,
:
INCREASING
2,0
:CONSTANT
.2
:DECREASING

Relative Minimum and Maximum Values

The point at which a function changes its increasing, decreasing, or constant behavior are helpful in determining the relative maximum or relative minimum values of a function.


General Points – We’ll find EXACT points later……

Approximating a Relative Minimum
Example: Use a GDC to approximate the relative minimum of the function given by
.243 2 xxxf

Put the function into the “y = “ the press zoom 6 to look at the graph.
Press trace to follow the line to the lowest point.
.243 2 xxxf

Example
Use a GDC to approximate the relative minimum and relative maximum of the function given by
.3 xxxf
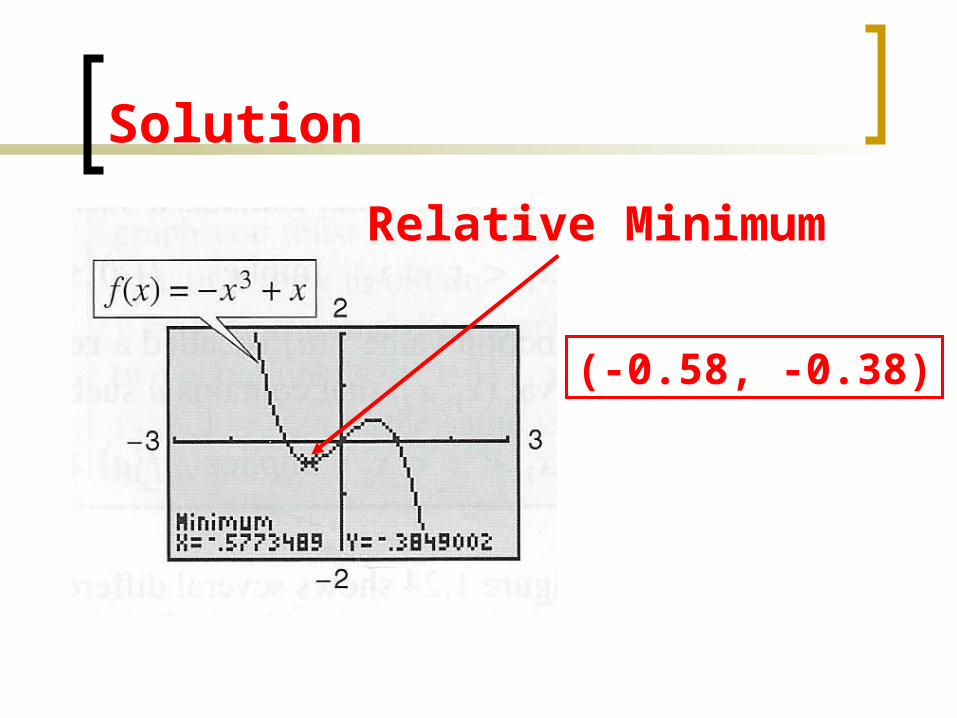
Solution
Relative Minimum
(-0.58, -0.38)
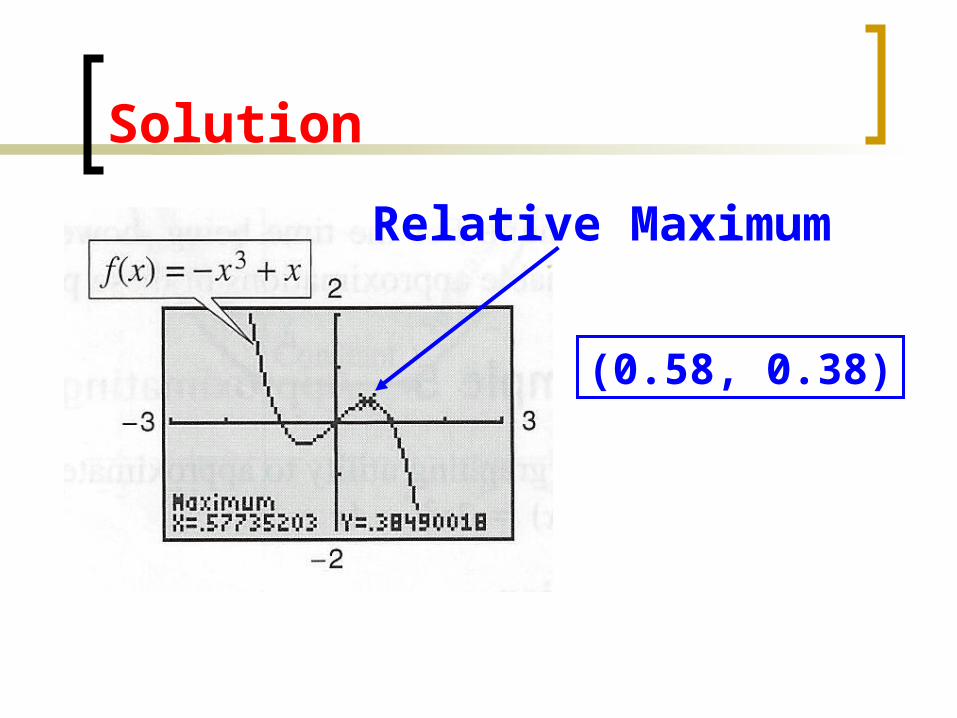
Solution
Relative Maximum
(0.58, 0.38)

Step Functions and Piecewise-Defined Functions

Because of the vertical jumps, the greatest integer function is an example
of a step function.

Let’s graph a Piecewise-Defined Function
Sketch the graph of
1,4
1,32
xx
xxxf
Notice when open dots and closeddots are used. Why?
Even and Odd Functions

Graphically

Algebraically
Let’s look at the graphs again and see if this applies.

Graphically
☺ ☺

Example
Determine whether each function is even, odd, or neither.

AlgebraicGraphical – Symmetric to Origin

Algebraic
Graphical – Symmetric to y-axis
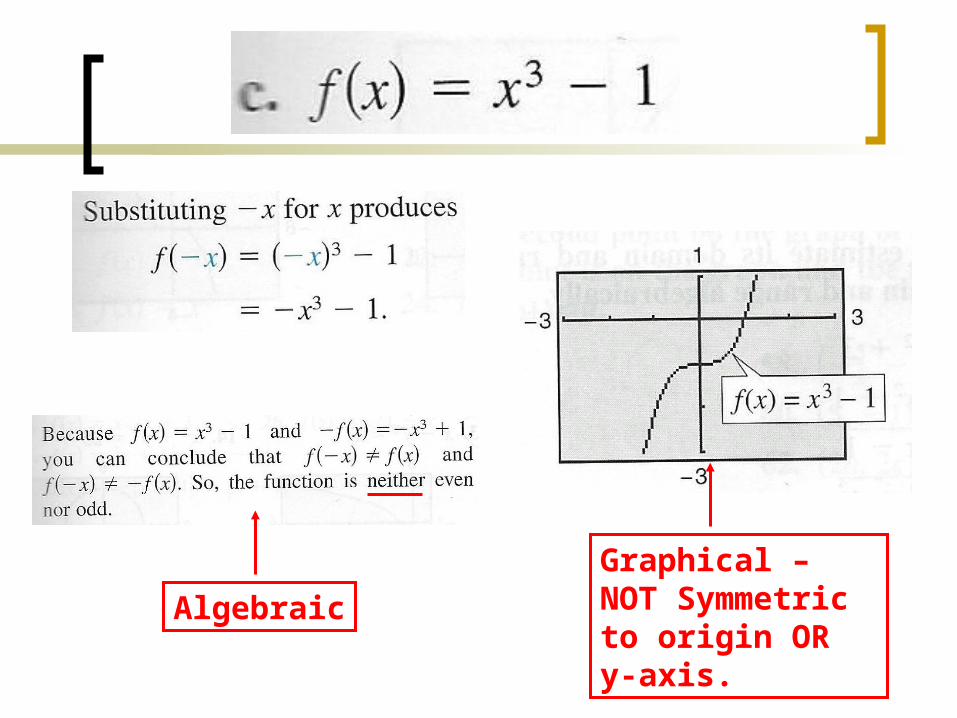
Algebraic
Graphical – NOT Symmetric to origin OR y-axis.

You Try
Is the function
Even, Odd, of Neither?
xxf

Solution xxf
Symmetric about the y-axis.