Graphing with a calculator
13
By: Leann Cox
-
Upload
leanncox16 -
Category
Documents
-
view
271 -
download
1
Transcript of Graphing with a calculator
By: Leann Cox
When you are given a graphing with the calculator problem…you basally know that you are going to need a calculator. The best thing about these types of problems is that it is mostly done on a graphing calculator.
Note to you: these are also one of those problem that you must do everything correctly or the rest of the problem with be wrong.
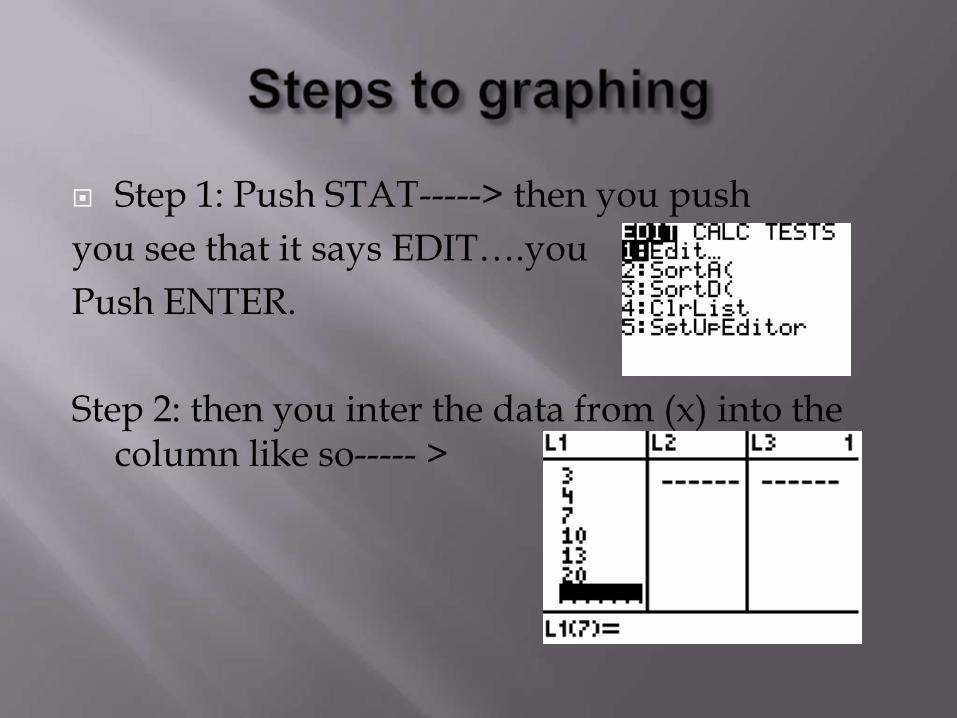
Step 1: Push STAT-----> then you push
you see that it says EDIT….you
Push ENTER.
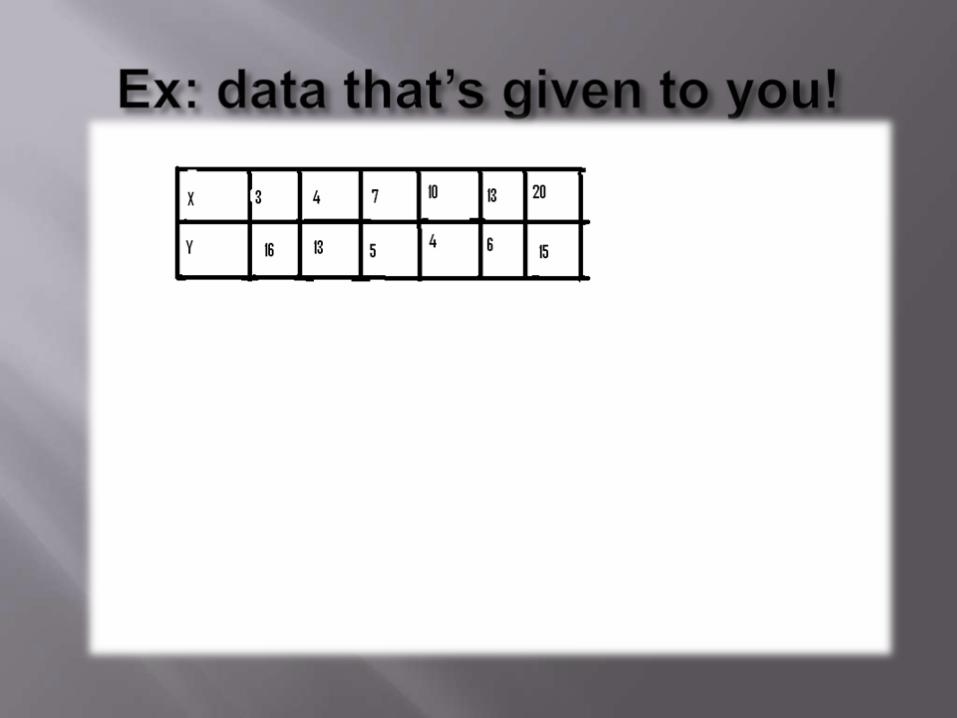
Step 2: then you inter the data from (x) into the column like so----- >
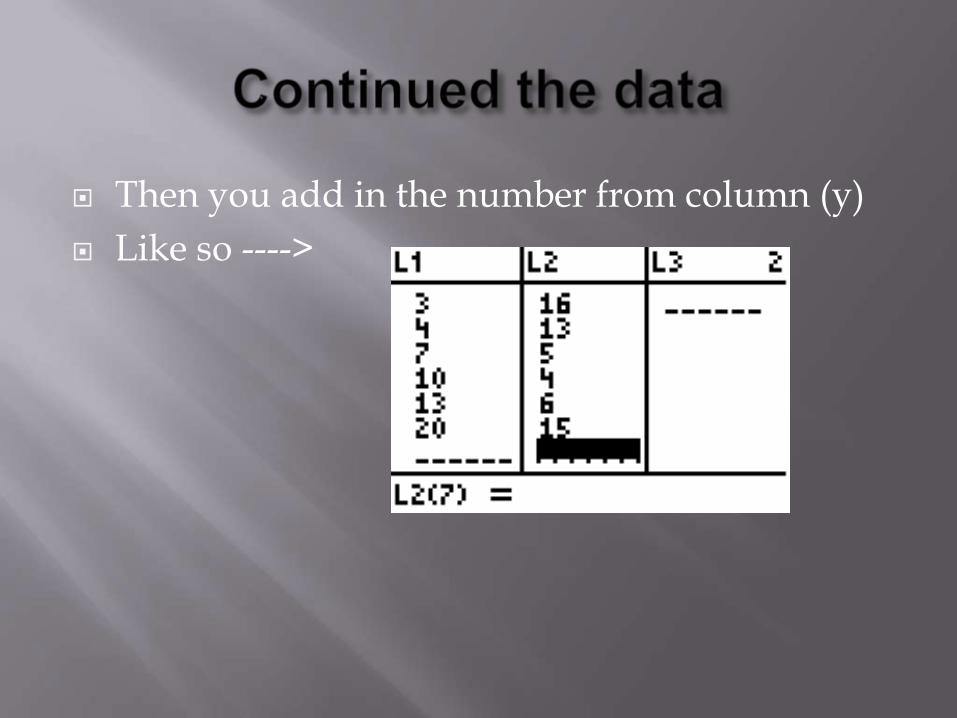
Then you add in the number from column (y)
Like so ---->
After you have entered the data into the columns then you click (window) at the top of your graphing calculator. It takes you to a screen that says window with xmin, xmax, xscal, ymin, ymax, yscal, xres.
Note to you on how to do a window….. For (xmin) you choose a little smaller then your smallest x. (xmax) you choose a little bigger number than your biggest x. then for your (xscal) you will pick a number for your increments. (ymin) you pick a little smaller number than your lowest y. (ymax)you pick a little bigger number than your highest y. (yscal) you will pick the number for your increments. (xres) IT IS ALWAYS ONE( there is not reason to change it.)
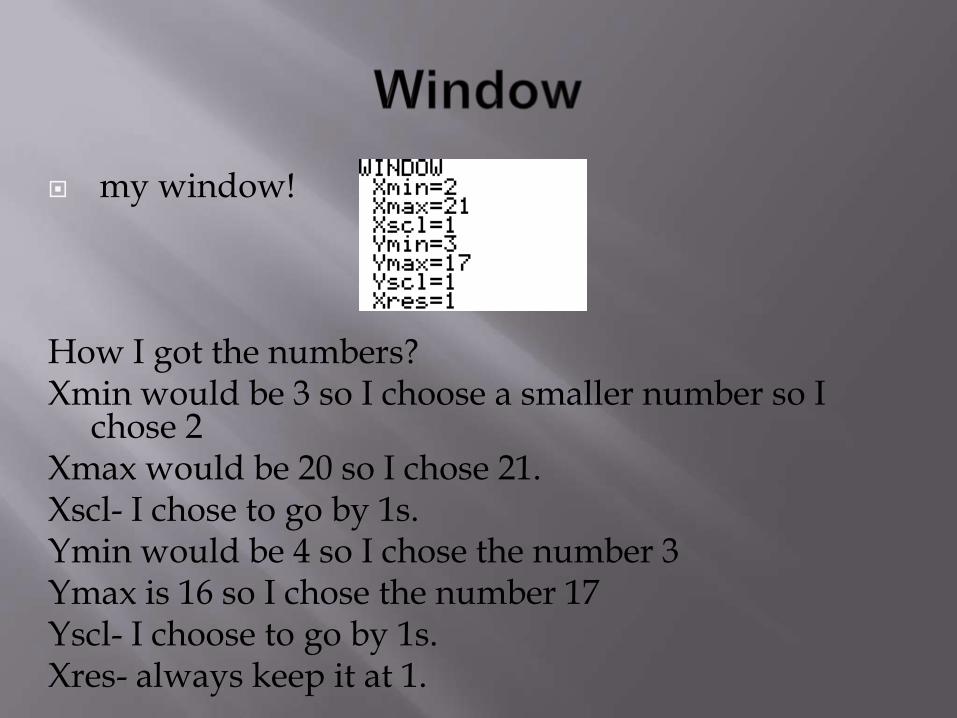
my window!
How I got the numbers? Xmin would be 3 so I choose a smaller number so I
chose 2 Xmax would be 20 so I chose 21.Xscl- I chose to go by 1s.Ymin would be 4 so I chose the number 3Ymax is 16 so I chose the number 17Yscl- I choose to go by 1s. Xres- always keep it at 1.
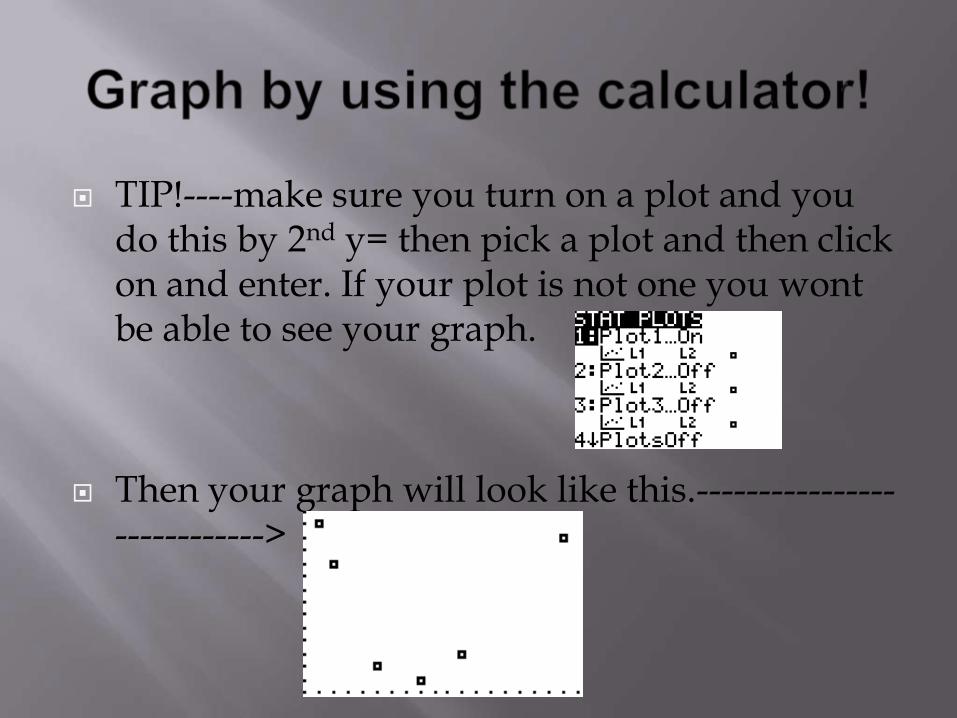
TIP!----make sure you turn on a plot and you do this by 2nd y= then pick a plot and then click on and enter. If your plot is not one you wont be able to see your graph.
Then your graph will look like this.---------------------------->
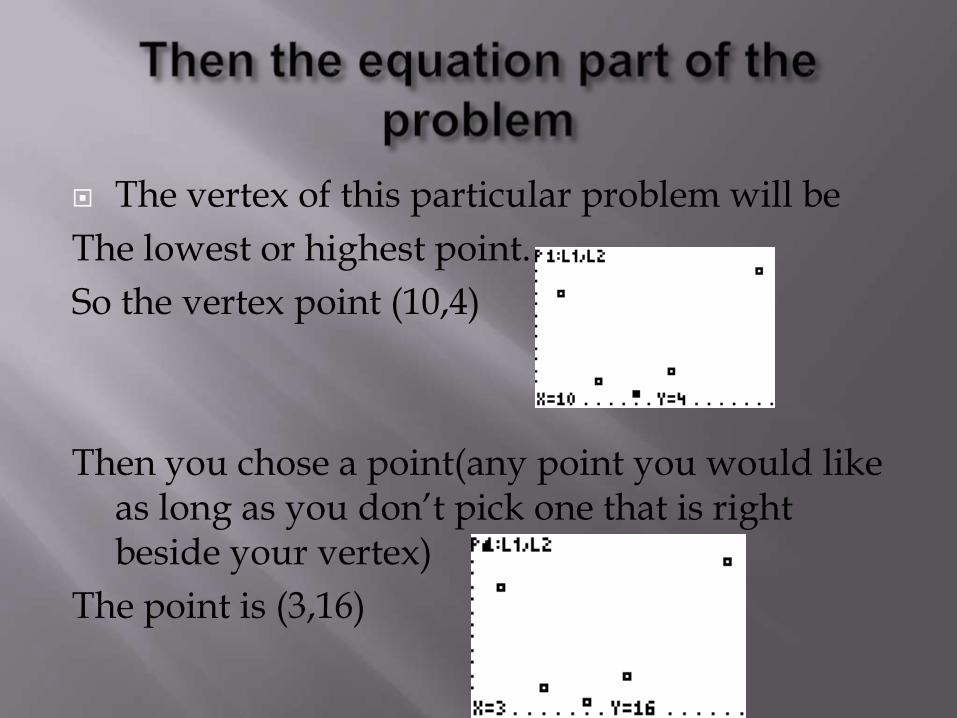
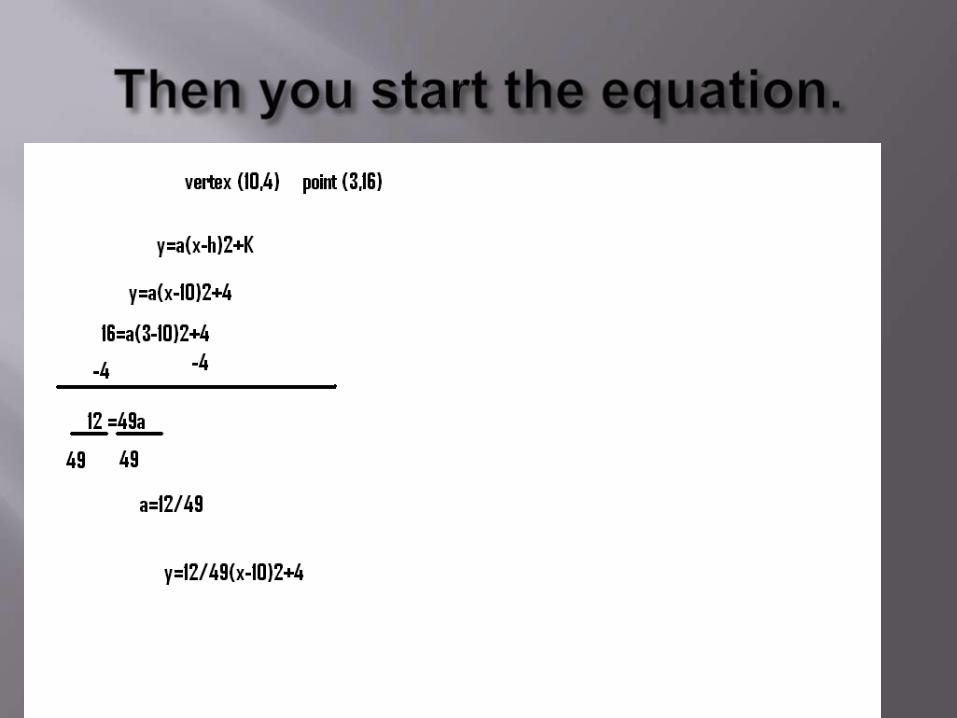
The vertex of this particular problem will be
The lowest or highest point.
So the vertex point (10,4)
Then you chose a point(any point you would like as long as you don’t pick one that is right beside your vertex)
The point is (3,16)
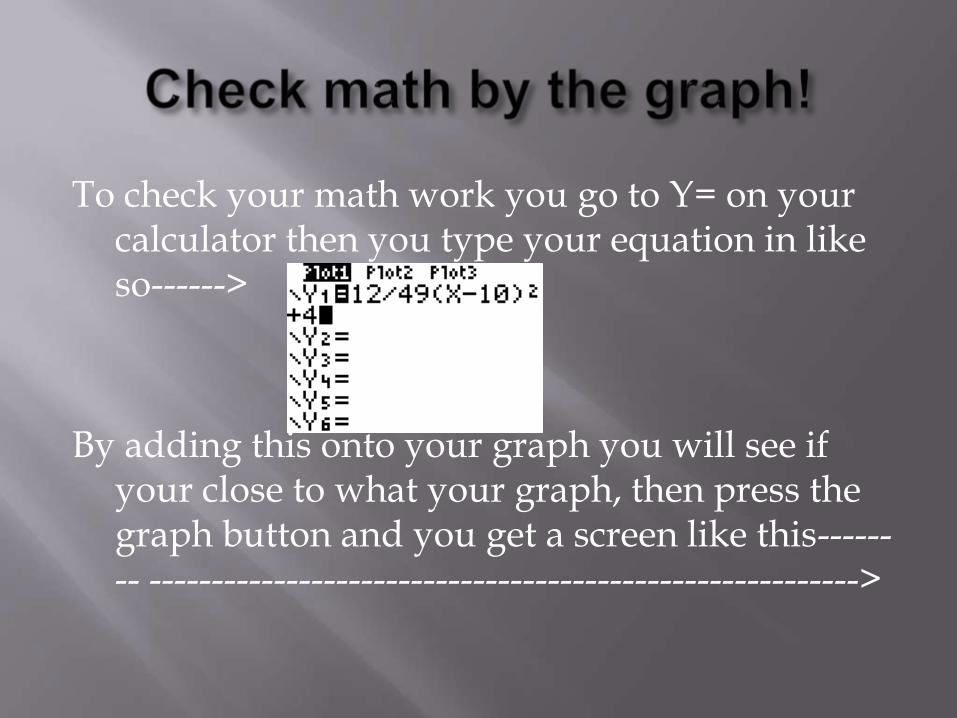
To check your math work you go to Y= on your calculator then you type your equation in like so------>
By adding this onto your graph you will see if your close to what your graph, then press the graph button and you get a screen like this-------- --------------------------------------------------------->
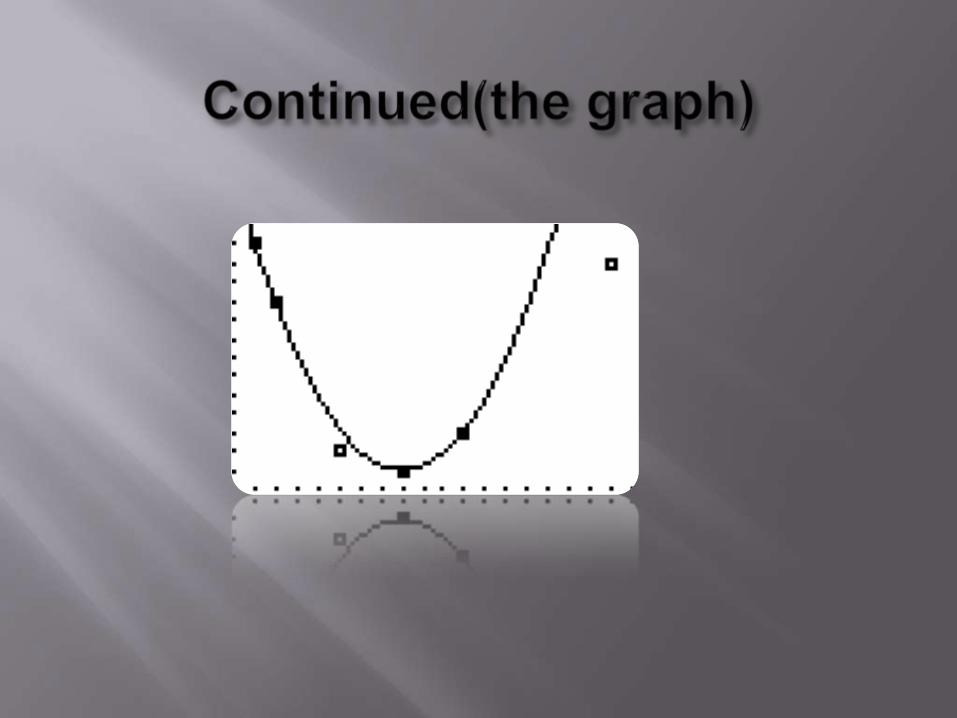
You will see all the work we have completed that the equation we came up with Is somewhat close to the graph.
That’s how you graph with a graphing calculator!(:
(remember to take your time on these problems because if you mess up on a part of it more than likely in the end it will be wrong.)