Graphing Linear Functions in Standard and Slope Intercept Form.
23
Graphing Linear Functions in Standard and Slope Intercept Form
-
Upload
dominic-williams -
Category
Documents
-
view
222 -
download
0
Transcript of Graphing Linear Functions in Standard and Slope Intercept Form.

Graphing Linear Functions in Standard and Slope Intercept Form

Break Into Groups
• Group Leaders:– Elaina– Kaeori– Kyle– Megan– Alex N– Kevin S– Riley– Kali
You will need an expo marker for today.
Group leaders: Locate and move to a table.
Everyone else: choose a group leader. 4 to a group maximum
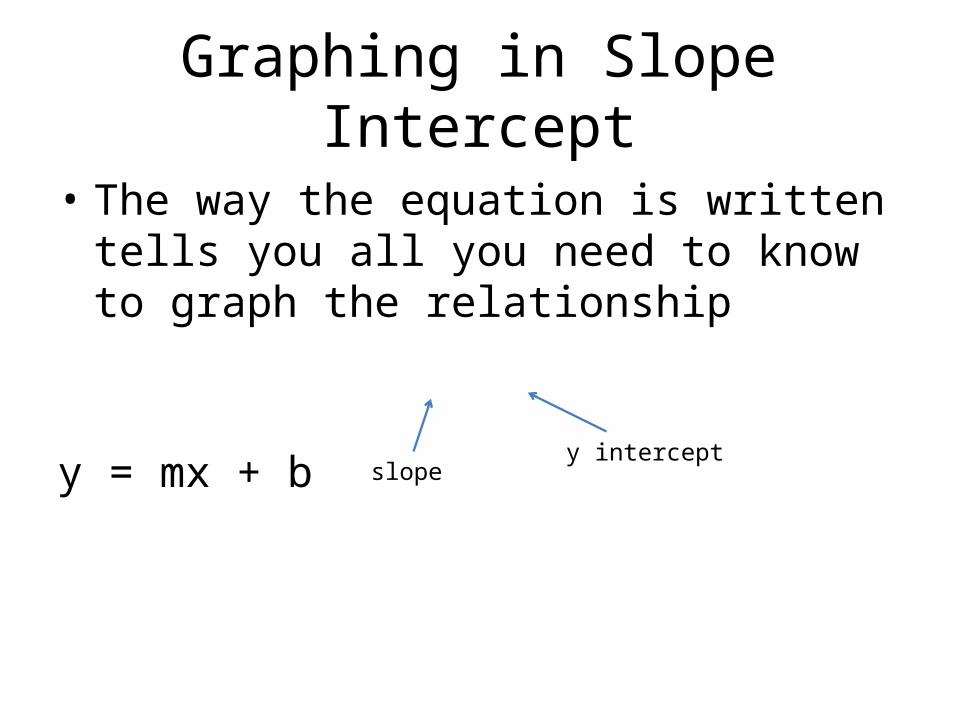
Graphing in Slope Intercept
• The way the equation is written tells you all you need to know to graph the relationship
y = mx + b
slope y intercept
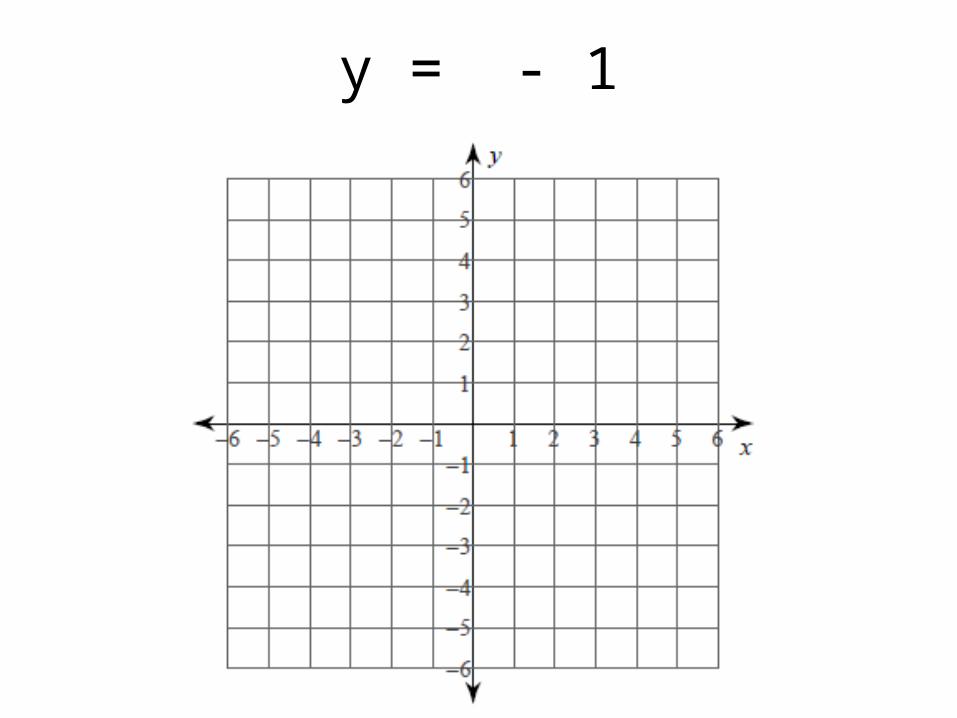
y = - 1
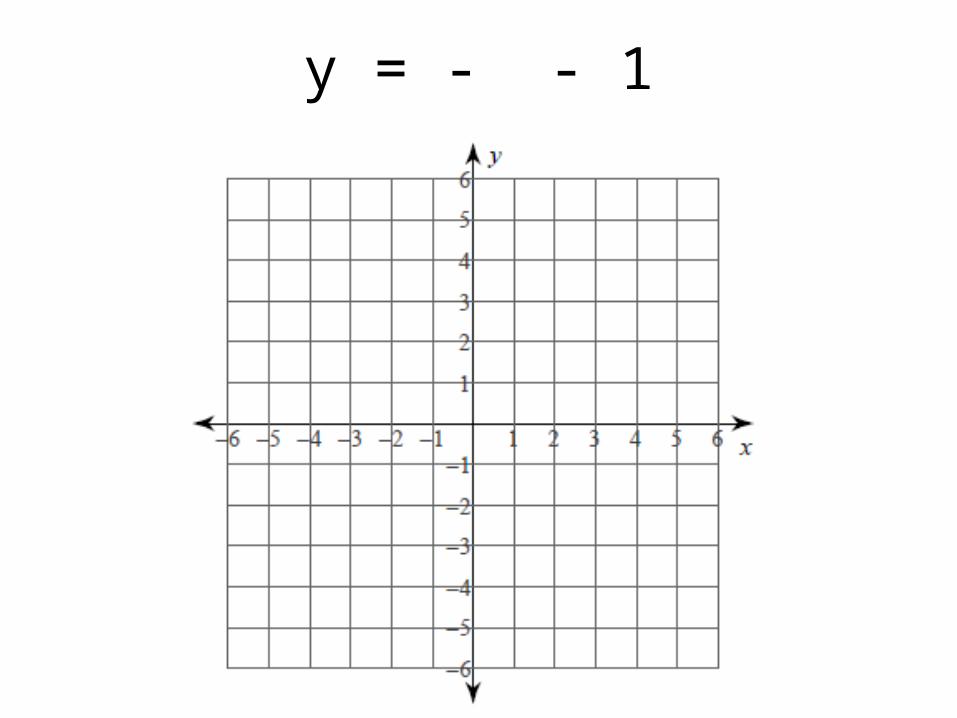
y = - - 1
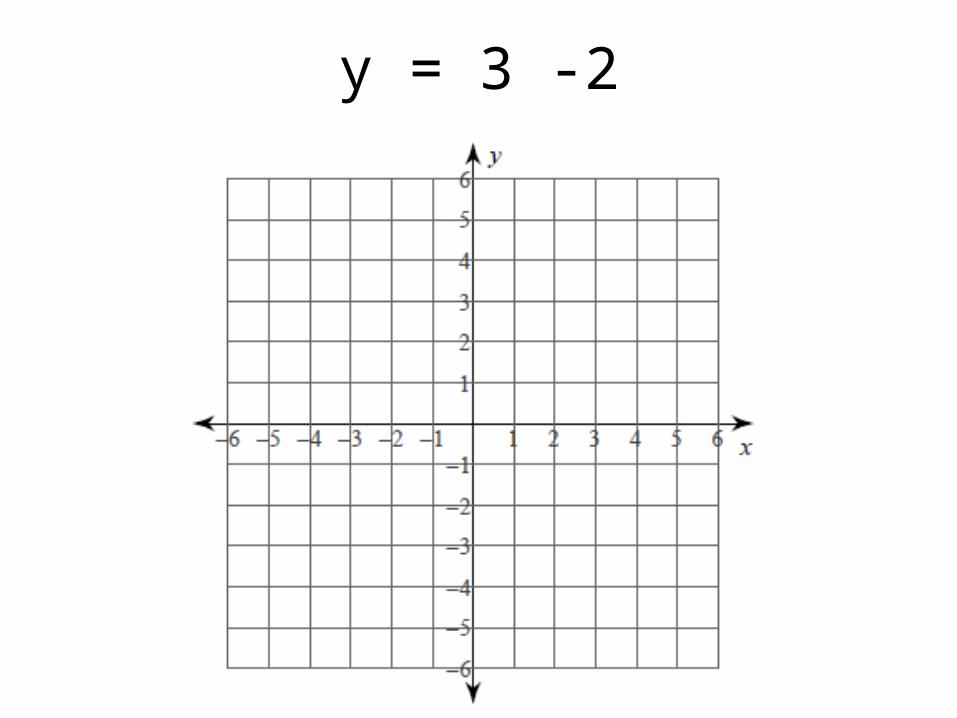
y = 3 -2
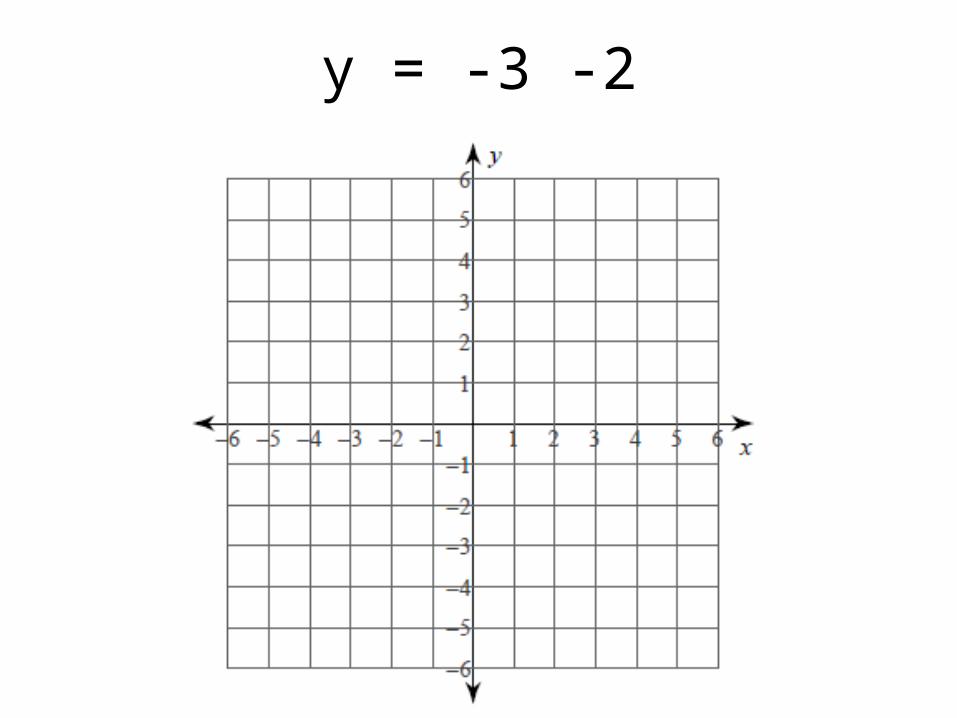
y = -3 -2
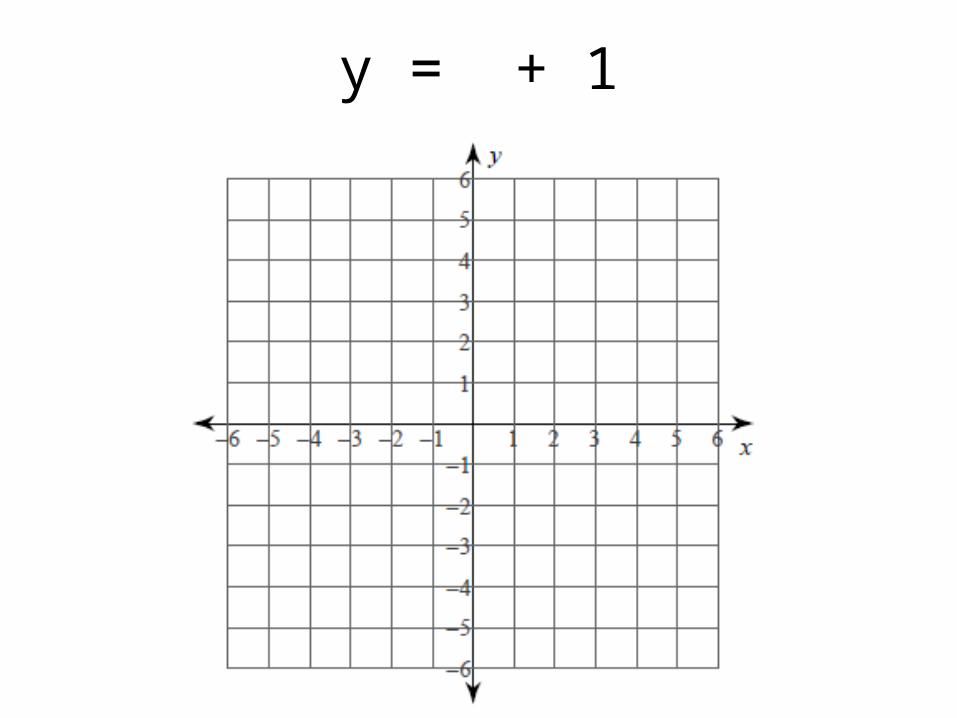
y = + 1
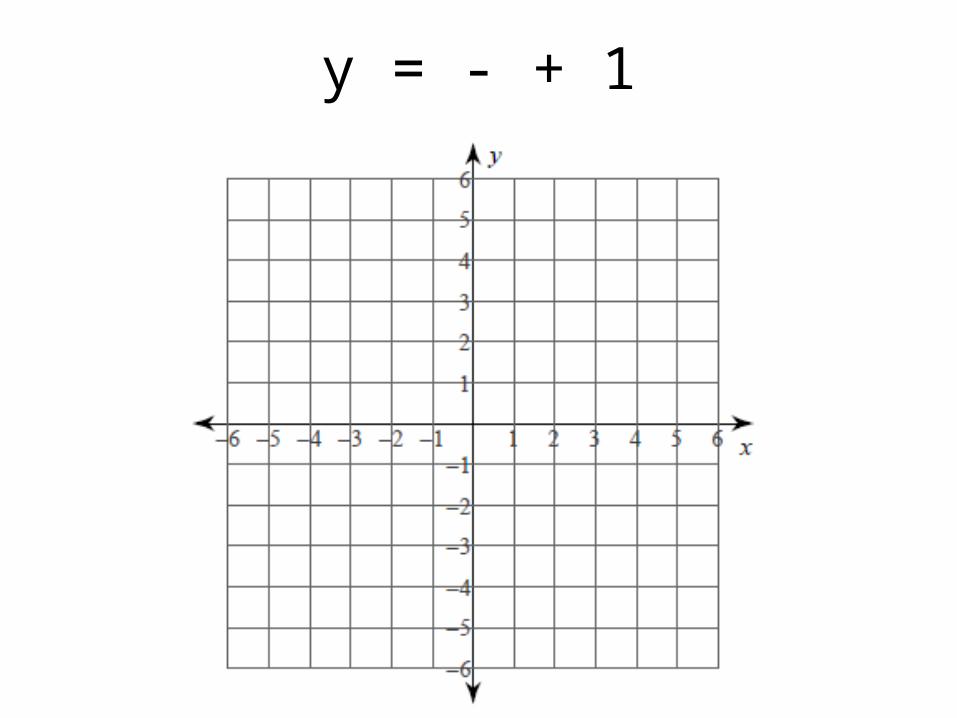
y = - + 1
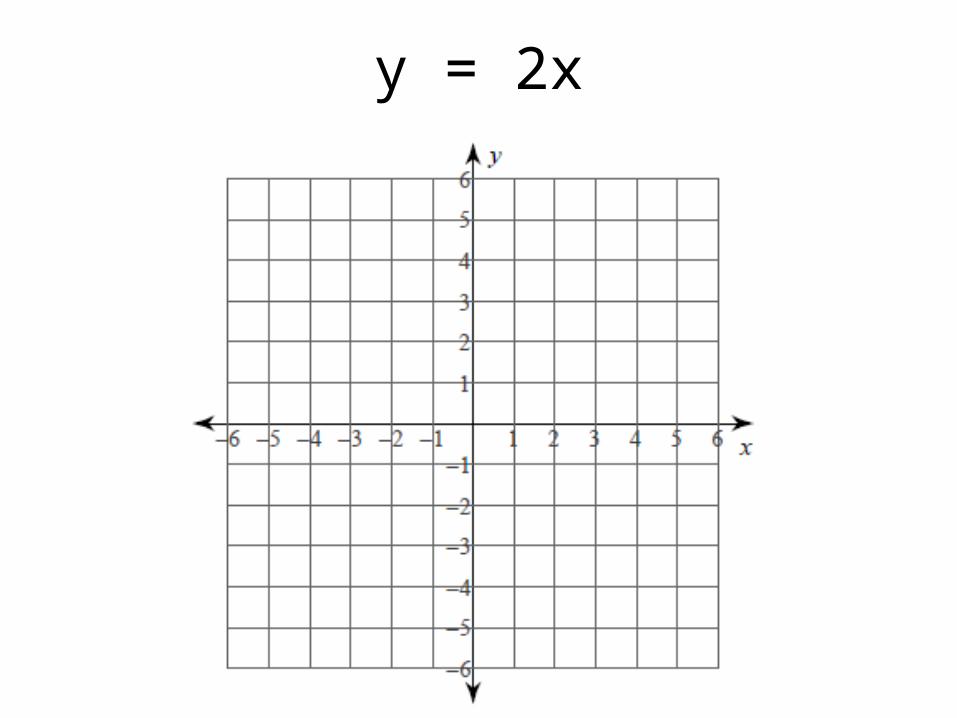
y = 2x
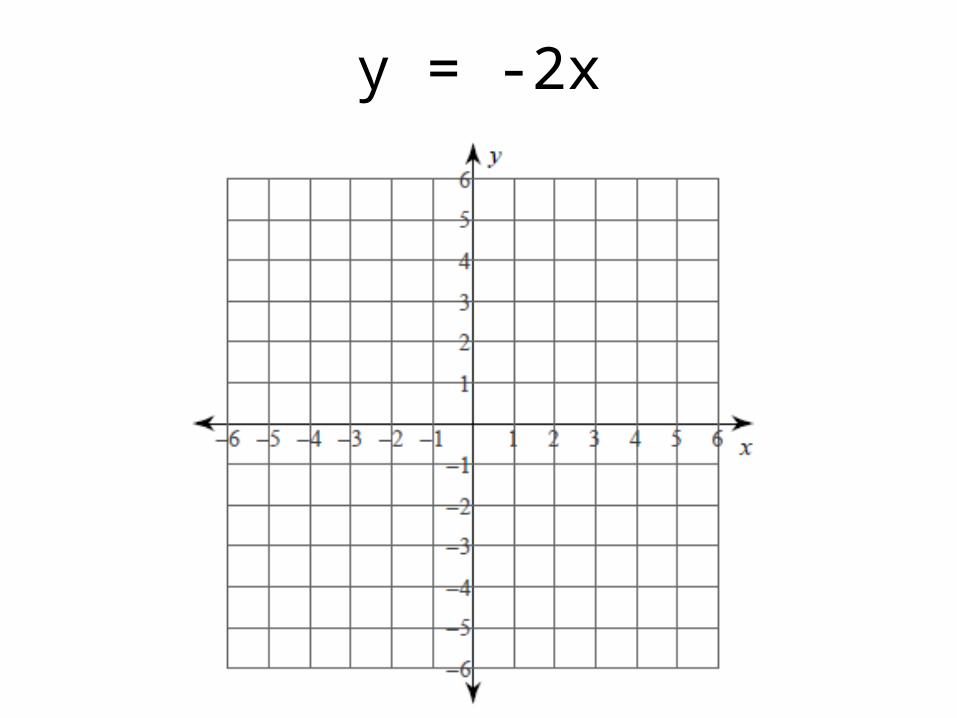
y = -2x
Graphing in Standard Form
• This form does not tell us much about its graph. We need to use x and y intercepts to produce a graph.
• Substitute x = 0 to find the y intercept (0, y)
• Substitute y = 0 to find the x intercept (x, 0)
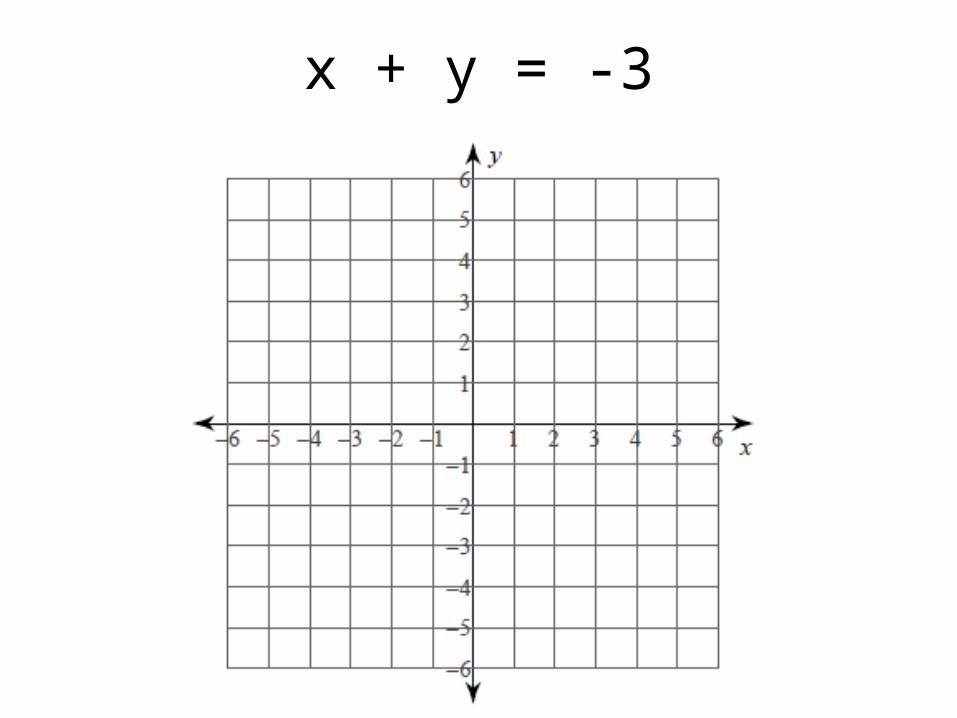
x + y = -3


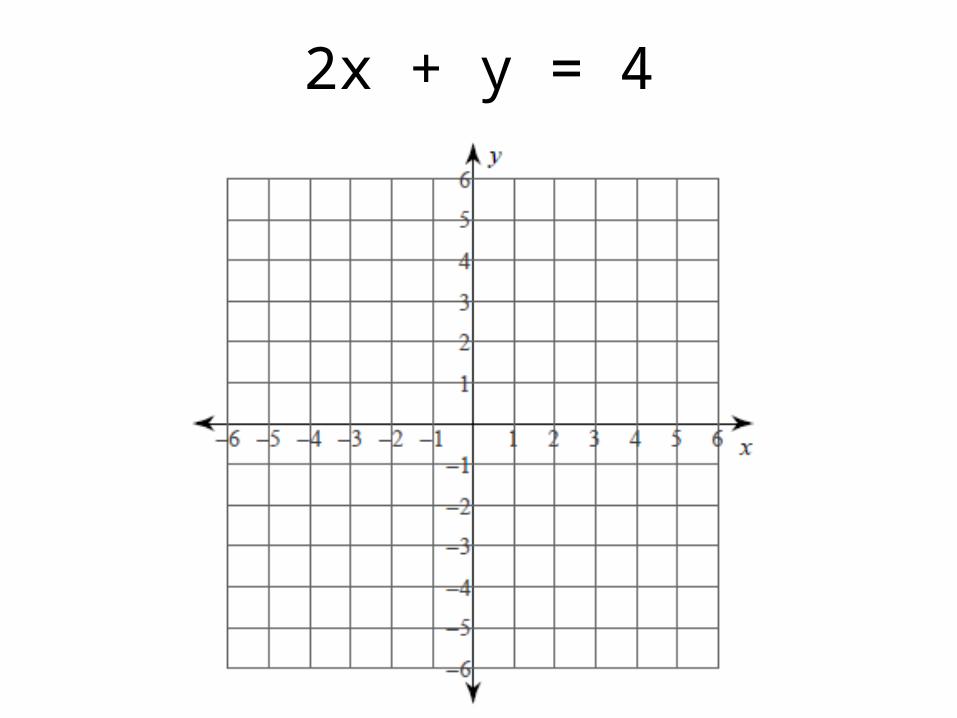
2x + y = 4
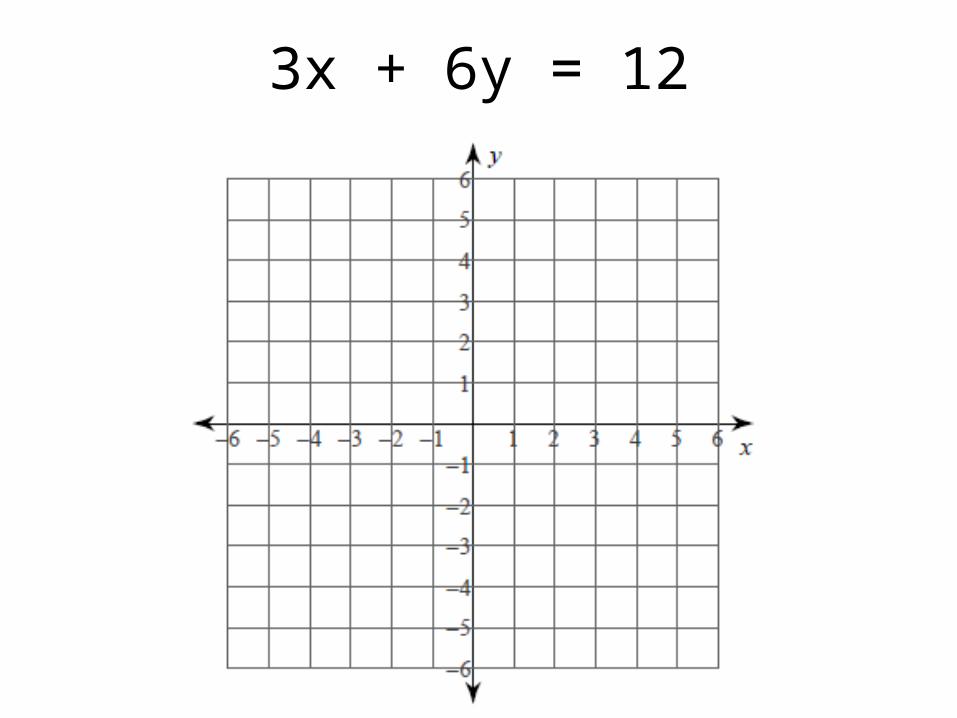
3x + 6y = 12
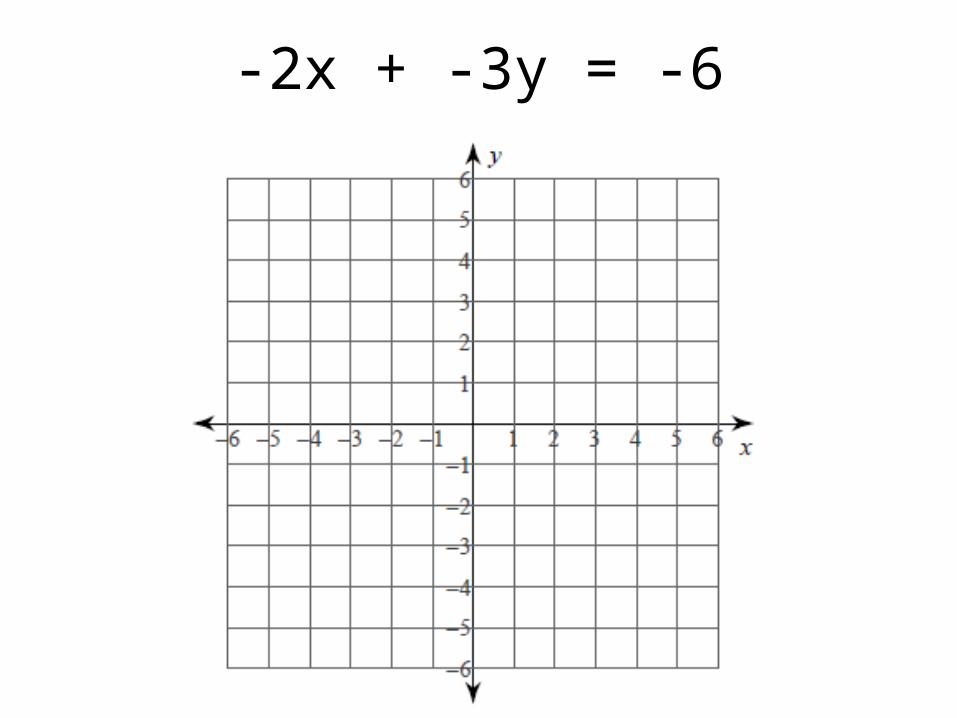
-2x + -3y = -6
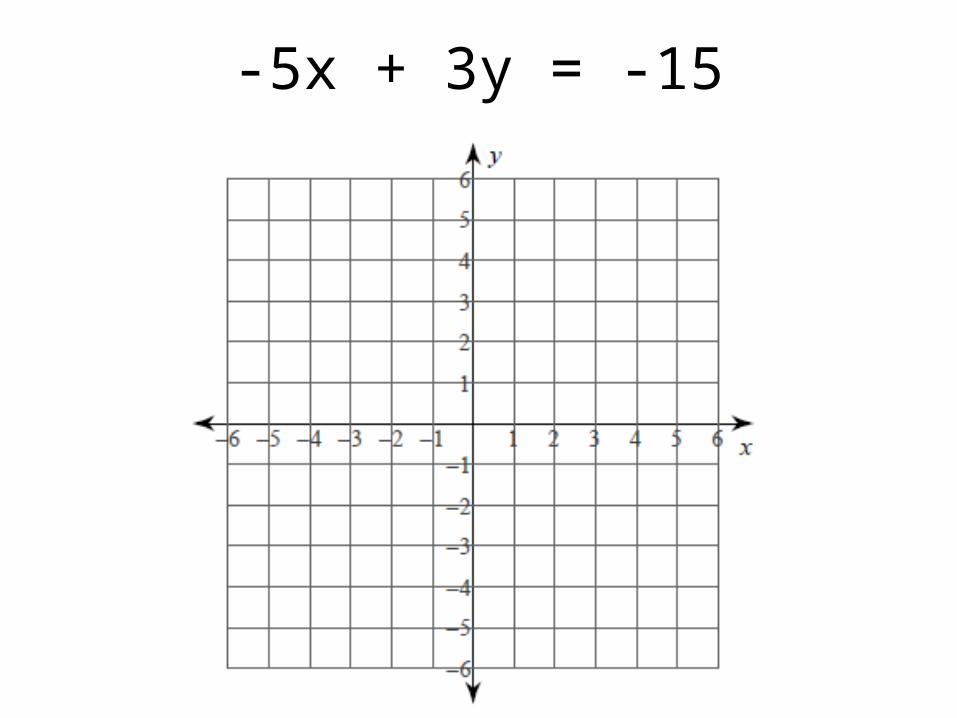
-5x + 3y = -15