Graphing Linear Equations · Graphing Linear Equations A.REI.10 Understand that the graph of an...
17
4 Notes Graphing Linears.notebook 1 August 17, 2017 Jan 1312:12 PM Graphing Linear Equations A.REI.10 Understand that the graph of an equation in two variables is the set of all its solutions plotted in the coordinate plane. Aug 2011:56 AM What am I learning today? How to graph a linear equation or inequality How will I show that I learned it? Graph a linear equation or inequality in slope‐ intercept or standard form
Transcript of Graphing Linear Equations · Graphing Linear Equations A.REI.10 Understand that the graph of an...

4 Notes Graphing Linears.notebook
1
August 17, 2017
Jan 1312:12 PM
Graphing Linear Equations
A.REI.10 Understand that the graph of an equation in two variables is the set of all its solutions plotted in the coordinate
plane.
Aug 2011:56 AM
What am I learning today?How to graph a linear equation or inequality
How will I show that I learned it?Graph a linear equation or inequality in slope‐
intercept or standard form

4 Notes Graphing Linears.notebook
2
August 17, 2017
Aug 2312:23 PM
Vocabulary
Solution Set the set of coordinates that provide solutions to a 2variable equation, represented by a graph on a coordinate plane.
XIntercept where the graph crosses the xaxis. The xvalue when y = 0.
YIntercept where the graph crosses the yaxis. The yvalue when x = 0.
Slope the rate of change between two points represented by .
Jan 1312:15 PM
INB "Graphing Linear Equations"
SlopeIntercept Form for Graphing a Line
y = mx + b
or
f(x) = mx + b
4 Notes Graphing Linears.notebook
3
August 17, 2017
Jan 1312:17 PM
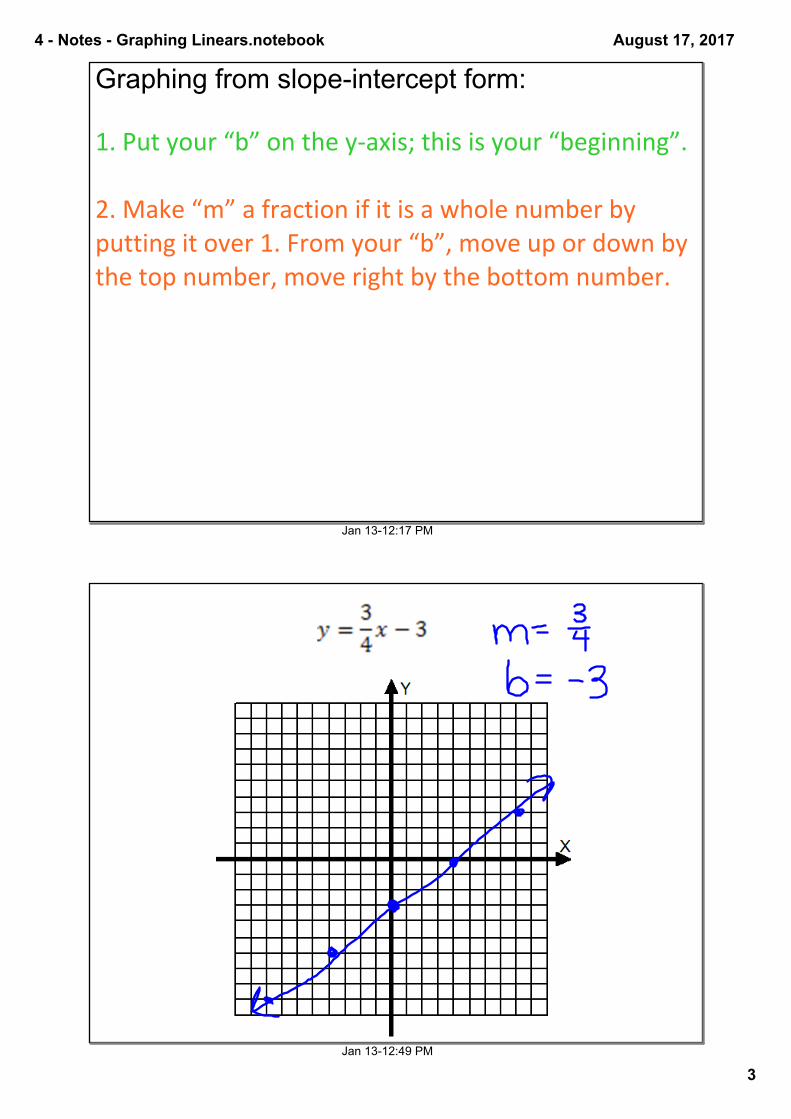
Graphing from slopeintercept form:
1. Put your “b” on the y‐axis; this is your “beginning”.
2. Make “m” a fraction if it is a whole number by putting it over 1. From your “b”, move up or down by the top number, move right by the bottom number.
Jan 1312:49 PM

4 Notes Graphing Linears.notebook
4
August 17, 2017
Jan 1312:50 PM
Jan 1312:51 PM
Finding slopeintercept form from a graph:1. Identify where the graph crosses your y‐axis. This is your “b” value.
2. Find 2 points that are where the graph crosses gridlines. Starting at the left point, count up or down how many units it takes to be even with the other point. This is the top number of your “m”. Count right how many units it takes to reach the point. This is the bottom value of “m”. Write as fraction.
3. Replace "m" and "b" in y = mx + b with your values.
4 Notes Graphing Linears.notebook
5
August 17, 2017
Jan 1312:15 PM
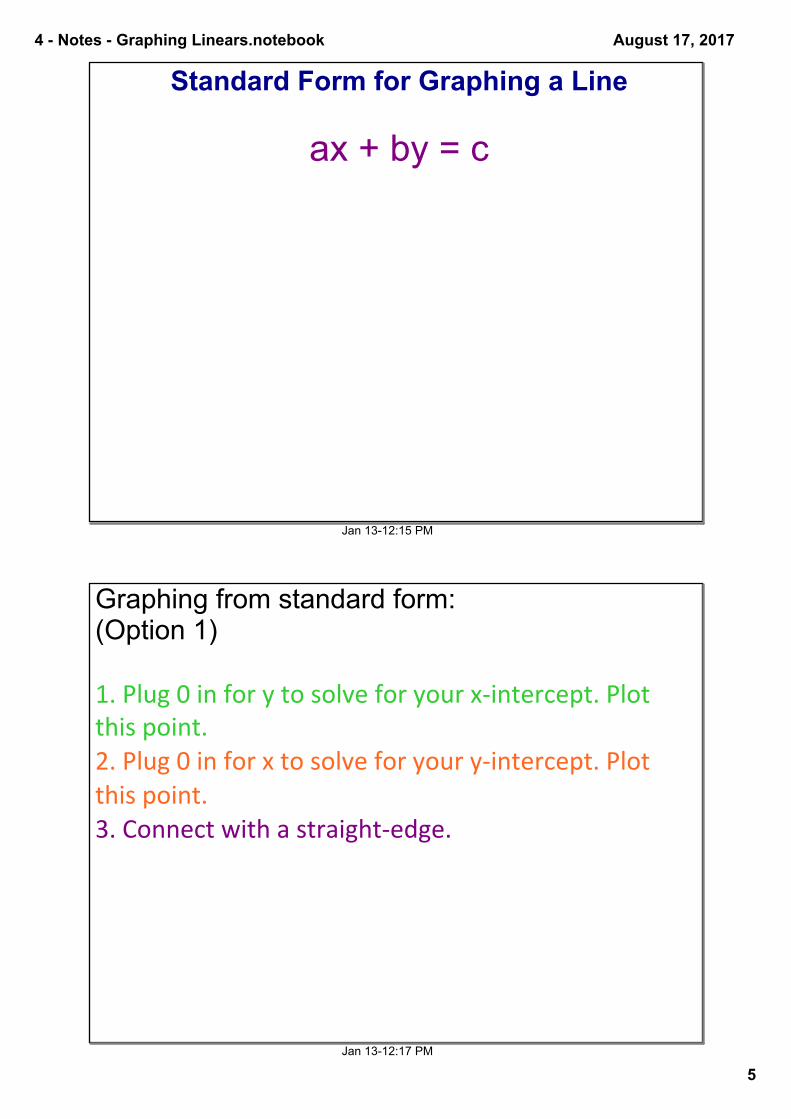
Standard Form for Graphing a Line
ax + by = c
Jan 1312:17 PM
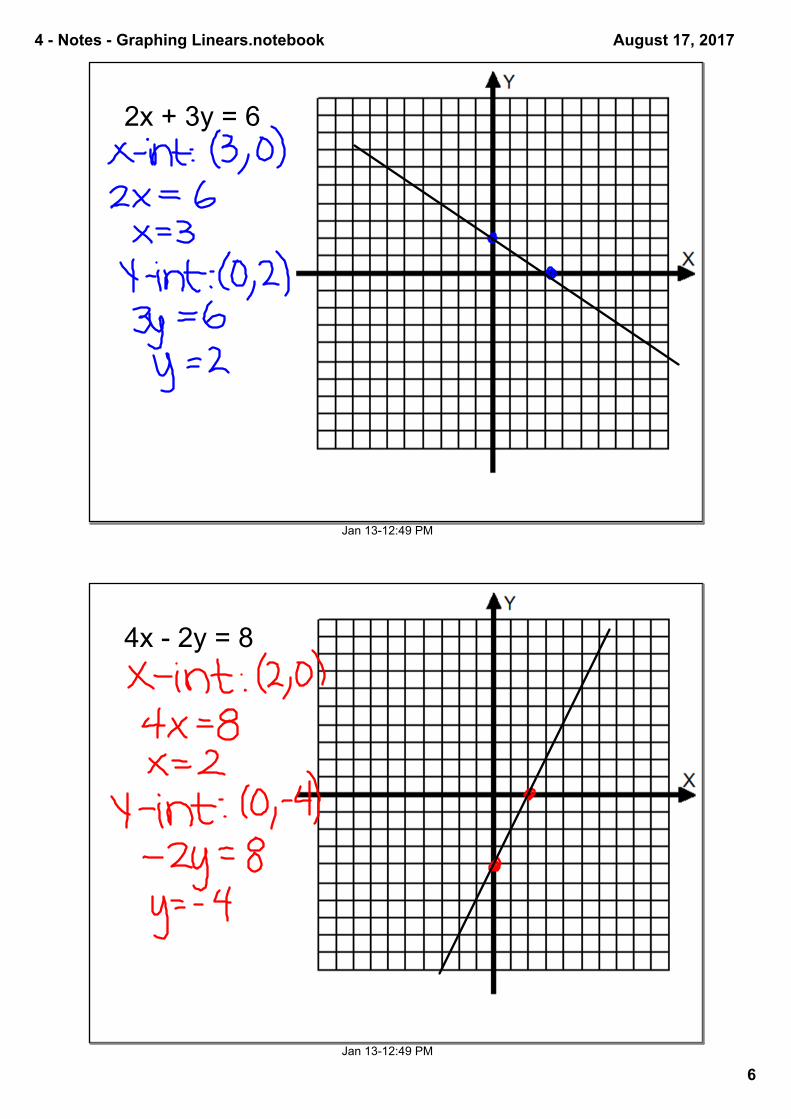
Graphing from standard form:(Option 1)
1. Plug 0 in for y to solve for your x‐intercept. Plot this point.2. Plug 0 in for x to solve for your y‐intercept. Plot this point.3. Connect with a straight‐edge.
4 Notes Graphing Linears.notebook
6
August 17, 2017
Jan 1312:49 PM
2x + 3y = 6
Jan 1312:49 PM
4x 2y = 8
4 Notes Graphing Linears.notebook
7
August 17, 2017
Jan 1312:17 PM
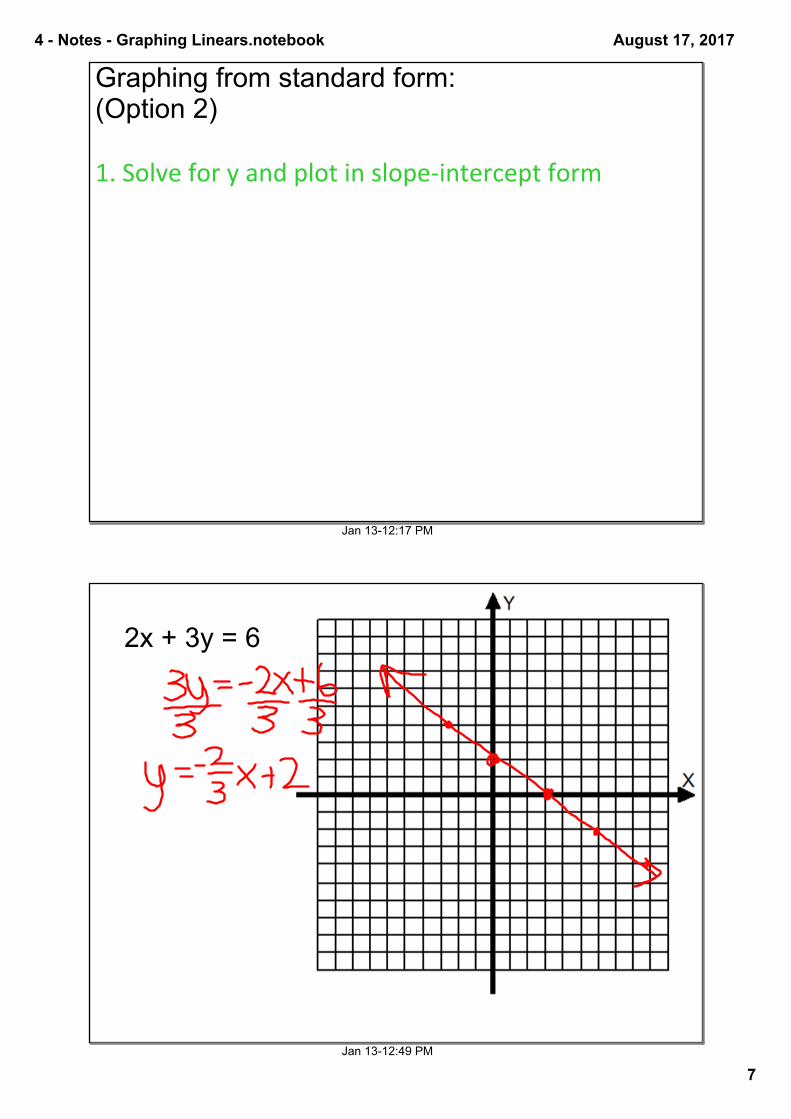
Graphing from standard form:(Option 2)
1. Solve for y and plot in slope‐intercept form
Jan 1312:49 PM
2x + 3y = 6

4 Notes Graphing Linears.notebook
8
August 17, 2017
Jan 1312:49 PM
4x 2y = 8
Aug 2311:43 AM
y = # x = #Slope 0 Undefined
Type of Line Horizontal Verticaly =
2x =
2

4 Notes Graphing Linears.notebook
9
August 17, 2017
Aug 1910:33 AM
y = 3x y = (2/3)x 5
Aug 1910:33 AM
3x y = 4 2x + 5y = 15Put in slopeintercept form and graph.

4 Notes Graphing Linears.notebook
10
August 17, 2017
Aug 168:08 AM
Write equations for the following graphs
Aug 1910:43 AM
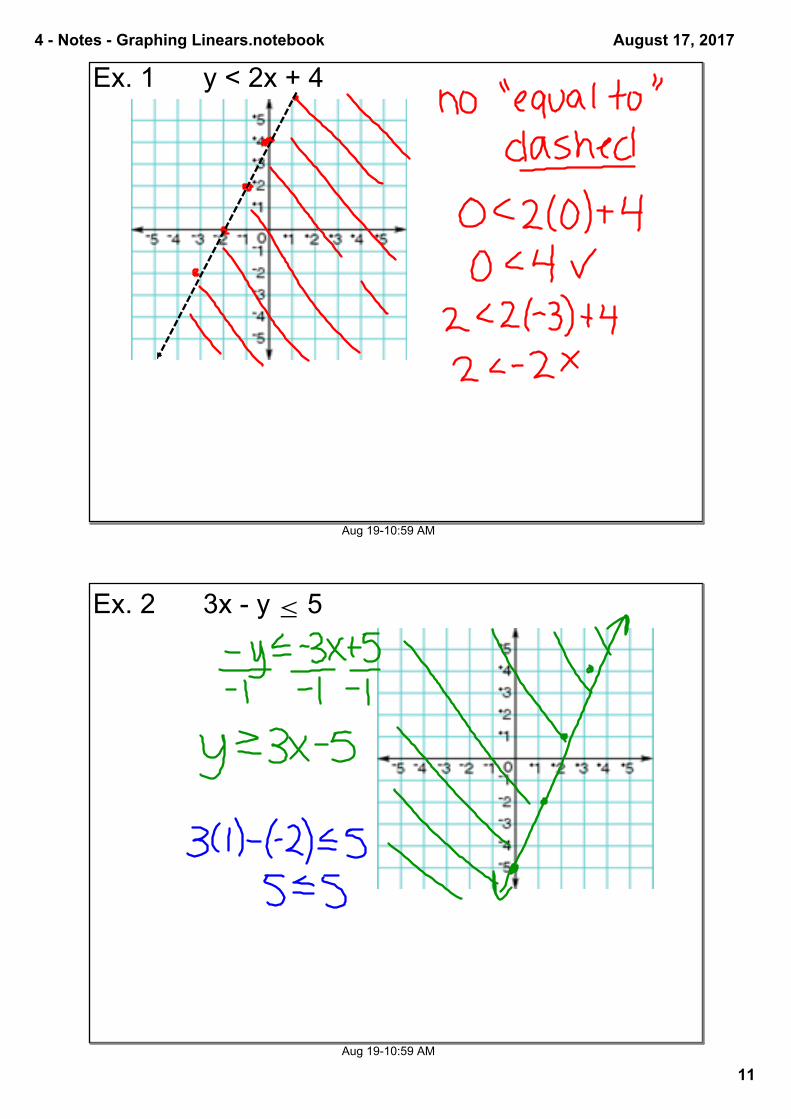
Graphing an Inequality2Variable: On a coordinate plane (graph)Solid Line:Dotted Line:
Test a point on one side. If it works, shade on same side. If it doesn't work, shade on opposite side.
4 Notes Graphing Linears.notebook
11
August 17, 2017
Aug 1910:59 AM
Ex. 1 y < 2x + 4
Aug 1910:59 AM
Ex. 2 3x y ≤ 5

4 Notes Graphing Linears.notebook
12
August 17, 2017
Aug 168:17 AM
Ex. 3a
Write the equation for the following inequality.
Aug 168:17 AM
Ex. 3b
Write the equation for the following inequality.

4 Notes Graphing Linears.notebook
13
August 17, 2017
Aug 168:17 AM
Ex. 3c
Write the equation for the following inequality.
Aug 2610:16 AM
Shaded Region =
ALL POSSIBLE SOLUTIONS
4 Notes Graphing Linears.notebook
14
August 17, 2017
Jan 2710:12 AM
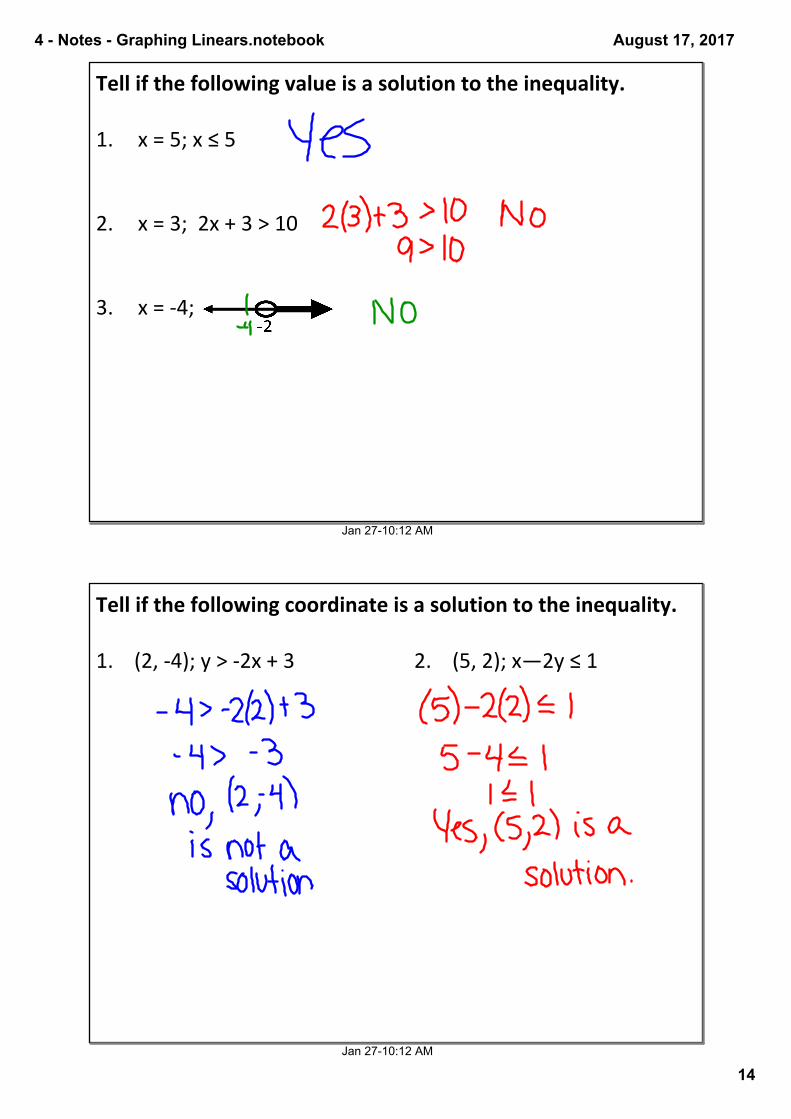
Tell if the following value is a solution to the inequality.
1. x = 5; x ≤ 5
2. x = 3; 2x + 3 > 10
3. x = ‐4;
Jan 2710:12 AM
Tell if the following coordinate is a solution to the inequality.
1. (2, ‐4); y > ‐2x + 3 2. (5, 2); x—2y ≤ 1

4 Notes Graphing Linears.notebook
15
August 17, 2017
Jan 2710:12 AM
Tell if the following coordinate is a solution to the graphed inequality.
1. (‐3, 3)2. (4, 0)3. (1, 2)4. (3, 2)5. (0, ‐3)
Jan 2710:14 AM
Use the questions to help graph the inequality.
3x—4y < 8
Slope‐Intercept Form: Solid or Dotted Line? Test Point:
Did it work? Shade on same or opposite side?

4 Notes Graphing Linears.notebook
16
August 17, 2017
Aug 168:21 AM
Graph the following inequalities. y > 2x 3 y ≤ (1/3)x + 6 y ≤ (5/2)x 2
Aug 168:21 AM
Put in slopeintercept form and then graph the solutions set. 2x + y < 6 x 4y ≤ 16 3x + 5y ≥ 35

4 Notes Graphing Linears.notebook
17
August 17, 2017
Aug 168:46 AM
Write the equation of the inequality for the following graphs.