Graph Structure in Web (Broder)
19
Graph structure in the web Andrei Broder 1 , Ravi Kumar 2 , Farzin Maghoul 1 , Prabhakar Raghavan 2 , Sridhar Rajagopalan 2 , Raymie Stata 3 , Andrew Tomkins 2 , Janet Wiener 3 1: AltaVista Company, San Mateo, CA. 2: IBM Almaden Research Center, San Jose, CA. 3: Compaq Systems Research Center, Palo Alto, CA. Abstract The study of the web as a graph is not only fascinating in its own right, but also yields valuable insight into web algorithms for crawling, searching and community discovery, and the sociological phenomena which characterize its evolution. We report on experiments on local and global properties of the web graph using two Altavista crawls each with over 200 million pages and 1.5 billion links. Our study indicates that the macroscopic structure of the web is considerably more intricate than suggested by earlier experiments on a smaller scale. Keywords: graph structure, diameter, web measurement Introduction Consider the directed graph whose nodes correspond to static pages on the web, and whose arcs correspond to links between these pages. We study various properties of this graph including its diameter, degree distributions, connected components, and macroscopic structure. There are several reasons for developing an understanding of this graph: 1. Designing crawl stra tegi es on the web [ Cho and Garcia-Molina 2000]. 2. Underst anding of the sociolo gy o f con tent cr eation on th e web. Page 1 of 19 www9 paper 3/6/2003 http://www.feralcows.org/tomkins/papers/www9/www9.html
-
Upload
stanislav-vorobyev -
Category
Documents
-
view
226 -
download
0
Transcript of Graph Structure in Web (Broder)

8/8/2019 Graph Structure in Web (Broder)
http://slidepdf.com/reader/full/graph-structure-in-web-broder 1/19
Graph structure in the web
Andrei Broder 1, Ravi Kumar 2, Farzin Maghoul1, Prabhakar Raghavan2, Sridhar
Rajagopalan2, Raymie Stata3, Andrew Tomkins2, Janet Wiener 3
1: AltaVista Company, San Mateo, CA.2: IBM Almaden Research Center, San Jose, CA.3: Compaq Systems Research Center, Palo Alto, CA.
Abstract
The study of the web as a graph is not only fascinating in its own right, but also yieldsvaluable insight into web algorithms for crawling, searching and community discovery, and thesociological phenomena which characterize its evolution. We report on experiments on localand global properties of the web graph using two Altavista crawls each with over 200 millionpages and 1.5 billion links. Our study indicates that the macroscopic structure of the web isconsiderably more intricate than suggested by earlier experiments on a smaller scale.
Keywords: graph structure, diameter, web measurement
Introduction
Consider the directed graph whose nodes correspond to static pages on the web, and whosearcs correspond to links between these pages. We study various properties of this graphincluding its diameter, degree distributions, connected components, and macroscopicstructure. There are several reasons for developing an understanding of this graph:
1. Designing crawl strategies on the web [Cho and Garcia-Molina 2000].2. Understanding of the sociology of content creation on the web.
Page 1 of 19www9 paper
3/6/2003http://www.feralcows.org/tomkins/papers/www9/www9.html

8/8/2019 Graph Structure in Web (Broder)
http://slidepdf.com/reader/full/graph-structure-in-web-broder 2/19
3. Analyzing the behavior of web algorithms that make use of link information [Butafogo and Schneiderman91, Mendelson and Wood 95, Carierre and Kazman 97, Kleinberg 97, Brin and Page 98]. To take just oneexample, what can be said of the distribution and evolution of PageRank [Brin and Page 98] values ongraphs like the web?
4. Predicting the evolution of web structures such as bipartite cores [Kumar et. al. (1) 99] and webrings, anddeveloping better algorithms for discovering and organizing them.
5. Predicting the emergence of important new phenomena in the web graph.
We detail a number of experiments on a web crawl of approximately 200 million pages and 1.5billion links; the scale of this experiment is thus five times larger than the previous biggeststudy [Kumar et. al. (1) 99] of structural properties of the web graph, which used a pruned dataset from 1997 containing about 40 million pages. Recent work ([Kumar et. al. (1) 99] on the1997 crawl, and [Barabasi and Albert 99] on the approximately 325 thousand node nd.edu
subset of the web) has suggested that the distribution of degrees (especially in-degrees -- thenumber of links to a page) follows a power law:
The power law for in-degree: the probability that a node has in-degree i is proportional
to 1/i x , for some x > 1.
We verify the power law phenomenon in current (considerably larger) web crawls, confirming itas a basic web property.
In other recent work, [Albert, Jeong, and Barabasi 99] report the intriguing finding that mostpairs of pages on the web are separated by a handful of links, almost always under 20, andsuggest that this number will grow logarithmically with the size of the web. This is viewed bysome as a "small world" phenomenon. Our experimental evidence reveals a rather moredetailed and subtle picture: most ordered pairs of pages cannot be bridged at all and there aresignificant numbers of pairs that can be bridged, but only using paths going through hundredsof intermediate pages. Thus, the web is not the ball of highly-connected spaghetti we believedit to be; rather, the connectivity is strongly limited by a high-level global structure.
Our main results
We performed three sets of experiments on web crawls from May 1999 and October 1999.Unless otherwise stated, all results described below are for the May 1999 crawl, but allconclusions have been validated for the October 1999 crawl as well. First, we generated thein- and out-degree distributions, confirming previous reports on power laws; for instance, the
fraction of web pages with i in-links is proportional to 1/i 2.1. The constant 2.1 is in remarkableagreement with earlier studies at varying scales [Kumar et. al. (1) 99, Barabasi and Albert 99].In our second set of experiments we studied the directed and undirected connected
components of the web. We show that power laws also arise in the distribution of sizes of these connected components. Finally, in our third set of experiments, we performed a number of breadth-first searches from randomly-chosen start nodes. We detail these experiments inthe section describing our experiments and results.
Our analysis reveals an interesting picture (Figure 9) of the web's macroscopic structure.Most (over 90%) of the approximately 203 million nodes in our May 1999 crawl form a singleconnected component if links are treated as undirected edges. This connected web breaksnaturally into four pieces. The first piece is a central core, all of whose pages can reach oneanother along directed links -- this "giant strongly connected component" (SCC ) is at the heart
Page 2 of 19www9 paper
3/6/2003http://www.feralcows.org/tomkins/papers/www9/www9.html

8/8/2019 Graph Structure in Web (Broder)
http://slidepdf.com/reader/full/graph-structure-in-web-broder 3/19
of the web. The second and third pieces are called IN and OUT . IN consists of pages thatcan reach the SCC , but cannot be reached from it - possibly new sites that people have not yetdiscovered and linked to. OUT consists of pages that are accessible from the SCC , but do notlink back to it, such as corporate websites that contain only internal links. Finally, theTENDRILS contain pages that cannot reach the SCC, and cannot be reached from the SCC .Perhaps the most surprising fact is that the size of the SCC is relatively small -- it comprisesabout 56 million pages. Each of the other three sets contain about 44 million pages -- thus, all
four sets have roughly the same size.
We show that the diameter of the central core (SCC ) is at least 28, and that the diameter of the graph as a whole is over 500 (see below for definitions of diameter). We show that for randomly chosen source and destination pages, the probability that any path exists from thesource to the destination is only 24%. We also show that, if a directed path exists, its averagelength will be about 16. Likewise, if an undirected path exists (i.e., links can be followedforwards or backwards), its average length will be about 6. These analyses appear in thesection on interpreting our experiments. These results are remarkably consistent across twodifferent, large AltaVista crawls. This suggests that our results are relatively insensitive to theparticular crawl we use, provided it is large enough. We will say more about crawl effects
under Other Observations.
In a sense the web is much like a complicated organism, in which the local structure at amicroscopic scale looks very regular like a biological cell, but the global structure exhibitsinteresting morphological structure (body and limbs) that are not obviously evident in the localstructure. Therefore, while it might be tempting to draw conclusions about the structure of theweb graph from a local picture of it, such conclusions may be misleading.
Related prior work
Broadly speaking, related prior work can be classified into two groups: (1) observations of the
power law distributions on the web; and (2) work on applying graph theoretic methods to theweb.
Zipf-Pareto-Yule and Power laws. Distributions with an inverse polynomial tail have beenobserved in a number of contexts. The earliest observations are due to Pareto [Pareto 1897] inthe context of economic models. Subsequently, these statistical behaviors have beenobserved in the context of literary vocabulary [Yule 44], sociological models [Zipf 49], and evenoligonucleotide sequences [Martindale and Konopka 96] among others. Our focus is on theclosely related power law distributions, defined on the positive integers, with the probability of
the value i being proportional to 1/i k for a small positive number k . Perhaps the first rigorouseffort to define and analyze a model for power law distributions is due to Herbert Simon [ Simon
55].
More recently, power law distributions have been observed in various aspects of the web.Two lines of work are of particular interest to us. First, power laws have been found tocharacterize user behavior on the web in two related but dual forms:
1. Access statistics for web pages, which can be easily obtained from server logs (but for caching effects);see [Glassman 97, Huberman et. al. 98, Adamic and Huberman (1) 99, and Adamic and Huberman (2)99].
2. Numbers of times users at a single site access particular pages, as verified by instrumenting andinspecting logs from web caches, proxies, and clients (see [Barford et. al. 99] and references therein, as
Page 3 of 19www9 paper
3/6/2003http://www.feralcows.org/tomkins/papers/www9/www9.html

8/8/2019 Graph Structure in Web (Broder)
http://slidepdf.com/reader/full/graph-structure-in-web-broder 4/19
well as [Lukose and Huberman 98]).
Second, and more relevant to our immediate context, is the distribution of degrees on the webgraph. In this context, recent work (see Kumar et. al. (1) 99, Barabasi and Albert 99) suggeststhat both the in- and the out-degrees of vertices on the web graph have power laws. Thedifference in scope in these two experiments is noteworthy. The first (Kumar et. al. (1) 99)examines a web crawl from 1997 due to Alexa, Inc., with a total of over 40 million nodes. The
second (Barabasi and Albert 99), examines web pages from the University of Notre Damedomain, *.nd.edu, as well as a portion of the web reachable from 3 other URLs. In this paper,we verify these power laws on more recent (and considerably larger) web crawls. Thiscollection of findings reveals an almost fractal like quality for the power law in-degree and out-degree distributions, in that it appears both as a macroscopic phenomenon on the entire web,as a microscopic phenomenon at the level of a single university website, and at intermediatelevels between these two.
There is no evidence that users' browsing behavior, access statistics and the linkagestatistics on the web graph are related in any fundamental way, although it is very tempting toconjecture that this is indeed the case. It is usually the case, though not always so, that pages
with high in-degree will also have high PageRank [Brin and Page 98]. Indeed, one way of viewing PageRank is that it puts a number on how easy (or difficult) it is to find particular pagesby a browsing-like activity. Consequently, it is plausible that the in-degree distributions inducea similar distribution on browsing activity and consequently, on access statistics.
Faloutsos, Faloutsos, and Faloutsos 99 observe Zipf/Pareto distributions (power lawdistributions on the ranks of values) on the internet network topology using a graph of thenetwork obtained from the routing tables of a backbone BGP router.
Graph theoretic methods. Much recent work has addressed the web as a graph andapplied algorithmic methods from graph theory in addressing a slew of search, retrieval, and
mining problems on the web. The efficacy of these methods was already evident even in earlylocal expansion techniques [Butafogo and Schneiderman 91]. Since then, the increasingsophistication of the techniques used, the incorporation of graph theoretical methods with bothclassical and new methods which examine context and content, and richer browsingparadigms have enhanced and validated the study and use of such methods. FollowingButafogo and Schneiderman, the view that connected and strongly connected componentsrepresent meaningful entities has become accepted. [Pirolli, Pitkow and Rao 96] augmentgraph theoretic analysis to include document content, as well as usage statistics, resulting in arich understanding of domain structure and a taxonomy of roles played by web pages.
Graph theoretic methods have been used for search [Kleinberg 97, Brin and Page 98,Chakrabarti et. al. (1) 98, Chakrabarti et. al. (2) 98, Bharat and Henzinger 98], browsing and
information foraging [Butafogo and Schniederman 91, Pirolli, Pitkow, and Rao 96, Carierre andKazman 97, Pitkow and Pirolli 97, Chakrabarti, Gibson, and McCurley 99], and web mining[Mendelzon and Wood 95, Mendelzon, Mihaila, and Milo 97, Kumar et. al. (1) 99, Kumar et. al. (2) 99]. We expect that a better structural characterization of the web will have much to say ineach of these contexts.
In this section we formalize our view of the web as a graph; in this view we ignore the textand other content in pages, focusing instead on the links between pages. Adopting theterminology of graph theory [Harary], we refer to pages as nodes, and to links as arcs. In this
Page 4 of 19www9 paper
3/6/2003http://www.feralcows.org/tomkins/papers/www9/www9.html
8/8/2019 Graph Structure in Web (Broder)
http://slidepdf.com/reader/full/graph-structure-in-web-broder 5/19
framework, the web becomes a large graph containing several hundred million nodes, and afew billion arcs. We will refer to this graph as the web graph, and our goal in this paper is tounderstand some of its properties. Before presenting our model for web-like graphs, we beginwith a brief primer on graph theory, and a discussion of graph models in general.
A brief primer on graphs and terminology
The reader familiar with basic notions from graph theory may skip this primer.
A directed graph consists of a set of nodes, denoted V and a set of arcs, denoted E . Eacharc is an ordered pair of nodes (u,v) representing a directed connection from u to v . The out-degree of a node u is the number of distinct arcs (u,v 1 )...(u,v k ) (i.e., the number of links from
u ), and the in-degree is the number of distinct arcs (v 1,u)...(v k ,u) (i.e., the number of links to
u ). A path from node u to node v is a sequence of arcs (u,u 1 ), (u 1,u 2 ), ... (u k ,v). One can follow
such a sequence of arcs to "walk" through the graph from u to v . Note that a path from u to v does not imply a path from v to u . The distance from u to v is one more than the smallest k for which such a path exists. If no path exists, the distance from u to v is defined to be infinity. If
(u,v ) is an arc, then the distance from u to v is 1.
Given a directed graph, a strongly connected component (strong component for brevity) of this graph is a set of nodes such that for any pair of nodes u and v in the set there is a pathfrom u to v . In general, a directed graph may have one or many strong components. Thestrong components of a graph consist of disjoint sets of nodes. One focus of our studies will bein understanding the distribution of the sizes of strong components on the web graph.
An undirected graph consists of a set of nodes and a set of edges, each of which is anunordered pair {u,v } of nodes. In our context, we say there is an edge between u and v if thereis a link between u and v, without regard to whether the link points from u to v or the other way
around. The degree of a node u is the number of edges incident to u . A path is defined as for directed graphs, except that now the existence of a path from u to v implies a path from v to u .A component of an undirected graph is a set of nodes such that for any pair of nodes u and v in the set there is a path from u to v. We refer to the components of the undirected graphobtained from a directed graph by ignoring the directions of its arcs as the weak components of the directed graph. Thus two nodes on the web may be in the same weak component eventhough there is no directed path between them (consider, for instance, a node u that points totwo other nodes v and w; thenv and w are in the same weak component even though theremay be no sequence of links leading from v to w or vice versa). The interplay of strong andweak components on the (directed) web graph turns out to reveal some unexpected propertiesof the web's connectivity.
A breadth-first search (BFS) on a directed graph begins at a node u of the graph, andproceeds to build up the set of nodes reachable from u in a series of layers. Layer 1 consistsof all nodes that are pointed to by an arc from u. Layer k consists of all nodes to which there isan arc from some vertex in layer k-1, but are not in any earlier layer. Notice that by definition,layers are disjoint. The distance of any node from u can be read out of the breadth-firstsearch. The shortest path from u to v is the index of the layer v belongs in -- if there is such alayer. On the other hand, note that a node that cannot be reached from u does not belong inany layer, and thus we define the distance to be infinity. A BFS on an undirected graph isdefined analogously.
Page 5 of 19www9 paper
3/6/2003http://www.feralcows.org/tomkins/papers/www9/www9.html
8/8/2019 Graph Structure in Web (Broder)
http://slidepdf.com/reader/full/graph-structure-in-web-broder 6/19
Finally, we must take a moment to describe the exact notions of diameter we study, sinceseveral have been discussed informally in the context of the web. Traditionally, the diameter of a graph, directed or undirected, is the maximum over all ordered pairs (u,v) of the shortestpath from u to v . Some researchers have proposed studying the average distance of a graph,defined to be the length of the shortest path from u to v , averaged over all ordered pairs (u,v);this is referred to as diameter in [Albert, Jeong, and Barabasi 99]. The difficulty with this notionis that even a single pair (u,v) with no path from u to v results in an infinite average distance.
In fact, as we show from our experiments below, the web is rife with such pairs (thus it is notmerely a matter of discarding a few outliers before taking this average). This motivates thefollowing revised definition: let P be the set of all ordered pairs (u,v) such that there is a pathfrom u to v . The average connected distance is the expected length of the shortest path,where the expectation is over uniform choices from P.
Experiments and results
Infrastructure
All experiments were run using the Connectivity Server 2 (CS2) software built at CompaqSystems Research Center using data provided by AltaVista. CS2 provides fast access tolinkage information on the web. A build of CS2 takes a web crawl as input and creates arepresentation of the entire web graph induced by the pages in the crawl, in the form of adatabase that consists of all URLs that were crawled together with all in-links and out-linksamong those URLs. In addition, the graph is extended with those URLs referenced at least 5times by the crawled pages. (Experimentally, we have determined that the vast majority of URLs encountered fewer than five times but not crawled turn out to be invalid URLs.)
CS2 improves on the original connectivity server (CS1) described in [Bharat et. al. 98] in twoimportant ways. First, it significantly increases the compression of the URLs and the links data
structures. In CS1, each compressed URL is, on average, 16 bytes. In CS2, each URL isstored in 10 bytes. In CS1, each link requires 8 bytes to store as both an in-link and out-link; inCS2, an average of only 3.4 bytes are used. Second, CS2 provides additional functionality inthe form of a host database. For example, in CS2, it is easy to get all the in-links for a givennode, or just the in-links from remote hosts.
Like CS1, CS2 is designed to give high-performance access to all this data on a high-endmachine with enough RAM to store the database in memory. On a 465 MHz Compaq
AlphaServer 4100 with 12GB of RAM, it takes 70-80 µs to convert a URL into an internal id or
vice versa, and then only 0.15 µs/link to retrieve each in-link or out-link. On a uniprocessor machine, a BFS that reaches 100 million nodes takes about 4 minutes; on a 2-processor
machine we were able complete a BFS every two minutes.
In the experiments reported in this paper, CS2 was built from a crawl performed at AltaVistain May, 1999. The CS2 database contains 203 million URLs and 1466 million links (all of whichfit in 9.5 GB of storage). Some of our experiments were repeated on a more recent crawl fromOctober, 1999 containing 271 million URLs and 2130 million links.
In general, the AltaVista crawl is based on a large set of starting points accumulated over time from various sources, including voluntary submissions. The crawl proceeds in roughly aBFS manner, but is subject to various rules designed to avoid overloading web servers, avoid
Page 6 of 19www9 paper
3/6/2003http://www.feralcows.org/tomkins/papers/www9/www9.html

8/8/2019 Graph Structure in Web (Broder)
http://slidepdf.com/reader/full/graph-structure-in-web-broder 7/19
robot traps (artificial infinite paths), avoid and/or detect spam (page flooding), deal withconnection time outs, etc. Each build of the AltaVista index is based on the crawl data after further filtering and processing designed to remove duplicates and near duplicates, eliminatespam pages, etc. Then the index evolves continuously as various processes delete deadlinks, add new pages, update pages, etc. The secondary filtering and the later deletions andadditions are not reflected in the connectivity server. But overall, CS2's database can beviewed as a superset of all pages stored in the index at one point in time. Note that due to the
multiple starting points, it is possible for the resulting graph to have many connectedcomponents.
Experimental data
The following basic algorithms were implemented using CS2: (1) a BFS algorithm thatperforms a breadth-first traversal; (2) a WCC algorithm that finds the weak components; and(3) an SCC algorithm that finds the strongly connected components. Recall that both WCC andSCC are simple generalizations of the BFS algorithm. Using these three basic algorithms, weran several interesting experiments on the web graph.
Degree distributions. The first experiment we ran was to verify earlier observations thatthe in- and out-degree distributions on the web are distributed according to power laws. Weran the experiment on both the May and October crawls of the web. The results, shown inFigure 1, show remarkable agreement with each other, and with similar experiments from datathat is over two years old [Kumar et. al. (1) 99]. Indeed, in the case of in-degree, the exponentof the power law is consistently around 2.1, a number reported in [Kumar et. al. (1) 99,Barabasi and Albert 99]. The anomalous bump at 120 on the x -axis is due to a large cliqueformed by a single spammer. In all our log-log plots, straight lines are linear regressions for the best power law fit.
Out-degree distributions also exhibit a power law, although the exponent is 2.72, as can be
seen in Figure 2. It is interesting to note that the initial segment of the out-degree distributiondeviates significantly from the power law, suggesting that pages with low out-degree follow adifferent (possibly Poisson or a combination of Poisson and power law, as suggested by theconcavity of the deviation) distribution. Further research is needed to understand thiscombination better.
Page 7 of 19www9 paper
3/6/2003http://www.feralcows.org/tomkins/papers/www9/www9.html

8/8/2019 Graph Structure in Web (Broder)
http://slidepdf.com/reader/full/graph-structure-in-web-broder 8/19
Undirected connected components. In the next set of experiments we treat the webgraph as an undirected graph and find the sizes of the undirected components. We find agiant component of 186 million nodes in which fully 91% of the nodes in our crawl arereachable from one another by following either forward or backward links. This is done byrunning the WCC algorithm which simply finds all connected components in the undirectedweb graph. Thus, if one could browse along both forward and backward directed links, the webis a very well connected graph. Surprisingly, even the distribution of the sizes of WCC's
exhibits a power law with exponent roughly 2.5 (Figure 5).
Does this widespread connectivity result from a few nodes of large in-degree acting as"junctions"? Surprisingly, this turns out not to be the case. Indeed, even if all links to pages
Figures 1 and 2: In-degree and out-degree distributions subscribe to the power law. The lawalso holds if only off-site (or "remote-only") edges are considered.
Figures 3 and 4: In- and out-degree distributions show a remarkable similarity over twocrawls, run in May and October 1999. Each crawl counts well over 1 billion distinct edges of
the web graph.
Figures 5 and 6: Distribution of weakly connected components and strongly connectedcomponents on the web. The sizes of these components also follow a power law.
Page 8 of 19www9 paper
3/6/2003http://www.feralcows.org/tomkins/papers/www9/www9.html
8/8/2019 Graph Structure in Web (Broder)
http://slidepdf.com/reader/full/graph-structure-in-web-broder 9/19
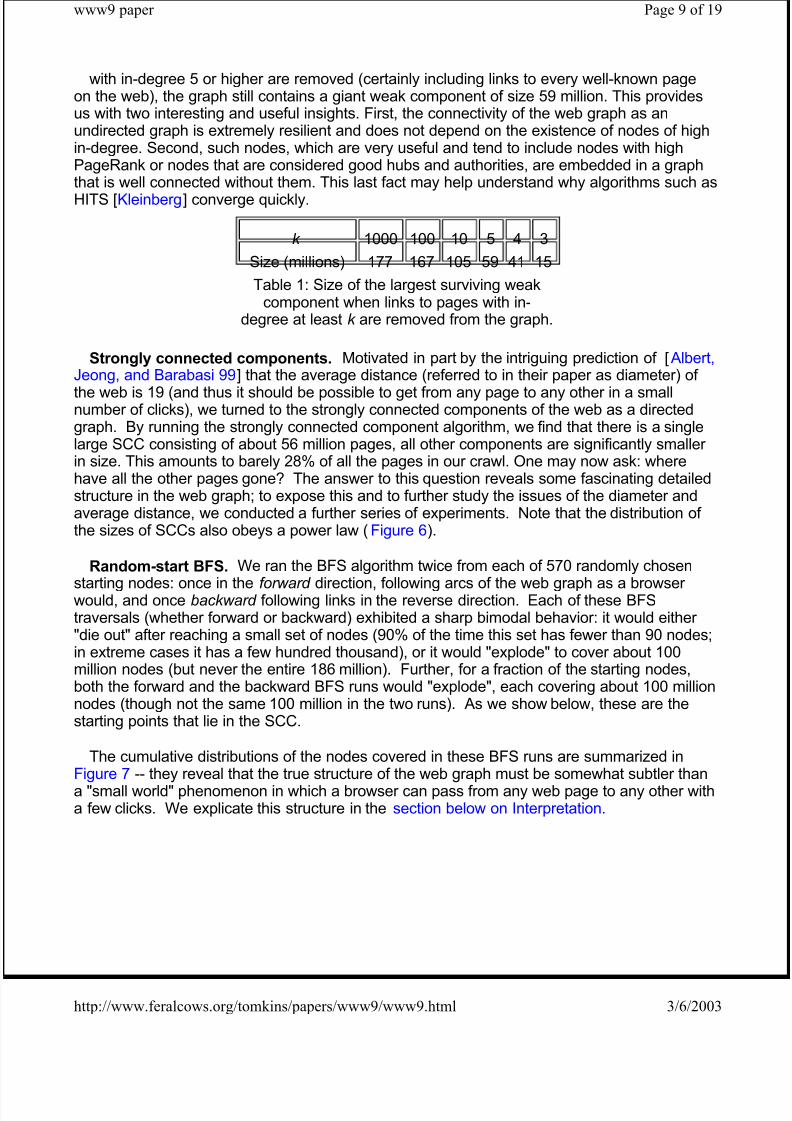
with in-degree 5 or higher are removed (certainly including links to every well-known pageon the web), the graph still contains a giant weak component of size 59 million. This providesus with two interesting and useful insights. First, the connectivity of the web graph as anundirected graph is extremely resilient and does not depend on the existence of nodes of highin-degree. Second, such nodes, which are very useful and tend to include nodes with highPageRank or nodes that are considered good hubs and authorities, are embedded in a graphthat is well connected without them. This last fact may help understand why algorithms such as
HITS [Kleinberg] converge quickly.
Strongly connected components. Motivated in part by the intriguing prediction of [Albert,Jeong, and Barabasi 99] that the average distance (referred to in their paper as diameter) of
the web is 19 (and thus it should be possible to get from any page to any other in a smallnumber of clicks), we turned to the strongly connected components of the web as a directedgraph. By running the strongly connected component algorithm, we find that there is a singlelarge SCC consisting of about 56 million pages, all other components are significantly smaller in size. This amounts to barely 28% of all the pages in our crawl. One may now ask: wherehave all the other pages gone? The answer to this question reveals some fascinating detailedstructure in the web graph; to expose this and to further study the issues of the diameter andaverage distance, we conducted a further series of experiments. Note that the distribution of the sizes of SCCs also obeys a power law (Figure 6).
Random-start BFS. We ran the BFS algorithm twice from each of 570 randomly chosen
starting nodes: once in the forward direction, following arcs of the web graph as a browser would, and once backward following links in the reverse direction. Each of these BFStraversals (whether forward or backward) exhibited a sharp bimodal behavior: it would either "die out" after reaching a small set of nodes (90% of the time this set has fewer than 90 nodes;in extreme cases it has a few hundred thousand), or it would "explode" to cover about 100million nodes (but never the entire 186 million). Further, for a fraction of the starting nodes,both the forward and the backward BFS runs would "explode", each covering about 100 millionnodes (though not the same 100 million in the two runs). As we show below, these are thestarting points that lie in the SCC.
The cumulative distributions of the nodes covered in these BFS runs are summarized inFigure 7 -- they reveal that the true structure of the web graph must be somewhat subtler thana "small world" phenomenon in which a browser can pass from any web page to any other witha few clicks. We explicate this structure in the section below on Interpretation.
k 1000 100 10 5 4 3
Size (millions) 177 167 105 59 41 15
Table 1: Size of the largest surviving weakcomponent when links to pages with in-
degree at least k are removed from the graph.
Page 9 of 19www9 paper
3/6/2003http://www.feralcows.org/tomkins/papers/www9/www9.html

8/8/2019 Graph Structure in Web (Broder)
http://slidepdf.com/reader/full/graph-structure-in-web-broder 10/19
Zipf distributions vs power law distributions. The Zipf distribution is an inversepolynomial function of ranks rather than magnitudes -- for example, if only in-degrees 1, 4, and5 occurred then a power law would be inversely polynomial in those values, whereas a Zipf distribution would be inversely polynomial in the ranks of those values: i.e., inverselypolynomial in 1, 2, and 3. The in-degree distribution in our data shows a striking fit with a Zipf (more so than the power law) distribution; Figure 8 shows the in-degrees of pages from theMay 1999 crawl plotted against both ranks and magnitudes (corresponding to the Zipf and
power law cases). The plot against ranks is virtually a straight line in the log-log plot, withoutthe flare-out noticeable in the plot against magnitudes.
Figure 7: Cumulative distribution on the number of nodes reached when BFS is started from arandom node. Figure (a) follows in-links, (b) follows out-links, and (c) follows both in and out
links. Notice that there are two distinct regions of growth, one at the beginning and an"explosion" in 50 % of the start nodes in the case of in- and out-links, and for 90% of the
nodes in the undirected case. These experiments form the basis of our structural analysis.
Page 10 of 19www9 paper
3/6/2003http://www.feralcows.org/tomkins/papers/www9/www9.html

8/8/2019 Graph Structure in Web (Broder)
http://slidepdf.com/reader/full/graph-structure-in-web-broder 11/19
Interpretation and further work
Let us now put together the results of the connected component experiments with the resultsof the random-start BFS experiments. Given that the set SCC contains only 56 million of the186 million nodes in our giant weak component, we use the BFS runs to estimate the positionsof the remaining nodes. The starting points for which the forward BFS "explodes" are either inSCC, or in a set we call IN, that has the following property: there is a directed path from eachnode of IN to (all the nodes of) SCC. Symmetrically, there is a set we call OUT containing allstarting points for which the backward BFS "explodes"; there is a directed path from any nodein the SCC to every node in OUT. Thus a forward BFS from any node in either the SCC or INwill explode, as will a backward BFS from any node in either the SCC or OUT. By analyzingforward and backward BFS from 570 random starting points, we can compute the number of nodes that are in SCC, IN, OUT or none of these. Figure 9 shows the situation as we can now
infer it.
Figure 8: In-degree distributions plotted as apower law and as a Zipf distribution.
Page 11 of 19www9 paper
3/6/2003http://www.feralcows.org/tomkins/papers/www9/www9.html

8/8/2019 Graph Structure in Web (Broder)
http://slidepdf.com/reader/full/graph-structure-in-web-broder 12/19
We now give a more detailed description of the structure in Figure 9. The sizes of thevarious components are as follows:
These sizes were determined as follows. We know the total number of nodes in our crawl,so by subtracting the size of the giant weak component we determine the size of DISCONNECTED. Then our strong component algorithm gives us the size of SCC. We turn
to our breadth-first search data. As noted, searching from a particular start node following aparticular type of edges (in-edges or out-edges) would either terminate quickly, or grow thesearch to about 100 million nodes. We say that a node explodes if it falls into the latter group.Thus, if a node explodes following in-links, and also explodes following out-links, it must be amember of a strong component of size at least 100+100-186=14 million. Since the secondlargest strong component is of size 150 thousand, we infer that SCC is the unique strongcomponent that contains all nodes exploding following in- as well as out-links. In fact, thisobservation contains two corroborating pieces of evidence for the structure in the figure above:first, it turns out that the fraction of our randomly chosen BFS start nodes that explode under in- and out-links is the same as the fraction of nodes in the SCC as returned by our SCC
Figure 9: Connectivity of the web: one can pass from any node of INthrough SCC to any node of OUT. Hanging off IN and OUT areTENDRILS containing nodes that are reachable from portions of IN, or that can reach portions of OUT, without passage through SCC. It ispossible for a TENDRIL hanging off from IN to be hooked into aTENDRIL leading into OUT, forming a TUBE -- a passage from a portionof IN to a portion of OUT without touching SCC.
Region SCC IN OUT TENDRILS DISC. Total
Size 56,463,993 43,343,168 43,166,185 43,797,944 16,777,756 203,549,046
Page 12 of 19www9 paper
3/6/2003http://www.feralcows.org/tomkins/papers/www9/www9.html
8/8/2019 Graph Structure in Web (Broder)
http://slidepdf.com/reader/full/graph-structure-in-web-broder 13/19
algorithm. Second, every BFS start node in the SCC reaches exactly the same number of nodes under in-link expansion -- this number is 99,807,161. Likewise, under out-linkexpansion every node of SCC reaches exactly 99,630,178 nodes.
Thus, we know that SCC + IN = 99,807,161, and similarly SCC + OUT = 99,630,178.Having already found the size of SCC, we can solve for IN and OUT. Finally, since we knowthe size of the giant weak component, we can subtract SCC, IN, and OUT to get TENDRILS.
We now discuss each region in turn.
TENDRILS and DISCONNECTED
We had 172 samples from TENDRILS and DISCONNECTED; our BFS measurements cannotbe used to differentiate between these two regions. By following out-links from a start point inthis region, we encounter an average of 20 nodes before the exploration stops. Likewise, byfollowing in-links we encounter an average of 52 nodes.
IN and OUT
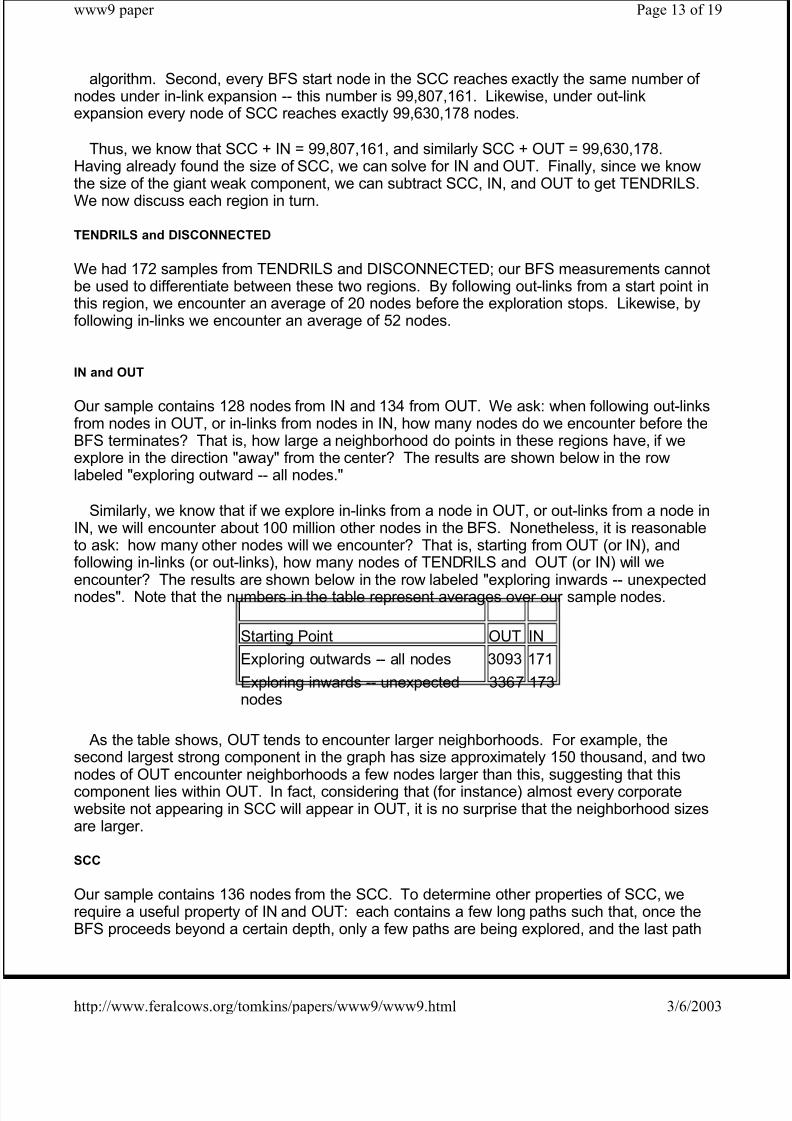
Our sample contains 128 nodes from IN and 134 from OUT. We ask: when following out-linksfrom nodes in OUT, or in-links from nodes in IN, how many nodes do we encounter before theBFS terminates? That is, how large a neighborhood do points in these regions have, if weexplore in the direction "away" from the center? The results are shown below in the rowlabeled "exploring outward -- all nodes."
Similarly, we know that if we explore in-links from a node in OUT, or out-links from a node inIN, we will encounter about 100 million other nodes in the BFS. Nonetheless, it is reasonableto ask: how many other nodes will we encounter? That is, starting from OUT (or IN), andfollowing in-links (or out-links), how many nodes of TENDRILS and OUT (or IN) will weencounter? The results are shown below in the row labeled "exploring inwards -- unexpectednodes". Note that the numbers in the table represent averages over our sample nodes.
As the table shows, OUT tends to encounter larger neighborhoods. For example, thesecond largest strong component in the graph has size approximately 150 thousand, and twonodes of OUT encounter neighborhoods a few nodes larger than this, suggesting that thiscomponent lies within OUT. In fact, considering that (for instance) almost every corporatewebsite not appearing in SCC will appear in OUT, it is no surprise that the neighborhood sizesare larger.
SCC
Our sample contains 136 nodes from the SCC. To determine other properties of SCC, werequire a useful property of IN and OUT: each contains a few long paths such that, once theBFS proceeds beyond a certain depth, only a few paths are being explored, and the last path
Starting Point OUT IN
Exploring outwards -- all nodes 3093 171
Exploring inwards -- unexpectednodes
3367 173
Page 13 of 19www9 paper
3/6/2003http://www.feralcows.org/tomkins/papers/www9/www9.html

8/8/2019 Graph Structure in Web (Broder)
http://slidepdf.com/reader/full/graph-structure-in-web-broder 14/19
is much longer than any of the others. We can therefore explore the radius at which the BFScompletes, confident that the last long path will be the same no matter which node of SCC westart from. The following figure shows the depth at which the BFS terminates in each direction(following in-links or out-links) for nodes in the SCC:
As the table shows, from some nodes in the SCC it is possible to complete the search atdistance 475, while from other nodes distance 503 is required. This allows us to conclude thatthe directed diameter of SCC is at least 28.
Other observations
As noted above, the (min, average, max) depths at which the BFS from SCC terminatesfollowing in-links are (475, 482, 503). For IN, we can perform the same analysis, and the
values are: (476, 482, 495). These values, especially the average, are so similar that nodes of IN appear to be quite close to SCC.
Likewise, for SCC the (min, average, max) depths for termination under out-links are (430,434, 444). For OUT, the values are (430, 434, 444).
Now, consider the probability that an ordered pair (u,v) has a path from u to v . By notingthat the average in-size of nodes in IN is very small (171) and likewise the average out-size of nodes in OUT is very small (3093), the pair has a path with non-negligible probability if andonly if u is in SCC+IN, and v is in SCC+OUT. The probability of this event for node pairsdrawn uniformly from our crawl is only 24%; for node pairs drawn from the weak component it
is only 28%. This leads to the somewhat surprising conclusion that, given a random start andfinish page on the web, one can get from the start page to the finish page by traversing linksbarely a quarter of the time.
The structure that is now unfolding tells us that it is relatively insensitive to the particular large crawl we use. For instance, if AltaVista's crawler fails to include some links whoseinclusion would add one of the tendrils to the SCC, we know that the resulting change in thesizes of SCC and TENDRIL will be small (since any individual tendril is small). Likewise, our experiments in which we found that large components survived the deletion of nodes of largein-degree show that the connectivity of the web is resilient to the removal of significantportions.
Diameter and average connected distance
As we discussed above, the directed diameter of the SCC is at least 28. Likewise, themaximum finite shortest path length is at least 503, but is probably substantially more thanthis: unless a short tube connects the most distant page of IN to the most distant page of OUTwithout passing through the SCC, the maximum finite shortest path length is likely to be closeto 475 + 430 = 905.
We can estimate the average connected distance using our 570 BFS start points, under both
Measure Minimum depth Average depth Maximum depth
In-links 475 482 503Out-links 430 434 444
Page 14 of 19www9 paper
3/6/2003http://www.feralcows.org/tomkins/papers/www9/www9.html

8/8/2019 Graph Structure in Web (Broder)
http://slidepdf.com/reader/full/graph-structure-in-web-broder 15/19
in-links and out-links. The values are shown below; the column headed "Undirected"corresponds to the average undirected distance.
These results are in interesting contrast to those of [Albert, Jeong, and Barabasi 99], whopredict an average distance of 19 for the web based on their crawl of the nd.edu site; it isunclear whether their calculations consider directed or undirected distances. Our results onthe other hand show that over 75% of time there is no directed path from a random start nodeto a random finish node; when there is a path, the figure is roughly 16. However, if links can betraversed in either direction, the distance between random pairs of nodes can be muchsmaller, around 7, on average.
Further work
Further work can be divided into three broad classes:
1. More experiments aimed at exposing further details of the structures of SCC, IN, OUT, and theTENDRILS . Would this basic structure, and the relative fractions of the components, remain stable over time?
2. Mathematical models for evolving graphs, motivated in part by the structure of the web; in addition, onemay consider the applicability of such models to other large directed graphs such as the phone-call graph,purchase/transaction graphs, etc.
3. What notions of connectivity (besides weak and strong) might be appropriate for the web graph? For instance, what is the structure of the undirected graph induced by the co-citation relation or by bibliographiccoupling [White and McCain89].
Acknowledgment. We thank Keith Randall for his insights into our SCC algorithm andimplementation.
References
Adamic and Huberman (1) 99. L. Adamic and B. Huberman. The nature of markets on the World WideWeb, Xerox PARC Technical Report, 1999.
Adamic and Huberman (2) 99. L. Adamic and B. Huberman. Scaling behavior on the World Wide Web, Technical comment on Barabasi and Albert 99.
Aiello, Chung, and Lu 00. W. Aiello, F. Chung and L. Lu. A random graph model for massive graphs, ACM Symposium on the Theory and Computing 2000.
Albert, Jeong, and Barabasi 99. R. Albert, H. Jeong, and A.-L. Barabasi. Diameter of the World WideWeb, Nature 401:130-131, Sep 1999.
Barabasi and Albert 99. A. Barabasi and R. Albert. Emergence of scaling in random networks, Science,286(509), 1999.
Barford et. al. 99. P. Barford, A. Bestavros, A. Bradley, and M. E. Crovella. Changes in Web client access patterns: Characteristics and caching implications, in World Wide Web, Special Issue on Characterizationand Performance Evaluation, 2:15-28, 1999.
Bharat et. al. 98. K. Bharat, A. Broder, M. Henzinger, P. Kumar, and S. Venkatasubramanian. Theconnectivity server: fast access to linkage information on the web, Proc. 7th WWW, 1998.
Edge type In-links(directed)
Out-links(directed)
Undirected
Average connected
distance
16.12 16.18 6.83
Page 15 of 19www9 paper
3/6/2003http://www.feralcows.org/tomkins/papers/www9/www9.html

8/8/2019 Graph Structure in Web (Broder)
http://slidepdf.com/reader/full/graph-structure-in-web-broder 16/19
Bharat and Henzinger 98. K. Bharat, and M. Henzinger. Improved algorithms for topic distillation inhyperlinked environments, Proc. 21st SIGIR, 1998.
Brin and Page 98. S. Brin, and L. Page. The anatomy of a large scale hypertextual web search engine,Proc. 7th WWW, 1998.
Butafogo and Schniederman 91. R. A. Butafogo and B. Schneiderman. Identifying aggregates inhypertext structures, Proc. 3rd ACM Conference on Hypertext, 1991.
Carriere and Kazman 97. J. Carriere, and R. Kazman. WebQuery: Searching and visualizing the Webthrough connectivity
, Proc. 6th WWW, 1997. Chakrabarti et. al. (1) 98. S. Chakrabarti, B. Dom, D. Gibson, J. Kleinberg, P. Raghavan, and S.
Rajagopalan. Automatic resource compilation by analyzing hyperlink structure and associated text, Proc.7th WWW, 1998.
Chakrabarti et. al. (2) 98. S. Chakrabarti, B. Dom, D. Gibson, S. Ravi Kumar, P. Raghavan, S.Rajagopalan, and A. Tomkins. Experiments in topic distillation, Proc. ACM SIGIR workshop on HypertextInformation Retrieval on the Web, 1998.
Chakrabarti, Gibson, and McCurley 99. S. Chakrabarti, D. Gibson, and K. McCurley.Surfing the Webbackwards, Proc. 8th WWW, 1999.
Cho and Garcia-Molina 2000 J. Cho, H. Garcia-Molina Synchronizing a database to Improve Freshness.To appear in 2000 ACM International Conference on Management of Data (SIGMOD), May 2000.
Faloutsos, Faloutsos, and Faloutsos 99. M. Faloutsos, P. Faloutsos, and C. Faloutsos. On power law relationships of the internet topology, ACM SIGCOMM, 1999.
Glassman 94. S. Glassman. A caching relay for the world wide web, Proc. 1st WWW, 1994.Harary 75. F. Harary. Graph Theory, Addison Wesley, 1975.
Huberman et. al. 98. B. Huberman, P. Pirolli, J. Pitkow, and R. Lukose. Strong regularities in World WideWeb surfing , Science, 280:95-97, 1998.
Kleinberg 98. J. Kleinberg. Authoritative sources in a hyperlinked environment, Proc. 9th ACM-SIAMSODA, 1998.
Kumar et. al. (1) 99. R. Kumar, P. Raghavan, S. Rajagopalan, and A. Tomkins. Trawling the Web for cyber communities, Proc. 8th WWW , Apr 1999.
Kumar et. al. (2) 99. R. Kumar, P. Raghavan, S. Rajagopalan, and A. Tomkins. Extracting large scaleknowledge bases from the Web, Proc. VLDB, Jul 1999.
Lukose and Huberman 98. R. M. Lukose and B. Huberman. Surfing as a real option, Proc. 1stInternational Conference on Information and Computation Economies, 1998.
Martindale and Konopka 96. C. Martindale and A K Konopka. Oligonucleotide frequencies in DNA follow a Yule distribution, Computer & Chemistry, 20(1):35-38, 1996.
Mendelzon, Mihaila, and Milo 97. A. Mendelzon, G. Mihaila, and T. Milo. Querying the World Wide Web, Journal of Digital Libraries 1(1), pp. 68-88, 1997.
Mendelzon and Wood 95. A. Mendelzon and P. Wood. Finding regular simple paths in graph databases, SIAM J. Comp. 24(6):1235-1258, 1995.
Pareto 1897. V Pareto. Cours d'economie politique, Rouge, Lausanne et Paris, 1897.
Pirolli, Pitkow, and Rao 96. P. Pirolli, J. Pitkow, and R. Rao. Silk from a sow's ear: Extracting usablestructures from the Web, Proc. ACM SIGCHI, 1996.
Pitkow and Pirolli 97. J. Pitkow and P. Pirolli. Life, death, and lawfulness on the electronic frontier, Proc.ACM SIGCHI, 1997.
Simon 55. H.A. Simon. On a class of stew distribution functions, Biometrika, 42:425-440, 1955.
White and McCain 89. H.D. White and K.W. McCain, Bibliometrics, in: Ann. Rev. Info. Sci. and
Technology, Elsevier, 1989, pp. 119-186.
Yule 44. G.U. Yule. Statistical Study of Literary Vocabulary, Cambridge University Press, 1944.
Zipf 49. G.K. Zipf. Human Behavior and the Principle of Least Effort, Addison-Wesley, 1949.
Page 16 of 19www9 paper
3/6/2003http://www.feralcows.org/tomkins/papers/www9/www9.html

8/8/2019 Graph Structure in Web (Broder)
http://slidepdf.com/reader/full/graph-structure-in-web-broder 17/19
Page 17 of 19www9 paper
3/6/2003http://www.feralcows.org/tomkins/papers/www9/www9.html

8/8/2019 Graph Structure in Web (Broder)
http://slidepdf.com/reader/full/graph-structure-in-web-broder 18/19
Page 18 of 19www9 paper
3/6/2003http://www.feralcows.org/tomkins/papers/www9/www9.html

8/8/2019 Graph Structure in Web (Broder)
http://slidepdf.com/reader/full/graph-structure-in-web-broder 19/19
Page 19 of 19www9 paper