Grant County, New Mexico Target Industry Analysis County...Grant County Target Industry Analysis...
65
Target Industry | 0 Grant County Target Industry Analysis Grant County, New Mexico Target Industry Analysis March 12, 2012
Transcript of Grant County, New Mexico Target Industry Analysis County...Grant County Target Industry Analysis...

Target Industry | 0 Grant County Target Industry Analysis
Grant County, New Mexico
Target Industry Analysis
March 12, 2012

Target Industry | 1 Grant County Target Industry Analysis
Table of
Contents
Introduction…………………………………………………. 2
Executive Summary..…………..…………….…………..... 3
Target Industry Selection Process……………………….. 4
Recommended Target Industries….……………………... 10
Target Industry Profiles…..……………………………….. 15
Natural Resources & Mining….................................... 15
Renewable Energy……...……..……………………….. 23
Regional Goods & Services…………………………… 35
Tourism & Recreation….………………………………... 46
Small Business/Entrepreneurship…..……….....……… 54
Occupations and Competencies…………………………. 56
Conclusion & Next Steps………………………………….. 62
Appendix A – General Methodology and Narrative
Content……………………………………………………… 63
About AngelouEconomics………………………………… 64
Cover Photo Credits: Mary Alice Murphy, Grant County Government
Photo: Mary Alice Murphy

Target Industry | 2 Grant County Target Industry Analysis
Introduction
TARGET INDUSTRY ANALYSIS In January 2012, AngelouEconomics presented the first of three reports that will be delivered to Grant County as part of an economic development strategic plan. The first document, the Market Assessment, provides a broad overview of the demographic and economic trends that are taking place within the County, as well as the many assets that may be drawn upon in efforts to grow the local economy. The Market Assessment also serves as the foundation for future work including this Target Industry report. The Market Assessment provided an assessment of Grant County’s past and current economic conditions. The Target Industry report examines where the Grant County economy might be able to go in the future. Specifically, the Target Industry report draws on a combination of quantitative and qualitative analyses to identify a selection of key industry sectors and niches that are recommended for targeting by the community in its economic development activities.
This report examines the trends and site selection requirements of each recommended target industry. Based on the
analysis completed by the project team and input received from community stakeholders, these target industries
represent the best opportunities for sustained success within Grant County. These target industry recommendations
are firmly rooted in reality as they build upon Grant County’s existing strengths, leverage emerging opportunities within
the region, and support the goals of the community. This report serves as only one component of the current project
and should not be viewed as an economic development plan in and of itself. As with the Market Assessment, future
project phases will build upon the Target Industry report and offer additional strategic recommendations.
•Project Setup & Stakeholder Engagement
Phase 1
Phase 2 •Market Assessment & SWOT Analysis
Phase 3
•Action Plan and Implementation Matrix
Phase 4
•Target Industry Analysis

Target Industry | 3 Grant County Target Industry Analysis
This report highlights a mix of sectors that capitalize on Grant County’s existing clusters, unique assets, location and
infrastructure to strengthen key industries already present within the community, diversify into emerging industries and
capitalize upon short-term and long-term opportunities for the region. Our assessment has drawn upon a combination
of quantitative and qualitative analysis of the economic conditions and industrial trends in Grant County, southwestern
New Mexico, the State of New Mexico, and the United States, and has identified five target industries to be pursued
by the County: Natural Resources & Mining, Renewable Energy, Regional Goods & Services, Tourism & Recreation,
and Small Business & Entrepreneurship.
The report revealed that Grant County has cluster strength in several different industries, some of which are shrinking
nationally, and some of which are growing nationally. In certain cases, a decline nationally in a particular industry may
be symptomatic of industry consolidation in certain areas of the country over others and may not necessarily indicate
a weakening industry. The industries which are growing both nationally and in Grant County include: Natural
Resources & Mining, Public Administration, and Education & Healthcare. Industries that are weak locally, but growing
nationally could represent opportunities for economic development in Grant County. These industries include:
Business & Professional Services and Other Services
This report also identified the specific growing occupations for the target industries selected and then highlighted the
current concentration of these occupations within Grant County. The data provides an understanding of what jobs will
continue to be in demand and how economic and workforce development efforts can support the future economic
development goals through job training and education. Grant County has occupational strength in 11 of the 20 “In-
Demand” occupations within the Natural Resources & Mining industry. The majority of “In-Demand” occupations
within the Renewable Energy industry pay higher than Grant County’s average wage of $32,918, whereas, only five of
the “In-Demand” occupations within the Regional Goods & Services industry pay higher than the average wage.
However, Grant County has occupational strength in half (10 of 20) of the “In-Demand” occupations within the
Tourism & Recreation industry.
By evaluating Grant County’s ability to support these industries and by identifying specific challenges and competitive
advantages, the community will be in a better position to capitalize on the opportunities currently available to it and
become a stronger base from which these industries may operate.
Executive Summary
• How is the target industry defined?
• What are the national and global trends
affecting this target industry?
• How does the target industry relate to Grant
County?
• What are the industry’s site location criteria?
• Which specific industry segments (niches) are
the best fit for Grant County?
• What are the top occupations nationally within
these target industries?
• How does the target industry rate on the Assets
& Liabilities scorecard?
The Target Industry Recommendations
Answer The Following Questions:

Target Industry | 4 Grant County Target Industry Analysis
The development of competitive clusters is a key component of economic development. Clusters develop when
businesses in interrelated industries choose to locate in close proximity to take advantage of a region’s inherent
advantages. These businesses then become interdependent on each other and, in the process, enhance their
operating environments and ultimately becoming more competitive on the global landscape. As this happens,
company profitability rises, wages increase, and the region yields significant benefits.
For this report, we conducted a cluster analysis of Grant County to determine
the relative strength and dominance of industries within the County. These clusters
were analyzed to determine national and local/regional growth trends and assets that
benefit the clusters that were identified. In conjunction with the community vision
identified through an extensive public input process, this analysis provided a basis for
the identification of target industries for Grant County.
TARGET SELECTION PROCESS
The project team employed a combination of quantitative and qualitative analysis
to select the best target industries for the community. Our approach includes four
steps, each acting as a filtering mechanism by which industries are screened for
suitability for Grant County. In many ways, target industry selection is best
described as target industry “elimination.” The accompanying figure illustrates
the project team’s systematic process by which an industry is selected as a target.
The selection of target industries is meant to focus limited economic development
resources on industries that hold the greatest potential for sustained growth, however,
it is important for community leaders to understand that the selection of target
industries should not be viewed as a strategy to ignore all other industries. If Grant County
can successfully grow its targeted industries, many other sectors will benefit throughout
the local economy.
Cluster
Concentration
GRANT COUNTY, NM TARGET INDUSTRIES
1) Which industries are
strong and are
concentrated
locally or
regionally?
2) Do the clusters
reflect national
growth trends?
Vision
Alignment
3) Are there local or
regional assets
that give
industries a
competitive
edge?
4) Do these clusters
meet the goals of
the community?
Regional
Assets
Industry
Trends
Target Industry Selection Process

Target Industry | 5 Grant County Target Industry Analysis
Target Industry Selection Process
STEP 1: WHAT CLUSTERS EXIST REGIONALLY? WHAT IS THEIR CONDITION?
Industry clusters are highly integrated groups of businesses with strong vertical and horizontal linkages. Vertical
linkages include the suppliers and customers in a region that combine to create a competitive business model,
whereas “horizontal” linkages include the relationships between competing companies-which often recruit from the
same labor pool of talent-and supporting public institutions. Clusters often mature when businesses expand their
relationships with existing supplier firms in a region. As the clusters grow, additional supplier firms are attracted to the
region, eventually creating a well-diversified “critical mass” of production, labor, and information.
AngelouEconomics has defined 36 standard industry clusters to categorize businesses according to their final product
and how these products are related to each other and integrated along the vertical supply chain. To assess the
strength of a cluster in a regional economy, AngelouEconomics has calculated location factors (or quotients) to each
cluster. These factors are calculated by comparing the cluster’s share of total local employment to the cluster’s
national share. This location quotient will yield a value generally between 0 and 2, where a result of “1” demonstrates
that the cluster commands an average (expected) share of the local economy. Cluster location factors greater than 2
indicate a strong cluster agglomeration, while those less than .5 indicate weak clusters.
Location Quotient (LQ)
A calculated ratio between the local economy
and the national economy that indicates
industry concentration.
LQ = 1.0 indicates average concentration
LQ > 2.0 indicates a strong cluster
LQ < 0.5 indicates a weak cluster
2011 GRANT COUNTY INDUSTRY
CONCENTRATION: 10 STRONGEST
INDUSTRIES (BY LOCATION
QUOTIENT) *
Industry Employees LQ
Natural Resources 413 13.06
Industrial Supplies 736 7.53
Government 1,295 2.33
Higher Education &
Research 390 1.82
Elementary &
Secondary Schools 524 1.32
Eat/Drink 561 1.31
Agriculture 136 1.16
Civic Enterprises 311 1.16
Material Supplies 75 1.11
Retail 1,094 1.05
Sources: Dun & Bradstreet
Target Industry | 6 Grant County Target Industry Analysis
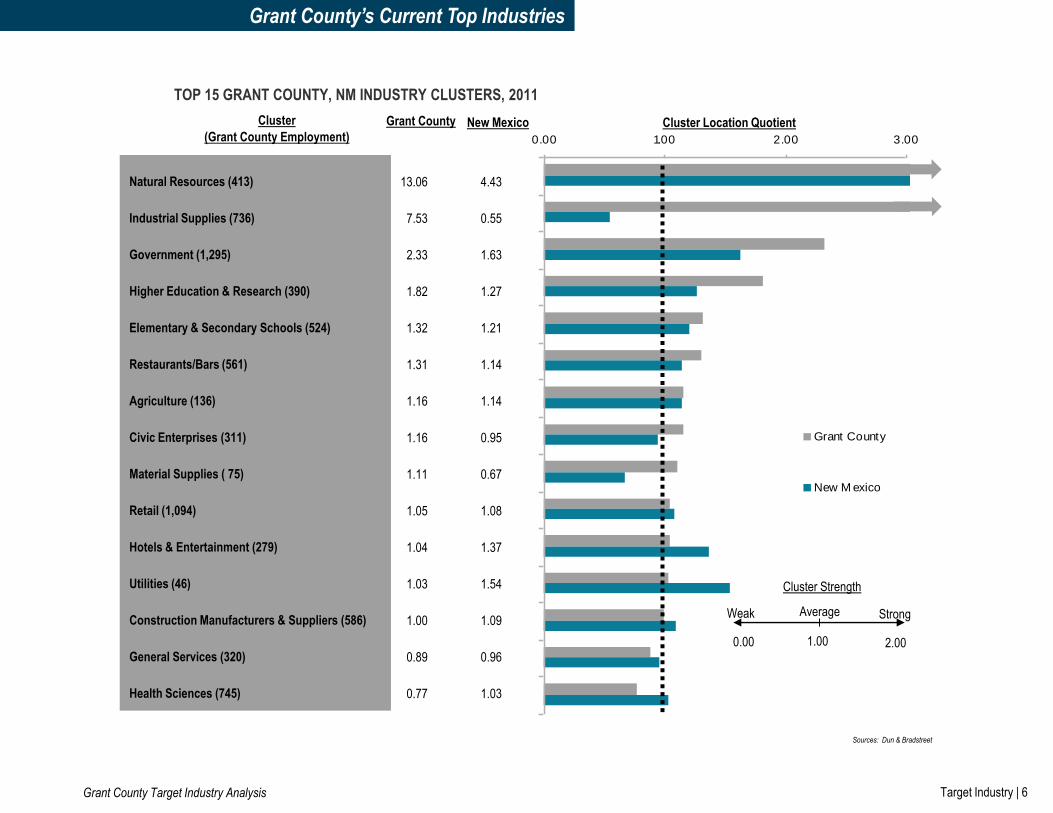
Grant County’s Current Top Industries
Grant County Target Industry Analysis
0.00 1.00 2.00 3.00
Grant County
New M exico
Natural Resources (413)
Industrial Supplies (736)
Government (1,295)
Higher Education & Research (390)
Elementary & Secondary Schools (524)
Restaurants/Bars (561)
Agriculture (136)
Civic Enterprises (311)
Material Supplies ( 75)
Retail (1,094)
Hotels & Entertainment (279)
Utilities (46)
Construction Manufacturers & Suppliers (586)
General Services (320)
Health Sciences (745)
Cluster
(Grant County Employment)
TOP 15 GRANT COUNTY, NM INDUSTRY CLUSTERS, 2011
Grant County
13.06
7.53
2.33
1.82
1.32
1.31
1.16
1.16
1.11
1.05
1.04
1.03
1.00
0.89
0.77
New Mexico
4.43
0.55
1.63
1.27
1.21
1.14
1.14
0.95
0.67
1.08
1.37
1.54
1.09
0.96
1.03
Cluster Location Quotient
2.00
Strong
Cluster Strength
1.00 0.00
Weak Average
Sources: Dun & Bradstreet

Target Industry | 7 Grant County Target Industry Analysis
Target Industry Selection Process
STEP 2: DO CURRENT AND EMERGING LOCAL INDUSTRY CLUSTERS REFLECT NATIONAL INDUSTRY
GROWTH TRENDS?
To provide a visual basis for the recommended sectors, the analysis on the next page has been prepared to illustrate
which industry sectors have registered solid performance over the last decade, and which have declined or are at a
risk to decline. Local leadership must place greater focus on economic development efforts which will (1) support
investment and employment growth in emerging, private-sector driven industry clusters, (2) help to strengthen and
diversify the regional economy by offering jobs at a variety of skill levels, and (3) leverage Grant County’s existing
assets, facilities, infrastructure, and character.
• Grant County has cluster strength in several different industries, some of which are shrinking nationally, and some of
which are growing nationally. In certain cases, a decline nationally in a particular industry may be symptomatic of
industry consolidation in certain areas of the country over others and may not necessarily indicate a weakening
industry.
• The industries which are growing both nationally and in Grant County include: Natural Resources & Mining, Public
Administration, and Education & Healthcare.
• Industries that are weak locally, but growing nationally could represent opportunities for economic development in
Grant County. These industries include: Business & Professional Services and Other Services.
STEP 3: ARE THERE LOCAL ASSETS THAT GIVE SPECIFIC INDUSTRIES A COMPETITIVE EDGE?
Every community has unique strengths that companies can leverage to create competitive advantages. These
strengths can include such things as tax structure, infrastructure, market proximity, and workforce skills, among
others. The challenge is to identify key assets in the community and region that will support a wide range of industries
to thrive, while working to improve Grant County’s “product” (e.g. infrastructure, cost of business, quality of life, etc).
The location scorecard in each target industry section identifies key assets in Grant County and opportunities for
improvement with regard to specific industry location requirements.

Target Industry | 8 Grant County Target Industry Analysis
Shift-Share Analysis
Grant County Target Industry Analysis
Transportation &
Warehousing↑
Manufacturing↑Wholesale Trade↓
Education & Health Care ↑
Retail T rade↓
Other Services↑
Leisure & Hospitality↓
Construction↓Public Administration↑
Utilities↑
Business & Professional
Services↓
Information↓
0.00
1.00
2.00
-40% -30% -20% -10% 0% 10% 20% 30%
U.S. Cluster Employment Growth Rate, 2000-2010
Clu
ste
r C
on
ce
ntr
ati
on
, 2
01
0
Source: BLS
U.S
. Em
plo
ymen
t
Gro
wth
Rate -1.3%
)
Strong Locally,
Growing Nationally
Weak Locally,
Growing Nationally
Strong Locally,
Shrinking Nationally
Weak Locally,
Shrinking Nationally
GRANT COUNTY, NM CLUSTER CONCENTRATION AND SIZE, 2001-2010
= Relative size of cluster
In Grant County
= Increasing / decreasing
Cluster concentration in
Grant County
Off Chart:
Natural Resources & Mining
LQ: 6.6 ↑
↑
F.I.R.E. ↑
In order to better understand changes to Grant County’s industry clusters over the past decade, data from the Bureau of Labor Statistics (available at the
County level) was analyzed to show the changes in concentration within 14 industry clusters between 2001 and 2010. It is important to note the data in this
chart is at a broader level than the more specific 2010 location quotient data provided for the 36 industry clusters on pages 5 and 6 of this report.

Target Industry | 9 Grant County Target Industry Analysis
Target Industry Selection Process
STEP 4: DO THESE TARGETS MEET GRANT COUNTY’S GOALS?
Public opinion and community input are critical to the target industry selection process. The growth
of industry clusters requires a regional effort. Regional government officials, economic developers,
business leaders, and the public must be united in their vision and enthusiastic in their support to
grow industry clusters that are considered a good fit for the community. This consensus and broad
support is particularly critical when a community lacks a strong local concentration in a targeted
cluster. The lack of cluster concentration does not rule out an industry as a target, but it does
indicate that local efforts must be more focused and enhanced to successfully grow the desired
industry.
During the course of our project, AngelouEconomics conducted surveys and spoke with many
public and private sector leaders and community residents. Many of these leaders represented key
industries currently located in Grant County. Through this public input process, we received a great
deal of information regarding the types of businesses that Grant County’s residents desire to retain
and attract. An online survey of Grant County residents yielded the responses in the chart to the
right as the top choices for attraction or expansion.
With these steps completed, AngelouEconomics selected five target industries and corresponding
niches that will provide the best mix of employment to meet community goals while being
achievable within larger economic trends.
Target Industry | 10 Grant County Target Industry Analysis
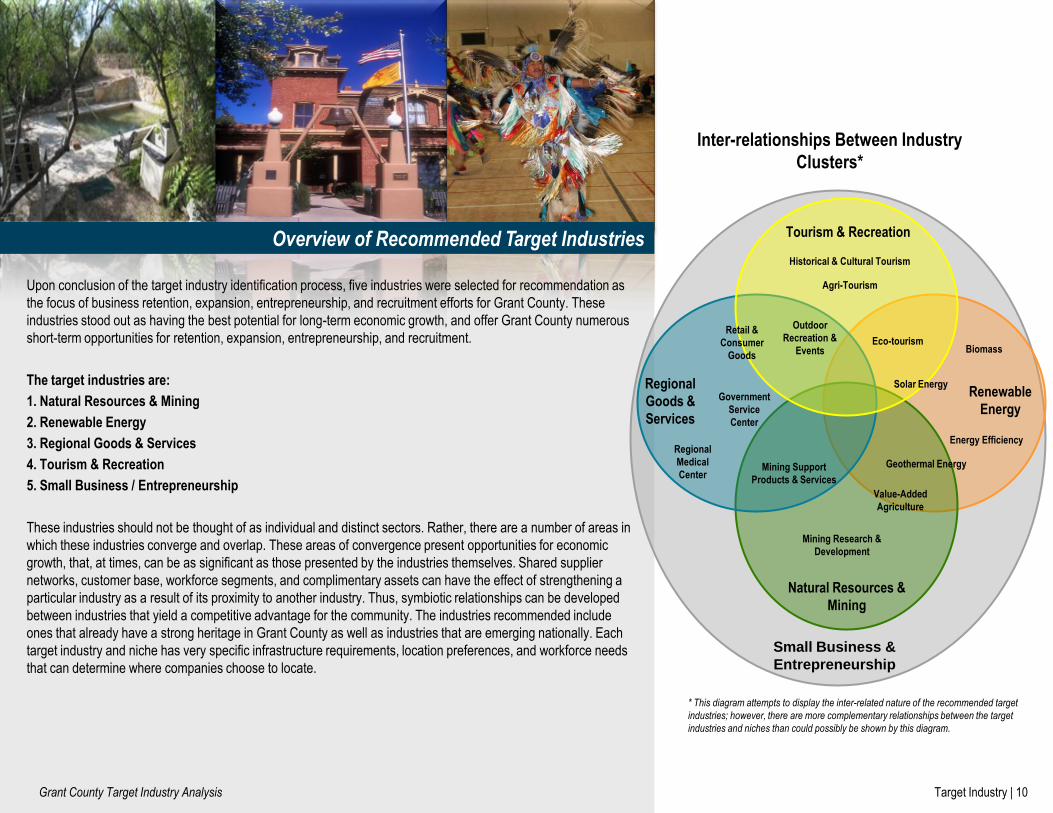
Overview of Recommended Target Industries
Upon conclusion of the target industry identification process, five industries were selected for recommendation as
the focus of business retention, expansion, entrepreneurship, and recruitment efforts for Grant County. These
industries stood out as having the best potential for long-term economic growth, and offer Grant County numerous
short-term opportunities for retention, expansion, entrepreneurship, and recruitment.
The target industries are:
1. Natural Resources & Mining
2. Renewable Energy
3. Regional Goods & Services
4. Tourism & Recreation
5. Small Business / Entrepreneurship
These industries should not be thought of as individual and distinct sectors. Rather, there are a number of areas in
which these industries converge and overlap. These areas of convergence present opportunities for economic
growth, that, at times, can be as significant as those presented by the industries themselves. Shared supplier
networks, customer base, workforce segments, and complimentary assets can have the effect of strengthening a
particular industry as a result of its proximity to another industry. Thus, symbiotic relationships can be developed
between industries that yield a competitive advantage for the community. The industries recommended include
ones that already have a strong heritage in Grant County as well as industries that are emerging nationally. Each
target industry and niche has very specific infrastructure requirements, location preferences, and workforce needs
that can determine where companies choose to locate.
* This diagram attempts to display the inter-related nature of the recommended target
industries; however, there are more complementary relationships between the target
industries and niches than could possibly be shown by this diagram.
Tourism & Recreation
Renewable
Energy
Natural Resources &
Mining
Small Business &
Entrepreneurship
Regional
Goods &
Services
Inter-relationships Between Industry
Clusters*
Solar Energy
Geothermal Energy
Biomass
Mining Support
Products & Services
Agri-Tourism
Eco-tourism
Outdoor
Recreation &
Events
Historical & Cultural Tourism
Mining Research &
Development
Value-Added
Agriculture
Retail &
Consumer
Goods
Government
Service
Center
Regional
Medical
Center
Energy Efficiency

Target Industry | 11 Grant County Target Industry Analysis
Target Industries & Niches
PROPOSED GRANT COUNTY, NM TARGET INDUSTRIES AND NICHES
Grant County Target Industry Analysis
Small Business /
Entrepreneurship
Applied Technology
Tourism &
Recreation
Natural
Resources &
Mining
Renewable
Energy
Historical &
Cultural Tourism
Outdoor
Recreation &
Events
Mining
Research &
Development
Solar Energy
Eco-tourism
Geothermal
Energy
Regional
Goods &
Services
Government
Service Center
Retail &
Consumer
Goods
Value-Added
Agriculture
Mining Support
Products &
Services
Biomass Regional
Medical Center
Agri-Tourism
Internet –Based
Commerce
Energy
Efficiency

Target Industry | 12 Grant County Target Industry Analysis
TYPES OF TARGET INDUSTRIES
The target industries are broken down into three types, based on their historical presence in Grant
County, their historical presence nationally, and their potential growth locally, nationally, and globally.
The different types of targets are summarized here:
“Core Targets.” These are industry clusters and niches in which Grant County currently enjoys a
specialization. Primary objectives include retaining and expanding these industries and ensuring a
support structure exists (e.g. capital, workforce development, etc.) to grow new small business spin offs
and entrepreneurship opportunities, especially those that are built upon innovative technological
applications.
“Diversification Targets.” These industry clusters are growing nationally and are a “logical next step”
for Grant County, because Grant County already has a significant presence in most of these sectors
and is well-suited to take advantage of opportunities provided by these industry sectors in the future.
They provide a critical opportunity for Grant County to diversify its economic base in the short-term and
mid-term future.
“Emerging Targets.” These are emerging industries nationwide that potentially could provide high-
wage job opportunities. Grant County enjoys some strong competitive advantages in most of these
sectors. Grant County’s unique advantages (access to renewable energy sources, agricultural
presence, and the natural beauty of the County) provide unprecedented opportunities for sustained
economic growth by developing industry clusters in these rapidly-growing sectors, particularly with
additional support structures in place.
Diversification Targets (Growth)
Sectors expected to continue to grow nationally; Grant County is well
positioned to nurture these industries and diversify its economic base. A
strong support infrastructure (capital, infrastructure, attractive business
climate) is necessary for these industries to develop a stronger local
presence.
• Historical & Cultural Tourism
• Outdoor Recreation & Events
• Value-Added Agriculture
• Retail & Consumer Goods
• Applied Technology
• Internet-based Commerce
• Energy Efficiency
Emerging Targets (Emerging/Growth)
Sectors with some concentration and/or unique assets locally or
regionally and expected to continue to grow nationally. Requires new
funding sources as well as new and expanded partnerships between
WNMU / NMSU researchers, local employers, and state, and local
governments.
• Solar Energy
• Geothermal Energy
• Biomass
• Eco-tourism
• Agri-tourism
• Mining Research & Development
• Applied Technology
• Internet-based Commerce
TARGET BREAKDOWN
Overview of Recommended Target Industries
Core Targets (Mature/Growth)
High local concentration, driven by local/regional demand as well as
nationwide/global demand. Industries will continue to provide regional
growth opportunities despite declining employment nationally in some
cases. Retention/expansion are a priority. Small business spin-
offs/entrepreneurship can be a focus.
• Mining Support Products & Services
• Government Service Center
• Regional Medical Center
• Applied Technology
• Internet-based Commerce

Grant County Target Industry Analysis Target Industry | 13 Target Industry | 13
Sciences Services
Economic Development Activities*:
• Retention
• Expansion • Entrepreneurship and Small Business
Development
Economic Development Activities:
• Attraction
• Expansion • Retention • Entrepreneurship and Small Business
Development
Economic Development Activities:
• Expansion • Attraction • Entrepreneurship and Small
Business Development • Retention
*Activities in bold represent primary activities. For example, retention and expansion activities are the primary activities for mature / core targets.
Mature/Core Targets
Diversification Targets
Emerging Targets
Tourism
Natural
Resources &
Mining
Renewable
Energy
Historic &
Cultural
Tourism
Ecotourism
Mining
Support
Products &
Services
Mining
Research &
Development
Target Industries & Niches
PROPOSED GRANT COUNTYTARGET INDUSTRIES AND NICHES
Value-Added
Agriculture
Biomass
Outdoor
Recreation &
Events
Agri-Tourism
Geothermal
Energy
Solar Energy
Regional
Goods &
Services
Retail &
Consumer
Goods
Regional
Medical
Center
Government
Service Center
Small Business /
Entrepreneurship
Ap
plied
Tech
no
log
y
Intern
et-based
Co
mm
erce
Energy
Efficiency

Target Industry | 14 Grant County Target Industry Analysis
The following pages provide more depth and analysis within each target industry. For each target,
we identify and define the industry and niches, outline national and regional industry growth trends,
identify regional assets and challenges in supporting the target industry, and discuss location
criteria and industry requirements.
Importantly, this document is not meant to be an exhaustive analysis of Grant County’s strengths in
the target industries, but rather, is intended to inform Grant County of the trends, nuances, and
location criteria of the industries in order to better position it to recruit, retain and start up
companies within the target industries.
Overview of Recommended Target Industries
Target Industry | 15 Grant County Target Industry Analysis
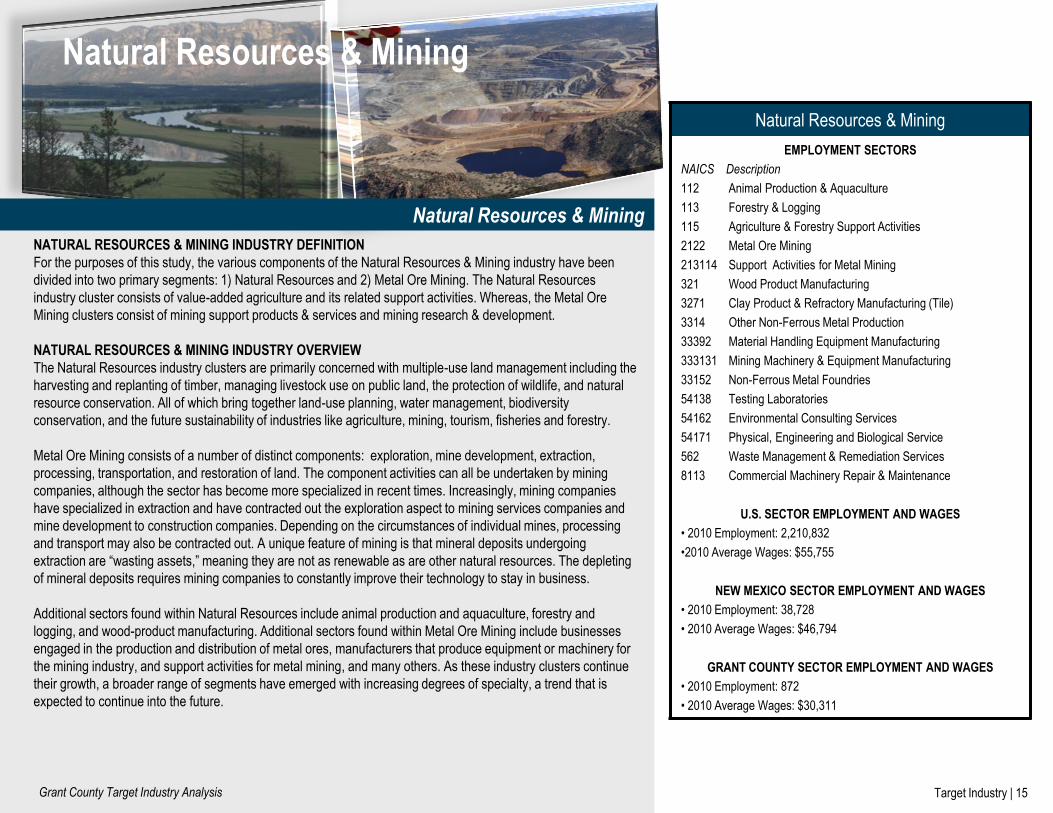
Natural Resources & Mining
NATURAL RESOURCES & MINING INDUSTRY DEFINITION
For the purposes of this study, the various components of the Natural Resources & Mining industry have been
divided into two primary segments: 1) Natural Resources and 2) Metal Ore Mining. The Natural Resources
industry cluster consists of value-added agriculture and its related support activities. Whereas, the Metal Ore
Mining clusters consist of mining support products & services and mining research & development.
NATURAL RESOURCES & MINING INDUSTRY OVERVIEW
The Natural Resources industry clusters are primarily concerned with multiple-use land management including the
harvesting and replanting of timber, managing livestock use on public land, the protection of wildlife, and natural
resource conservation. All of which bring together land-use planning, water management, biodiversity
conservation, and the future sustainability of industries like agriculture, mining, tourism, fisheries and forestry.
Metal Ore Mining consists of a number of distinct components: exploration, mine development, extraction,
processing, transportation, and restoration of land. The component activities can all be undertaken by mining
companies, although the sector has become more specialized in recent times. Increasingly, mining companies
have specialized in extraction and have contracted out the exploration aspect to mining services companies and
mine development to construction companies. Depending on the circumstances of individual mines, processing
and transport may also be contracted out. A unique feature of mining is that mineral deposits undergoing
extraction are “wasting assets,” meaning they are not as renewable as are other natural resources. The depleting
of mineral deposits requires mining companies to constantly improve their technology to stay in business.
Additional sectors found within Natural Resources include animal production and aquaculture, forestry and
logging, and wood-product manufacturing. Additional sectors found within Metal Ore Mining include businesses
engaged in the production and distribution of metal ores, manufacturers that produce equipment or machinery for
the mining industry, and support activities for metal mining, and many others. As these industry clusters continue
their growth, a broader range of segments have emerged with increasing degrees of specialty, a trend that is
expected to continue into the future.
Natural Resources & Mining
EMPLOYMENT SECTORS
NAICS Description
112 Animal Production & Aquaculture
113 Forestry & Logging
115 Agriculture & Forestry Support Activities
2122 Metal Ore Mining
213114 Support Activities for Metal Mining
321 Wood Product Manufacturing
3271 Clay Product & Refractory Manufacturing (Tile)
3314 Other Non-Ferrous Metal Production
33392 Material Handling Equipment Manufacturing
333131 Mining Machinery & Equipment Manufacturing
33152 Non-Ferrous Metal Foundries
54138 Testing Laboratories
54162 Environmental Consulting Services
54171 Physical, Engineering and Biological Service
562 Waste Management & Remediation Services
8113 Commercial Machinery Repair & Maintenance
U.S. SECTOR EMPLOYMENT AND WAGES
• 2010 Employment: 2,210,832
•2010 Average Wages: $55,755
NEW MEXICO SECTOR EMPLOYMENT AND WAGES
• 2010 Employment: 38,728
• 2010 Average Wages: $46,794
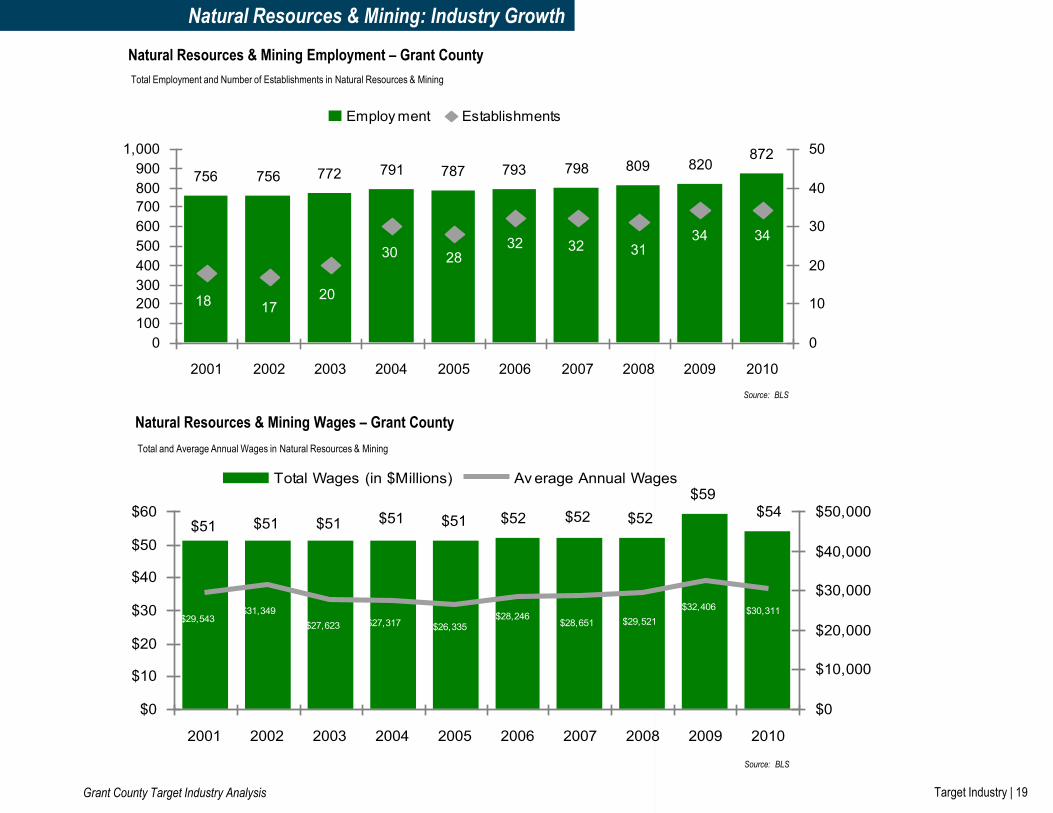
GRANT COUNTY SECTOR EMPLOYMENT AND WAGES
• 2010 Employment: 872
• 2010 Average Wages: $30,311
Natural Resources & Mining

Target Industry | 16 Grant County Target Industry Analysis
NATIONAL GROWTH TRENDS
Barriers to entry in the Natural Resources industry are low, making entry and exit relatively straightforward. The
opening of new forests to logging activities and higher demand for wood products from downstream industries will
result in modest growth over the next five years. In particular, rising employment and disposable incomes will boost
demand for housing, so the number of new houses is set to increase. As a result, demand for construction-related
timber products will experience moderate growth. Total employment in agri-business has been fairly steady in the
U.S. in the past decade, and future projections predict that total employment in the industry will continue this trend
of stability. Average wages in agribusiness have increased during this period, rising by about 27%.
The Metal Ore Mining industry faced unstable conditions from 2006 to 2011. While revenue has increased at an
average rate of 3.1% per year, this figure conceals the sharp annual shifts that have occurred in response to
swinging metal ore prices. Revenue plunged 30.4% in 2009 and then rebounded 35.2% in 2010. Over 2011,
industry revenue was expected to increase by another 17.2% to $13.2 billion as copper prices, output, and
shipments all increase. Industry performance is predominantly guided by copper output and prices and, to a lesser
extent, zinc and lead output and prices. However, a revival in downstream demand and rising prices will influence
industry growth. Furthermore, the globalization of the industry will prove to be an increasingly important area for
Metal Ore Mining over the next five years.
GRANT COUNTY GROWTH TRENDS AND INDUSTRY OVERVIEW
Grant County has a large, but stagnant Natural Resources & Mining sector with the potential for growth in the next
few years. A unique combination of assets gives Grant County a strong competitive advantage in the effort to
develop a Natural Resources & Mining cluster. These assets include:
• Its location in southwestern New Mexico and proximity to large mineral deposits;
• Proximity to NMSU, with its key research strengths in agricultural sciences and engineering;
• Existing industry presence; and
• A conducive climate and ample natural resources.
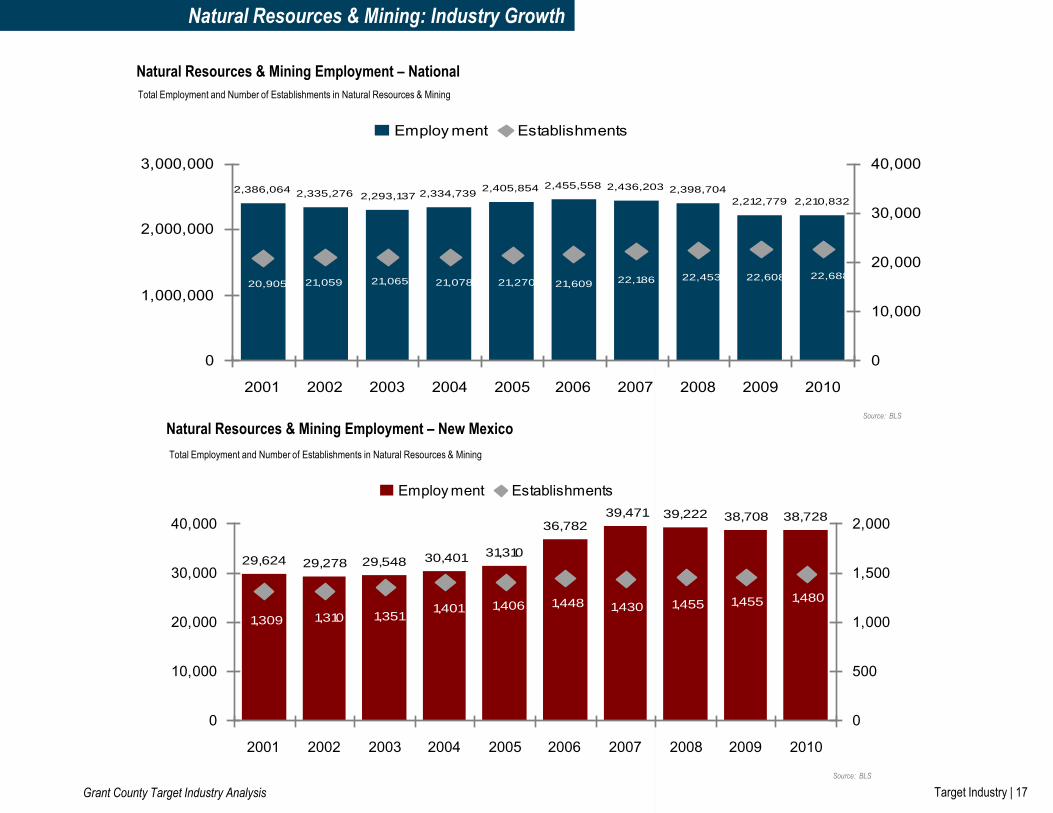
The New Mexico Natural Resources & Mining industry grew at a faster rate than the U.S. in total employment from
2001 to 2010, 31% and -7%, respectively.
NATURAL RESOURCES & MINING
LOCATION CRITERIA
Assets that are important to businesses in this industry
when choosing where to locate.
•Conducive Climate & Natural Resources
•Available Land/Facilities
• Available Workforce
• Entrepreneurial Environment
•Proximity to Market
•Research and Development Assets
•Rail Access
•Existing Industry Presence
Natural Resources & Mining
Natural Resources & Mining
Target Industry | 17 Grant County Target Industry Analysis
Natural Resources & Mining: Industry Growth
Total Employment and Number of Establishments in Natural Resources & Mining
2,436,203 2,398,704
2,212,779 2,210,832
2,455,5582,405,8542,386,064 2,335,276 2,293,137 2,334,739
22,60822,45322,18621,60921,27021,06520,905 21,059 21,07822,688
0
1,000,000
2,000,000
3,000,000
2001 2002 2003 2004 2005 2006 2007 2008 2009 2010
0
10,000
20,000
30,000
40,000
Employ ment Establishments
Source: BLS
Natural Resources & Mining Employment – National
Grant County Target Industry Analysis
Total Employment and Number of Establishments in Natural Resources & Mining
39,471 39,222 38,708 38,728
30,40129,54829,27829,62431,310
36,782
1,4801,401
1,3101,309 1,3511,406 1,448 1,430 1,455 1,455
0
10,000
20,000
30,000
40,000
2001 2002 2003 2004 2005 2006 2007 2008 2009 2010
0
500
1,000
1,500
2,000
Employ ment Establishments
Source: BLS
Natural Resources & Mining Employment – New Mexico

Target Industry | 18 Grant County Target Industry Analysis
Natural Resources & Mining: Industry Growth
Total and Average Annual Wages in Natural Resources & Mining
$2,601$2,521$2,523$2,425
$2,040
$1,539
$1,176$1,241
$1,330$1,435
$0
$500
$1,000
$1,500
$2,000
$2,500
$3,000
2001 2002 2003 2004 2005 2006 2007 2008 2009 2010
$0
$25,000
$50,000
$75,000
$100,000
Total Wages (in $ Millions) Av erage Annual Wages
Source: BLS
Natural Resources & Mining Wages – New Mexico
Grant County Target Industry Analysis
Total and Average Annual Wages in Natural Resources & Mining
$0
$20,000
$40,000
$60,000
$80,000
$100,000
$120,000
$140,000
2001 2002 2003 2004 2005 2006 2007 2008 2009 2010
$0
$20,000
$40,000
$60,000
$80,000
Total Wages (in $ Millions) Av erage Annual Wages
Source: BLS
Natural Resources & Mining Wages – National
Target Industry | 19 Grant County Target Industry Analysis
Natural Resources & Mining: Industry Growth
Grant County Target Industry Analysis
Total Employment and Number of Establishments in Natural Resources & Mining
798 809 820872
793787756 756 772 791
34313232
28
2018 17
30
34
0
100
200
300
400
500
600
700
800
900
1,000
2001 2002 2003 2004 2005 2006 2007 2008 2009 2010
0
10
20
30
40
50
Employ ment Establishments
Source: BLS
Natural Resources & Mining Employment – Grant County
Total and Average Annual Wages in Natural Resources & Mining
$51$51$51$51 $51 $52 $52 $52
$59
$54
$27,317
$31,349$29,543
$27,623 $26,335$28,246
$28,651 $29,521
$32,406 $30,311
$0
$10
$20
$30
$40
$50
$60
2001 2002 2003 2004 2005 2006 2007 2008 2009 2010
$0
$10,000
$20,000
$30,000
$40,000
$50,000
Total Wages (in $Millions) Av erage Annual Wages
Source: BLS
Natural Resources & Mining Wages – Grant County

Target Industry | 20 Grant County Target Industry Analysis
Natural Resources & Mining: Niches
MINING SUPPORT PRODUCTS & SERVICES
Mining support products and services refers to the sectors of Servicing & Maintenance of Mining Equipment and
Mining Equipment & Industrial Supplies. Given that mining companies have specialized in extraction, contracting out
work to mining-service companies and mine development to construction companies has become more common.
And depending on the circumstances of individual mines, processing and transport may also be contracted out. The
Metal Ore Mining industry is also highly capital-intensive. And to that point, the industry's capital spending is a result
of the purchase of new manufacturing machinery, equipment and facilities designed to improve product quality,
increase manufacturing efficiency, lower production costs and meet regulatory requirements. There is a wide range
of direct and indirect business opportunities for communities in close proximity to major mining operations.
Given that Grant County is home to one of the largest open-pit copper mines in North America, Grant County has an
unparalleled competitive advantage in the Mining Support Products and Services niche.
Freeport McMoran’s mining operations in Grant County are large enough to directly employ 1,400 workers which had
an $89 million total economic impact in Grant County in 2010. Both direct and indirect impacts were estimated to be
$3 million from spending by supplier purchases. This accentuates how the mining industry can not only generate a
substantial amount of spin-off economic activity, but also that there is ample opportunity and potential to grow the
Mining support products & services niche in Grant County. To that end, Grant County should continue to develop and
implement strategies to capitalize on the spin-off opportunities for economic development represented by its strong,
local mining industry.
Functional Focus Life Cycle Applicability
• Growth / Mature • Service
• Sales / Marketing
MINING RESEARCH & DEVELOPMENT
The Natural Resources & Mining industry, specifically the mining sector, can benefit from local research and
development efforts. In addition to traditional centers of research such as universities and large research institutions,
many small firms and mid-sized laboratories are important sources of new discoveries, innovations, and technologies.
Successful research and development in the mining sector produces new technologies that reduce production costs;
enhance the quality of existing mineral commodities; reduce adverse environmental, health, and safety impacts; and
create or make available entirely new mineral commodities. The resulting benefits may go to consumers, producers,
and communities near the mine operation. Most often, however, both consumers and producers benefit, with
consumers enjoying most of the benefits over the long run. As technologies become more widely available, commodity
prices drop, and therefore companies and countries need to continually generate innovations that provide new
benefits.
A community may be in a position to develop a competitive advantage in the Natural Resources & Mining industry by
targeting firms focused primarily on research and development activities. A strong research university presence within
the community is very valuable, however, proximity to mining operations is a notable asset. Affordable and available
lab space and adequate information technology (IT) infrastructure are also important concerns for R&D firms
evaluating potential locations for new facilities. Grant County is in reasonable proximity to both NMSU and the New
Mexico Institute of Mining and Technology and can tap into their existing resources and assets to meet some of its
needs in developing R&D initiatives. And Freeport’s mining operations in both Tyrone and Chino offer a distinctive
completive advantage in drawing in R&D support.
Functional Focus Life Cycle Applicability
• R&D • Emerging / Growth

Target Industry | 21 Grant County Target Industry Analysis
Natural Resources & Mining: Niches
VALUE-ADDED AGRICULTURE
Value-added agriculture is regarded as a significant rural-development strategy. Value-added products are
created when a producer increases the consumer value of an agricultural commodity in the production or
processing stage. To that end, value-added products are considered unique, less sensitive to price
fluctuations, and are consumer-oriented. Small-scale organic food processing, non-traditional animal and
crop production, forestry and wood-related activities, and bio-fuel development are examples of various
value-added agricultural projects that have created new jobs in many rural areas. Given that products are
offered on a small scale in value-added agriculture, much more emphasis and importance is placed on the
marketing of the products. Grants may be used for planning activities and for working capital to market value-
added agricultural from the New Mexico Rural Development Office. Applicants deemed eligible are
independent producers, farmer and rancher cooperatives, agricultural producer groups, and majority-
controlled producer-based business ventures.
Grant County is well-positioned to increase its development of a Value-added Agriculture cluster given its
entrepreneurial environment, conducive climate, and abundance of natural resources. Other assets that
make Grant County an attractive location for Value-added Agriculture are its access to a sizable market with
the Silver City and Bayard populations as well as its existing industry presence, albeit small.
Functional Focus Life Cycle Applicability
• Sales / Marketing
• Service
• Production
• Emerging / Growth

Target Industry | 22 Grant County Target Industry Analysis
Natural Resources & Mining: Location Criteria
Industry Requirements Leading Strong Lacking Weak Assessment Rationale
GRANT COUNTY SCORECARD: NATURAL RESOURCES & MINING
Conducive Climate &
Natural Resources
Entrepreneurial
Environment
Available Land / Facilities
Research & Development
Assets
Proximity to Market
Rail Access
Existing Industry Presence
Available Workforce
Grant County has a large amount of undeveloped land with good
transportation access along the Highway180E corridor. However, there is a
lack of existing facilities available for lease or industrial space specifically
designed for Natural Resources & Mining spin-off businesses.
Grant County has existing rail spurs near the mining district; however, it
has a limited route running north/south in parallel to HWY 180 towards
Deming. The rail line is privately owned, however, its use is dominated
by the mining district.
Freeport-McMoRan employed close to 950 workers in the mining industry
at the end of 2010 with an estimated total direct and indirect economic
impact of $89 million. There are also small business operations in the
Natural Resources industry throughout the County.
Grant County has an affordable, blue-collar workforce, which is an asset for
the Natural Resources & Mining industry. A key challenge is the lack of work
ethic among the blue-collar workforce and the small professional workforce
necessary to support growth in professional services tied to the Mining
industry.
Grant County’s location in southwestern New Mexico provides access to
an abundance of Natural Resources. The County is also centrally located
within the primary copper mining region.
NMSU is a strong research university, particularly in the fields of
agricultural sciences and engineering, although it is two hours away. The
NM Institute of Mining & Tech is an additional asset, however, there is no
existing wet lab space for lease in Grant County.
The location of the Chino and Tyrone mines provide for an abundance of
copper deposits, sustaining the longevity of the mining industry. This also
provides as a conducive environment for spin-off companies. Most of the
County is also ideal for small and medium-scale agri-business.
Grant County has a strong entrepreneurial environment. Many small
business owners within the County are involved in multiple business
ventures, a sign of strong entrepreneurial spirit within the County.

Grant County Target Industry Analysis Target Industry | 23
Renewable Energy Industry
RENEWABLE ENERGY INDUSTRY DEFINITION
For the purposes of this study, the Renewable Energy industry consists of businesses engaged in or related to the
production of renewable energy and/or in the development or application of energy efficiency. The various
components of the industry have been divided into two primary segments: 1) Manufacturing and 2) Sales & Services.
RENEWABLE ENERGY INDUSTRY OVERVIEW
The Renewable Energy industry has enjoyed a very high profile among growth industries during the past several
years. A high level of investment and entrepreneurship in Renewable Energy has produced many new technologies
and innovations that have made their way to the market and have delivered a recognizable impact on world energy
production.
There are many forces behind the growth of the Renewable Energy industry. Growing concern for the environment
has led many consumers to shift their purchasing habits in favor of more environmentally-friendly products and
services, and has led government bodies to institute policies aimed at protecting the environment. However, there are
several additional forces that are driving the industry forward and, in certain areas, accelerating its growth. Among
these is the desire of businesses and consumers for cheaper, more abundant sources of energy and for greater
energy efficiency as a means of reducing expenses. As the price of conventional forms of energy (particularly oil) have
seen dramatic changes in recent years, the demand for more affordable renewable energy has grown substantially.
Another force behind the growth has been a desire to bring energy production to domestic locations to reduce
dependence on fossil fuels produced in foreign locations. Yet another factor that has been driving the growth of the
industry has been the emergence of developing economies such as China, India, Brazil and others whose economic
growth has prompted high increases in energy demand – a trend that is expected to continue into the future as the
population within these nations continue to urbanize and as their economies continue to grow.
The growth and future prospects of the Renewable Energy industry have led many communities, states, and nations to
work to support it within their own economy. Because it is a budding industry and the distributed nature of the industry
across a broad set of employment categories, it can be difficult to apply conventional government statistics to
Renewable Energy as the results can be difficult to interpret accurately. Instead, this study considers the various
business and employment categories that closely relate to renewable energy. While many of these employees or
businesses may not currently be involved in Renewable Energy, the resources and skill sets they hold may be applied
to or transitioned to support the Renewable Energy industry and can act as a foundation for its growth.
RENEWABLE ENERGY
SECTOR COMPONENTS
NAICS Description
Manufacturing
23713 Power and Communication System
Construction
3336 Engine, Turbine, and Power Equipment
Manufacturing
334413 Semiconductor and Related Device
Manufacturing
335312 Motor and Generator Manufacturing
335999 Miscellaneous Electrical Equipment
Manufacturing
Sales & Services
221112 Electric Power Transmission & Distribution
221114 Solar Electric Power Generation*
221116 Geothermal Electric Power Generation*
221117 Biomass Electric Power Generation*
42369 Other Electronic Parts Merchant Wholesalers
54133 Engineering Services
54138 Testing Laboratories
54162 Environmental Consulting Services
54169 Other Technical Consulting Services
54171 Physical, Engineering, and Biological Service
*New NAICS codes sourced from BLS, historical data
unavailable
U.S. SECTOR EMPLOYMENT AND WAGES
• 2010 Employment:: 2,627,152
•2010 Average Wages: $76,444
NEW MEXICO SECTOR EMPLOYMENT AND WAGES
• 2010 Employment: 38,840
• 2010 Average Wages: $64,946
GRANT County SECTOR EMPLOYMENT AND WAGES
• 2010 Employment:: 43
• 2010 Average Wages: $50,023
Photos: U.S. Energy Information Agency

Grant County Target Industry Analysis Target Industry | 24
NATIONAL GROWTH TRENDS AND INDUSTRY OVERVIEW
The Renewable Energy Manufacturing segment has experienced strong growth in recent years. This growth has
been supported in the U.S. by a growing and urbanizing population that is seeking more affordable energy
alternatives. This segment also includes companies that assist in the installation of energy grid infrastructure and
more efficient “smart grid” equipment and technology. The Renewable Energy Manufacturing segment also
includes firms that provide maintenance and repair services on energy equipment. While some firms are
experiencing very rapid growth, businesses within the Renewable Energy Manufacturing segment generally
maintain a longer-term outlook than many other industries.
The Sales & Services segment of the Renewable Energy industry is becoming a very enticing option for
communities wishing to build a stronger Renewable Energy industry presence. Although many portions of this
segment are already well-established, there are certain areas that are emerging as strong growth opportunities for
the industry as a whole begin to take shape. The Sales & Services segment includes businesses that operate
power generating equipment or power stations, sell electricity or energy equipment to businesses and consumers,
as well as firms that provide consulting or engineering services to improve energy efficiency. The segment also
includes firms that conduct research and development in the area of Renewable Energy. As the Renewable
Energy industry as a whole continues its growth in the years to come, the Sales & Services segment that supports
it will likewise continue to uncover new opportunities.
GRANT COUNTY GROWTH TRENDS AND INDUSTRY OVERVIEW
Southwestern New Mexico is situated in an area with high solar and geothermal energy resources. Grant County
is well positioned to capitalize off the future growth of the solar and geothermal industries. Jobs provided by these
industries range from engineering positions requiring advanced degrees, to turbine construction and maintenance
positions that can be filled by someone with an associates degree or certificate. The number of Renewable
Energy establishments in Grant County has risen from six in 2001 to 13 in 2010, which represents a positive
growth rate in the establishments being formed in Grant County. Niches are more likely to survive and even
expand when clustered with industry-related establishments.
Renewable Energy Industry: Industry Segments RENEWABLE ENERGY
LOCATION CRITERIA
Assets that are important to businesses in this industry
when choosing where to locate.
• Public Policy Support for the Industry
• Access to Available Natural Resources
• Skilled Workforce
• Capital & Funding Sources
• Access to Venture Capital
• Research & Development Assets
• Structural Assets & Infrastructure
• Proximity to Market
Photos: U.S. Energy Information Agency

Grant County Target Industry Analysis Target Industry | 25
Renewable Energy Industry: Industry Growth
Total Employment and Number of Establishments in Renewable Energy
2,732,755 2,784,0922,660,802 2,627,1522,680,515
2,559,5292,595,8962,478,334 2,410,7042,453,349
235,523234,797229,511225,607219,538215,845214,886 216,755 216,270
236,634
0
1,000,000
2,000,000
3,000,000
2001 2002 2003 2004 2005 2006 2007 2008 2009 2010
0
100,000
200,000
300,000
Employ ment Establishments
Source: BLS
Renewable Energy Employment – National
Total Employment and Number of Establishments in Renewable Energy
40,25738,766 38,336 38,84037,697
31,03129,526 30,062 30,318 30,567
1,5061,4851,4191,3871,308
1,2631,202 1,217
1,283
1,515
0
10,000
20,000
30,000
40,000
2001 2002 2003 2004 2005 2006 2007 2008 2009 2010
0
500
1,000
1,500
2,000
2,500
Employ ment Establishments
Source: BLS
Renewable Energy Employment – New Mexico

Grant County Target Industry Analysis Target Industry | 26
Renewable Energy Industry: Industry Growth
Grant County Target Industry Analysis
$0
$50,000
$100,000
$150,000
$200,000
$250,000
2001 2002 2003 2004 2005 2006 2007 2008 2009 2010
$0
$20,000
$40,000
$60,000
$80,000
$100,000
$120,000
Total Wages (in $ Millions) Av erage Annual Wages
Renewable Energy Wages – National Total and Average Annual Wages in Renewable Energy
Total and Average Annual Wages in Renewable Energy
$2,024$1,946
$1,854$1,755
$2,114
$2,678
$3,100 $3,152 $3,152 $3,188
$55,776$53,309$51,386
$55,514
$60,391$61,249 $63,674
$69,129 $68,869 $64,946
$0
$500
$1,000
$1,500
$2,000
$2,500
$3,000
$3,500
2001 2002 2003 2004 2005 2006 2007 2008 2009 2010
$0
$25,000
$50,000
$75,000
$100,000
Total Wages (in $ Millions) Av erage Annual Wages
Source: BLS
Renewable Energy Wages – New Mexico
Source: BLS

Grant County Target Industry Analysis Target Industry | 27
Renewable Energy Industry: Industry Growth
Grant County Target Industry Analysis
Total Employment and Number of Establishments in Regional Goods & Services
30
35
42 43
2525
1518
2123
131412
15
1211
69
14 13
0
10
20
30
40
2001 2002 2003 2004 2005 2006 2007 2008 2009 2010
0
10
20
30
Employ ment Establishments
Source: BLS
Renewable Energy Employment – Grant County
Total and Average Annual Wages in Regional Goods & Services
$3
$2$2
$1$1$1$1 $1 $1 $1$50,023$52,262
$49,486$44,040
$34,720$31,680
$25,790$24,220 $24,480
$28,739
$0
$1
$2
$3
2001 2002 2003 2004 2005 2006 2007 2008 2009 2010
$0
$20,000
$40,000
$60,000
$80,000
$100,000
Total Wages (in $Millions) Av erage Annual Wages
Source: BLS
Renewable Energy Wages – Grant County

Grant County Target Industry Analysis Target Industry | 28
Renewable Energy Industry: Niches
SOLAR ENERGY
Solar photovoltaics (including modules, system components, and installation) are projected to grow from a $71.2 billion
industry in 2010 to $113.6 billion by 2020. New installations reached more than15.6 GW worldwide in 2010, more than
double of 7. 1GW in 2009. This was a direct result of PV prices dropping by more than 30% in 2009 followed by an
additional 10% drop in 2010. Lenders are growing increasingly comfortable with funding solar technology, and
investment in solar ventures is likely to continue increasing in future years. The US was a net exporter of solar energy
products in 2009, with $723 million in net exports; Polysilicon was the largest solar product export. With $1.1 billion in
exports 81% of the domestic value created in the solar industry came from the photovoltaic (PV) sector, with
concentrating power (CSP) and solar heating and cooling (SHC) making up the remaining 19%.
Although the cost of solar has fallen substantially in the past decade, the availability of subsidies and incentives
provided by the federal government as well as individual state governments and agencies can play a very important role
in determining the profitability of a project (particularly large-scale commercial projects), and may ultimately be a
deciding factor for investors and developers in choosing whether or not to pursue a particular project. State Renewable
Energy Portfolio Standards (REPS’s) can also play a pivotal role in driving clean energy demand and the growth of the
clean energy industry within a particular state or region. A 2004 study by the Renewable and Appropriate Energy
Laboratory (RAEL) at the University of California, Berkeley demonstrated a positive correlation between renewable
energy portfolio standards and the creation of green jobs. However, the full impact of renewable portfolio standards
depends upon the level at which they are set and the manner in which utilities, businesses and consumers are
incentivized to shift away from conventional sources of energy toward renewable and energy efficiency measures.
In general, 80% of jobs created in solar and wind sectors will be in manufacturing and 20% in construction and
installation. Solar photovoltaic power uses more labor per installed MW than other clean energy sources, and therefore
produces a large demand for a skilled workforce. The manufacturing component of the solar industry consists of three
primary technologies at present: silicon wafer based-PV, thin film photovoltaics, and solar thermal electric power.
Small-scale solar energy is also an important part of the industry, particularly in helping to make homes and other
buildings more energy efficient and environmentally sustainable. Solar thermal hot water heating (in its modern form) is
a technology that has been in use for many decades and is quite common in many regions throughout the U.S.
Located in the sunbelt, New Mexico is one of the top solar emitting states in the U.S., and southern New Mexico is
particularly strong in solar-energy potential. Not only do solar farms present opportunities for Grant County, but solar
panel manufacturing also afford tremendous potential. From a cost perspective, producing solar panels in southwest
New Mexico is a reasonable approach given the proximity to large areas of undeveloped land with some of the highest
solar photovoltaic energy potential in the U.S.
Functional Focus Life Cycle Applicability
• Manufacturing/
Production
• Service
•R&D
•Emerging/ Growth

Grant County Target Industry Analysis Target Industry | 29
Renewable Energy Industry: Niches
GEOTHERMAL ENERGY
Geothermal energy is used to heat people’s homes and to produce electricity by digging deep wells and pumping the
heated underground water or steam to the surface. Most of the geothermal reservoirs in the United States are located
in the western States. And one of the most common direct use of geothermal energy is for heating buildings through
district heating systems. Hot water near the Earth's surface can be piped directly into buildings and industries for heat.
Industrial applications of geothermal energy include food dehydration, gold mining, and milk pasteurizing. Dehydration,
or the drying of vegetable and fruit products, is the most common industrial use of geothermal energy. A more unique
application of geothermal energy is the hatching and raising of fish in locales outside of their natural habitat. Tropical
fish, for example, require warm water temperatures to be hatch and raised. With the utilization of geothermal energy,
tropical fish are currently being hatched and raised in the desert southwest.
The United States leads the world in electricity generation with geothermal power. In 2010, U.S. geothermal power
plants produced about 15 billion kilowatt-hours (kWh), or 0.4% of total U.S. electricity generation. In 2010, five States
had geothermal power plants. California had 35 geothermal power plants, which produced 83% of U.S. geothermal
electricity. Nevada had 18 geothermal power plants, which produced 14% of U.S. geothermal electricity. Utah had two
plants, and Hawaii and Idaho each had one geothermal plant.
Geothermal power plants use hydrothermal resources that have two common ingredients: water (hydro) and heat
(thermal). Geothermal plants require high temperature (300°F to 700°F) hydrothermal resources that may come from
either dry steam wells or hot water wells. These resources can be used by drilling wells into the Earth and piping the
steam or hot water to the surface. Geothermal heat pumps use the Earth's constant temperatures to heat and cool
buildings. They transfer heat from the ground (or water) into buildings in winter and reverse the process in the
summer. According to the U.S. Environmental Protection Agency (EPA), geothermal heat pumps are the most energy
efficient, environmentally clean, and cost effective systems for temperature control.
A crucial factor for any niche in the renewable energy industry is obtaining access to natural resources. Grant County
is well positioned to begin utilizing the ample geothermal energy source below its surface. Such energy could be used
to heat and cool homes and offices, cultivate tropical fish hatcheries, and/or export stored energy to outside
establishments to name a few potential areas of utilization. There are also already a few resorts and spas that use
geothermal fluids for heating the various soaking tubs and swimming pools in Grant County which could potentially be
expanded upon.
Functional Focus Life Cycle Applicability
Emerging / Growth • Manufacturing /
Production
• Service
• Sales
U.S. GEOTHERMAL RESOURCES
Source: Energy Information Agency, U.S. Dept of Energy
INDUSTRIAL GEOTHERMAL RESOURCES AT 3 MILES OF DEPTH
U.S. GEOTHERMAL RESOURCES
Source: Energy Information Agency, U.S. Dept of Energy
INDUSTRIAL GEOTHERMAL RESOURCES AT 3 MILES OF DEPTH

Grant County Target Industry Analysis Target Industry | 30
Renewable Energy Industry: Niches
BIOMASS
Several regions throughout the U.S. present opportunities for the development of clean energy based on biomass.
There are a number of types of biomass that are available which may used to produce clean energy, including
ethanol-producing crops such as corn or sugar, switchgrass, algae, residue from saw mills, and methane produced by
landfills and livestock manure. With various types of biomass being more prominent in certain regions over others, it is
likely that different types of clean energy technologies will also begin to emerge in the regions that produce or support
the appropriate biomass input. The strongest regions for the production of biomass are found in the Midwest, the
Southern Mississippi Basin, and areas throughout the Southeast.
Landfill gas can be extracted from landfills and directed to central collecting points, where it can be treated or
processed. At this point, it can be flared up or used to generate electricity (the most common use), replace fossil fuels
in industrial and manufacturing operations, fuel greenhouse operations, or be upgraded to pipeline quality gas. There
are various technologies that can be used, the most common of which is internal combustion (reciprocating) engines
or turbines, with micro-turbine technology used at smaller landfills and in niche applications. Landfill gas projects often
generate revenue from the sale of gas and can also create jobs through its design, construction, and operation.
Projects involve engineers, construction firms, equipment vendors, and utilities or end-users of the supplied power.
It costs about 9 cents per kilowatt-hour (kWh) to generate electricity in a direct-fired biomass power plant today,
compared to 2.3 cents per kWh spend in a coal plant, but “cofiring” biomass with coal can lower the cost to around 2.1
cents per kWh. According to the Department of Energy, through gasification we may be able to produce clean bio-
power for about 4 to 5 cents per kWh in the future. Rural economies can especially benefit from methane recapture,
since it can be converted to fuel gas and ethanol close to the landfill, avoiding transportation costs. Presently, 4% of
the energy generated in the US is from biomass, with the potential to increase this to 20%.
Methane recapture can currently take place using landfills, waste treatment facilities, and livestock manure. Landfills
are responsible for 22% of human-related methane emissions, and make it much easier to recapture methane than
from livestock sources (the major source of methane emissions). Out of America’s 2,300 landfills, 520 capture gas and
burn it to produce electricity-enough to power 688,000 homes.
Grant County has two fuel-source options in attempting to develop this industry niche. The first takes into
consideration the abundance of national forest within the County given that the most common form of biomass is wood
and wood waste (i.e. bark, sawdust, wood chips, wood scrap, paper mill residues, etc.). Landfills are a second option
for a biomass fuel source for Grant County. Landfills can collect the methane gas, treat it, and then sell it as a
commercial fuel. It can then be burned to generate steam and electricity.
Functional Focus Life Cycle Applicability
Emerging / Growth • Manufacturing /
Production
•Service
•Sales

Grant County Target Industry Analysis Target Industry | 31
Renewable Energy Industry: Niches
ENERGY EFFICIENCY & SUSTAINABILITY
An area of the renewable energy industry that has experienced strong growth and is expected to serve a broader
market in the years to come relates to energy efficiency and sustainability – often served by consulting, construction,
architectural/engineering and R&D firms. As demand for more abundant and less costly energy sources continues to
rise and as more businesses and consumers seek ways to improve energy efficiency and to reduce their impact on the
environment, the energy efficiency and sustainability niche will present many new opportunities for businesses and
communities alike. Venture capitalists and government bodies have invested billions of dollars to support the
development of new technologies related to renewable energy and entrepreneurial activity within this particular niche
has been significant. Moreover, as the benefits of becoming more energy efficient or incorporating new energy-related
technologies becomes more appealing to businesses and consumers, there has been significant growth in the number
of businesses that offer services focused on energy efficiency and sustainability. The primary requirements of
businesses within this niche include an availability of highly skilled professionals, access to funding, proximity to
significant research institutions and access to potential customers. Locations that are particularly appealing include
urban areas that require significant improvements to the built environment in order to become more energy efficient
(an outcome that can often make older urban locations more desirable for relocating businesses) or near to large
residential areas that value environmentally-friendly lifestyles or simply seek practical means of reducing monthly living
expenses.
The Southwest Energy Efficiency Project (SWEEP) identified Grant County and Silver City as one of eight models in
the Southwest that other cities and counties may want to replicate for energy efficiency. SWEEP is a public interest
organization working to advance energy efficiency in Arizona, Colorado, Nevada, New Mexico, Utah, and Wyoming.
The funds helped Silver City and Grant County to strengthen neighborhood energy efficiency programs as well as
improve the energy efficiency of public buildings and install a large-scale solar system.
Functional Focus Life Cycle Applicability
• Sales / Marketing
• Service
• Emerging / Growth
3,058,692
2,508,372
$74K
$89K
$62K
0
1,000,000
2,000,000
3,000,000
2002 2003 2004 2005 2006 2007 2008 2009 2010 2011
$50,000
$60,000
$70,000
$80,000
$90,000
$100,000
Source: BLS, Economy.com,, AngelouEconomics
RENEWABLE ENERGY & ENERGY EFFICIENCY
U.S. EMPLOYMENT & AVERAGE WAGE, 2002-2011
Avg. Annual Wage Employment
Projected
$5,055
$3,553
$760$1,158
$6,120
$2,658
$3,761
$807
23.2%
4.3%
12.6%
$0
$1,000
$2,000
$3,000
$4,000
$5,000
$6,000
$7,000
2003 2004 2005 2006 2007 2008 2009 2010
0%
5%
10%
15%
20%
25%
30%
35%
40%
45%
50%
Renewable Energy Percentage of
Total U.S. Venture InvestmentsRenewable Energy Venture
Investments ($ Millions)
Clean-Tech Venture Capital Investments in U.S.-Based Companies
Source: PWC Money Tree

Grant County Target Industry Analysis Target Industry | 32
Renewable Energy Industry: Sectors in Niches
The following pages list industry sectors derived from the aforementioned renewable-energy niches.
CONSTRUCTION & INSTALLATION
As the Renewable Energy industry continues to grow, a necessary area of business that will grow along with it will be
Construction & Installation. Firms that focus on, or offer capabilities that relate to, the construction of infrastructure and
the installation of renewable energy equipment will be a vital part of the industry going forward. The Construction &
Installation niche can be an area of focus for communities seeking the Renewable Energy industry, however,
businesses in this niche will typically require relatively close proximity to significant population centers and/or to major
project sites. Communities that wish to support this niche may consider efforts to assist firms in obtaining valuable
certifications related to the Renewable Energy industry that could help them compete. Similarly, efforts to assist the
local workforce in obtaining specialized training in the construction and installation of Renewable Energy infrastructure
and equipment can help to support this particular niche.
EQUIPMENT & TECNOLOGY MANUFACTURING
The Equipment & Technology Manufacturing niche is a quickly growing area of the Renewable Energy industry that is
becoming increasingly diverse in both the size of the firms within it and in the areas of specialty upon which they are
focusing. The most easily recognized firms within this niche are the manufacturers of major renewable energy
equipment such as wind turbines, solar panels, advanced batteries and generators. Although there are already several
well-established firms that serve the market within this niche, the growth in demand for Renewable Energy and the
increase in support from investors and government bodies have opened new opportunities for these manufacturers to
expand into new territories and for new competitors to emerge as well. Moreover, as the Renewable Energy industry
as a whole continues to grow and diversify, opportunities have materialized for smaller manufacturers and new
ventures to develop a stronger presence within the industry and to focus on numerous areas of specialty such as in
the manufacturing of components or advanced technology applicable to the industry.
The needs of firms within the Equipment & Technology Manufacturing niche vary greatly depending on the focus of the
business. Large manufacturers producing large equipment such as wind turbines will generally seek locations that
offer affordable land with very strong distribution channels and close proximity to assembly or installation (i.e. wind
farms). Smaller manufacturers, however, may be open to a broader range of sites. Nevertheless, access to skilled and
affordable labor is a key concern across all areas of the niche.
POWER GENERATION & TRANSMISSION
Though already long-established within the industry, the Power Generation & Transmission niche is experiencing a
transition to incorporate the changes that are taking place in the market and the introduction of renewable energy
production technologies. Many firms within this niche have made major changes to their branding in order to establish
themselves as “green energy” providers. As new sources of energy production are being established in a number of
new locations, the required transmission and distribution of energy is supporting the growth of businesses in this niche
to establish a presence near these production centers. The site decisions of businesses within the Power Generation
& Transmission niche is very closely tied to the location of energy resources and major population centers.
Functional Focus Life Cycle Applicability
• Manufacturing /
Production
• Distribution /
Logistics
• Growth / Mature
Functional Focus Life Cycle Applicability
• Emerging • Manufacturing /
Production
Functional Focus Life Cycle Applicability
• Service
• Manufacturing /
Production
• Distribution /
Logistics
• Growth / Mature

Grant County Target Industry Analysis Target Industry | 33
Renewable Energy Industry: Sectors in Niches
EQUIPMENT SALES
The Equipment Sales niche of the Renewable Energy industry remains closely linked to equipment sales for
conventional forms of energy or to the original equipment manufacturer. However, there are a number of firms and
professionals that specialize in this area of the industry and that are experiencing growth related to Renewable
Energy. The types of equipment that are provided by firms in this niche vary greatly from heavy machinery and
generators to customized equipment and specialty devices. Of primary interest for firms within the Equipment Sales
niche is having close proximity to existing or growing markets for Renewable Energy equipment and major purchasers
of energy-related equipment as well as access to suppliers and distribution channels.
CONSULTING AND R&D
An area of the Renewable Energy industry that has experienced strong growth and is expected to serve a broader
market in the years to come is the Consulting and R&D niche. As demand for more abundant and less costly energy
sources continues to rise and as more businesses and consumers seek ways to improve energy efficiency and to
reduce their impact on the environment, the Consulting and R&D niche will present many new opportunities for
businesses and communities alike. Venture capitalists and government bodies have invested billions of dollars to
support the development of new technologies related to Renewable Energy and entrepreneurial activity within this
particular niche has been significant. Moreover, as the benefits of becoming more energy efficient or incorporating new
energy-related technologies becomes more appealing to businesses and consumers, there has been significant
growth in the number of businesses that offer consulting services focused on Renewable Energy. The primary
requirements of businesses within this niche include an availability of highly skilled professionals, access to funding
and venture capital, proximity to significant research institutions and access to potential customers.
ENERGY STORAGE RESEARCH
Energy storage is absolutely essential to the entire renewable technology industry. Many forms of electricity production
are sporadic, only generating when the wind blows or the sun is out. Hybrid and electric vehicle technology rely upon
the ability of batteries to store and distribute power . Technology is becoming oriented more and more towards
mobility, as Smartphones, Netbooks, and tablet computers become essential tools for both business and pleasure.
These technologies rely heavily upon battery capacity, storage, and lifespan. At this point, most activity in the U.S.
takes the form of research, which is mostly dependent upon talent and research space.
Functional Focus Life Cycle Applicability
• Sales / Marketing
• Service • Emerging / Growth
Functional Focus Life Cycle Applicability
• Service
• R&D
• Back Office /
Support
• Emerging / Growth
Functional Focus Life Cycle Applicability
• R&D •Growth / Emerging
Global Clean-Energy Market Size, 2000-2010GLOBAL MARKET SIZE, IN $ US BILLIONS
Source: Clean Edge, Inc., 2011

Grant County Target Industry Analysis Target Industry | 34
Renewable Energy Industry: Location Criteria
Industry Requirements Leading Strong Lacking Weak Assessment Rationale
GRANT COUNTY SCORECARD: RENEWABLE ENERGY INDUSTRY
There is a lack of ready-to-use business space and smart grid infrastructure
in Grant County. However, several land options exist for a renewable
energy-focused business park to be developed with EDA funding.
The instability of the global economic climate has made banks and
investors less willing to lend capital, making it much less readily available
for expanding businesses, which is reflected in Grant County.
Grant County-based entrepreneurs lack a support system in locating and
approaching potential investors as well as Venture and Angel Investor
firms. However, federal funding is available for green energy projects.
State and federal tax credits, along with utility buy-back programs for
renewable energy production are helping to foster an amicable
environment between green policy and implementation.
Grant County is located in proximity to NMSU, which has strong R&D
assets, particularly in engineering fields, as well as the NM Institute of
Mining & Tech. However, there is a lack of locally-based R&D assets.
Grant County has moderate highway and rail infrastructure, but is not
located directly on an interstate highway. Grant County’s location away from
major metro areas is also a challenge for renewable energy generation and
distribution.
Grant County has relatively inexpensive land rental rates and also has low
property taxes and relatively low electricity rates.
.
Grant County has an affordable workforce, however, it currently lacks
renewable energy specialists for the positions requiring deep expertise.
Some of which could be recruited from the NMSU field of experts.
Public Policy Support for the
Industry
Access to Available Natural
Resources
Skilled Workforce Available
Capital & Funding Sources
Access to Venture Capital
Research & Development
Assets
Structural Assets &
Infrastructure
Proximity to Market
Cost Factors
Southwestern New Mexico leads in solar and geothermal energy potential,
giving Grant County plenty of resources for extracting geothermal and
solar energy.

Target Industry | 35 Grant County Target Industry Analysis
Regional Goods & Services REGIONAL GOODS & SERVICES
EMPLOYMENT SECTORS
NAICS Description
44-45 Retail Trade
621 Ambulatory health care services
622 Hospitals
623 Nursing and residential care facilities
92 Public Administration
U.S. SECTOR EMPLOYMENT AND WAGES
• 2010 Employment:: 37,455,875
•2010 Average Wages: $43,215
NEW MEXICO SECTOR EMPLOYMENT AND WAGES
• 2010 Employment:: 248,257
• 2010 Average Wages: $40,176
GRANT COUNTY SECTOR EMPLOYMENT AND WAGES
• 2010 Employment:: 2,996
• 2010 Average Wages: $34,106
REGIONAL GOODS & SERVICES INDUSTRY DEFINITION
For the purposes of this study, the Regional Goods and Services industry is comprised of three broad industry
categories (retail trade, healthcare, and government) that are made up of multiple sectors (retail, ambulatory health
care services, hospitals, nursing and residential care facilities, and public administration).
REGIONAL GOODS & SERVICES INDUSTRY OVERVIEW
One of the most basic functions of a city or town is to serve as a central gathering place where individuals and
businesses from around the region can exchange goods, services, and ideas. Regional service centers serve this
basic function as a gathering place for local residents and businesses, but also draw economic activity from a broader
geographic region. Regional service centers rely on both local demand and visitors to support their businesses and to
provide employment for their residents in sectors such as healthcare, retail, restaurants, hotels, and
recreation/entertainment. Frequent visitation by tourists, shoppers and business travelers, can also be the source of
significant amounts of revenue for community businesses and of taxes for the community itself. Some regional service
centers seek to establish themselves as attractive destinations and work to support the presence of the tourism
industry as a growth strategy or as a means of diversifying the local economy.
The retail industry is one of the largest in the U.S. economy, employing nearly 15 million workers. This industry is
characterized by low wages and high levels of job turnover; however, it also provides a good source of employment
for workers with a limited amount of skills or for workers that require flexible schedules due to classes, child care, or
other needs. These industries also provide a wide range of opportunities for entrepreneurs and small business start-
ups.
The healthcare industry is one of the largest in the American economy and is projected to experience rapid growth in
employment and wages during the coming decade. As the industry continues to grow, a broader and more diverse
range of segments have emerged with greatly increased degrees of specialization. However, as the U.S. population
ages and moves around, the need for government services changes. A primary reason that healthcare expenses are
projected to account for 25 percent of GDP by 2025 is that the "baby boom" generation will soon be reaching the age
for Medicare eligibility. The same aging effect will drive Social Security to consume a higher portion of GDP in the
near future as well. For state and local governments, population shifts can change service needs dramatically. The
65-and-over population is expected to rise 80 percent by 2030, further adding to service needs.
Regional Goods &
Services
Photos: Grant County

Target Industry | 36 Grant County Target Industry Analysis
NATIONAL GROWTH TRENDS
The retail industry is both highly dependent on the broader economy as it lost about one million jobs from 2001 to
2010 in the U.S., however, it is projected to grow , albeit at a slow pace, over the next decade. The healthcare
industry enjoys very low cyclicality and is among the least vulnerable to economic downturns. During the recent
economic slowdown, the U.S. economy shed millions of jobs, but the healthcare industry’s total employment
continued to grow in absolute numbers, and the growth was even more pronounced when compared to other
industries. The healthcare industry gained several million jobs from 2001 to 2010 in the U.S. As the American
economy continues to make the slow transition from a goods-producing, manufacturing-centric economy to a
high-tech, knowledge-based economy, the healthcare industry will continue to exhibit rapid growth in
employment.
Employment at all levels of government has grown in recent years; the number of state and local government
employees increased more than four percent between 2004 and 2009. Likewise, the Bureau of Labor Statistics
(BLS) projects that the number of employees in the federal government will rise nearly 10 percent from 2008
levels by 2018. This picture for state and local governments is less certain, though fluctuating responsibility at the
state and local government level for what were federal services could increase the need for skilled employees.
GRANT COUNTY GROWTH TRENDS AND INDUSTRY OVERVIEW
Grant County’s economy is dependent on the regional goods and services industry, which employs 27% of Grant
County’s total employment, compared to 25% of New Mexico total employment and 23% of U.S. total
employment. Grant County’s regional goods and services industry grew by 7% between 2000 and 2010,
compared to a 16% growth rate in New Mexico and a 7% growth rate for the U.S. as a whole. A significant
challenge facing Grant County’s Regional Goods & Services industry is the minimal population growth. In fact,
Grant County actually experienced a decline in population of about 5% between 2000 and 2010. However, there
are some promising opportunities for growth within this industry. There are also opportunities to limit the amount
of retail leakage that is currently benefiting Luna County through the establishment of new specialty retailers in
Grant County. In addition, the large local, state, and federal employee base offers many opportunities to
capitalize upon. Overall, Grant County serves in a regional service center function, especially to the surrounding,
less populated counties.
REGIONAL GOODS & SERVICES
LOCATION CRITERIA
Assets that are important to businesses in this industry
when choosing where to locate.
• Trade Area
• Infrastructure
• Population Growth
• Aging Population and Young Population
•Available Land / Developments
• Existing Healthcare Providers
•Skilled and Affordable Workforce
• Entrepreneurial Environment
Regional Goods & Services
Regional Goods &
Services
Photos: Grant County

Target Industry | 37 Grant County Target Industry Analysis
Regional Goods & Services: U.S. and New Mexico Employment and Growth
Grant County Target Industry Analysis
Total Employment and Number of Establishments in Regional Goods & Services
Source: BLS
Regional Goods & Services Employment – National
Total Employment and Number of Establishments in Regional Goods & Services
244,598 248,600 247,798 248,257233,722227,805222,329
214,629
237,976 241,196
0
50,000
100,000
150,000
200,000
250,000
300,000
2001 2002 2003 2004 2005 2006 2007 2008 2009 2010
0
5,000
10,000
15,000
20,000
Employ ment Establishments
Source: BLS
Regional Goods & Services Employment – New Mexico
37,337 37,635 37,199 37,45536,75136,26134,876 35,192 35,401 35,762
1,786,1361,793,1641,779,3361,761,3211,739,0731,708,8751,690,959 1,699,111 1,720,0951,791,450
0
10,000
20,000
30,000
40,000
2001 2002 2003 2004 2005 2006 2007 2008 2009 2010
0
500,000
1,000,000
1,500,000
2,000,000
Employ ment (Millions) Establishments
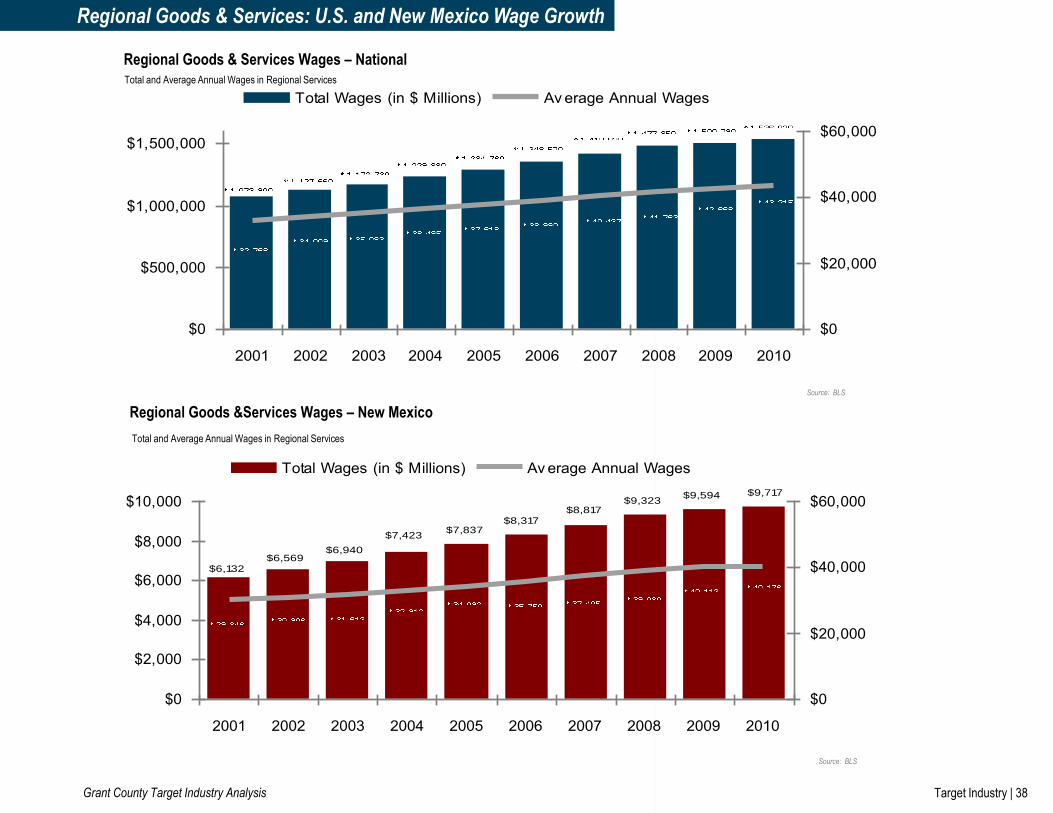
Target Industry | 38 Grant County Target Industry Analysis Grant County Target Industry Analysis
Regional Goods & Services: U.S. and New Mexico Wage Growth
$0
$500,000
$1,000,000
$1,500,000
2001 2002 2003 2004 2005 2006 2007 2008 2009 2010
$0
$20,000
$40,000
$60,000
Total Wages (in $ Millions) Av erage Annual Wages
Regional Goods & Services Wages – National Total and Average Annual Wages in Regional Services
Total and Average Annual Wages in Regional Services
$9,717$9,594$9,323
$8,817$8,317
$7,837
$6,132$6,569
$6,940
$7,423
$0
$2,000
$4,000
$6,000
$8,000
$10,000
2001 2002 2003 2004 2005 2006 2007 2008 2009 2010
$0
$20,000
$40,000
$60,000
Total Wages (in $ Millions) Av erage Annual Wages
Source: BLS
Regional Goods &Services Wages – New Mexico
Source: BLS

Target Industry | 39 Grant County Target Industry Analysis Grant County Target Industry Analysis
Regional Goods & Services: Grant County Employment and Wage Growth
Total Employment and Number of Establishments in Regional Goods & Services
2,9783,225 3,192 3,146
2,559
2,9462,942 2,894 2,870 2,978
341329311311298
290292 289 296
343
0
500
1,000
1,500
2,000
2,500
3,000
3,500
2001 2002 2003 2004 2005 2006 2007 2008 2009 2010
0
100
200
300
400
500
Employ ment Establishments
Source: BLS
Regional Goods & Services Employment – Grant County
Total and Average Annual Wages in Regional Goods & Services
$75$71$71$69
$76$81
$85
$97 $101 $104
$32,795$32,448$31,676 $32,731
$33,938
$36,122 $37,335$39,362
$41,236$42,901
$0
$20
$40
$60
$80
$100
2001 2002 2003 2004 2005 2006 2007 2008 2009 2010
$0
$10,000
$20,000
$30,000
$40,000
$50,000
Total Wages (in $Millions) Av erage Annual Wages
Source: BLS
Regional Goods & Services Wages – Grant County

Target Industry | 40 Grant County Target Industry Analysis Grant County Target Industry Analysis
Regional Goods & Services (Healthcare Only): Grant County Employment and Wage Growth
Total Employment and Number of Establishments in Healthcare
709
845 868 850
728746720 730 740 749
119
104
8788827876 77 79
121
0
100
200
300
400
500
600
700
800
900
2001 2002 2003 2004 2005 2006 2007 2008 2009 2010
0
50
100
150
Employ ment Establishments
Source: BLS
Healthcare Employment – Grant County
Total and Average Annual Wages in Healthcare
$19$18$18$18
$19 $20 $20
$26$28
$30
$24,781$24,300$24,100 $24,500
$25,254
$27,570$28,524
$31,135$32,416
$34,414
$0
$10
$20
$30
2001 2002 2003 2004 2005 2006 2007 2008 2009 2010
$0
$10,000
$20,000
$30,000
$40,000
$50,000
Total Wages (in $Millions) Av erage Annual Wages
Source: BLS
Healthcare Wages – Grant County

Target Industry | 41 Grant County Target Industry Analysis Grant County Target Industry Analysis
Regional Goods & Services (Retail Only): Grant County Employment and Wage Growth
Total Employment and Number of Establishments in Retail
1,222 1,2341,168 1,1391,1731,154
1,2241,156 1,123 1,170
101106110107107102104 100
107 104
0
500
1,000
1,500
2001 2002 2003 2004 2005 2006 2007 2008 2009 2010
0
50
100
150
200
Employ ment Establishments
Source: BLS
Retail Employment – Grant County
Total and Average Annual Wages in Retail
$21$20$19$20
$21 $22
$25 $25
$21
$24
$17,650$16,627$16,020
$17,445$18,055
$18,878 $20,260 $20,281$20,695
$21,164
$0
$10
$20
$30
2001 2002 2003 2004 2005 2006 2007 2008 2009 2010
$0
$10,000
$20,000
$30,000
$40,000
Total Wages (in $Millions) Av erage Annual Wages
Source: BLS
Retail Wages – Grant County

Target Industry | 42 Grant County Target Industry Analysis Grant County Target Industry Analysis
Regional Goods & Services (Public Administration): Grant County Employment and Wage Growth
Total Employment and Number of Establishments in Public Administration
567 569 569599
570531519 521 520 529
51505050485050 50 49 49
0
100
200
300
400
500
600
2001 2002 2003 2004 2005 2006 2007 2008 2009 2010
0
25
50
75
Employ ment Establishments
Source: BLS
Public Administration Employment – Grant County
Total and Average Annual Wages in Public Administration
$20$19$19
$17
$21$22
$23 $24$25 $25
$37,068$35,768
$33,595$36,200
$38,823 $39,251 $40,464 $41,949$44,107 $42,306
$0
$5
$10
$15
$20
$25
2001 2002 2003 2004 2005 2006 2007 2008 2009 2010
$0
$10,000
$20,000
$30,000
$40,000
$50,000
$60,000
Total Wages (in $Millions) Av erage Annual Wages
Source: BLS
Public Administration Wages – Grant County
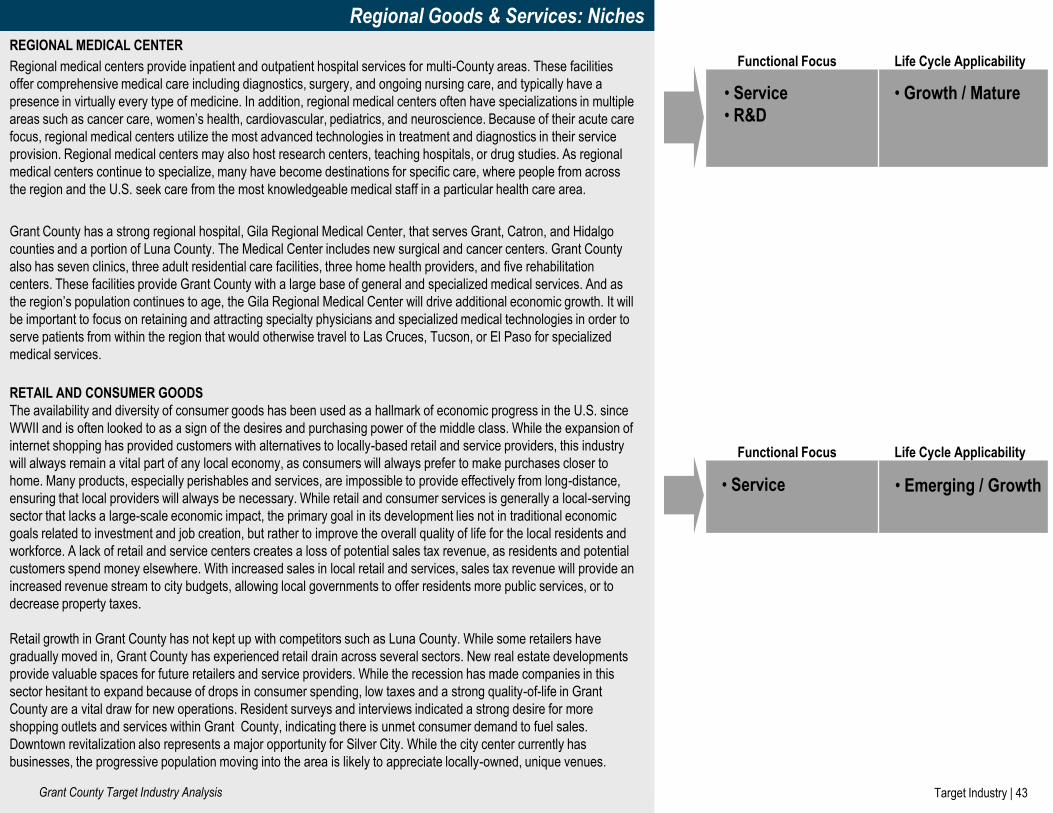
Target Industry | 43 Grant County Target Industry Analysis
Regional Goods & Services: Niches
REGIONAL MEDICAL CENTER
Regional medical centers provide inpatient and outpatient hospital services for multi-County areas. These facilities
offer comprehensive medical care including diagnostics, surgery, and ongoing nursing care, and typically have a
presence in virtually every type of medicine. In addition, regional medical centers often have specializations in multiple
areas such as cancer care, women’s health, cardiovascular, pediatrics, and neuroscience. Because of their acute care
focus, regional medical centers utilize the most advanced technologies in treatment and diagnostics in their service
provision. Regional medical centers may also host research centers, teaching hospitals, or drug studies. As regional
medical centers continue to specialize, many have become destinations for specific care, where people from across
the region and the U.S. seek care from the most knowledgeable medical staff in a particular health care area.
Grant County has a strong regional hospital, Gila Regional Medical Center, that serves Grant, Catron, and Hidalgo
counties and a portion of Luna County. The Medical Center includes new surgical and cancer centers. Grant County
also has seven clinics, three adult residential care facilities, three home health providers, and five rehabilitation
centers. These facilities provide Grant County with a large base of general and specialized medical services. And as
the region’s population continues to age, the Gila Regional Medical Center will drive additional economic growth. It will
be important to focus on retaining and attracting specialty physicians and specialized medical technologies in order to
serve patients from within the region that would otherwise travel to Las Cruces, Tucson, or El Paso for specialized
medical services.
RETAIL AND CONSUMER GOODS
The availability and diversity of consumer goods has been used as a hallmark of economic progress in the U.S. since
WWII and is often looked to as a sign of the desires and purchasing power of the middle class. While the expansion of
internet shopping has provided customers with alternatives to locally-based retail and service providers, this industry
will always remain a vital part of any local economy, as consumers will always prefer to make purchases closer to
home. Many products, especially perishables and services, are impossible to provide effectively from long-distance,
ensuring that local providers will always be necessary. While retail and consumer services is generally a local-serving
sector that lacks a large-scale economic impact, the primary goal in its development lies not in traditional economic
goals related to investment and job creation, but rather to improve the overall quality of life for the local residents and
workforce. A lack of retail and service centers creates a loss of potential sales tax revenue, as residents and potential
customers spend money elsewhere. With increased sales in local retail and services, sales tax revenue will provide an
increased revenue stream to city budgets, allowing local governments to offer residents more public services, or to
decrease property taxes.
Retail growth in Grant County has not kept up with competitors such as Luna County. While some retailers have
gradually moved in, Grant County has experienced retail drain across several sectors. New real estate developments
provide valuable spaces for future retailers and service providers. While the recession has made companies in this
sector hesitant to expand because of drops in consumer spending, low taxes and a strong quality-of-life in Grant
County are a vital draw for new operations. Resident surveys and interviews indicated a strong desire for more
shopping outlets and services within Grant County, indicating there is unmet consumer demand to fuel sales.
Downtown revitalization also represents a major opportunity for Silver City. While the city center currently has
businesses, the progressive population moving into the area is likely to appreciate locally-owned, unique venues.
Functional Focus Life Cycle Applicability
• Service
• R&D
• Growth / Mature
Functional Focus Life Cycle Applicability
• Emerging / Growth • Service

Target Industry | 44 Grant County Target Industry Analysis
Regional Goods & Services: Niches
REGIONAL GOVERNMENT SERVICE CENTER
The primary purpose of a region, County, or town acting in the capacity of a Government Service Center is to
provide support services to local, County, state, and/or federal government operations and programs. Such
support services include, but not limited to, providing housing to government workers, servicing and storing
government-owned vehicles, special storage or unique property disposition, infrastructure management,
information management, risk management via outsourcing to local populace, etc. Government entities could
include municipal, County, state, and federal governments to name a few.
While reduced levels of government spending threaten the growth of government-related businesses, there is also
a chance that a smaller-sized government will outsource the functions of some aspects of their current spending.
A case in point is how more government entities are outsourcing administrative tasks to focus on their core
competencies and potentially achieve cost savings. Private correctional facilities, water treatment and refuse and
recycling services have also slowly benefited over time from government outsourcing. Management consultants
and IT consultants have also proven to be adept at helping government find better ways to maintain critical
functions while doing it more efficiently.
Grant County already services a large governmental community: municipal and County governments, and the
federal government via the Border Patrol and Forest Service. However, finding new creative and efficient ways to
help these government entities to reduce costs is the key to growing Grant County as a regional government
service center.
Functional Focus Life Cycle Applicability
• Emerging / Growth • Service

Target Industry | 45 Grant County Target Industry Analysis
Regional Goods & Services: Location Criteria
Industry Requirements Leading Strong Lacking Weak Assessment Rationale
GRANT COUNTY SCORECARD: REGIONAL GOODS & SERVICES
Grant County is not directly located on an interstate highway and lacks a
quality infrastructure network including widened roadways and rail spur
extensions.
Available Land /
Developments
Aging Population (Healthcare)
Trade Area
Existing Healthcare
Providers
Population Growth
Skilled and Affordable
Workforce
Grant County has an aging population, which will help drive demand for
healthcare, however, the demand for a healthcare workforce may soften
given Grant County’s dwindling young population.
Grant County has a large amount of land available for development,
however, running utilities to undeveloped land is problematic and
expensive due to the bedrock in the terrain.
Grant County is the center of a three-County region, making it an important
for retail, healthcare, education, and government services. The County also
has experienced strong growth in business establishments over the past
decade.
Grant County has a high-quality regional medical center: Gila Regional
Medical Center. It also has seven clinics, three adult residential care
facilities, three home health providers, and five rehabilitation centers.
Grant County’s workforce is affordable, but does not include a large
number of highly-trained professionals. However, the workforce has a
diverse skill set reaching across the tourism, mining, and educational
sectors.
Grant County has a strong heritage of supporting small businesses and
entrepreneurs and the local businesspeople are highly entrepreneurial and
resourceful. There are strong local banks alongside the presence of an
SBDC office.
Infrastructure
Entrepreneurial
Environment
Grant County’s population increased for five consecutive decades before
experiencing a decline in 2010. However, its population is expected to
grow close to 40,000 by 2050.

Target Industry | 46 Grant County Target Industry Analysis
TOURISM & RECRATION INDUSTRY DEFINITION
For the purposes of this study, the tourism and recreation industry includes businesses that serve or cater to
travelers or visitors and firms that provide support to other businesses serving these individuals. This includes tour
operators, museums, and related amusement and recreation industries, hotels, and restaurants.
TOURISM & RECREATION INDUSTRY OVERVIEW
The Tourism and Recreation industry is central to the economies of many communities and regions. Frequent
visitation by tourists, shoppers and business travelers, can be the source of significant amounts of revenue for
community businesses and of taxes for the community itself. Many locations rely on tourism for the support of
their businesses and for the employment of their residents. Other communities seek to establish themselves as
attractive destinations and work to support the presence of the tourism industry as a growth strategy or as a
means of diversifying the local economy.
The Tourism and Recreation industry seeks new and innovative ways of entertaining visitors through cultural
experiences, unique museums, live music and shows, or other attractions. In recent years, new segments of the
tourism industry have emerged including health tourism, eco-tourism, and agri-tourism. Although this industry
offers low wages, it does provide employment opportunities for low-skilled individuals and contributes significantly
to a community’s tax base. The more tourists a community can attract, especially from outside the immediate
region, the more visibility and recognition the community will receive, which can help create a positive brand that
can be marketed and leveraged to attract firms in other industries.
For many communities, the primary local assets that attract visitors include cultural institutions such as museums,
historical sites, opera houses, concert venues and regional cuisine or fine dining. When this is combined with
related entertainment activities, it can serve as a strong method for attracting visitors and increasing tourism
revenues in a region. Communities that wish to draw upon local historic and cultural assets should develop a
strategy that promotes these features in a manner that will be best received by the target market for the
community. The community should likewise consider ways to draw businesses or other attractions to the areas
around these historic and cultural assets that compliment them, support their success and present more
opportunities for the local economy to benefit from visitors attracted by these assets.
Tourism & Recreation TOURISM & RECREATION
EMPLOYMENT SECTORS
NAICS Description
114 Fishing, Hunting, & Trapping
31212 Breweries
33992 Sporting & Athletic Goods Manufacturers
4511 Sporting Goods Stores
487 Scenic & Sightseeing Transportation
71 Arts, Entertainment, & Recreation
72 Accommodation & Food Services
U.S. SECTOR EMPLOYMENT AND WAGES
• 2010 Employment:: 14,048,865
• 2010 Average Wages:$19,876
NEW MEXICO SECTOR EMPLOYMENT AND WAGES
• 2010 Employment:: 100,070
• 2010 Average Annual Wages: $18,085
GRANT COUNTY SECTOR EMPLOYMENT AND WAGES
• 2010 Employment:: 917
• 2010 Average Annual Wages: $12,431
Photos: Mary Alice Murphy
Tourism &
Recreation
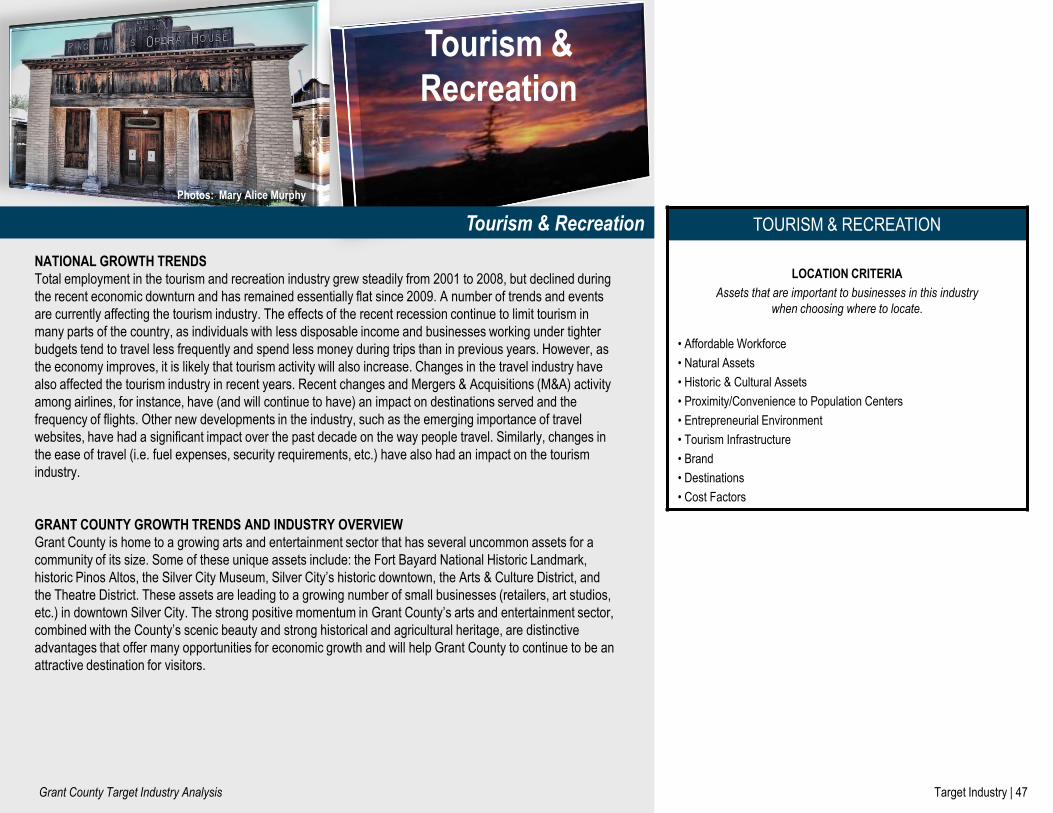
Target Industry | 47 Grant County Target Industry Analysis
TOURISM & RECREATION
LOCATION CRITERIA
Assets that are important to businesses in this industry
when choosing where to locate.
• Affordable Workforce
• Natural Assets
• Historic & Cultural Assets
• Proximity/Convenience to Population Centers
• Entrepreneurial Environment
• Tourism Infrastructure
• Brand
• Destinations
• Cost Factors
NATIONAL GROWTH TRENDS
Total employment in the tourism and recreation industry grew steadily from 2001 to 2008, but declined during
the recent economic downturn and has remained essentially flat since 2009. A number of trends and events
are currently affecting the tourism industry. The effects of the recent recession continue to limit tourism in
many parts of the country, as individuals with less disposable income and businesses working under tighter
budgets tend to travel less frequently and spend less money during trips than in previous years. However, as
the economy improves, it is likely that tourism activity will also increase. Changes in the travel industry have
also affected the tourism industry in recent years. Recent changes and Mergers & Acquisitions (M&A) activity
among airlines, for instance, have (and will continue to have) an impact on destinations served and the
frequency of flights. Other new developments in the industry, such as the emerging importance of travel
websites, have had a significant impact over the past decade on the way people travel. Similarly, changes in
the ease of travel (i.e. fuel expenses, security requirements, etc.) have also had an impact on the tourism
industry.
GRANT COUNTY GROWTH TRENDS AND INDUSTRY OVERVIEW
Grant County is home to a growing arts and entertainment sector that has several uncommon assets for a
community of its size. Some of these unique assets include: the Fort Bayard National Historic Landmark,
historic Pinos Altos, the Silver City Museum, Silver City’s historic downtown, the Arts & Culture District, and
the Theatre District. These assets are leading to a growing number of small businesses (retailers, art studios,
etc.) in downtown Silver City. The strong positive momentum in Grant County’s arts and entertainment sector,
combined with the County’s scenic beauty and strong historical and agricultural heritage, are distinctive
advantages that offer many opportunities for economic growth and will help Grant County to continue to be an
attractive destination for visitors.
Tourism & Recreation
Photos: Mary Alice Murphy
Tourism &
Recreation
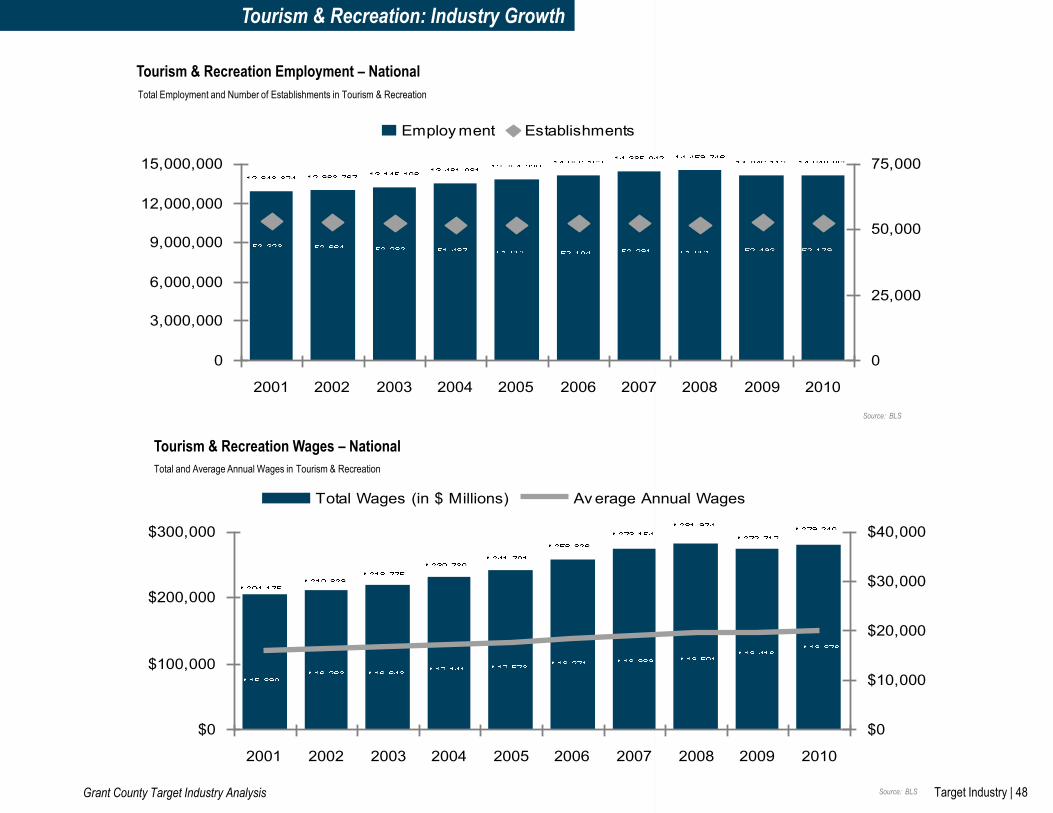
Target Industry | 48 Grant County Target Industry Analysis
Tourism & Recreation: Industry Growth
Total Employment and Number of Establishments in Tourism & Recreation
0
3,000,000
6,000,000
9,000,000
12,000,000
15,000,000
2001 2002 2003 2004 2005 2006 2007 2008 2009 2010
0
25,000
50,000
75,000
Employ ment Establishments
Source: BLS
Tourism & Recreation Employment – National
Total and Average Annual Wages in Tourism & Recreation
$0
$100,000
$200,000
$300,000
2001 2002 2003 2004 2005 2006 2007 2008 2009 2010
$0
$10,000
$20,000
$30,000
$40,000
Total Wages (in $ Millions) Av erage Annual Wages
Source: BLS
Tourism & Recreation Wages – National
Grant County Target Industry Analysis
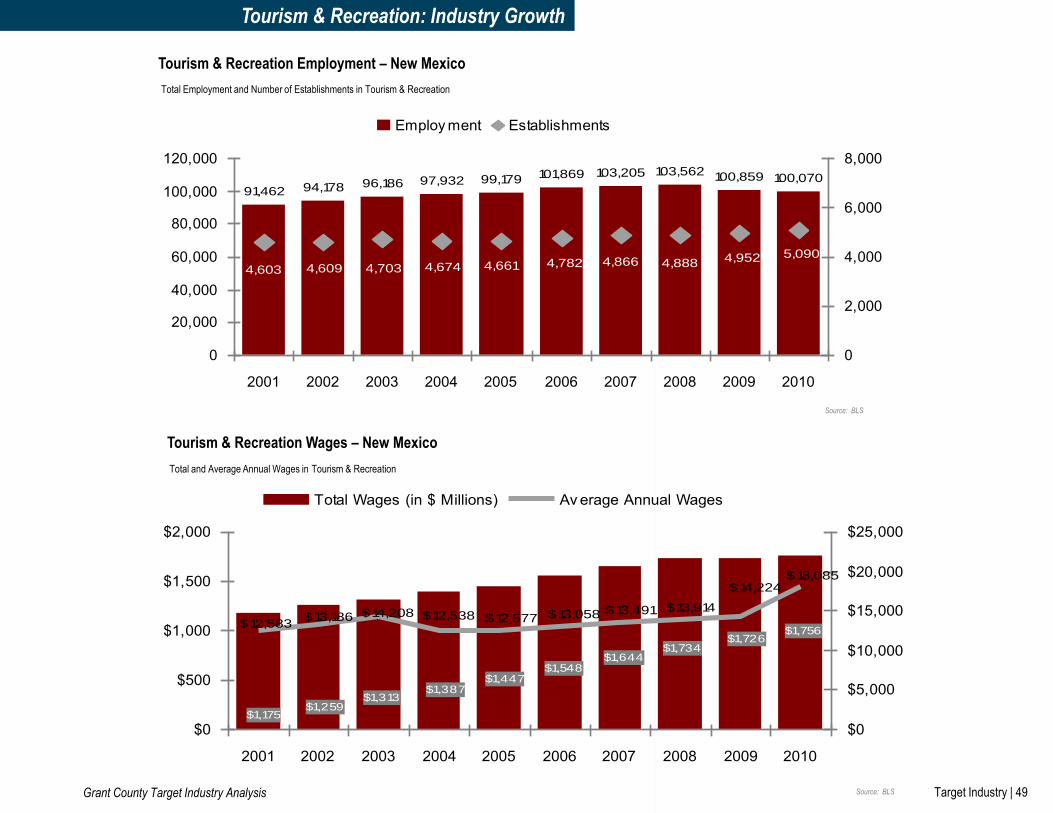
Grant County Target Industry Analysis Target Industry | 49
Tourism & Recreation: Industry Growth
Total Employment and Number of Establishments in Tourism & Recreation
103,205 103,562 100,859 100,07097,93296,18694,17891,46299,179 101,869
5,0904,6744,6094,603 4,703 4,661 4,782 4,866 4,888 4,952
0
20,000
40,000
60,000
80,000
100,000
120,000
2001 2002 2003 2004 2005 2006 2007 2008 2009 2010
0
2,000
4,000
6,000
8,000
Employ ment Establishments
Source: BLS
Tourism & Recreation Employment – New Mexico
Total and Average Annual Wages in Tourism & Recreation
$1,756$1,726
$1,734$1,644
$1,548$1,447
$1,175$1,259
$1,313$1,387
$18,085$14,224
$13,914$13,491$13,058$12,577$14,208$12,583
$13,186 $12,538
$0
$500
$1,000
$1,500
$2,000
2001 2002 2003 2004 2005 2006 2007 2008 2009 2010
$0
$5,000
$10,000
$15,000
$20,000
$25,000
Total Wages (in $ Millions) Av erage Annual Wages
Source: BLS
Tourism & Recreation Wages – New Mexico
Grant County Target Industry Analysis

Grant County Target Industry Analysis Target Industry | 50
Tourism & Recreation: Industry Growth
Grant County Target Industry Analysis
Total Employment and Number of Establishments in Tourism & Recreation
1,056978 930 917
1,1391,062
1,316
1,131 1,125 1,103
92919692878786 8694 96
0
200
400
600
800
1,000
1,200
1,400
2001 2002 2003 2004 2005 2006 2007 2008 2009 2010
0
100
200
Employ ment Establishments
Source: BLS
Tourism & Recreation Employment – Grant County
Total and Average Annual Wages in Tourism & Recreation
$10$10$9$9
$10
$11 $11 $11 $11 $11
$8,580
$7,881
$6,736
$8,553
$9,636$9,985
$12,451
$10,361
$12,797 $12,431
$0
$2
$4
$6
$8
$10
$12
2001 2002 2003 2004 2005 2006 2007 2008 2009 2010
$0
$5,000
$10,000
$15,000
Total Wages (in $Millions) Av erage Annual Wages
Source: BLS
Tourism & Recreation Wages – Grant County

Target Industry | 51 Grant County Target Industry Analysis
Tourism: Niches
HISTORIC AND CULTURAL TOURISM
For many communities, the primary local assets that attract visitors include certain cultural institutions such as
museums, opera houses, concert venues and regional cuisine or fine dining, as well as various historical sites or
buildings that are present in the area. This portion of the industry can be highly important to a community or
region’s economy and drives much of the tourism that takes place throughout the world. Communities that wish to
draw upon local historic and cultural assets should develop a strategy that promotes these features in a manner
that will be best received by the target market for the community. The community should develop strategies to
draw businesses or other attractions to the areas around these historic and cultural assets that compliment them,
support their success and present more opportunities for the local economy to benefit from visitors attracted by
these assets.
Grant County has a strong historical and cultural heritage that connects it to the Old West via Pinos Altos, Ft.
Bayard, and other historic sites. The Silver City Museum helps to capture this cultural heritage of southwestern
New Mexico by showcasing the region’s unique history. And there are many opportunities to expand upon these
assets, either by developing complementary historic and cultural destinations or by increasing access to existing
destinations. Silver City displays a downtown area that is growing in vibrancy and business activity building off
the existing historic and cultural scene.
OUTDOOR RECREATION & EVENTS
Festivals, sporting events, and outdoor recreation is one of the most important sectors of the broader tourism
industry because it is particularly appealing to young individuals and families and supports many related
businesses including restaurants, hotels, and retailers. Communities that are situated in close proximity to an
attractive outdoor recreation destination (e.g. lake, mountains, beach, state or national park, etc.) can often
support strong tourism activity centered around a key natural asset. Different attractions will tend to draw different
groups and so it is important for communities to determine what markets or groups would be most attracted to the
outdoor spots in the area. This can help communities to determine what activities these visitors are most likely to
demand, to position the community in a way that best caters to these visitors and to attract businesses that will be
in the best position to support these types of activities A growing number of communities have found remarkable
success in the support of outdoor and extreme sports targeted at younger individuals and athletes. Sporting
events such as little league tournaments and festivals that highlight a region’s unique cultural assets can also be a
major drivers of economic activity because they attract hundreds (sometimes thousands) of visitors from outside
of the region that spend money at local businesses.
Grant County has a strong existing base of festivals, sporting events, and outdoor recreation. Grant County’s rich
heritage of festivals already draws in visitors and generates additional revenue for the County’s economy. The
Blues Festival, Chocolate Fantasia, the Tamale Festival , and the Red Paint Pow Wow are some examples of the
unique festivals that help support Grant County’s broader regional goods and services industry. And Grant
County’s moderate year-round temperatures offer a distinctive advantage of having a longer timeline to host such
events.
Functional Focus Life Cycle Applicability
• Growth / Mature • Service
• Sales / Marketing
Functional Focus Life Cycle Applicability
• Service
• Sales / Marketing
• Emerging / Growth
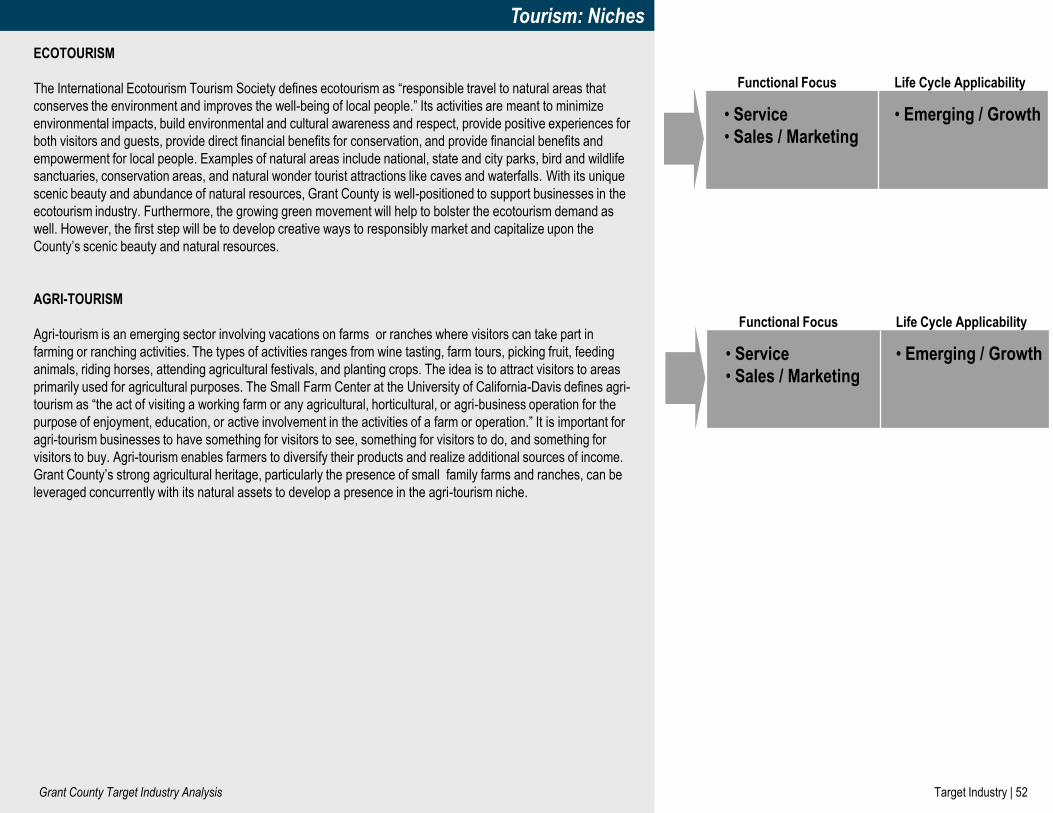
Target Industry | 52 Grant County Target Industry Analysis
Tourism: Niches
ECOTOURISM
The International Ecotourism Tourism Society defines ecotourism as “responsible travel to natural areas that
conserves the environment and improves the well-being of local people.” Its activities are meant to minimize
environmental impacts, build environmental and cultural awareness and respect, provide positive experiences for
both visitors and guests, provide direct financial benefits for conservation, and provide financial benefits and
empowerment for local people. Examples of natural areas include national, state and city parks, bird and wildlife
sanctuaries, conservation areas, and natural wonder tourist attractions like caves and waterfalls. With its unique
scenic beauty and abundance of natural resources, Grant County is well-positioned to support businesses in the
ecotourism industry. Furthermore, the growing green movement will help to bolster the ecotourism demand as
well. However, the first step will be to develop creative ways to responsibly market and capitalize upon the
County’s scenic beauty and natural resources.
AGRI-TOURISM
Agri-tourism is an emerging sector involving vacations on farms or ranches where visitors can take part in
farming or ranching activities. The types of activities ranges from wine tasting, farm tours, picking fruit, feeding
animals, riding horses, attending agricultural festivals, and planting crops. The idea is to attract visitors to areas
primarily used for agricultural purposes. The Small Farm Center at the University of California-Davis defines agri-
tourism as “the act of visiting a working farm or any agricultural, horticultural, or agri-business operation for the
purpose of enjoyment, education, or active involvement in the activities of a farm or operation.” It is important for
agri-tourism businesses to have something for visitors to see, something for visitors to do, and something for
visitors to buy. Agri-tourism enables farmers to diversify their products and realize additional sources of income.
Grant County’s strong agricultural heritage, particularly the presence of small family farms and ranches, can be
leveraged concurrently with its natural assets to develop a presence in the agri-tourism niche.
Functional Focus Life Cycle Applicability
• Service
• Sales / Marketing
• Emerging / Growth
Functional Focus Life Cycle Applicability
• Service
• Sales / Marketing
• Emerging / Growth
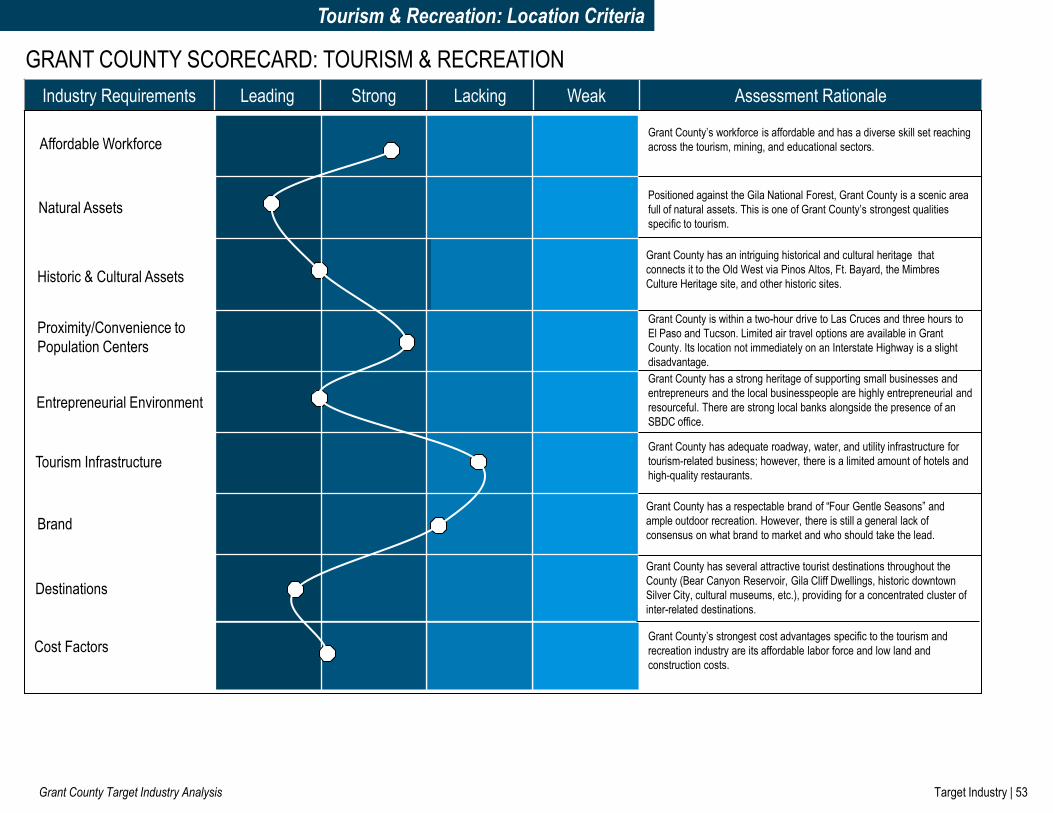
Target Industry | 53 Grant County Target Industry Analysis
Tourism & Recreation: Location Criteria
Industry Requirements Leading Strong Lacking Weak Assessment Rationale
GRANT COUNTY SCORECARD: TOURISM & RECREATION
Grant County has an intriguing historical and cultural heritage that
connects it to the Old West via Pinos Altos, Ft. Bayard, the Mimbres
Culture Heritage site, and other historic sites.
Grant County has a respectable brand of “Four Gentle Seasons” and
ample outdoor recreation. However, there is still a general lack of
consensus on what brand to market and who should take the lead.
Grant County has several attractive tourist destinations throughout the
County (Bear Canyon Reservoir, Gila Cliff Dwellings, historic downtown
Silver City, cultural museums, etc.), providing for a concentrated cluster of
inter-related destinations.
Affordable Workforce
Natural Assets
Historic & Cultural Assets
Tourism Infrastructure
Entrepreneurial Environment
Proximity/Convenience to
Population Centers
Brand
Destinations
Cost Factors
Positioned against the Gila National Forest, Grant County is a scenic area
full of natural assets. This is one of Grant County’s strongest qualities
specific to tourism.
Grant County is within a two-hour drive to Las Cruces and three hours to
El Paso and Tucson. Limited air travel options are available in Grant
County. Its location not immediately on an Interstate Highway is a slight
disadvantage.
Grant County has adequate roadway, water, and utility infrastructure for
tourism-related business; however, there is a limited amount of hotels and
high-quality restaurants.
Grant County’s strongest cost advantages specific to the tourism and
recreation industry are its affordable labor force and low land and
construction costs.
Grant County’s workforce is affordable and has a diverse skill set reaching
across the tourism, mining, and educational sectors.
Grant County has a strong heritage of supporting small businesses and
entrepreneurs and the local businesspeople are highly entrepreneurial and
resourceful. There are strong local banks alongside the presence of an
SBDC office.

Target Industry | 54 Grant County Target Industry Analysis
NATIONAL OVERVIEW
While it is not industry specific, economic developers need to attract and retain entrepreneurs and small business
owners, as well as cultivate existing local talent, to improve and maintain national competitiveness. These are the
individuals and businesses most likely to grow and build or expand within a community. These companies and
entrepreneurs help provide and shape the identity of a community and are less likely to relocate than a firm that
moves branch operations into the area.
Firms and entrepreneurs within this sector have experience in a variety of skill areas that include but are not limited
to research and development, commercialization of emerging technology, and business management. They often
consist of researchers who have created a technological innovation or advancement. These researchers work with
highly-skilled, highly-experienced startup managers to develop and implement market commercialization strategies.
As these businesses – usually less than 10 people in the start-up phase – become successful, they are likely to keep
their headquarters local due to high relocation costs and an affinity for the region by the primary decision makers.
Current economic uncertainty combined with real corporate losses are precipitating many major firms to lay off large
numbers of employees. While this creates an immediate challenge for communities, it also provides real
opportunities for laid-off employees to take the risk of starting their own businesses and for other businesses to
capture local talent.
Small Business and Entrepreneurship

Target Industry | 55 Grant County Target Industry Analysis
LOCAL OVERVIEW
• Grant County is in a particularly strong position to capitalize on entrepreneurship thanks to a highly innovative
population, demonstrated by the local businesspeople and their entrepreneurial spirit and resourcefulness.
Additional momentum could be developed by building a worker pipeline in partnership with WNMU’s Applied
Technology School which offers Certificate Programs and Associates degrees in Computer and Network
Technology, Construction Technology, Digital Media Communications, Electrical Technology, Financial Services,
and Welding Technology. All of which contribute to the Internet-based commerce that is already prevalent within
the County, providing the potential for growth and expansion in the entrepreneurship and small business sector.
• There are numerous assets related to small business and enterprise both within Grant County and the
southwestern New Mexico region; some of these include the SBDC housed in WNMU, the International Business
Accelerator (IBA) located in Santa Teresa, NM but owned by WNMU with funding from the SBDC, and the South
West Office of Regional Data (SWORD). However, there is an overall lack of incubator space and support
programs.
• Nearby universities, especially New Mexico State University, are also valuable sources of both talent and support
for entrepreneurs and small business owners. NMSU receives a large amount of R&D funding in engineering and
agriculture, which is likely to produce a wealth of innovations that can serve as a foundation for future
entrepreneurial ventures. WNMU and NMSU need to foster a stronger relationship within this realm given their
proximity and related interests.
• While traditional sources of financing have dried up because of the recession, the state of New Mexico still offers
a sufficient amount of venture and angel capital firms looking to invest in promising start-up ventures. However,
potential entrepreneurs in Grant County seeking funding may need support in finding and approaching these New
Mexico venture and angel capital firms.
• While quality-of-life and an affordable workforce are important assets that Grant County can offer small
businesses, many small business owners cited a number of challenges operating in Grant County, such as a lack
of infrastructure, a unmotivated workforce, and a lack of small business support.
Small Business and Entrepreneurship

Target Industry | 56 Grant County Target Industry Analysis
Occupations and Competencies
KEY OCCUPATIONS IN TARGET INDUSTRIES
A critical aspect of further developing these industry opportunities in Grant County is the cultivation of a pool of
talent with the appropriate skills for firms to be competitive. This section identifies the specific growing occupations
for the four primary target industries selected and highlights the current concentration of these occupations within
Grant County. The data provides an understanding of what jobs will continue to be in demand and how economic
and workforce development efforts can support the future economic development goals through job training and
education.
METHODOLOGY
Occupational information in this section was gathered from the Bureau of Labor Statistics. Much of the findings are
based on occupational location quotients which quantify both how concentrated a particular occupation is in a
particular industry as well as what makes Grant County’s occupational mix unique in comparison to the national
average. Occupational data from the Bureau of Labor of Statistics is provided for the southwestern New Mexico
region.
TOP OCCUPATIONS IN DEMAND IN THE U.S.
In the following pages are the top occupations “In Demand” in the U.S per target industry sector. “In Demand”
occupations are those that meet two criteria:
1. Occupations that are projected to grow over the next 10 years nationally.
2. Occupations that have a high occupational LQ (above 1.0) within a sector; meaning the occupation is heavily
concentrated within that specific industry nationwide. For example, soil and plant scientists have an
occupational LQ of 28.10 within the bio-technology industry. This indicates that soil and plant scientists are
28.10 times more concentrated within the bio-technology industry than in the U.S. economy as a whole.

Target Industry | 57 Grant County Target Industry Analysis
The Top 20 In-Demand Occupations - As identified in the
previous page, these are occupations within a particular
industry that have a high occupational LQ and are projected
to grow nationally.
Average annual wages - for that particular occupation in
Grant County.
The Grant County Makeup of “In-Demand” Occupations -
Grant County’s current occupational concentration in each of
the top 20 “In-Demand” Occupations. An LQ of higher than 1
means Grant County has a higher concentration of a
particular occupation than the U.S. as a whole, and thus a
competitive strength.
% with Bachelor’s Degree - for that particular occupation.
Education and Training Requirements - for that particular
occupation.
Workforce Priority Area - These are occupations that are
“In-Demand” nationally and pay a wage higher than the 2011
Grant County average wage of $32,918.
1 23
4
5
7
Occupational Areas of Focus
This section provides a regional occupational snapshot, highlighting
occupations within each target industry that are in demand nationally
and identifies how Grant County “measures up” in terms of its current
concentration of those jobs.
The following pages are organized by target industry and each chart
summarizes eight key data points. The figure to the left provides an
example:
Occupations and Competencies
Sources: BLS Occupational and Employment Statistics
“IN-DEMAND” OCCUPATIONS CHART EXAMPLE
6
8
Key Occupations in the Natural Resources & Mining Industry
Occupational Title
Concentration
Within the
Industry
10-year
U.S.
Growth
Projection
Avg.
Annual
Wages -
SW New
Mexico
"In Demand"
Occupations
(Local
Occupational
Concentration)
% with
Bachelor's
Degree+ Education
Refuse and Recyclable Material Collectors 47.50 18.6% $23,190 1.95 4% Short-term on-the-job training
Maintenance Workers, Machinery 5.58 4.6% $30,290 3.55 5%
Moderate-term on-the-job
training
Maintenance Workers, Machinery 5.58 4.6% $30,290 3.55 5%
Moderate-term on-the-job
training
Separating, Filtering, Clarifying, Precipitating, and Still
Machine Setters, Operators, and Tenders 5.38 10.6% $32,130 0.00 14%
Moderate-term on-the-job
training
Bus and Truck Mechanics and Diesel Engine Specialists 5.15 5.7% $32,540 3.10 3%
Postsecondary vocational
award
Inspectors, Testers, Sorters, Samplers, and Weighers 4.78 -3.6% $35,680 1.08 14%
Moderate-term on-the-job
training
Helpers--Production Workers 4.27 -0.1% $22,580 2.13 6% Short-term on-the-job training
Heavy and Tractor-Trailer Truck Drivers 3.78 13.0% $33,410 0.71 5% Short-term on-the-job training
First-Line Supervisors of Production and Operating Workers 3.46 -5.2% $41,290 0.71 15%
Work experience in a related
occupation
Team Assemblers 3.06 0.0% $23,560 0.00 5%
Moderate-term on-the-job
training
Electrical and Electronics Engineering Technicians 2.93 -2.2% $48,730 1.67 17% Associate degree
Operating Engineers and Other Construction Equipment
Operators 2.74 12.0% $35,700 3.83 3%
Moderate-term on-the-job
training
Water and Wastewater Treatment Plant and System
Operators 2.52 19.8% $26,670 2.28 10% Long-term on-the-job training
Laborers and Freight, Stock, and Material Movers, Hand 2.30 -0.8% $22,990 0.58 5% Short-term on-the-job training
First-Line Supervisors of Mechanics, Installers, and
Repairers 2.28 4.3% $48,060 1.54 12%
Work experience in a related
occupation
Packaging and Filling Machine Operators and Tenders 2.02 -0.7% $17,450 1.73 4% Short-term on-the-job training
First-Line Supervisors of Construction Trades and
Extraction Workers 1.60 15.4% $46,660 1.35 11%
Work experience in a related
occupation
Carpenters 1.49 12.9% $29,900 1.51 7% Long-term on-the-job training
General and Operations Managers 1.38 -0.1% $81,490 0.69 49%
Bachelor's or higher degree,
plus work experience
Payroll and Timekeeping Clerks 1.32 -5.3% $29,370 1.09 15%
Moderate-term on-the-job
training
1 2 3 4 5 6 7
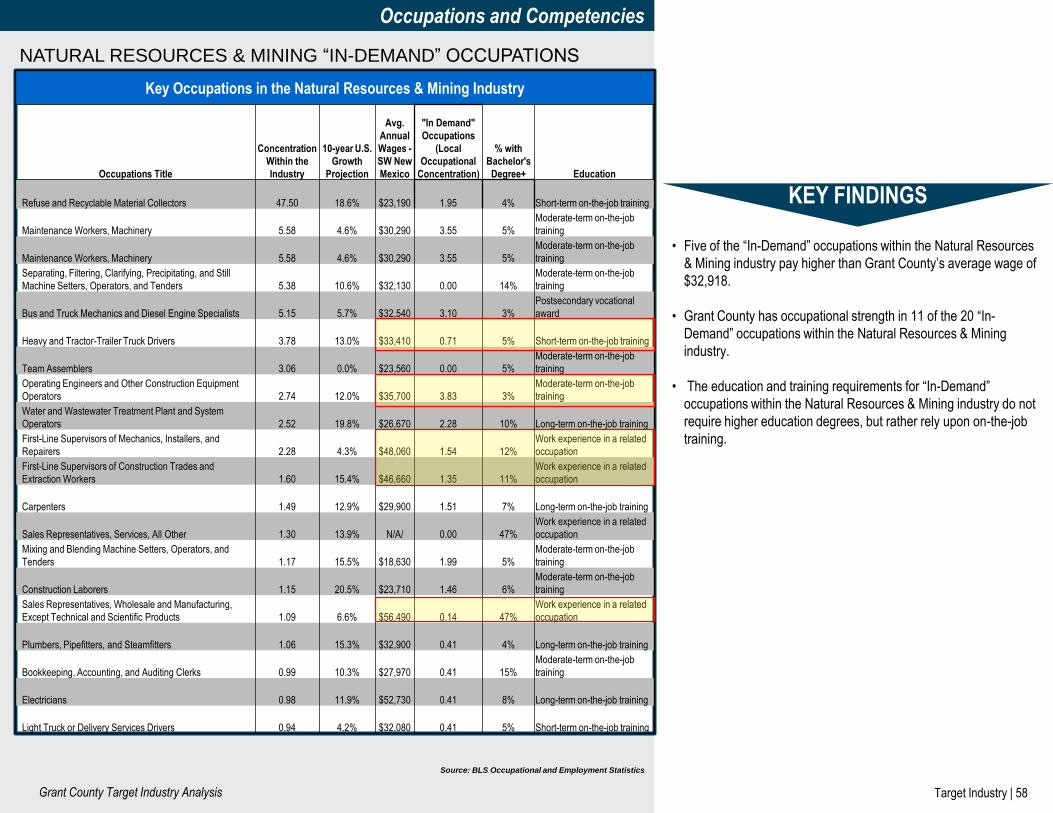
Target Industry | 58 Grant County Target Industry Analysis
Occupations and Competencies
NATURAL RESOURCES & MINING “IN-DEMAND” OCCUPATIONS
• Five of the “In-Demand” occupations within the Natural Resources
& Mining industry pay higher than Grant County’s average wage of
$32,918.
• Grant County has occupational strength in 11 of the 20 “In-
Demand” occupations within the Natural Resources & Mining
industry.
• The education and training requirements for “In-Demand”
occupations within the Natural Resources & Mining industry do not
require higher education degrees, but rather rely upon on-the-job
training.
KEY FINDINGS
Key Occupations in the Natural Resources & Mining Industry
Occupations Title
Concentration
Within the
Industry
10-year U.S.
Growth
Projection
Avg.
Annual
Wages -
SW New
Mexico
"In Demand"
Occupations
(Local
Occupational
Concentration)
% with
Bachelor's
Degree+ Education
Refuse and Recyclable Material Collectors 47.50 18.6% $23,190 1.95 4% Short-term on-the-job training
Maintenance Workers, Machinery 5.58 4.6% $30,290 3.55 5%
Moderate-term on-the-job
training
Maintenance Workers, Machinery 5.58 4.6% $30,290 3.55 5%
Moderate-term on-the-job
training
Separating, Filtering, Clarifying, Precipitating, and Still
Machine Setters, Operators, and Tenders 5.38 10.6% $32,130 0.00 14%
Moderate-term on-the-job
training
Bus and Truck Mechanics and Diesel Engine Specialists 5.15 5.7% $32,540 3.10 3%
Postsecondary vocational
award
Heavy and Tractor-Trailer Truck Drivers 3.78 13.0% $33,410 0.71 5% Short-term on-the-job training
Team Assemblers 3.06 0.0% $23,560 0.00 5%
Moderate-term on-the-job
training
Operating Engineers and Other Construction Equipment
Operators 2.74 12.0% $35,700 3.83 3%
Moderate-term on-the-job
training
Water and Wastewater Treatment Plant and System
Operators 2.52 19.8% $26,670 2.28 10% Long-term on-the-job training
First-Line Supervisors of Mechanics, Installers, and
Repairers 2.28 4.3% $48,060 1.54 12%
Work experience in a related
occupation
First-Line Supervisors of Construction Trades and
Extraction Workers 1.60 15.4% $46,660 1.35 11%
Work experience in a related
occupation
Carpenters 1.49 12.9% $29,900 1.51 7% Long-term on-the-job training
Sales Representatives, Services, All Other 1.30 13.9% N/A/ 0.00 47%
Work experience in a related
occupation
Mixing and Blending Machine Setters, Operators, and
Tenders 1.17 15.5% $18,630 1.99 5%
Moderate-term on-the-job
training
Construction Laborers 1.15 20.5% $23,710 1.46 6%
Moderate-term on-the-job
training
Sales Representatives, Wholesale and Manufacturing,
Except Technical and Scientific Products 1.09 6.6% $56,490 0.14 47%
Work experience in a related
occupation
Plumbers, Pipefitters, and Steamfitters 1.06 15.3% $32,900 0.41 4% Long-term on-the-job training
Bookkeeping, Accounting, and Auditing Clerks 0.99 10.3% $27,970 0.41 15%
Moderate-term on-the-job
training
Electricians 0.98 11.9% $52,730 0.41 8% Long-term on-the-job training
Light Truck or Delivery Services Drivers 0.94 4.2% $32,080 0.41 5% Short-term on-the-job training
Source: BLS Occupational and Employment Statistics

Target Industry | 59 Grant County Target Industry Analysis
Occupations and Competencies
RENEWABLE ENERGY “IN-DEMAND” OCCUPATIONS
• The majority of “In-Demand” occupations within the Renewable
Energy industry pay higher than average wages, however, there are
a few occupations that pay significantly less than the average wage
of $32,918.
• Grant County has occupational strength in 12 of the 20 “In-
Demand” occupations within the Renewable Energy industry.
• The “In-Demand” occupations within the Renewable Energy
industry include a balanced mix of either on-the-job training or
higher education degrees.
KEY FINDINGS
Key Occupations in the Renewable Energy Industry
Occupations Title
Concentra
tion
Within the
Industry
10-year
U.S.
Growth
Projection
Avg.
Annual
Wages -
SW New
Mexico
"In Demand"
Occupations
(Local
Occupational
Concentration)
% with
Bachelor
's
Degree+ Education
Civil Engineers 34.62 24.3% $61,120 0.79 85% Bachelor's degree
Electrical Power-Line Installers and Repairers 18.35 4.5% $46,870 2.34 5% Long-term on-the-job training
Hydrologists 18.33 18.3% $76,370 0.00 92% Master's degree
Biological Scientists, All Other 8.09 18.8% $52,150 4.86 93% Doctoral degree
Managers, All Other 2.54 7.3% $77,540 1.01 53%
Work experience in a related
occupation
Executive Secretaries and Executive Administrative
Assistants 2.40 12.8% $40,920 0.39 17%
Work experience in a related
occupation
Management Analysts 2.24 23.9% $54,110 0.37 76%
Bachelor's or higher degree, plus work
experience
Construction Laborers 2.18 20.5% $23,710 1.46 6% Moderate-term on-the-job training
Operating Engineers and Other Construction
Equipment Operators 2.06 12.0% $35,700 3.83 3% Moderate-term on-the-job training
Business Operations Specialists, All Other* 1.99 11.5% $62,270 0.25 48% Bachelor's degree
Veterinary Assistants and Laboratory Animal
Caretakers 1.89 22.8% $19,740 0.00 12% Short-term on-the-job training
Compliance Officers 1.59 31.1% $53,080 2.42 55% Long-term on-the-job training
Maintenance Workers, Machinery 1.44 4.6% $30,290 3.55 5% Moderate-term on-the-job training
Administrative Services Managers 1.40 12.5% $63,100 1.44 38%
Bachelor's or higher degree, plus work
experience
Secretaries and Administrative Assistants, Except
Legal, Medical, and Executive 1.33 4.6% $25,440 1.71 17% Moderate-term on-the-job training
First-Line Supervisors of Construction Trades and
Extraction Workers 1.32 15.4% $46,660 1.35 11%
Work experience in a related
occupation
Accountants and Auditors 1.27 21.7% $47,050 0.64 75% Bachelor's degree
Financial Managers 1.26 7.7% $77,110 0.51 59%
Bachelor's or higher degree, plus work
experience
First-Line Supervisors of Mechanics, Installers, and
Repairers 1.21 4.3% $48,060 1.54 12%
Work experience in a related
occupation
Procurement Clerks 1.18 5.8% $26,110 2.01 23% Moderate-term on-the-job training
Source: BLS Occupational and Employment Statistics

Target Industry | 60 Grant County Target Industry Analysis
Occupations and Competencies
REGIONAL GOODS & SERVICES “IN-DEMAND” OCCUPATIONS
• Five of the “In-Demand” occupations within the Regional Goods &
Services industry pay higher than Grant County’s average wage of
$32,918.
• Grant County has occupational strength in more than half (12) of
the 20 “In-Demand” occupations within the Regional Goods &
Services industry.
• The majority of “In-Demand” occupations within the Regional Goods
& Services industry do not require higher education degrees, but
rather rely upon on-the-job training.
KEY FINDINGS
Key Occupations in the Regional Goods & Services Industry
Occupations Title
Concentration
Within the
Industry
10-year U.S.
Growth
Projection
Avg. Annual
Wages - SW
New Mexico
"In Demand"
Occupations
(Local
Occupational
Concentration)
% with
Bachelor's
Degree+ Education
Dental Hygienists 8.48 36.1% $64,930 1.11 35% Associate degree
Dental Assistants 8.30 35.8% $26,630 0.67 10% Moderate-term on-the-job training
Medical Secretaries 8.26 26.6% $28,830 0.50 17% Moderate-term on-the-job training
Medical Secretaries 8.26 26.6% $28,830 0.50 17% Moderate-term on-the-job training
Medical Assistants 8.15 33.9% $26,690 2.17 12% Moderate-term on-the-job training
Nursing Aides, Orderlies, and Attendants* 7.87 18.8% $21,870 0.48 8% Postsecondary vocational award
Registered Nurses* 7.43 22.2% $65,520 0.69 56% Associate degree
Medical Records and Health Information
Technicians 7.05 20.3% $26,400 1.40 14% Associate degree
Emergency Medical Technicians and
Paramedics 5.85 9.0% $26,520 1.11 15% Postsecondary vocational award
Personal Care Aides 3.55 46.0% $20,910 2.44 11% Short-term on-the-job training
Billing and Posting Clerks 3.48 15.3% $26,270 0.41 15% Short-term on-the-job training
Receptionists and Information Clerks 3.41 15.2% $21,380 1.24 13% Short-term on-the-job training
Clinical, Counseling, and School
Psychologists 2.75 11.1% $46,170 1.96 99% Doctoral degree
Cooks, Institution and Cafeteria 2.72 9.7% $18,610 2.29 5% Moderate-term on-the-job training
Maids and Housekeeping Cleaners 2.51 5.7% $19,390 1.37 5% Short-term on-the-job training
Social and Human Service Assistants 2.49 22.6% $30,520 1.24 52% Moderate-term on-the-job training
Pharmacists 2.25 17.0% $121,460 0.55 97% First professional degree
Laundry and Dry-Cleaning Workers 2.13 2.8% $18,000 1.44 6% Moderate-term on-the-job training
Pharmacy Technicians 1.72 30.6% $26,910 0.74 17% Moderate-term on-the-job training
First-Line Supervisors of Office and
Administrative Support Workers 1.23 11.0% $37,580 1.12 29%
Work experience in a related
occupation
Source: BLS Occupational and Employment Statistics

Target Industry | 61 Grant County Target Industry Analysis
Occupations and Competencies
TOURISM & RECREATION “IN-DEMAND” OCCUPATIONS
• The majority of “In-Demand” occupations within the Tourism &
Recreation industry pay lower than average Grant County wages.
• Grant County has occupational strength in over half (12 of 20) of
the “In-Demand” occupations within the Tourism & Recreation
industry.
• None of the “In-Demand” occupations within the Tourism &
Recreation industry require higher education degrees, but instead,
rely upon on-the-job training
KEY FINDINGS
Source: BLS Occupational and Employment Statistics
Key Occupations in the Tourism & Recreation Industry
Occupations Title
Concentration
Within the
Industry
10-year
U.S.
Growth
Projection
Avg.
Annual
Wages -
SW New
Mexico
"In Demand"
Occupations
(Local
Occupational
Concentration)
% with
Bachelor's
Degree+ Education
Hosts and Hostesses, Restaurant, Lounge, and
Coffee Shop 9.19 6.5% $18,040 0.75 12% Short-term on-the-job training
Cooks, Restaurant 9.19 7.7% $19,960 1.37 5% Long-term on-the-job training
Cooks, Fast Food 9.12 7.5% $17,170 3.19 5% Short-term on-the-job training
Waiters and Waitresses 9.10 6.4% $22,070 1.10 13% Short-term on-the-job training
Hotel, Motel, and Resort Desk Clerks 9.04 13.7% $20,060 7.54 16% Short-term on-the-job training
Dishwashers 8.47 11.6% $17,200 1.27 3% Short-term on-the-job training
Bartenders 8.41 8.0% $18,290 0.60 16% Short-term on-the-job training
Dining Room and Cafeteria Attendants and
Bartender Helpers 8.23 5.6% $18,000 0.00 6% Short-term on-the-job training
Combined Food Preparation and Serving Workers,
Including Fast Food 7.94 14.6% $17,040 0.66 5% Short-term on-the-job training
First-Line Supervisors of Food Preparation and
Serving Workers 7.58 6.6% $24,110 1.21 14%
Work experience in a related
occupation
Maids and Housekeeping Cleaners 4.69 5.7% $19,390 1.37 5% Short-term on-the-job training
Driver/Sales Workers 3.59 4.4% $24,700 0.00 5% Short-term on-the-job training
Bakers 1.99 0.2% $17,370 1.05 8% Long-term on-the-job training
First-Line Supervisors of Housekeeping and
Janitorial Workers 1.89 5.1% $28,010 1.71 12%
Work experience in a related
occupation
Laundry and Dry-Cleaning Workers 1.45 2.8% $18,000 1.44 6% Moderate-term on-the-job training
Cooks, Institution and Cafeteria 1.39 9.7% $18,610 2.29 5% Moderate-term on-the-job training
Landscaping and Groundskeeping Workers 1.20 18.0% $21,880 0.89 7% Short-term on-the-job training
Cashiers 1.15 3.5% $17,840 1.90 10% Short-term on-the-job training
Security Guards 0.91 14.2% $25,320 0.44 15% Short-term on-the-job training
Retail Salespersons 0.72 8.4% $19,830 0.78 24% Short-term on-the-job training

Target Industry | 62 Grant County Target Industry Analysis
CONCLUSION
Appropriate target industries and niches are essential for economic development retention, expansion and recruitment efforts. Without a strategic approach, resources will not be maximized for return on investment. It is important for project stakeholders to remember that this is not the strategy, but research that supports the final recommendations.
The industries and niches presented in this report provide a strong balance for Grant County between focusing on the present and preparing for the future. Many of them use the community and region’s existing strengths and assets, while many more rely on these attributes to move into emerging markets that will sustain the local workforce in years to come.
By focusing its resources and efforts on developing and supporting the target industries in this report, Grant County’s economic development leaders can not only build upon the community’s strengths in existing industries, but also work to diversify the local economy by leveraging local assets that can support emerging opportunities.
NEXT STEPS
The next step in this strategy process is to present the Comprehensive Economic Development Strategic Plan, which will act as a roadmap for Grant County’s economic development efforts.
Conclusion and Next Steps
Photo: Wikipedia
•Project Setup & Stakeholder Engagement
Phase 1
•Market Assessment, SWOT Analysis & Organizational Assessment
Phase 2
•Target Industry Analysis Phase 3
•Action Plan and Implementation Matrix
Phase 4

Target Industry | 63 Grant County Target Industry Analysis
METHODOLOGY & NARRATIVE CONTENT
As described in the portion of this report titled “Target Industry Selection Process”, the project team completed an in-depth analysis specific to Grant County, New Mexico that included site visits, interviews and focus groups, and was strengthened by input from key community stakeholders. The results of this analysis formed the basis for the identification and selection of recommended target industries and for the determination of target niches within those industries. Particular emphasis was placed by the project team on the selection of targets that best fit the unique characteristics of Grant County and the surrounding region and offered the best opportunities for successful development within the community. The research completed as well as the recommendations provided have been directed specifically to meet the economic development needs and objectives of Grant County and will guide research and recommendations to be prepared by the project team in future stages of this project.
Certain portions of this report draw upon previously completed research conducted by AngelouEconomics for internal use or for separate projects, and were selected for inclusion in this report for their specific relevance to the challenges and opportunities currently affecting Grant County. In certain cases, specifically those relating to research processes, definitions, national and global trends, industry-wide conditions and dynamics, and national economic data, narrative remarks may be included in other documents completed by AngelouEconomics. Reasonable efforts have been made to ensure that all data and information that was completed by other organizations and government agencies have been properly sourced throughout this report. Further information about the methods, research, or recommendations featured in this report can be made available upon request by the client.
Appendix A
Photo: Wikipedia

Target Industry | 64 Grant County Target Industry Analysis
AngelouEconomics
AngelouEconomics partners with client communities and regions across the United States and abroad to
candidly assess current economic development realities and identify opportunities. Our goal is to leverage the
unique strengths of each region to provide new, strategic direction for economic development. As a result,
AngelouEconomics’ clients are able to diversify their economies, expand job opportunities and investment,
foster entrepreneurial growth, better prepare their workforce, and attract ‘new economy’ companies.
Project Team
Angelos Angelou
Principal Executive Officer
Levi Jackson
Project Manager
John Karras
Project Manager