GRAND RENEWABLE ENERGY 2018 Proceedings steel Power, etc ...
4
ROLES OF VARIABLE RENEWABLES IN DECARBONIZED ENERGY SYSTEM: LONG- TERM ANALYSIS UTILIZING A TECHNOLOGY MIX MODEL Yasuaki Kawakami 1 , Ryoichi Komiyama 1 and Yasumasa Fujii 1 1 Graduate School of Engineering, The University of Tokyo, Tokyo, 113-8656 Japan This study investigates an optimal deployment of variable renewables (VRs) in massive decarbonization in Japan’s energy system toward 2050 under several carbon-dioxide (CO2) mitigation scenarios. A multi-region bottom-up technology mix model which incorporates a high-temporal-resolution power sector is developed and utilized. The model is formulated as a large-scale linear programming model with 14 million endogenous variables and 30 million constraints. Simulation results reveal that severer requirement for CO2 reduction promotes decarbonization in the power sector and electrification at final demand sectors as well as energy conservation. The deployment of VRs increases as the carbon constraint gets rigorous and the large amount of VRs accompanies huge installation of batteries while suppressed electricity also increases due to intra-regional imbalance in demand and supply, and capacity limitations of inter-regional transmission lines. Keywords: decarbonized energy systems, variable renewables, optimal technology mix, energy storage INTRODUCTION There has been a rapid diffusion of low-carbon technologies such as solar photovoltaics (PV), wind turbines, electric vehicles (EV) and batteries around the world. A global commitment toward a decarbonized economy, which was demonstrated by the Paris Agreement in 2015 and the substantial cost reduction of those technologies has given momentum to the deployment. In line with the global trend, Japanese government set ambitious goals of reducing greenhouse gas emissions: 26 percent reduction from 2013 levels by 2030 and 80 percent by 2050. It is common to utilize bottom-up energy system models for evaluating technological option to accomplish decarbonization targets or assessing feasibility of a specific technology. This is because these models put weigh on technological detail of an energy system and can deal with a number of discrete energy technologies compared to top-down economic models. Although there have been many elaborate studies analyzing a pathway toward decarbonized society by utilizing the bottom-up models, a drawback of the models would be their low- temporal resolution of the power sector. The resolution in MARKAL/TIMES framework [1]-[2], for example, is basically limited to six or eight time-segments a year (two diurnal and three or four seasonal segments) although the sector is one of the biggest carbon dioxide (CO2) sources in energy systems and is expected to be decarbonized through deployments of variable renewables (VRs) such as solar PV and wind which show remarkable cost reduction nowadays. The low-resolution description leads to little capability to take intermittent feature of VRs’ output into account and cannot fully consider the challenge over electricity supply-demand adjustment by utilizing flexible output of thermal power plants or by making use of power storage technologies including pumped hydro and batteries. It is assumed that decarbonization in the power sector is critical to reduce CO2 emitted from the energy system with respect to the emission amounts and a lot of abatement option including VRs, hydrogen thermal plants and ammonia thermal plants. Especially, VRs, which have shown remarkable cost reduction, are expected to play primary role in the decarbonization. Therefore, describing the sector in detail regarding temporal resolution is quite important. The aim of this study is twofold: one is to develop such a bottom-up model that can consider intermittent feature of VRs and several technical constraints on the operation of power plants; the other is to analyze possible future of VRs’ deployment in the decarbonized energy system in Japan. METHODS Optimal technology mix model The authors develop a dynamic optimal-technology- mix model for Japan’s whole energy system with high Fig. 1. Reference energy system. Heat storage Ammonia Hydrogen Energy demand technologies Power Boiler Furnace Commercial /Residential General industry Iron and steel Crude steel Rolling Others Power Kiln Cement Power Boiler Paper and pulp Power Boiler Furnace Chemicals Feed Cooling Freight transport Heating Hot water Cooking Railways Trucks Aviation Navigation Power, etc. Passenger transport Railways Road Aviation Navigation CO 2 emissions Coking Coal Steam Crude oil LNG Uranium Hydro Biomass Wind Solar Jet fuel Naptha Gasoline Geotherm Kerosene Diesel Fuel oil Energy source LPG Battery (NAS/Li-ion) Pumped hydro Wind power Photovoltaic Geothermal Hydro Biomass Oil-fired LNG(ST/CC) Coal-fired Nuclear Power generation/storage Coal conversion Oil refining City gas process Energy supply technologies City gas Hydrogen Solar heat Heat Electricity Kerosene Naphtha Gasoline LPG Coal Fuel oil Diesel oil Secondary energy Coke Distribution technologies Primary energy Water Electrolysis CCS/DAC Hydrogen Ammonia Secondary energy (import) GRAND RENEWABLE ENERGY 2018 Proceedings June 17(Sun) - 22(Fri), 2018 Pacifico Yokohama, Yokohama, Japan
Transcript of GRAND RENEWABLE ENERGY 2018 Proceedings steel Power, etc ...

ROLES OF VARIABLE RENEWABLES IN DECARBONIZED ENERGY SYSTEM: LONG-
TERM ANALYSIS UTILIZING A TECHNOLOGY MIX MODEL
Yasuaki Kawakami1, Ryoichi Komiyama1 and Yasumasa Fujii1
1Graduate School of Engineering, The University of Tokyo, Tokyo, 113-8656 Japan
This study investigates an optimal deployment of variable renewables (VRs) in massive decarbonization in Japan’s energy system toward 2050 under several carbon-dioxide (CO2) mitigation scenarios. A multi-region bottom-up technology mix model which incorporates a high-temporal-resolution power sector is developed and utilized. The model is formulated as a large-scale linear programming model with 14 million endogenous variables and 30 million constraints. Simulation results reveal that severer requirement for CO2 reduction promotes decarbonization in the power sector and electrification at final demand sectors as well as energy conservation. The deployment of VRs increases as the carbon constraint gets rigorous and the large amount of VRs accompanies huge installation of batteries while suppressed electricity also increases due to intra-regional imbalance in demand and supply, and capacity limitations of inter-regional transmission lines.
Keywords: decarbonized energy systems, variable renewables, optimal technology mix, energy storage
INTRODUCTION
There has been a rapid diffusion of low-carbon technologies such as solar photovoltaics (PV), wind turbines, electric vehicles (EV) and batteries around the world. A global commitment toward a decarbonized economy, which was demonstrated by the Paris Agreement in 2015 and the substantial cost reduction of those technologies has given momentum to the deployment. In line with the global trend, Japanese government set ambitious goals of reducing greenhouse gas emissions: 26 percent reduction from 2013 levels by 2030 and 80 percent by 2050.
It is common to utilize bottom-up energy system models for evaluating technological option to accomplish decarbonization targets or assessing feasibility of a specific technology. This is because these models put weigh on technological detail of an energy system and can deal with a number of discrete energy technologies compared to top-down economic models. Although there have been many elaborate studies analyzing a pathway toward decarbonized society by utilizing the bottom-up models, a drawback of the models would be their low-temporal resolution of the power sector. The resolution in MARKAL/TIMES framework [1]-[2], for example, is basically limited to six or eight time-segments a year (two diurnal and three or four seasonal segments) although the sector is one of the biggest carbon dioxide (CO2) sources in energy systems and is expected to be decarbonized through deployments of variable renewables (VRs) such as solar PV and wind which show remarkable cost reduction nowadays. The low-resolution description leads to little capability to take intermittent feature of VRs’ output into account and cannot fully consider the challenge over electricity supply-demand adjustment by utilizing flexible output of thermal power plants or by making use of power storage technologies including pumped hydro and batteries.
It is assumed that decarbonization in the power sector is critical to reduce CO2 emitted from the energy system with respect to the emission amounts and a lot of abatement option including VRs, hydrogen thermal plants and ammonia thermal plants. Especially, VRs, which have shown remarkable cost reduction, are expected to play primary role in the decarbonization. Therefore, describing the sector in detail regarding temporal resolution is quite important. The aim of this study is twofold: one is to develop such a bottom-up model that can consider intermittent feature of VRs and several technical constraints on the operation of power plants; the other is to analyze possible future of VRs’ deployment in the decarbonized energy system in Japan.
METHODS
Optimal technology mix model
The authors develop a dynamic optimal-technology-mix model for Japan’s whole energy system with high
Fig. 1. Reference energy system.
Heat storage
Ammonia
Hydrogen
Energy demand
technologies
Power
Boiler
Furnace
Com
merc
ial
/Resid
entia
l
Genera
l in
dustry
Iron a
nd
ste
el
Crude steel
Rolling
Others
Power
Kiln
Ce
me
nt
Power
Boiler
Pa
pe
r a
nd
pu
lp
Power
Boiler
Furnace
Chem
icals
Feed
Cooling
Fre
ight
transpo
rt
Heating
Hot water
Cooking
Railways
Trucks
Aviation
Navigation
Power, etc.
Passenger
transpo
rt
Railways
Road
Aviation
Navigation
CO2 emissions
Coking Coal
Steam
Crude oil
LNG
Uranium
Hydro
Biomass
Wind
Solar
Jet fuel
Naptha
Gasoline
Geotherm
Kerosene
Diesel
Fuel oil
Energy source
LPG Battery(NAS/Li-ion)
Pumped hydro
Wind power
Photovoltaic
Geothermal
Hydro
Biomass
Oil-fired
LNG(ST/CC)
Coal-fired
Nuclear
Pow
er g
en
era
tion
/sto
rag
e
Coal conversion
Oil refining
City gas process
Energy supply
technologies
City gas
Hydrogen
Solar heat
Heat
Electricity
Kerosene
Naphtha
Gasoline
LPG
Coal
Fuel oil
Diesel oil
Secondary energy
Coke
Distribution technologies
Prim
ary
ene
rgy
Water Electrolysis
CCS/DAC
Hydrogen
Ammonia
Seco
nd
ary
ene
rgy (im
po
rt)
GRAND RENEWABLE ENERGY 2018 ProceedingsJune 17(Sun) - 22(Fri), 2018Pacifico Yokohama, Yokohama, Japan

temporal-resolution of 60-minute interval for 365 days (8760 time segments a year) for the power sector and thermal storage. Japan is divided into four regions (Hokkaido, Tohoku, Kanto and West Japan) in the model, which enables consideration of VRs’ potential in each region and inter-regional power transmission lines. Optimization procedure uses linear programming and the model minimizes a discounted total energy system cost from 2015 to 2050 with a number of constraints. The assumed energy system in this study is illustrated in Fig. 1. 36 final demand sectors and above 200 energy technologies are considered, and the technologies include promising technologies such as hydro electrolysis, methanation and thermal conversion storage absorbing surplus electricity derived from the massive VRs’ penetration. The passenger-road sector, for example, integrates every demand by distance into a unified demand. The energy system cost is composed of investment cost of energy technologies, operation and management cost and fuel cost. The developed model here expands the one in an author’s previous paper which focuses on a single-point analysis in Japan toward 2030 [3]. Constraints on the power sector include load following capability, minimal outputs of thermal plants and capacity reservation. Stored electricity is also described in 60-min temporal resolution. Power demand and supply balance at every time-segment, for example, is expressed by equation (1). Annual electricity demand is determined endogenously by activities of energy technologies which consume electricity and the demand is allocated to that of each time-segment by using historical load factor. The shape of the power demand carve is assumed to remain unchanged over the simulation period. EV charging and absorption of surplus electricity are decided endogenously. As for other formulation, see the paper [3]. Basic formulation common to all sectors such as annual demand and supply balance of energy carriers and the relation between capacity and activity of technologies is in the same manner with the MARKAL/TIMES framework.
(1)
where: Xi,t,d,r,y is power output of tech. i at time t and day d in region r and year y [GW]; DISs,t,d,r,y is discharge from electricity-storage tech. s [GW]; CHAs,t,d,r,y is charge from storage tech. s [GW]; EIMt,d,r,y is transmission to region r [GW]; EEXt,d,r,y is transmission from region r [GW]; EDMDr,y is annual demand excluding for charging EV and absorption [PJ]; CHAEVt,d,r,y is EV charging [GW]; HYELt,d,r,y is demand for hydrogen production through hydrogen electrolysis [GW]; MEELt,d,r,y is demand for metanation [GW]; CHAFIt,d,r,y is demand for heat conversion [GW]; losstr is transmission loss ratio (exogenous variable); loadalct,d,r is load allocation factor (exogenous, defined as load at each time-segment divided by annual demand); uconv is conversion coefficient from PJ to GWh (exogenous)
Exogenous variables of power plants and power storage technologies are shown in Table 1 and Table 2. The cost and efficiency of technologies are mainly compiled from a report by a national working group [4] and assumed to improve through technological progress over the simulation period. All data are common among the
regions. This study supposes no new-built or replacement of nuclear power plants and existing plants will operate for 60 years. The capacity decreases to 21 GW in 2050. The output of VRs at every time-segment is estimated by meteorological data for solar PV and onshore wind, by an application for offshore wind [5]. VRs’ potential in each region is adopted from projections by MOEJ (Table 3). Low-carbon technologies at sectors other than the power sector include, for example, electric furnace, heat pump applications, electric vehicles, fuel-cell vehicles, carbon capture and storage (CCS) and direct air capture (DAC). This study assumes sequestration potential of CO2 by CCS to be ten million ton and import cost of decarbonized hydrogen to be 42 JPY/Nm3 in 2050. Import cost of fossil fuels is adopted from the WEO 2017 by IEA (Fig. 2).
Table 1. Exogenous variables of power plants.
Nuclear Coal LNG CC LNG ST Oil Hydrogen Ammonia
Construction Cost (kJPY/kW) 370 272 164 120 200 164 164
Fixed O&M Cost Rate 5.2% 4.0% 3.0% 3.0% 3.2% 3.0% 3.0%
Efficiency
(sending-end, LHV)- 39~44% 54~61% 42% 38~40% 54~61% 54~61%
Annual Ave. Availability 80% 80% 80% 80% 80% 80% 80%
Seasonal Peak Availability 90% 90% 95% 95% 95% 95% 95%
Max. Increase Rate
of Output (%/hour)0 31 82 82 100 82 82
Max. Decrease Rate
of Output (%/hour)0 58 75 75 100 75 75
Life Time (year) 40 40 40 40 40 40 40
Share of DSS Operation 0 0 0.5 0.3 0.7 0.5 0.5
Min. Output Level 0.3 0.3 0.5 0.3 0.3 0.3 0.3
Hydro Biomass Geothermal PVWind
(onshore)
Wind
(offshore)
Construction Cost (kJPY/kW) 640 398 790 294~152 284~212 591~506
Fixed O&M Cost Rate 1.4% 6.8% 4.2% 1.4% 2.1% 3.8%~3.1%
Efficiency - 18% - - - -
Annual Ave. Availability 65% 80% 70% - - -
Max. Increase Rate
of Output (%/hour)5 31 5 - - -
Max. Decrease Rate
of Output (%/hour)5 58 5 - - -
Life Time (year) 60 20 40 20 20 20
Table 2. Exogenous variables of storage technologies
Pumped Hydro NaS Battery Li-ion Battery
Construction Cost (kJPY/kW) 190 35 40
Construction Cost (kJPY/kWh) 10 40~20 150~10
Fixed O&M Cost Rate 1.0% 1.0% 1.0%
Usage Rate 90% 90% 90%
Cycle Efficiency 70% 85% 85%
Self Discharge Loss (%/hour) 0.1 0.5 0.5
Maximum kWh ratio to kW 6 ∞ ∞
C-rate - 0.14C 2.0C
Life Cycle (times) ∞ 4500 6000
Life Time (year) 60 15 8
yrdtyrdtyrdtyrdt
rdtyr
yrdtyrdttr
s
yrdtsyrdts
i
yrdti
CHAFIMEELHYELCHAEV
uconvloadalcEDMD
EEXEIMlossCHADISX
,,,,,,,,,,,,
,,,
,,,,,,,,,,,,,,,,,, 1)(
Fig. 2. Assumed imported energy CIF price.
0
1000
2000
3000
4000
5000
6000
2015 2020 2025 2030 2035 2040 2045 2050
Hydrogen
Crude OIl
Ammonia
Biomass
LNG
Coking Coal
Steam Coal
JPY/GJ
Table 3. Assumed potential of VRs in each region.
(unit: GW) solar PVwind
(onshore)
wind
(offshore)
2030 6 43 0
2050 11 152 129
2030 25 31 0
2050 45 69 53
2030 49 2 0
2050 87 5 36
2030 107 23 0
2050 189 56 91
2030 188 98 0
2050 332 282 310
Hokkaido
Tohoku
Kanto
West JPN
Total
GRAND RENEWABLE ENERGY 2018 ProceedingsJune 17(Sun) - 22(Fri), 2018Pacifico Yokohama, Yokohama, Japan

Scenario assumptions
This paper analyzes Japan’s long-term energy mix and the optimal installation of VRs under multiple scenarios with respect to CO2 reduction target. CO2, abatement target in 2050 is set ranging from 50 percent (C50%) to 80 percent (C80%) with 10-percent-point increments are examined. The benchmark year is assumed to be 2014. The emission is restricted since 2030 at 927Mt-CO2, which is consistent with Japan’s commitment in the Paris Agreement, and the upper limits between 2030 and 2050 are assumed by interpolation. Maximum available amount of decarbonized imported hydrogen is limited to 100 billion Nm3 in 2050.
SIMULATION RESULTS
Final energy consumption in 2035 and 2050 is demonstrated in Fig. 3. Electrification and energy conservation promote through the simulation period due to carbon constraint. As the constraint gets stricter, the degree of the promotion increases: the demand in the C80% scenario in 2050 is 251 Mtoe, down 6.8% from that in the C50% and the electrification ratio gets to 46%. In the C80% scenario residential and commercial sector see remarkable electrification and the share reaches almost 90 percent in 2050, while consumption of fossil fuels including coal remains in the industry sector.
The promotion of electrification is supported by substantial decarbonization of the power sector. Fig. 4 shows the power generation mix in 2035 and 2050. The figure does not include suppressed VRs’ power. If the carbon limitations are relatively moderate, fuel-switching from coal to LNGCC (combined cycle) is dominant means for lowering CO2 intensity of the sector, while massive installation of VRs as well as decarbonized hydrogen and ammonia are required in the severer scenarios (C70% and C80%). In the C80% scenario, VRs account for 58 percent in the total power generation in 2050. Therefore, it can be seen that lowering the emissions in the power sector to nearly zero as well as promoting energy conservation plays substantial role to realize massive CO2 reduction which Japanese government aims at. Almost all of CO2 from LNGCC is captured by CCS in the C70% and the C80% scenario in 2050.
Strict constraints make solar PV gain momentum and the capacity increases to around 300GW in the C80% from 100GW in the C50% (Fig. 5). On the other hand, onshore
wind does not show steep increase because limited capacity of inter-regional transmission line suppresses the introduction in Hokkaido. The deployment of offshore wind is less progressive due to the high cost under moderate constraints. On the other hand, the installation is essential to realize the massive decarbonization and total capacity of VRs in 2050 reaches 600GW in the C80% scenario. The huge deployment of VRs accompanies substantial installation of batteries.
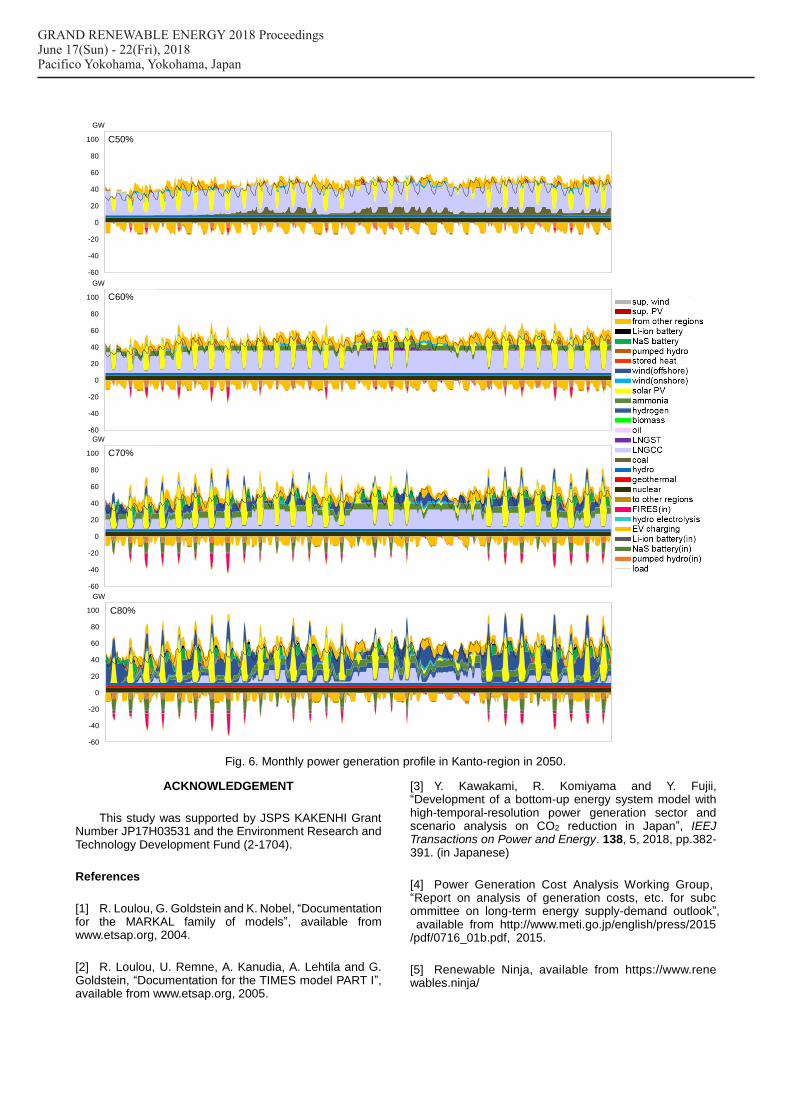
Fig. 6 demonstrates monthly power generation profiles in Kanto-region in 2050 for each scenario. The operation of the fossil-fuel power plants falls off as decarbonization proceeds and VRs, ammonia-fired and hydrogen-fired replace the decrease. When the capacity of VRs are moderate, flexible thermal power plants take a role of following residual load. Alternatively, batteries raise the operation under severer carbon conditions to absorb large amount of surplus electricity. Battery discharge occurs in the evening when PV output diminishes and flexible thermal plants cannot fully cope with the steep increase of residual load.
CONCLUSIONS
The feasibility of massive decarbonization is examined by utilizing a multi-region bottom-up energy system model with a high-temporal-resolution power sector. Reducing CO2 emissions from the power sector close to zero and promoting electrification at final demand sectors are essential for realizing decarbonized energy systems in Japan. VRs including offshore wind play an important role to achieve the decarbonized power sector and the deployment of large amount of VRs is associated with substantial installation of batteries.
Fig. 4. Power generation mix and CO2 intensity.
291276 274
254
132112
310
0
200
400
600
800
1,000
1,200
1,400
1,600
1,800
C5
0%
C6
0%
C7
0%
C8
0%
C5
0%
C6
0%
C7
0%
C8
0%
2035 2050
Battery2(Li)
Battery(NAS)
Pumped
Wind
PV
Ammonia
Hydrogen
Biomass
Oil
LNG_ST
LNG_CC
Coal
Geothermal
Hydro
Nuclear
CO₂ Intensity
TWh
(g-CO2/kWh)
Fig. 3. Final energy consumption by energy source.
34.5% 34.5% 34.8% 35.0% 35.7%38.2% 39.1%
46.4%
0
50
100
150
200
250
300
C50% C60% C70% C80% C50% C60% C70% C80%
2035 2050
Others
Hydrogen
Electricity
Gas
Oil
Coal
Electrificationratio
Mtoe
Fig. 5. Capacity of VRs and batteries.
0
100
200
300
400
500
600
700
800
C50%
C60%
C70%
C80%
C50%
C6
0%
C70%
C80%
2035 2050
Li-ion battery
NaS battery
wind(offshore)
wind(onshore)
PV
GWGW
GRAND RENEWABLE ENERGY 2018 ProceedingsJune 17(Sun) - 22(Fri), 2018Pacifico Yokohama, Yokohama, Japan
ACKNOWLEDGEMENT
This study was supported by JSPS KAKENHI Grant Number JP17H03531 and the Environment Research and Technology Development Fund (2-1704).
References
[1] R. Loulou, G. Goldstein and K. Nobel, “Documentation for the MARKAL family of models”, available from www.etsap.org, 2004.
[2] R. Loulou, U. Remne, A. Kanudia, A. Lehtila and G. Goldstein, “Documentation for the TIMES model PART I”, available from www.etsap.org, 2005.
[3] Y. Kawakami, R. Komiyama and Y. Fujii, “Development of a bottom-up energy system model with high-temporal-resolution power generation sector and scenario analysis on CO2 reduction in Japan”, IEEJ Transactions on Power and Energy. 138, 5, 2018, pp.382-391. (in Japanese)
[4] Power Generation Cost Analysis Working Group, “Report on analysis of generation costs, etc. for subcommittee on long-term energy supply-demand outlook”, available from http://www.meti.go.jp/english/press/2015/pdf/0716_01b.pdf, 2015.
[5] Renewable Ninja, available from https://www.renewables.ninja/
Fig. 6. Monthly power generation profile in Kanto-region in 2050.
-60
-40
-20
0
20
40
60
80
100
sup. windsup. PVfrom other regionsLi-ion batteryNaS batterypumped hydrostored heatwind(offshore)wind(onshore)solar PVammoniahydrogenbiomassoilLNGSTLNGCCcoalhydrogeothermalnuclearto other regionsFIRES(in)hydro eletrolysisEV chargingLi-ion battery(in)NaS battery(in)pumped hydro(in)load
GW
-60
-40
-20
0
20
40
60
80
100
sup. windsup. PVfrom other regionsLi-ion batteryNaS batterypumped hydrostored heatwind(offshore)wind(onshore)solar PVammoniahydrogenbiomassOilLNGSTLNGCCcoalhydrogeothermalnuclearto other regionsFIRES(in)hydro electrolysisEV chargingLi-ion battery(in)NaS battery(in)pumped hydro(in)load
GW
-60
-40
-20
0
20
40
60
80
100
sup. windsup. PVfrom other regionsLi-ion batteryNaS batterypumped hydrostored heatwind(offshore)wind(onshore)solar PVammoniahydrogenbiomassoilLNGSTLNGCCcoalhydrogeothermalnuclearto other regionsFIRES(in)hydro electrolysisEV chargingLi-ion battery(in)NaS battery(in)pumped hydro(in)load
GW
C50%
C60%
C70%
C80%
GRAND RENEWABLE ENERGY 2018 ProceedingsJune 17(Sun) - 22(Fri), 2018Pacifico Yokohama, Yokohama, Japan