
Grain Transportation Rates and Export Market...
26
Agricultural Economics Report No. 189 Grain Transportation Rates and Export Market Development by William W. Wilson Won W. Koo Terry Smaaladen Department of Agricultural Economics Agricultural Experiment Station North Dakota State University Fargo, North Dakota 58105-5636 October 1984
Transcript of Grain Transportation Rates and Export Market...
Agricultural Economics Report No. 189
Grain Transportation Rates andExport Market Development
byWilliam W. Wilson
Won W. KooTerry Smaaladen
Department of Agricultural EconomicsAgricultural Experiment StationNorth Dakota State University
Fargo, North Dakota 58105-5636
October 1984
Preface
This report is a summary of a thesis by Ms. Terry Smaaladen entitled
A Transportation Model of the Spring Wheat Industry, which was conducted in
partial fulfillment of her Master of Science Degree in the Department of
Agricultural Economics, North Dakota State University. It was conducted
under Hatch Project No. 1368, "Economics of Grain Marketing."
TABLE OF CONTENTS
List of Tables . . . . . . . . . . . . . . . . . . . .
List of Figures . . . . . . . . . . . . . . . . . . .
Highlights . . . . . . . . . . . . . . . . . . . . . .
Introduction ............... .. ...
Empirical Model . . . . . . . . . . . . . . . . . .
Empirical Results .. . . .... .. . . . ....
Base Model . . . . . . . . . . . . . . . . . . .Model Simulation . . . . . . . . . . . . . . . . .
Changes in Westbound Rail Rates for Export . . .Changes in Ocean Rate Differentials . ......Growth in Asian Demand .. . . . . . ......
Producers' Revenue and Market Prices Under the BaseAlternative Models ....... ..... ... .
Summary and Conclusions .. . . . . . ........
Appendix A . . . . . . . . . . . . . . . . . . . . ..
Appendix B . . ................. .. .
References Cited ..........
. .
. •
. .
. .
. .
. .
. .
. .
. .
. .
. .
and. .
. .
. .
Page
ii
ii
iii
1
2
4
57
71011
12
13
15
17
.*
.*
.*
.*
.*
.*
. . . . . . . .
20
List of Tables
TableNo. Page
1 OCEAN FREIGHT RATES ....... . . ........ . .. .. 5
2 RAIL RATE DIFFERENTIALS BETWEEN PNW AND DULUTH BY DIFFERENTRATE SCENARIOS (9/BU.) .. .. ............ . 7
3 NORTH DAKOTA WHEAT SHIPMENTS TO PNW UNDER ALTERNATIVEFREIGHT RATE DECREASES ............... . 9
4 OPTIMAL WHEAT SHIPMENTS FROM PORTS TO THE ORIENT IN MODEL 3(METRIC TONS) . ........... .......... 10
5 SUMMARY OF CHANGES IN FARM REVENUE AND PORT PRICES ..... 12
List of Figures
FigureNo. Page
1 Optimal Flows of Wheat from Producing Regions to U.S. ExportPorts in the Base Model .. . . . . . . . ........ 6
2 Optimal Flows of Wheat from Producing Regions to DomesticConsuming Regions in the Base Model .. . . ............ . 6
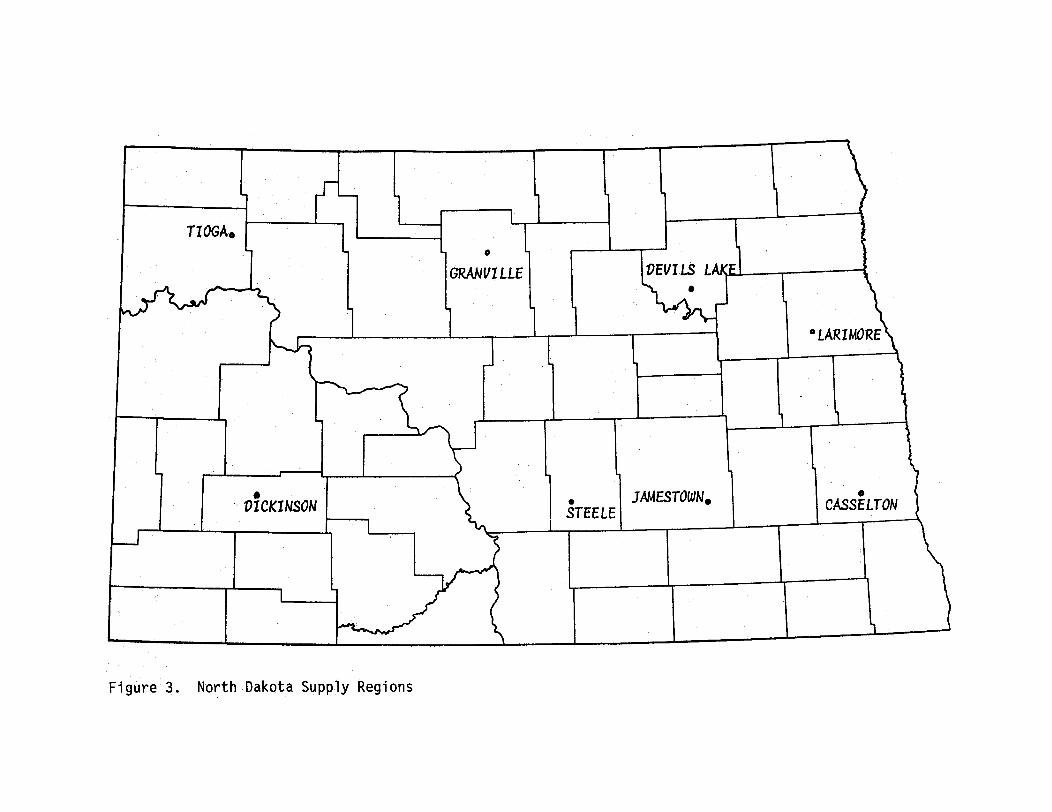
3 North Dakota Supply Regions .. . .. . ... .. . . . .. . 8
ii
Highlights
The spatial distribution of commodities is determined by the
quantities supplied and demanded in each of the competing regions or
markets and by transportation and handling rates. This study analyzes the•j
efficiency of using rail rate reductions for export market dewelopment for
hard red spring (HRS) wheat from North Dakota via the Pacific Northwest
(PNW) ports. A spatial equilibrium model of the HRS wheat distribution
system was developed and solvd using quadratic programming.
The effects of alternativ rail rate configurations to the PNW market
were analyzed with particular attention on westbound shipments. In
addition, the sensitivity of the spatial distribution of HRS uws analyzed
with respect to changes in relativ ocean rates and expansion in the demand
for HRS in the Asian markets.
There were three major conclusions from the study. First, relativly
large changes in rail rates were required to stimulate a diwrsion of
traffic from eastern markets to the PNW for export. Second, ocean rates
from the PNW to the Asian market would haw to increase substantially
relativ to the U.S. Gulf rates before a significant divrsion would occur
away from westbound shipments. Third, increased Asian demand for HRS would
result in larger quantities of stock supplied from regions closest to the
PNW. Producers' prices and net revenue would also increase.
iii
GRAIN TRANSPORTATION RATES AND EXPORT MARKET DEVELOPMENT
by
William W. Wilson, Won W. Koo, and Terry Smaalden
Introduction
Alterations in the absolute and relative levels of transportationrates are frequently advocated by interest groups and to some extent byrailroads in an attempt to alter the distribution of particular types ofgrain for the purpose of market development. The spatial distribution ofcommodities is determined by the quantities supplied and demanded in eachof the competing regions or markets and by transportation and handlingrates. In grain marketing, where particular export markets have differingdegrees of potential growth, changes in relative railroad rates may be usedas a tool in market development. However, the effectiveness of using railrates in market development depends on quantities supplied and demanded incompeting markets and on relative rates of other complementary modes (e.g.,ocean rates). This study analyzes the efficacy of using rail ratereductions for export market development of hard red spring (HRS) wheatfrom North Dakota via the Pacific Northwest (PNW) ports. Railroads havebeen interested in increased westbound shipments because of the economiesof longer hauls and reduced intermodal competition. Producers of HRSwheat, who are predominantly located in North Dakota, view the Asian marketas a growth market and consequently have sought changes in relative railrates (relative to the other markets) to facilitate growth in exports.North Dakota, the second largest wheat-producing state, has a pivotalposition in the HRS distribution system with shipments to both the easternmarkets and the PNW depending on the many factors affecting spatialdistribution.
The domestic distribution of wheat is influenced largely by thelocation of producers and processors. The rail rate structure hasfacilitated movement of wheat in the domestic industry through the use oftransit privileges and changes in relative rates. In the case of HRSwheat, the traditional domestic movement has been eastward to the majormilling centers of Minneapolis and Buffalo.
Exports of HRS wheat have traditionally been shipped through Duluthand/or the U.S. Gulf, both of which reinforced the eastbound shipments fromNorth Dakota. It became apparent in the mid-1960s that the Asian marketwas a potential growth market for HRS exports. The logical distributionwould be for westbound shipments to be exported via the PNW ports incompetition with Canadian wheat at Vancouver and with wheat exports via thetraditional eastern market. At that time, a blanket rate of 95&/cwt. forNorth Dakota origins to the PNW was introduced but failed to stimulatesubstantial westward movements (Tosterud 1976). In an effort to facilitatewestbound shipments from North Dakota, an inverse rail rate structure wasintroduced in 1965. Rail rates to the PNW were greater for origins inwestern North Dakota and decreased as distance increased while moving
- 2
eastward across the state. The inverse rate (i.e., the westbound rate fromNorth Dakota) was comprised of a combination of the eastbound rate fromeach origin to Minneapolis, plus 31?/cwt. to represent the barge rate fromMinneapolis to New Orleans. The primary reason for using this structurewas to equalize Minneapolis with the PNW in the hard red spring wheatexport market to the Orient. Rail rates to the PNW ranged from 90 to 60f,gradually declining from extreme eastern Montana to eastern North Dakota.Intermarket rail rate differentials between the PNW and the easternmarkets, Duluth and Minneapolis, ranged from 26f to 43f, but numerous rateincreases widened the spread to approximately 80?/cwt. Consequently, thesize of origin territory for the Portland export market decreased, and theeastern markets regained their logistical advantage for North Dakota grain.The rationale for the inverse rate structure was that the alteration offreight rate differentials between the PNW market and the Duluth andMinneapolis markets would allow central and eastern North Dakota grain tocompete in the PNW market. More recently, rail rates have been realignedto be essentially flat across the state.
The problem in using rail rates to facilitate market development canbe analyzed using spatial equilibrium models which have been usedextensively in other studies. Linear programming (LP) models assumeperfectly inelastic supply and demand functions and have been used in theanalysis of grain transportation rates and spatial distribution by Koo andCramer (1980), Luessen (1968), and Fedeler and Heady (1976), as well asothers. Quadratic programming models allow for price dependent functions(e.g., demand) and have been used previously in the analysis oftransportation rates by Nagy, Furtan, and Kulshreshtha (1979); by Furtan,Nagy, and Storey (1979); and by Koo (1982).
The purpose of this study is to analyze the effectiveness of usingtransportation rates for export market development. A base model is"developed to depict spatial distribution of U.S. HRS wheat. The effects ofalternative rail rate configurations to the PNW market are analyzed withparticular attention on westbound shipments. In addition, the sensitivityof the spatial distribution of HRS wheat is analyzed with respect tochanges in relative ocean rates and expansion in the demand for HRS wheatin the Asian markets.
Empirical Model-.
Transportation provides space utility and allows goods from oneregion to compete with those from another. Equilibrium prices, quantitiesproduced and consumed in each market, and quantities. traded or transportedbetween markets can be analyzed using spatial equilibrium models.Comparative statics on the transportation demand function can be used totheoretically describe factors affecting trade. The use of transportationrates in market development means reducing the rate to one market, witheverything else constant. The result is a diversion of traffic from othermarkets and an increase in demand because of the lower consumer net price.The effectiveness of transport rates in market development depends on thespatial distribution of supplies and demands,
-3-
Factors affecting the spatial distri6ution of HRS wheat are evaluatedusing a multimarket spatial equilibrium model (see Appendix A formathematical specifications). A base model was developed which hastransportation activities from 31 supply regions to 12 domestic consumptioncenters, three export ports, four commercial storage locations, and fiveimporting regions. Perfectly inelastic domestic demand and supplyfunctions are assumed and the import demand functions are price dependent.Simulations under the following three alternative scenarios are evaluatedrelative to the model: (1) the effect of changes in westbound rail ratesfrom North Dakota, (2) expansion of import demand in the Asian market, and(3) alternative ocean rate spreads from the PNW and the U.S. Gulf to theAsian markets. Thus, the results identify the impacts of these scenarioson the HRS wheat distribution system, as well as on producers' net revenueand relative port prices.
North Dakota, Minnesota, South Dakota, and Montana are the principalproducers of spring wheat. Because of the large proportion of productionin these states, they were arbitrarily divided into 24 geographic supplyregions. Regional boundaries were based on historical marketing patterns,density of production, and data availability. Washington, Oregon, Idaho,Utah-Nevada, Wisconsin, Wyoming, and Colorado were identified as additionalsupply regions. The criterion for all production centers was based on bothcentral geographic location within the state's spring wheat producingregion and location on a primary rail line. Quantity supplied in eachregion was calculated as the sum of average stocks and average production.A five-year average from 1975/76 to 1979/80 was used. Total averagecarryover of 225.4 million bushels was allocated among regions based on theregional percentage of total spring wheat storage capacity.
Domestic consuming regions were delineated based upon estimates ofspring wheat utilization at major milling centers in the United States.Spring wheat utilization was estimated from 1977 wheat movements in theUnited States (Leath et al. 1981), telephone surveys of major millers, andresults of previous studies. Total estimated domestic consumption equals167.8 million bushels which is similar to a five-year average of 162.4million bushels calculated from Wheat Situation (USDA). Twelve millingcenters were chosen to represent U.S. spring wheat consumption.
Duluth, Minneapolis, Lewiston (Idaho), and Sioux City were specifiedas commercial storage points to accommodate the demand for commercialstocks (USDA 1977). Spring wheat commercial storage capacity served as anupper limit in the model and was allocated on the basis of spring wheathandled at each point except Sioux City. It was assumed that Sioux Cityhandled only spring wheat..
Demand functions for the five importing regions were specified tocapture their price responsiveness. Rather than estimate the import demandfunctions, estimates from an existing study were used in the model.Several studies were reviewed to evaluate the appropriateness of estimatesof price elasticities of demand for HRS wheat in the importing countries.Studies by Schmitz and Bawden (1973), Shei and Thompson (1977), andKonandreas (1977) all present estimates of import price elasticities forwheat Konandreas estimatesfr short-run pri elasticities were deemedmost appropriate for the study because they specifically considered U.S.
- 4 -
wheat exports and because the regional definition for the elasticities wasmore suitable for the model. Demand functions were calculated at afive-year average quantity of U.S. spring wheat imports and derived portprices. Port price for each region was determined by normal trade routeslisted in the U.S. Maritime publication (U.S. Department of Commerce1980). Destination ports were chosen on the basis of ocean freight rateavailability.
Domestic transportation consists of rail, truck, barge, and laker.The least-cost transportation charge specified for each marketing route waschosen. Single- and multiple-car rail. rates obtained from the MinneapolisGrain Exchange Rate Book No. 16 are given on an X-002 basis effective fromJuly 1, 1981 to October 1, 1981. The Burlington Northern (BN), UnionPacific (UP), Western Pacific (WP), and Chicago, Milwaukee, St. Paul, andPacific (CMSP) railroad rate bureaus also provided rail rates. Rail ratefunctions (Koo and Bredvolt 1981) were used to estimate rates for thoseroutes which were not available from other sources.
Truck rates are not published and vary among regions and throughtime. Therefore, a truck-cost function for a tractor-trailer capable ofhandling 850 bushels of grain was used to represent trucking charges foreach route. These costs were cross-checked with shippers and truckingfirms to ensure that they were not substantially below cost. The originalaverage cost formula calculated by Koo and Bredvolt (1981) was adjusted toreflect increased variable costs. Total trucking costs included fixedcosts, variable costs, and transfer costs. Transfer costs are costsassociated with loading, unloading, and waiting time.
Barge cost functions developed by Koo and Bredvolt (1981) were usedto estimate freight charges on the river systems. Barge rates are seasonaland determined in a competitive market established at St. Louis, Missouri.These rates are published as a certain percentage of the tariff rate.Estimated barge costs were cross-checked with grain and barge transportcompanies. Because laker freight rates are not published, an estimate ofthe average rate was obtained from private sources.
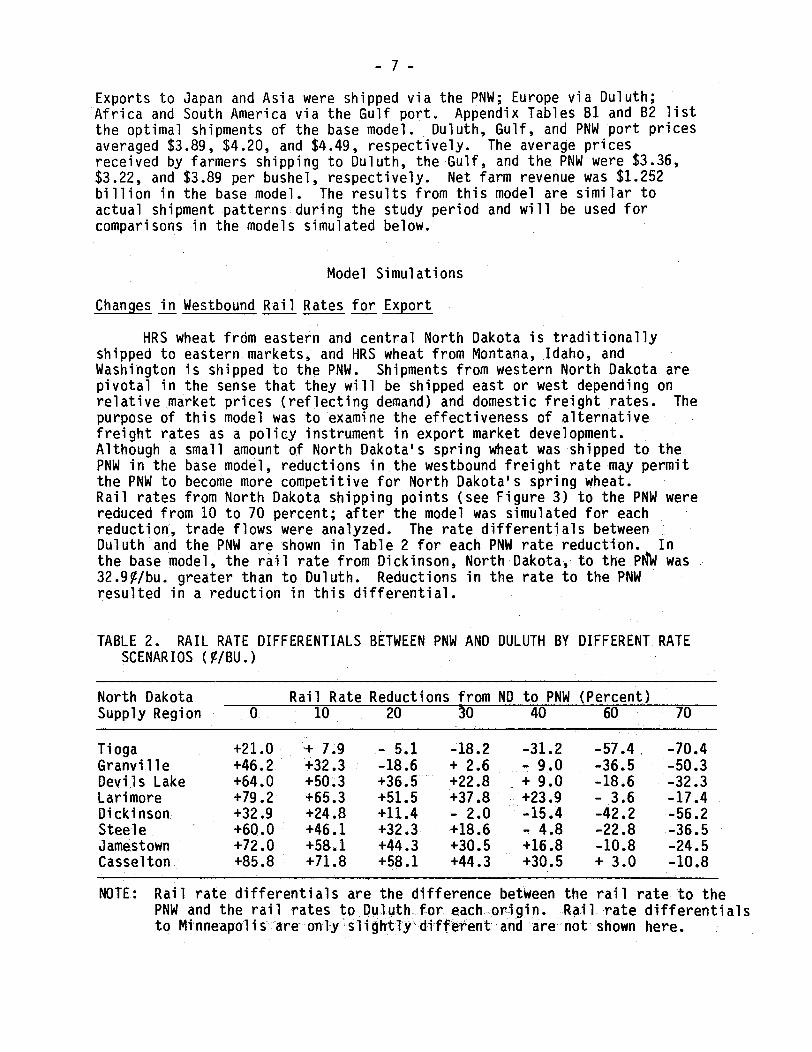
Five-year average rates were used to represent ocean freight costsfrom U.S. ports to foreign destinations (Table 1). All freight rates werequoted for a 12,000 to 25,000 long ton vessel and were converted to ametric ton basis in Table 1.
Empirical Results
Several attempts have been made in the past by the railroads, eitheron their own initiative and/or from pressure from organizationsrepresenting spring wheat producers, to alter the westbound export railrate with the intention of developing the export market. The thrust ofthis study evaluates the efficacy of alternative domestic transportationrates for export market development.
The relationships between fundamental market condittions and changesin rate differentials are captured in a spatial equilibrium analysis., TheU.S. HRS wheat distribution system was modelled with price-dependent import
- 5-
TABLE 1. OCEAN FREIGHT RATES
Importing RegionPort Europe Japan Asia Africa South America
- --- - - - -- ($/MT. Ton) - - - - - -- - -
Duluth 21.56 40.36 40.36 .a 46.00
Gulf 10.26 21.16 22.69 23.00 15.00
PNW -- 18.27 16.77 35.00
aAn arbitrarily high number used for those routes whichare inapplicable.
NOTE: Ocean freight rates are calculated as a five-yearaverage based on crop years 1975-79.
SOURCE: International Wheat Council, World Wheat Statistics(1975-79).
demand functions and perfectly inelastic supply and domestic demandfunctions. A "base model" was simulated following the description of theempirical model above and is used as a measure of comparison for subsequentsimulations. These alternative models are compared with the base model toevaluate the impact of alternative fundamental changes in the distributionof U.S. spring wheat.
The first model is a simulation of changes in westbound export grainrates from supply regions in North Dakota to the PNW. The secondsimulation analyzes the impacts of changes in the ocean rate differentialbetween the PNW and Gulf to the Orient. The third is a simulation ofgrowth in the Asian demand for spring wheat. This simulation is importantbecause the Asian market is considered a growth market and much of thisgrowth is expected to be exported via the PNW. All of these are evaluatedrelative to the base model in terms of trade flows, producer prices, andnet income.
Base Model
A base model was designed to reflect the basic structure of the U.S.-spring wheat distribution system. The primary focus was upon the priceresponsiveness of the export market because domestic demand was fairlystable and price inelastic. Optimal flows of traffic generated in the basemodel are illustrated in Figures 1 and 2.
Most of North Dakota and the eastern supply regions shipped toeastern domestic consuming regions and to Europe, South America, and Africavia the Duluth and Gulf port markets. Regions west of North Dakota shippedto the western domestic markets and to the PNW to meet export demand.
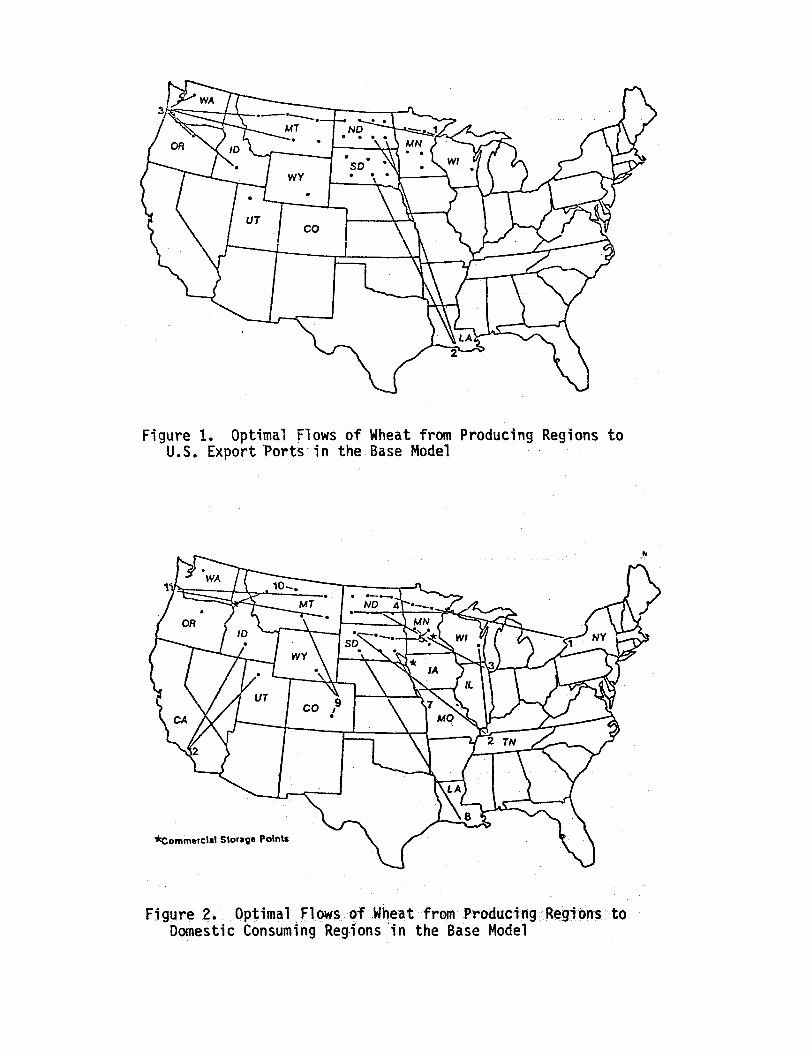
Figure 1. Optimal Flows of Wheat from Producing Regions toU.S. Export Ports in the Base Model
*Commercial Storage Points
Figure 2. Optimal Flows of Wheat from Producing ýRegions toDomestic Consuming Regions in the Base Model
ah
- 7-
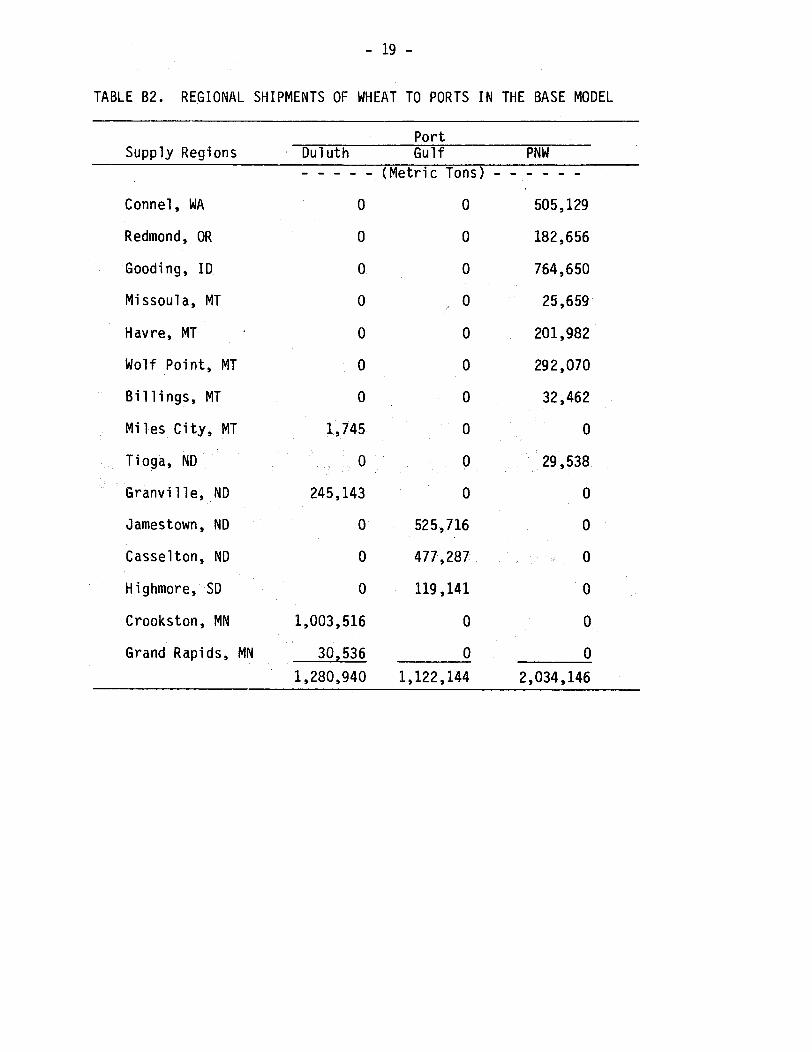
Exports to Japan and Asia were shipped via the PNW; Europe via Duluth;Africa and South America via the Gulf port. Appendix Tables B1 and B2 listthe optimal shipments of the base model. Duluth, Gulf, and PNW port pricesaveraged $3.89, $4.20, and $4.49, respectively. The average pricesreceived by farmers shipping to Duluth, the Gulf, and the PNW were $3.36,$3.22, and $3.89 per bushel, respectively. Net farm revenue was $1.252billion in the base model. The results from this model are similar toactual shipment patterns during the study period and will be used forcomparisons in the models simulated below.
Model Simulations
Changes in Westbound Rail Rates for Export
HRS wheat from eastern and central North Dakota is traditionallyshipped to eastern markets, and HRS wheat from Montana, Idaho, andWashington is shipped to the PNW. Shipments from western North Dakota arepivotal in the sense that they will be shipped east or west depending onrelative market prices (reflecting demand) and domestic freight rates. Thepurpose of this model was to examine the effectiveness of alternativefreight rates as a policy instrument in export market development.Although a small amount of North Dakota's spring wheat was shipped to thePNW in the base model, reductions in the westbound freight rate may permitthe PNW to become more competitive for North Dakota's spring wheat.Rail rates from North Dakota shipping points (see Figure 3) to the PNW werereduced from 10 to 70 percent; after the model was simulated for eachreduction, trade flows were analyzed. The rate differentials betweenDuluth and the PNW are shown in Table 2 for each PNW rate reduction. Inthe base model, the rail rate from Dickinson, North Dakota, to the PNW was32.9V/bu. greater than to Duluth. Reductions in the rate to the PNWresulted in a reduction in this differential.
TABLE 2. RAIL RATE DIFFERENTIALS BETWEEN PNW AND DULUTH BY DIFFERENT RATESCENARIOS (%/BU.)
North Dakota Rail Rate Reductions from ND to PNW (Percent)Supply Region 0 10 20 30 40 60 70
Tioga +21.0 + 7.9 - 5.1 -18.2 -31.2 -57.4. -70.4Granville +46.2 +32.3 -18.6 + 2.6 - 9.0 -36.5 -50.3Devils Lake +64.0 +50.3 +36.5 +22.8 + 9.0 -18.6 -32.3Larimore +79.2 +65.3 +51.5 +37.8 +23.9 - 3.6 -17.4Dickinson +32.9 +24.8 +11.4 - 2.0 -15.4 -42.2 -56.2Steele +60.0 +46.1 +32.3 +18.6 - 4.8 -22.8 -36.5Jamestown +72.0 +58.1 +44.3 +30.5 +16.8 -10.8 -24.5Casselton +85.8 +71.8 +58.1 +44.3 +30.5 + 3.0 -10.8
NOTE: Rail rate differentials are the difference between the rail rate to thePNW and the rail rates to Duluth for each origin. Rail rate differentialsto Mi nneapolis are only slightly different and are not shown here.
JAMESTO(WN,
Figure 3. North Dakota Supply Regions
-9-
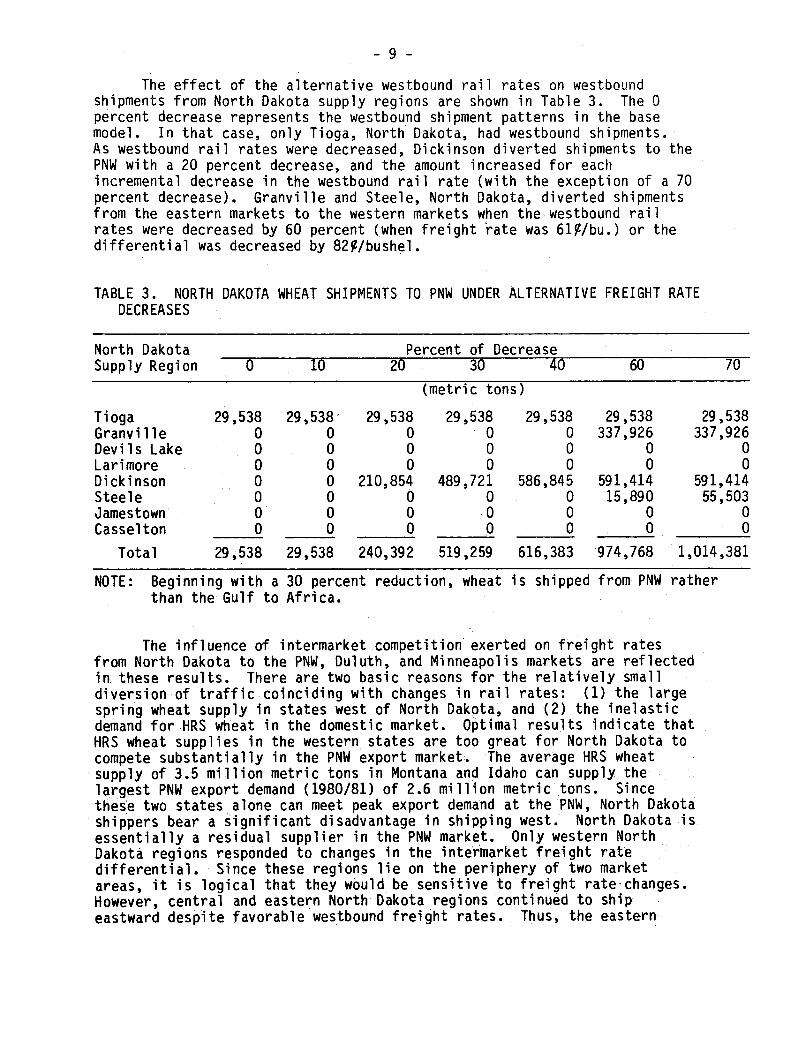
The effect of the alternative westbound rail rates on westboundshipments from North Dakota supply regions are shown in Table 3. The 0percent decrease represents the westbound shipment patterns in the basemodel. In that case, only Tioga, North Dakota, had westbound shipments.As westbound rail rates were decreased, Dickinson diverted shipments to thePNW with a 20 percent decrease, and the amount increased for eachincremental decrease in the westbound rail rate (with the exception of a 70percent decrease). Granville and Steele, North Dakota, diverted shipmentsfrom the eastern markets to the western markets when the westbound railrates were decreased by 60 percent (when freight rate was 61%/bu.) or thedifferential was decreased by 829/bushel.
TABLE 3. NORTH DAKOTA WHEAT SHIPMENTS TO PNW UNDER ALTERNATIVE FREIGHT RATEDECREASES
North Dakota Percent of DecreaseSupply Region 0 10 20 30 40 60 70
(metric tons)
Tioga 29,538 29,538 29,538 29,538 29,538 29,538 29,538Granville 0 0 0 0 0 337,926 337,926Devils Lake 0 0 0 0 0 0 0Larimore 0 0 0 0 0 0 0Dickinson 0 0 210,854 489,721 586,845 591,414 591,414Steele 0 0 0 0 0 15,890 55,503Jamestown 0 0 0 0 0 0 0Casselton 0 0 0 0 0 0 0
Total 29,538 29,538 240,392 519,259 616,383 974,768 1,014,381
NOTE: Beginning with a 30 percent reduction, wheat is shipped from PNW ratherthan the Gulf to Africa.
The influence of intermarket competition exerted on freight ratesfrom North Dakota to the PNW, Duluth, and Minneapolis markets are reflectedin these results. There are two basic reasons for the relatively smalldiversion of traffic coinciding with changes in rail rates: (1) the largespring wheat supply in states west of North Dakota, and (2) the inelasticdemand for HRS wheat in the domestic market. Optimal results indicate thatHRS wheat supplies in the western states are too great for North Dakota tocompete substantially in the PNW export market. The average HRS wheatsupply of 3.5 million metric tons in Montana and Idaho can supply thelargest PNW export demand (1980/81) of 2.6 million metric tons. Sincethese two states alone can meet peak export demand at the PNW, North Dakotashippers bear a significant disadvantage in shipping west. North Dakota isessentially a residual supplier in the PNW market. Only western NorthDakota regions responded to changes in the intermarket freight ratedifferential. Since these regions lie on the periphery of two marketareas, it is logical that they would be sensitive to freight rate changes.However, central and eastern North Dakota regions continued to shipeastward despite favorable westbound freight rates. Thus, the eastern
- 10 -
markets hold an advantage in securing wheat from North Dakota. The otherfactor which limits intermarket competition is the inelastic demand forspring wheat in the domestic market. Shipments of HRS wheat from NorthDakota to the PNW must compete with these demands from the domestic millingcenters.
Changes in Ocean Rate Differentials
The growth of the Asian market has increased the prominence of thePNW port as a primary export terminal for spring wheat exports. Factorsthat make the PNW ports more advantageous than the Gulf ports in shippinggrain to the Orient are deeper port channels to accommodate larger ships,less traffic congestion, no canal locks to limit vessel size, and theavailability of all wheat classes. The ocean freight rate differentialthrough the years has favored wheat shipment from the PNW to Asia. Sincethe 1962/63 marketing year, the rate to Asia from the PNW was less thanthat from the U.S. Gulf except in 1970/71 and 1971/72 when the U.S. Gulf'sadvantage was only slight. In recent years the PNW rate advantage hasranged from 40/MT in 1976/77 to $8.65/MT in 1980/81. Early efforts toequalize domestic transportation costs between the U.S. Gulf and the PNW byusing the inverse rail rate structure failed to account for the ocean ratedifferentials favoring the PNW.
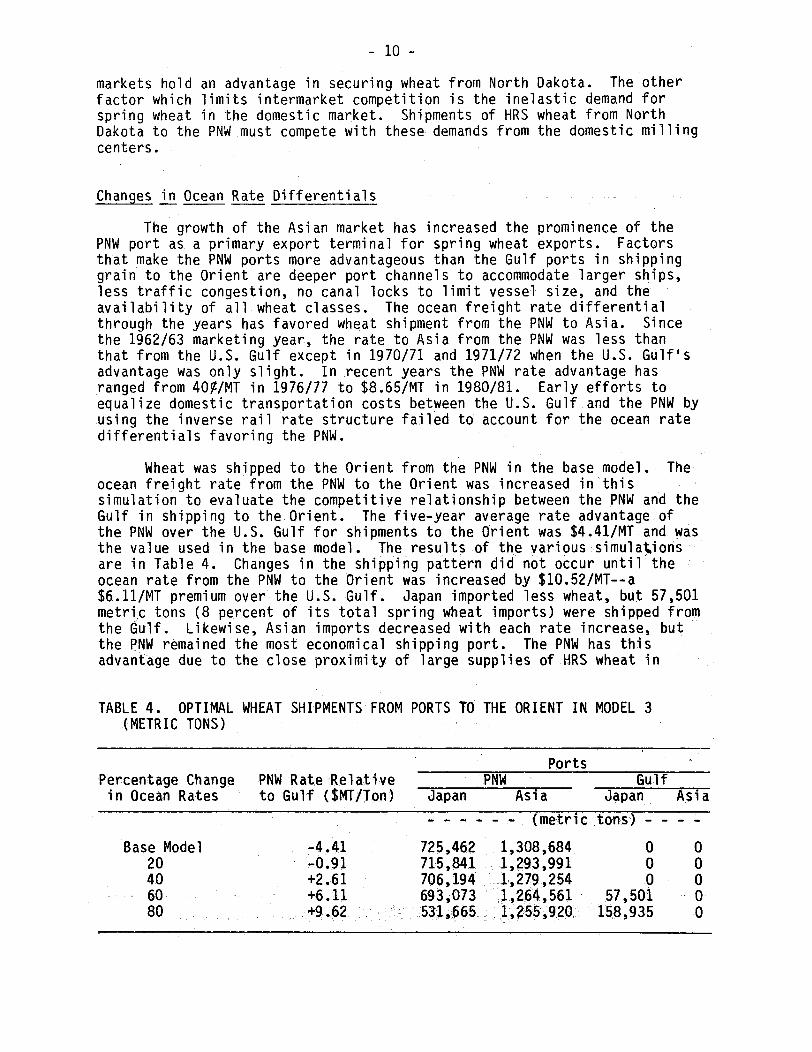
Wheat was shipped to the Orient from the PNW in the base model. Theocean freight rate from the PNW to the Orient was increased in thissimulation to evaluate the competitive relationship between the PNW and theGulf in shipping to the Orient. The five-year average rate advantage ofthe PNW over the U.S. Gulf for shipments to the Orient was $4.41/MT and wasthe value used in the base model. The results of the various simulationsare in Table 4. Changes in the shipping pattern did not occur until theocean rate from the PNW to the Orient was increased by $10.52/MT--a$6.11/MT premium over the U.S. Gulf. Japan imported less wheat, but 57,501metric tons (8 percent of its total spring wheat imports) were shipped fromthe Gulf. Likewise, Asian imports decreased with each rate increase, butthe PNW remained the most economical shipping port. The PNW has thisadvantage due to the close proximity of large supplies of HRS wheat in
TABLE 4. OPTIMAL WHEAT SHIPMENTS FROM PORTS TO THE ORIENT IN MODEL 3(METRIC TONS)
PortsPercentage Change PNW Rate Relative PNW Gulfin Ocean Rates to Gulf ($MT/Ton) Japan Asia Japan Asia
- - - - - - (metric tons) - - - -
Base Model -4.41 725,462 1,308,684 0 020 -0.91 715,841 1,293,991 0 040 +2.61 706,194 1,279,254 0 060 +6.11 693,073 1,264,561 57,501 080 +9.62 531,665 1,255,920 158,935 0
- 11 -
Montana and Idaho and the lower procurement costs relative to the U.S.Gulf. Domestic transportation dominates the shipping pattern because it ismore expensive relative to ocean transportation. This model illustratesthe premise that relatively high domestic transportation rates tend toisolate market areas. In this case, a relatively large change in the oceanrate differential was required to divert traffic away from the PNW.
Growth in Asian Demand
Spring wheat exports to Europe have essentially stabilized, whereasthe Asian export market is perceived to have greater growth potential.Japan and the Philippines became major cash customers of U.S. wheats in themid-1960s. Japan imported 884,466 metric tons of spring wheat in the1980/81 crop year compared to 343,847 metric tons in 1967. ThePhilippines' spring wheat imports have been as high as 609,390 metric tonsin crop year 1979/80. Wheat consumption increased in these countries afterWorld War II, mainly as a result of U.S. promotional efforts in thereconstruction period. Recent attention has been focused on the People'sRepublic of China (PRC) as a potential growth market for spring wheat.Their spring wheat imports totalled 123,343 metric tons for crop year1980/81. Chinese agricultural policy is directed toward a diversion ofcrop acreage from grains to cash crops, such as cotton, oilseeds, andsugar. A key factor of the policy has been to provide grain imports tothose areas shifting acreage (PRC Outlook 1981, 5, 16). Although thereis no long-run commitment by the PRC government to supply its domesticneeds via imports, continued trade negotiations are an encouraging factor.Population, income, normalized trade relations, a shift in consumer tasteand preferences, and a restructuring of the agricultural base havecontributed to the development of the Asian market for spring wheat. #Wheat exporters anticipate that these factors, as well as rising domesticproduction costs, will continue to stimulate a growth in demand.
The ramifications of growth in the Asian demand for U.S. springwheat, particularly in westbound shipments from North Dakota, weresimulated in this model. The Asian and Japanese demand curves were shiftedto the right by raising the value of the intercept term to capture a growthin demand.
A minimal increase occurred in imports to the Orient. Largerquantities of stocks were shipped from Idaho and Montana to the PNW exportmarket, but the shipping pattern did not change. Larger quantities ofstocks were shipped from regions closest to the port rather than altering-the shipping pattern to accommodate greater exports. This reflects thehigher procurement costs from interior regions, such as eastern Montana andNorth Dakota.
- 12 -
Producers' Revenue and Market Prices Under the Baseand Alternative Models
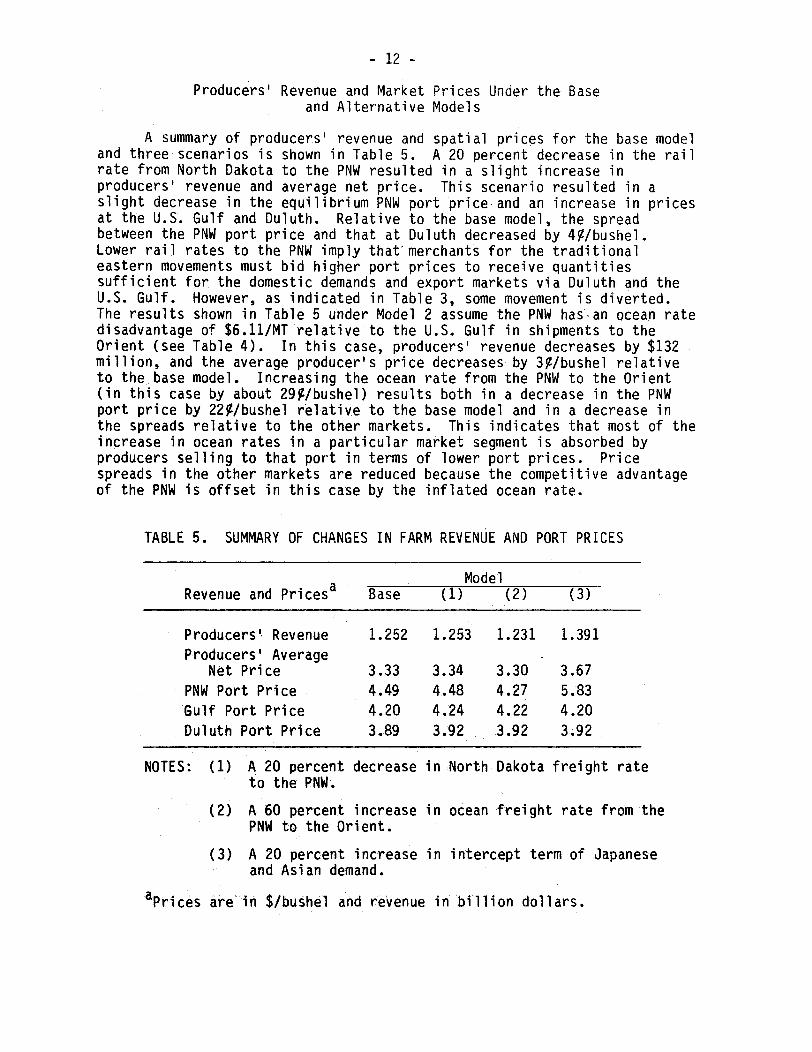
A summary of producers' revenue and spatial prices for the base modeland three scenarios is shown in Table 5. A 20 percent decrease in the railrate from North Dakota to the PNW resulted in a slight increase inproducers' revenue and average net price. This scenario resulted in aslight decrease in the equilibrium PNW port price and an increase in pricesat the U.S. Gulf and Duluth. Relative to the base model, the spreadbetween the PNW port price and that at Duluth decreased by 4ý/bushel.Lower rail rates to the PNW imply that merchants for the traditionaleastern movements must bid higher port prices to receive quantitiessufficient for the domestic demands and export markets via Duluth and theU.S. Gulf. However, as indicated in Table 3, some movement is diverted.The results shown in Table 5 under Model 2 assume the PNW has an ocean ratedisadvantage of $6.11/MT relative to the U.S. Gulf in shipments to theOrient (see Table 4). In this case, producers' revenue decreases by $132million, and the average producer's price decreases by 3%/bushel relativeto the base model. Increasing the ocean rate from the PNW to the Orient(in this case by about 29%/bushel) results both in a decrease in the PNWport price by 22%/bushel relative to the base model and in a decrease inthe spreads relative to the other markets. This indicates that most of theincrease in ocean rates in a particular market segment is absorbed byproducers selling to that port in terms of lower port prices. Pricespreads in the other markets are reduced because the competitive advantageof the PNW is offset in this case by the inflated ocean rate.
TABLE 5. SUMMARY OF CHANGES IN FARM REVENUE AND PORT PRICES
naModelRevenue and Prices Base (1) (2) (3)
Producers' Revenue 1.252 1.253 1.231 1.391Producers' Average
Net Price 3.33 3.34 3.30 3.67PNW Port Price 4.49 4.48 4.27 5.83Gulf Port Price 4.20 4.24 4.22 4.20Duluth Port Price 3.89 3.92 3.92 3.92
NOTES: (1) A 20 percent decrease in North Dakota freight rateto the PNW.
(2) A 60 percent increase in ocean freight rate from thePNW to the Orient.
(3) A 20 percent increase in intercept term of Japaneseand Asian demand.
aprices are in $/bushel and revenue in billion dollars.
- 13 -
Producers' revenue and average producers' prices increased as aresult of a 20 percent increase in the Japanese and Asian demand functions.The greatest price increase was at the PNW port from which all of theincreased shipments were exported. The price spreads relative to the othermarkets increased relative to the base model, reflecting the increasedcompetition for HRS wheat exports via the PNW.
Summary and Conclusion
Attempts to use freight rates in market development have frequentlybeen made. Adjustments in the absolute and relative values of freightrates are made in an attempt to alter the distribution pattern of aparticular commodity. The effectiveness of altering routes of a particularmode to stimulate market development depends on the spatial distribution ofsupply and demand, as well as on their elasticities and rates ofcomplementary modes. In the case of grain transportation, demands for thecommodity are typically price inelastic and the price of transportation issmall relative to the value of the commodity. The purpose of this paperwas to analyze factors which influence the distribution of hard red springwheat in movements from North Dakota to the Pacific Northwest. NorthDakota has a pivotal position in the HRS wheat distribution system; part ofthe state ships to eastern markets and part ships to western markets,depending on market conditions. In light of anticipated growth in Asiandemand for HRS wheat, shipped primarily through the PNW, rail rateadjustments have been made in the past to stimulate increased movement fromNorth Dakota to the PNW.
A spatial equilibrium model of the HRS wheat distribution system wasdeveloped and solved using quadratic programming. The base model providesa good depiction of actual grain movements and prices. The results ofthree simulations were compared to the base model to analyze factorspotentially influencing traffic patterns from North Dakota. In the optimalsolution, Duluth and Minneapolis were the primary markets for North Dakotawheat. Most of North Dakota and eastern supply regions shipped wheat toeastern domestic markets and to the Duluth and U.S. Gulf export terminals.Regions west of North Dakota supplied western domestic markets and the PNWexport market. Europe imported HRS wheat via Duluth, Africa and SouthAmerica via the U.S. Gulf, the Orient via the PNW.
Relatively large changes in rail rates were required to stimulate adiversion of traffic from eastern markets to the PNW for export. There aretwo important reasons for this. First, the supply of HRS wheat in thestates west of North Dakota is too large relative to PNW and Asian demandsfor North Dakota wheat to be competitive at the PNW on a regular basis.Second, there is a very large inelastic demand for HRS wheat in the easternmarkets which compete with the PNW for HRS wheat from North Dakota. ThePNW's advantage in shipping HRS wheat to the Asian market is predicated onrelatively low domestic transportation costs and an ocean rate advantagerelative to the U.S. Gulf. Simulations were conducted to determine theocean rate differential necessary to divert Asian shipments from the PNW tothe U.S. Gulf. The ocean rate from the PNW to the Asian market would haveto increase substantially relative to the U.S. Gulf before a significantdiversion would occur. The Asian market has been perceived to have a
- 14 -
greater growth potential relative to traditional markets for HRS. Resultsof simulations of increased Asian demand were that larger quantities ofstocks were supplied from regions closest to the PNW. However, producers'prices and net revenues would increase as a result of the increased demand.
Rail rates are frequently thought of as being a magical tool formarket development. However, their efficacy must be analyzed in thecontext of spatial equilibrium, which includes the spatial distribution ofcompeting supplies and demands, as well as the price responsiveness andrates for complementary modes. General conclusions regarding the efficacyof using rate adjustments to stimulate movements cannot be made but dependon the market conditions unique to each commodity. Transport rates wouldbe effective in stimulating traffic movements for those commodities withrelatively price elastic demands and/or in cases where the price oftransportation is a large proportion of the delivered price. In the caseof HRS wheat transportation, commodity demands and supplies are relativelyinelastic and the price of transportation is a relatively small proportionof the commodity price; consequently, rail rate decreases are not veryeffective in altering the traditional distributional patterns.
A major conclusion of this paper is that the logistical advantage andproductive capacity of competing supply regions dominate the shippingpattern in the spring wheat industry. Freight rate decreases would benefitshippers by reducing the marketing bill and raising prices, but would notbe very effective in altering the distribution of spring wheat from NorthDakota.
- 15 -
APPENDIX A
Mathematical Specification of the SpatialEquilibrium Model
- 16 -
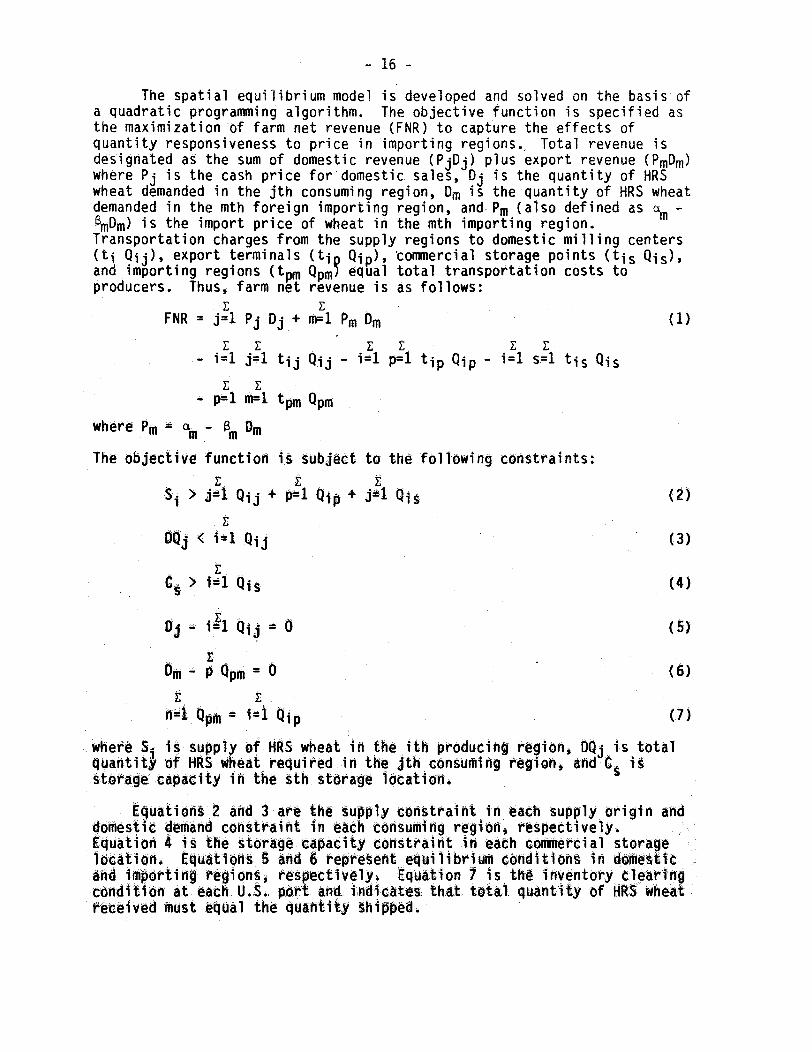
The spatial equilibrium model is developed and solved on the basis ofa quadratic programming algorithm. The objective function is specified asthe maximization of farm net revenue (FNR) to capture the effects ofquantity responsiveness to price in importing regions., Total revenue isdesignated as the sum of domestic revenue (PjDj) plus export revenue (PmDm)where Pj is the cash price for domestic sales, Dj is the quantity of HRSwheat demanded in the jth consuming region, Dm is the quantity of HRS wheatdemanded in the mth foreign importing region, and Pm (also defined as a mBmDm) is the import price of wheat in the mth importing region.Transportation charges from the supply regions to domestic milling centers(ti Qij), export terminals (ti Qip), 'commercial storage points (tis Qis),and importing regions (tpm Qpm equal total transportation costs toproducers. Thus, farm net revenue is as follows:
FNR = j=1 Pj Dj + m=1 Pm Dm (1)
- i=1 j=1 tij Qij - i=1 p=l tip Qip - i=1 s=1 tis Qis
- p=1 =l tpm Qpm
where Pm = a - B Dm
The objective function is subject to the following constraints:
Si > j=i Qij + p Qi + j1 Qis (2)
Qj < i=i Qij (3)
C > i=1 Qis (4)
Dj -i1 Qij = 0 (5)
DM - p Qpm = 0 (6)
h 4 Qpm = i1t Qip (7)
where Si is supply of HRS wheat in the ith producing region, DQj is totalquantity of HRS wheat required in the jth consuming region, and C is
torage capacity in the sth straige iocations
Equations 2 and 3 are the supply constraint in each supply origin anddomestic demand constraint in each consuming region~ respectively.Equation 4 is the storage capacity constraint in each commercial storagelocation. Equations § and 6 represent equilibrium conditions in domesticand isporting regions, respectively, Equation 7 is the inventory clearingconditioni arteach U.S. port and indicate:s that total quantity of HRS wheatreceived must equal the quantity shipped.

- 17 -
APPENDIX B(Tables)
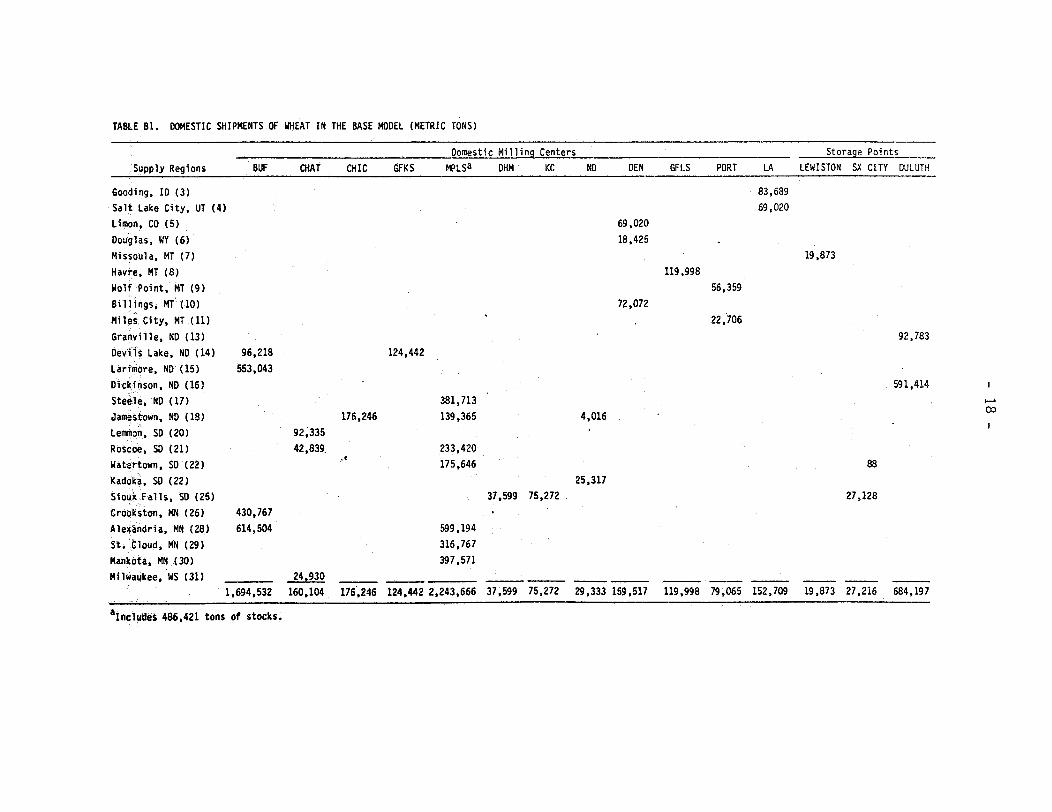
TABLE Bl. DOMESTIC SHIPMENTS OF WHEAT IN THE BASE MODEL (METRIC TONS)
Domestic Milling Centers Storage PointsSupply Regions BUF CHAT CHIC GFKS MPLSa DHM KC ND DEN GFLS PORT LA LEWISTON SX CITY DULUTH
Gooding, ID (3)Salt Lake City, UT (4)Limon, CO (5)
Douglas, WY (6)
Missoula, MT (7)
Havre, MT (8)
Wolf Point, MT (9)
Billings, MT (10)
Miles City, MT (11)
Granville, ND (13)
Devils Lake, ND (14)
Larimore, ND (15)
Dickinson, ND (16)
Steele, ND (17)
Jamestown, ND (18)
Lemmon, SD (20)
Roscoe, SD (21)
Watertown, SD (22)
Kadoka, SD (22)
Siou. Falls, SD (25)
Crookston, MN (26)
Alexandria, MN (28)
St. ̀ Cloud, MN (29)
Mankota, MN (30)
Milwaukee, WS (31)1
124,442
83,689
69,020
69,02018.425
19,873119,998
72,072
96,218
553,043
176,24692,335
42,839.
56,359
22,706
92,783
591,414381,713
139,365
233,420
175,646.1
4,016
8825,317
37,599 75,272
430,767
614,504
27,128
599,194316,767397,571
24 930 __ ______ ________
,694,532 160,104 176,246 124,442 2,243,666 37,599 75,272 29,333 159,517 119,998 79,065 152,709 19,873 27,216 684,197
aincludes 486,421 tons of stocks.
Ia-
- 19 -
TABLE B2. REGIONAL
Supply Regions
Connel, WA
Redmond, OR
Gooding, ID
Missoula, MT
Havre, MT
Wolf Point, MT
Billings, MT
Miles City, MT
Tioga, ND
Granville, ND
Jamestown, ND
Casselton, ND
Highmore, SD
Crookston, MN
Grand Rapids, MN
SHIPMENTS OF WHEAT TO PORTS IN THE BASE MODEL
Duluth
0
0
0
0
0
0
0
1,745
0
245,143
0
0
0
1,003,516
30,536
1,280,940
PortGulf
(
- cM-k -% a a
letric Tons)
0
0
0
0
0
0
0
0
0
0
525,716
477,287
119,141
0
0
1,122,144---
PNW
505,129
182,656
764,650
25,659
201,982
292,070
32,462
0
29,538
0
0
0
0
0
0
2,034,146
- 20 -
References Cited
Bale, Malcolm D., and Greenshields, Bruce L. 1977. Japan: Production andImports of Food--An Analysis of the Welfare Cost of Protection. Rpt.No. 141. Washington, D.C.: U.S. Department of Agriculture, ERS.
Fedeler, Jerry A., and Heady, Earl 0. 1976. "Grain Marketing andTransportation Interdependencies: A National Model." AmericanJournal of Agricultural Economics. 58: 224-235.
"Flour Milling Economics Under Scrutiny." Milling and Baking News, 1980.59(12): 1, 34-75.
Furtan, W. H.; Nagy, J. G.; and Storey, G. G. 1979. "The Impact on theCanadian Rapeseed Industry from Changes in Transport and TariffRates." American Journal of Agricultural Economics 61: 238-248.
International Wheat Council. Review of the World Wheat Situation. London:International Wheat Council, various issues.
International Wheat Council. World Wheat Statistics. London: InternationalWheat Council, various issues.
Konandreas, Panayotis A. 1977. An Econometric Analysis of U.S. GrainExports With Policy Implications of Price Stabilization. Ph.D.Dissertation, Davis: University of California, Department ofAgricultural Economics.
Koo, Won W. 1982. A Spatial Equilibrium Analysis of the U.S. WheatIndustry. Agricultural Experiment Rpt. No. . Fargo: North DakotaAgricultural Experiment Station, North Dakota State University.
Koo, Won W., and Cramer, Gail L. 1980. An Economic Analysis of the U.S.Wheat Marketing Structure. Department Tech. Rpt. 722. Bozeman:Montana Agricultural Experiment Station, Montana State University.
Koo, Won W., and Thompson, Sarahelen T. 1981. An Economic Analysis of U.S.Grain Marketing and Transportation System. Agricultural Economics Res.Rpt. 89. Fargo: North Dakota Agricultural Experiment Station, NorthDakota State University.
Larson, Henrietta. 1969. The Wheat Market and the Farmer in Minnesota:1858-1900. New York: AMS Press, Inc.
Leath, Mack N.; Hill, Lowell D.; and Fuller, Stephen W. 1981. WheatMovements in the United States: Interregional Flow Patterns andTransportation Requirements in 1977. North Central Regional Res.Publication No. 274. Urbana: Agricultural Experiment Station,.University of Illinois.
Luessen, Frederick W. 1968. "Wheat Distribution by Class." UnpublishedM.S. Thesis. Fargo: North Dakota State University, Department ofAgricultural Economics.
- 21 -
Milling and Grain Directory:Publishing Co.
1981. 1980. Kansas City, Mo.: Sosland
Nagy, Joseph G.; Furtan, W. H.; and Kulshreshtha, S. N. 1979. The CanadianWheat Economy: Economic Implications of Changes in the Crowsnest PassFreight Rates. Tech. Bul. No. 79-1. Saskatoon, Canada: University ofSaskatchewan, Department of Agricultural Economics.
People's Republic of China Agricultural Situation, Review of 1980 andOutlook for 1981. Supplement 6 to WAS--24. Washington, D.C.: U.S.Department of Agriculture, ESS.
Schmitz, A., and Bawden, L. 1973. Th(Analysis. Giannini Foundation Morof California.
Shei, Shun-Yi, and Thompson, Robert L.Restrictions on Price Stability inJournal of Agricultural Economics
e World Wheat Economy: An Empiricalnograph No. 32. Berkeley: University
1977. "The Impact of Tradethe World Wheat Market." American59: 628-38.
Takayama, T., and Judge, G. G.Programming." Journal of
1964. "Spatial Equilibrium andFarm Economics 46(1): 67-93.
Quadratic
Tosterud, Robert J. 1976. "North Dakota Wheat TransportationCharacteristics." Investigation of Railroad Freight Rate Structure--Grain and Grain Products. Verified Statement before the InterstateCommerce Commission, Ex Parte 270 (Sub. No. 9). Washington, D.C.:Interstate Commerce Commission.
U.S. Department of Agriculture.Washington, D.C.
U.S. Department of Agriculture.various issues.
ASCS. 1977. Approved Warehouse Li]t.
ERS. Wheat Situation. Washington, D.C.,
U.S. Department of Agriculture, FAS. 1981. U.S. Exports of ReportedAgricultural Commodities for 1975/76-1979/80 Marketing Years. FAS-M-300.Washington, D.C.
U.S. Department of Commerce,Foreign Trade Routes.
Maritime Adm. 1980.Washington, D.C.: GPO.
United States Oceanborne
Wilson, George W. 1978. "Notes on the Elasticity of Demand for FreightTransportation." Transportation Journal 5(Spring): 15.


