GRAIN REFINEMENT OF PERMANENT MOLD CAST COPPER BASE ALLOYS
124
MATERIALS TECHNOLOGY LABORATORY GRAIN REFINEMENT OF PERMANENT MOLD CAST COPPER BASE ALLOYS Final Report MTL Report 2004 - 6 (TR-R) M. Sadayappan, J.P. Thomson, M. Elboujdaini, G. Ping Gu, and M. Sahoo April, 2004
Transcript of GRAIN REFINEMENT OF PERMANENT MOLD CAST COPPER BASE ALLOYS

MATERIALS TECHNOLOGY LABORATORY
GRAIN REFINEMENT OF PERMANENT MOLD CAST
COPPER BASE ALLOYS
Final Report
MTL Report 2004 - 6 (TR-R)
M. Sadayappan, J.P. Thomson, M. Elboujdaini, G. Ping Gu, and M. Sahoo
April, 2004

The project was funded by US Department of Energy
Contract # DE-FC07-01ID13977 under the Cast Metal Coalition program.
Disclaimer
Any opinions, findings, and conclusions or recommendations expressed in this material are those of the author(s) and do not necessarily reflect the views of the Department of Energy.
Natural Resources Canada makes no representations or warranties respecting the contents of this report, either expressed or implied, arising by law or otherwise, including but not limited to implied warranties or conditions of merchantability or fitness for a particular purpose.
i
EXECUTIVE SUMMARY
Grain refinement behaviour of copper alloys cast in permanent molds was investigated. This is one of the least studied subjects in copper alloy castings. Grain refinement is not widely practiced for leaded copper alloys cast in sand molds. Aluminum bronzes and high strength yellow brasses, cast in sand and permanent molds, were usually fine grained due to the presence of more than 2% iron. Grain refinement of the most common permanent mold casting alloys, leaded yellow brass and its lead-free replacement EnviroBrass III, is not universally accepted due to the perceived problem of hard spots in finished castings and for the same reason these alloys contain very low amounts of iron.
The yellow brasses and Cu-Si alloys are gaining popularity in North America due to their low lead content and amenability for permanent mold casting. These alloys are prone to hot tearing in permanent mold casting. Grain refinement is one of the solutions for reducing this problem. However, to use this technique it is necessary to understand the mechanism of grain refinement and other issues involved in the process. The following issues were studied during this three year project funded by the US Department of Energy and the copper casting industry:
• Effect of alloying additions on the grain size of Cu-Zn alloys and their interaction with grain refiners;
• Effect of two grain refining elements, boron and zirconium, on the grain size of four copper alloys, yellow brass, EnviroBrass II, silicon brass and silicon bronze and the duration of their effect (fading);
• Prediction of grain refinement using cooling curve analysis and use of this method as an on-line quality control tool;
• Hard spot formation in yellow brass and EnviroBrass due to grain refinement;
• Corrosion resistance of the grain refined alloys;
• Transfer the technology to permanent mold casting foundries;
It was found that alloying elements such as tin and zinc do not change the grain size of Cu-Zn alloys. Aluminum promoted β phase formation and modified the grain structure from dendritic to equiaxed. Lead or bismuth reduces the size of grains, but not change the morphology of the structure in Cu-Zn alloys. The grain size of the Cu-Zn-alloy can be reduced from 3000 µm to 300 µm after the addition of aluminum and lead. Similar effects were observed in EnviroBrass III after the addition of aluminum and bismuth.
Boron refined the structure of yellow brasses in the presence of iron. At least 50 ppm of iron and 3 ppm of boron are necessary to cause grain refinement in these alloys. Precipitation of iron from the melt is identified as the cause of grain refinement. Boron initiates the precipitation of iron which could not be explained at this time. On the other hand zirconium causes some reduction in grain size in all four alloys investigated. The critical limit for the zirconium was found to be around 100 ppm below which not much

ii
refinement could be observed. The mechanism of grain refinement in the presence of zirconium could not be explained.
Grain refinement by boron and iron can remain over a long period of time, at least for 72 hours of holding or after remelting few times. It is necessary to have the iron and boron contents above the critical limits mentioned earlier. On the other hand, refinement by zirconium is lost quite rapidly, some times within one hour of holding, mostly due to the loss of zirconium, most probably by oxidation, from the melt. In all the cases it is possible to revive the refinement by adding more of the appropriate refining element.
Cooling curve analysis (thermal analysis) can be used successfully to predict the grain refinement in yellow brasses. The precipitation of iron in the liquid metal causes the metal to solidify without undercooling. Absence of this reaction, as indicated by the time-temperature (t-T) and its first derivative (dt/dT) curves, proved to be an indicator of refinement. The viability of the technique as an on-line quality control tool was proved in two foundries. The method can also correctly predict the onset of fading.
The corrosion resistance of the grain refined alloys was measured in two solutions having different hydrogen activities, pH 6 and pH8, and compared with the base alloys. Potentiodynamic polarization and long term weight loss experiments were conducted to evaluate the corrosion resistance. Cu-Zn alloys were evaluated for dezincification. In general, the grain refined alloys performed marginally better than the base alloys.
The details of the experimental work and results are presented in this report. The findings are analyzed and discussed in detail. The report is divided into eight sections as follows:
1. Background and experimental details
2. Effect of alloy additions on the microstructure of Cu-Zn alloy
3. Effect of grain refiners
4. Fading
5. Thermal analysis
6. Hard spot formation in yellow brass
7. Corrosion resistance
8. Technology transfer
iii
ACKNOWLEDGEMENTS
Dr. Harold T. Michels, Vice President, Copper Development Association administered this project.
The technical aspect of the project was monitored by the Permanent Mold Committee of the AFS Division 3 - Copper Alloy.
The services and support of following persons and organizations are gratefully acknowledged:
Mr. Steve Ducharme, H. Kramer & Co, Chicago, USA
Mr. Tom Hoesly (Formerly with Starline Manufacturing, Milwaukee, USA.)
Starline Manufacturing Company, Milwaukee, USA
Ms. Sylvia Canino, Kohler Company, Kohler, USA
Mr. Paul Huyusman, Afflips, Belgium
Mr. Mathias Hau, Aula Chemie, Frankfurt, Germany
CANMET - MTL, Ottawa, Canada
- Luc Millette and Staff of Experimental Casting Lab
- Staff of Engineering Technical Services
- Mr. Denis Cousineau, Ms. R. Zavadil, Ms. Sonja Rochon
- Mr. Yves Lafreniere and Corrosion Group
iv
PUBLICATIONS
1. M. Sadayappan, D. Cousineau, R. Zavadil, M. Sahoo and H. Michels, “Grain refinement of permanent mold cast copper base alloys”, AFS Transactions, Vol.110, pp. 505-514, 2002
2. M. Sadayappan, R. Zavadil, R. Packwood, M. Sahoo and H.T. Michels, “Hard spot formation in grain refined yellow brasses and EnviroBrass III”, AFS Transactions, Vol.111, pp. 2003
3. J.P. Thomson, M. Sadayappan and M. Sahoo, “Evaluation of grain refinement of leaded yellow brass (C85800) and EnviroBrass III (C89550) using thermal analysis”, AFS Transactions, Vol.111, pp. 2003
4. J.P. Thomson, M. Sadayappan and M. Sahoo, “Study of Grain Refinement in Copper Base Alloys Using Thermal Analysis”, Proceeding of the Conference – Copper 2003 - 5th International Conference, Nov 30 – Dec 3, 2003, Santiago, Chile, pp. 661 - 675, 2003.
5. M. Sadayappan, J.P. Thomson, R. Zavadil, M. Sahoo and H.T. Michels, “Fading Of Grain Refinement In Permanent Mold Cast Copper Alloys”, Communicated for publication in AFS Transactions, Vol.112, 2004.
6. M. Sadayappan, J.P. Thomson and M. Sahoo, “Grain Refinement of Permanent Mold Cast Copper Base Alloys”, Accepted for presentation at World Foundry Congress, Istanbul, Turkey, September 2004.
1
SECTION 1
BACKGROUND AND EXPERIMENTAL DETAILS

2
Introduction
Grain refinement is a well established process for many cast and wrought alloys. The mechanical properties of various alloys could be enhanced by reducing the grain size. Refinement is also known to improve casting characteristics such as fluidity and hot tearing. Grain refinement of copper-base alloys is not widely used, especially in sand casting process. However, in permanent mold casting of copper alloys it is now common to use grain refinement to counteract the problem of severe hot tearing which also improves the pressure tightness of plumbing components.
The mechanism of grain refinement in copper-base alloys is not well understood. The issues to be studied include the effect of minor alloy additions on the microstructure, their interaction with the grain refiner, effect of cooling rate, and loss of grain refinement (fading). In this investigation, efforts were made to explore and understand grain refinement of copper alloys, especially in permanent mold casting conditions.
Review of Literature
The mechanism of grain refinement in copper-base alloys is less popular as compared to other metal systems. The usual purpose of grain refinement is to decrease the grain size of cast metal which enhances mechanical properties. Reducing the grain size also improves hot tearing resistance, casting fluidity and enhances surface finish of various alloy systems. The main purpose of refinement in copper alloys is to combat hot tearing, since the strength is usually adequate.
Grain refinement by alloying additions works by three mechanisms. The first type is inoculation, in which a particle nucleates a new grain in which lattice spacing of the inoculant and that of the freezing front of the alloy are similar. For this mechanism to be active, the particles should be present in melt well before the melt reaches its liquidus temperature. The other two mechanisms are active as solidification is progressing, or in other words well beyond the liquidus reaction of the alloy . The second mechanism is growth inhibition by constitutional super-cooling in which solute piles up ahead of the advancing solid/liquid interface causing the composition to drop below the equilibrium. The third possibility is growth inhibition, in which the solute element is adsorbed onto the advancing solid/liquid interface and breaks up the dendrites. Which of the three mechanisms is active in copper is debatable.
Early work on grain refinement of copper alloys showed various additions are effective with different copper alloys. For bronzes and gun metals, a) 0.3% Zr with C and or N in the absence of sulfur, b) 0.2% Ti with 0.03% B and C) 0.1% Fe or Co with 0.03% B are effective. Couture and Edwards found zirconium effective in tin bronzes and red brass, but not silicon bronze. Although sulfur destroys the grain refining effect of zirconium, it could be recovered by adding magnesium [1]. Ruddle indicated 0.05% Zr or 1% iron is effective for gun metals and red brass. Iron was effective as grain refiner for aluminum and manganese bronzes. Iron-free aluminum bronzes and beta brasses can be refined by a combination of 0.03% Zr and 0.02% B [2] . Zirconium (0.3%) and boron (0.02%) together were effective in Fe-free beta brass [3] . Wallace has also shown that for copper-
3
zinc alloys, 1% iron powder is effective, whereas for iron-free alloys such as Cu-33Zn-4Al, combinations of 0.06% zirconium and 0.02% boron were effective. Zirconium alone had little effect, but boron alone could be effective. Nevertheless, the combination was not effective on 67Cu-33Zn [4]. Alpha-beta brasses will be refined if iron is added or they contain more than 1% iron. However, for alloys with low levels of iron, boron is the best additive.
Reif found that for alloys with 25-42% zinc, the coarse dendritic or columnar structure could be transformed to a fine equiaxed structure by the addition of zirconium, magnesium, iron and phosphorus [5,6]. Grain refinement was claimed to be effective after prolonged holding, high melt or mold temperatures. The nuclei were extracted and found to contain the grain refining elements along with oxygen and sulfur. However, although the lattice structure matched that of the copper matrix, the parameters did not. Weber and Reif subsequently patented the addition of zirconium along with magnesium, iron and phosphorus, although many other elements were included [7]. Their company also patented a similar grain refiner for Cu-Zn alloys [8]. Magnesium was often added to chemically protect the zirconium from oxidation [9]. Around the same time, Krizman suggested 0.04% cerium, 0.003% boron, and a third ingredient (0.02% desofin) [10].
Other investigators reported that zirconium grain refined the morphology of 70Cu-30Zn in both sand and gravity permanent mold castings. The zirconium addition not only improves tensile strength and elongation, but also improves feeding. Iron and boron, both grain refiners in high strength yellow brass, can produce hard spots [11].
Research on the various aspects of permanent mold casting of copper-base alloys, including grain refinement as part of developing new lead-free copper alloys for plumbing applications, is being carried out at Materials Technology Laboratory since 1991 (MTL). Some of the findings on grain refinement, obtained during these investigations, can be summarized as follows[12-16]:
• Boron refined the grain structure of lead-free red brass whereas zirconium refined the lead-containing red brass.
• EnviroBrass II (formerly known as SeBiLOY II ) could be grain refined by zirconium.
• Yellow brass (alloy C85800) could be grain refined by boron irrespective of the tin content.
• EnviroBrass III (formerly known as SeBiLOY III) could be refined by boron at low tin (~0.3%) contents and by zirconium at high tin (~1%) contents.
• Lead-free silicon brass and silicon bronze, on the other hand, could be grain refined only by zirconium.
• Grain refinement improved the hot tearing resistance in all copper base alloys investigated.
4
• Hard particles formed in yellow brass at relatively high iron contents (>0.05%) when grain- refined with boron. These hard particles lead to the formation of comet tails during polishing and buffing.
• Grain refinement of some copper-base alloys could improve the casting fluidity in permanent molds.
A thorough literature review on grain refinement was performed[17] as part of a project “Process Parameters for lead-free engineering copper-base alloys in permanent molds” which was funded by the Department of Energy (DOE), USA through the Cast Metal Coalition (CMC). This review has demonstrated clearly that one of the principal objectives of research in this field should be to seek clarification of the functional mechanisms such as nucleation in grain refined copper alloys. The literature review also suggested a ‘shopping list’ of experimental areas where further work is needed.
• Determine the composition ranges for Fe and B in yellow brasses where hard spots do not occur as a function of the casting process and section size.
• Using electron microscopy, identify and characterize the nuclei in brasses refined with B, and in brasses and bronzes refined with Zr. Consider how the observations relate to nucleation theory.
• Examine the relationship between castability (effective fluidity) and grain refinement.
• Examine the usefulness of thermal analysis as an indicator of the nucleation in copper-base alloys. Could this be used by the industry as a quality control tool? Thermal analysis is being used as a process control in the production of aluminum alloys [18,19].
• Study the fading of grain refinement in alloys refined with B or Zr.
• Evaluate the effect of different alloy constituents in copper alloys on the grain refinement.
• Study the effect of grain refinement on corrosion resistance and dezincification.
• Evaluate the reported effect of grain refinement on the layer porosity formation in tin bronzes.
Industrial Perspective
The observations by the industry and other researchers in this field are bewildering, and sometimes contradictory. This became more evident during the Panel discussion at the recent ‘International Workshop on Permanent Mold Casting of Copper-Base Alloys’ held at CANMET, Ottawa, October 15 -16, 1998. Some of the issues discussed in the panel are presented below:
Tin content
The effect of tin content on the grain refinement is not well defined. European work[20] suggests that for yellow brass, both leaded and Bi/Se modified, boron is effective only at
5
low tin levels (Sn#0.4%). Zirconium should be added to refine the grain structure when the tin content exceeds 0.4%.
Aluminum Content
Another concern raised by the industry is the effect of aluminum content on grain refinement. Usually, yellow brass and SeBiLOY III contain 0.3 to 0.5% aluminum which is added to improve casting fluidity. However, its effect on the grain refinement is not well established. This company thinks that Al could play a role in grain refinement which has not been verified.
Hard spots
Effect of iron, boron, zirconium and other impurity elements on the formation of hard spots in yellow brass is not established. Hard spots have been reported to occur in alloys containing very small amounts of boron (<10ppm) and iron (0.03 - 0.06%). Other factors which might contribute to hard spot formation are probably Ni and Si contents and pour temperature.
Some foundries are of the opinion that addition of Zr (~150ppm) in combination with boron (<10ppm) can also lead to hard spots in yellow brass and the metal is sluggish to pour[21]. A few have suggested that it is important to maintain Ni content between 0.15-0.25 to keep the iron in solution (i.e. maintain certain Ni to Fe ratio). However, the total tin and iron contents should be below 0.4% in this alloy. One foundry specializing only in permanent mold casting of copper-base alloys had observed hard spots in 60/40 yellow brass[22]. This alloy contained some Fe, but was not grain refined. The hard spots led to the formation of comet tails during buffing.
Cooling rates
There is some indication that cooling rates might affect the extent of grain refinement. Sand castings require relatively more grain refiner than permanent mold castings. Furthermore, different section sizes reveal different grain size after grain refinement. This effect would be important in a casting with varying section sizes where the cooling rates differ from section to section.
Processes
In addition to the above, the AFS Research Committee 3-C on Copper Alloys had set its own priorities, mostly on the process variables, in its 1998 committee meetings as follows:
1. Method and frequency of addition of grain refiners
2. Analysis of residual grain refiner (ppm level)
3. Analysis on the amount of grain refiner + iron + nickel + silicon and correlation with hard spots (following B and Zr grain refinement). In addition, attention should be focused on metal temperature, die material, graphite dip, etc.
6
4. Polish, buff, and rouge color actual castings to reveal the hard spots. Hard spots require the high red color to manifest them to the naked eye. Analyze the hard spots using electron probe micro analyzer (EPMA) and scanning electron microscope (SEM).
5. Perform pressure tightness of actual plumbing components. Castings must be machined, polished, buffed, and plated (and assembled as required) and then pressure tested.
6. The efficacy of commercial refiners such as FKM 2000 and Desofin developed in Europe over a period of time. The commercially available refiners are mixtures of salts containing boron and zirconium. There are concerns that these powders may lose their potency over a period of time if not stored properly.
Current work
The above discussion clearly shows the lack of understanding regarding the grain refinement of copper alloys and sets up the priorities. To answer the most pressing questions, a proposal was prepared with inputs from AFS Copper Alloy Division and submitted for US Department Energy funding through Cast Metal Coalition. The objectives of the proposal were selected to address some of issues identified and described above.
Objectives
• Investigate the grain refinement of four permanent mold cast copper alloys namely yellow brass (C85800), EnviroBrass III (C89550), silicon brass (C87500) and silicon bronze (C87600).
• Evaluate effectiveness of various grain refiners containing B or Zr available in the market.
• Study the loss of grain refinement, known as fading, due to holding, remelting and charge mixing.
• Investigate the effect of grain refinement and various alloy elements such as Fe, Sn and Si on the hard spot formation.
• Develop the thermal analysis method to predict grain refinement, fading and hard spot formation.
• Characterize the corrosion behaviour of grain refined copper alloys.
• Transfer the technology to the copper permanent mold casting industry.
7
Experimental Work
Master Alloy Preparation
As explained before, four alloys, yellow brass (C85800), EnviroBrass III (C89550), silicon brass (C87500) and silicon bronze (C87600) were selected for this investigation. Various types of master alloys were prepared for different experiments. The alloys are listed below:
• 250 kg of Cu-36% Zn alloy – for the work on the effect of various alloying elements on the structure of Cu-Zn alloy
• 400 kg of master alloy for each alloy selected, yellow brass, EnviroBrass III and silicon bronze – This is for the work on the effect of various grain refiners. These alloys were free of iron. The compositions of these alloys are presented in Table 1.
• 200 kg of yellow brass and EnviroBrass III with 0.05% iron - this is for the work on fading and hard spot formation
• Silicon brass alloy was supplied by H. Kramer & Co. The composition of this alloy is also included in Table 1.1.
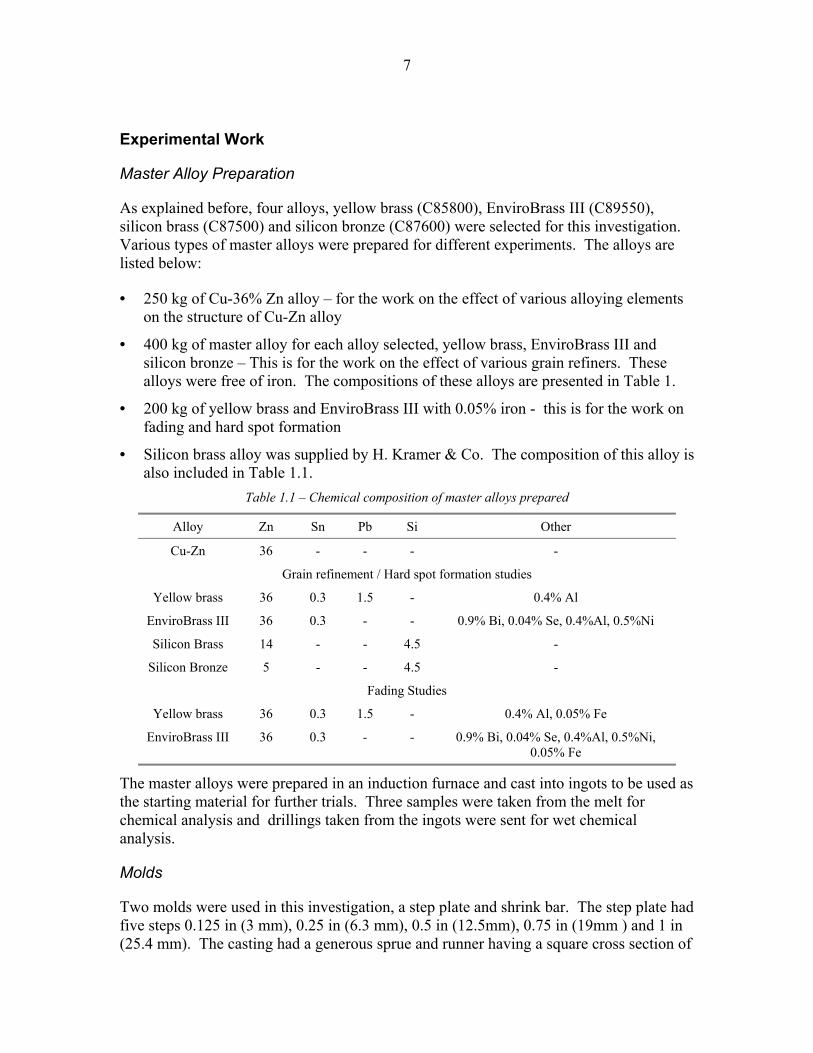
Table 1.1 – Chemical composition of master alloys prepared
Alloy Zn Sn Pb Si Other
Cu-Zn 36 - - - -
Grain refinement / Hard spot formation studies
Yellow brass 36 0.3 1.5 - 0.4% Al
EnviroBrass III 36 0.3 - - 0.9% Bi, 0.04% Se, 0.4%Al, 0.5%Ni
Silicon Brass 14 - - 4.5 -
Silicon Bronze 5 - - 4.5 -
Fading Studies
Yellow brass 36 0.3 1.5 - 0.4% Al, 0.05% Fe
EnviroBrass III 36 0.3 - - 0.9% Bi, 0.04% Se, 0.4%Al, 0.5%Ni, 0.05% Fe
The master alloys were prepared in an induction furnace and cast into ingots to be used as the starting material for further trials. Three samples were taken from the melt for chemical analysis and drillings taken from the ingots were sent for wet chemical analysis.
Molds
Two molds were used in this investigation, a step plate and shrink bar. The step plate had five steps 0.125 in (3 mm), 0.25 in (6.3 mm), 0.5 in (12.5mm), 0.75 in (19mm ) and 1 in (25.4 mm). The casting had a generous sprue and runner having a square cross section of

8
1 in x 1 in (25 mm x 25 mm). The mold is made of cast iron and mounted on the C40 IMR gravity casting machine. The mold was heated to 200C and given a insulating mold wash before the casting trials. In between the casting trials, the mold was dipped into the graphite water slurry to keep the mold temperature within the desired range of 180 – 220C.
The shrink bar mold is a 5 in (125mm) long cylindrical rod with a diameter of 0.75 in. (19 mm). The mold, again is made of cast iron and coated with an insulating wash prior to casting trials. This mold was not cooled with graphite slurry in between trials as the mold did not over heat due to casting.
The grain refinement was confirmed by metallography during the early stages. The method is explained in Appendix I. Later, the thermal analysis technique could be successfully used for predicting the grain refinement.
The following sections of the report deals with various issues investigated during this three year project.
References
1. Couture, A., Edwards, J.O., “Grain refinement of sand cast bronzes and its influence on their properties,” AFS Transactions, Vol. 81, pp 453-361 (1973)
2. Ruddle, R.W., “Solidification of copper alloys,” Modern Castings, Vol. 38, pp 81-86 (Dec. 1960)
3. Cibula, A., Grain refining additions for cast copper alloys,” J. Institute of Metals, Vol. 82, pp 513-523 (1953-1954)
4. Wallace, J.F., Kissling, .J., “Grain refinement in copper and Cu alloy castings,” Foundry, Vol. 91, Part 1, Aug. pp 54-57, Part 2, Sept. pp 74-77 (1963)
5. Reif, W., Weber, G., “A new grain refiner for copper-zinc alloys containing 25-42% zinc,” Metall, Vol. 41, pp 1131-1137 (1987)
6. Reif, W., Weber, G., “Study of CuZn36 concerning the mechanisms of grain refinement in copper alloys by added zirconium, magnesium, iron and phosphorus,” Solidification Processing 1987, Sheffield, UK, 21-24 Sept. 1987. Published by Institute of Metals, London, (1988)
7. Reif, W., Weber, G., “Grain refining metals,” US Patent No.4,786,469 (Nov 22, 1985)
8. Kellie, J.L.F., Cowell, A.J.J., Grain refining metals,” US Patent No. 4,708,739 (Nov 24, 1987)
9. Cowell, A.J.J., Nixon, R.C.C., “A new grain refining system for copper alloys,” pp44-47, Copper ’86 Conference Proceedings Barga, Lucca, Italy, 10-12 Sept. 1986. Published by Europa Metalli – LMI, Borgo Pinti 99, Florence, Italy, 1989.
10. Krizman, A., “Grain refining brass for gravity die casting,” (Solvenian) Livarsto Vol. 1, pp 9-14 (1986)
9
11. Romankiewicz, F., Ellefbrok, R, Engler, S., “Effect of grain refinement by zirconium on the morphology of solidification, feeding capacity and mechanical properties of brass CuZn30 and silicon brass CuZn15Si4,” Giessereiforschung, Vol. 39, pp 23-33 (1987)
12. Fasoyinu, F.A., et al., "Grain Refinement Of Permanent Mold Cast Yellow Brass", Proc. Conf., 4th Decennial International Conference on "Solidification Processing - 97", 7-10 July, 1997, Sheffield. UK.
13. Sadayappan, M., et al., “Grain Refinement Studies on Permanent Mold Cast SeBiLOY III,” AFS Transactions, Vol.106, 1998.
14. Fasoyinu, F.A., et al., “Effect of Grain Refinement on the Hot Tear Resistance and Shrinkage Characteristics of Permanent Mold Cast Yellow Brass (C85800),” AFS Transactions, Vol. 106, 1998.
15. Sadayappan, M., Fasoyinu, F.A., Sahoo, M., ”Grain refinement of copper alloys,” Fourth International Conference, Edited by Eltringham, G.A., Piret, N.L., Sahoo, M., Copper 99 – Cobre 99, Vol. 1, pp 279-291 (1999)
16. Sahoo, M. , et al., “A review of bismuth and selenium modified copper alloys for plumbing applications,” Fourth International Conference, Edited by Eltringham, G.A., Piret, N.L., Sahoo, M., Copper 99 – Cobre 99, Vol. 1, pp 327-341 (1999)
17. Sahoo, M. and Davis, K.G., "Grain Refinement of Copper Base Alloys - A Literature Review", MTL Report 10 (TR - R), 1997.
18. Sparkman, D. and Kearney, A., “Breakthrough in Aluminum Alloy Thermal Analysis Technology for Process Control”, AFS Transactions, Vol. 102, pp.455 - 460, 1994.
19. Gowri, S., “Comparison of Thermal Analysis Parameters of 356 and 359 Alloys,” AFS Transactions, Vol. 102, pp. 503 - 508, 1994.
20. Mulle, P., Blockmetall AG., Switzerland, Private Communication.
21. Canino, S., Kohler Die Cast, Private Communication.
22. Schweisthal K., PIAD Precision Casting, Private Communication.
10
SECTION 2
EFFECT OF ALLOYING ELEMENTS ON THE MICROSTRUCTURE OF Cu-Zn ALLOY
11
Introduction
The effect of various alloy additions on the microstructure of the Cu-36% Zn alloy is not well understood. Also, the interaction between the grain refiner and minor alloy additions such as Sn, Al, Bi, Se and Pb should be evaluated. One other casting variable which could affect the grain size is the cooling rate in which the casting solidifies. This arises due to the different section sizes of a typical metal casting. The interaction of various alloy additions is important in the selection of the appropriate grain refiner for different alloys. In this report, the results of the experiments conducted on Cu-36% Zn alloy, which is the base for leaded yellow brass (C85800) and EnviroBrass III (C89550), are presented and discussed.
Experimental Details
25 kg of Cu-36% Zn alloy ingots was melted in a clay graphite crucible using a 100kW push up type induction furnace. The step plate casting was used to assess the effect of section size on grain refinement. The casting procedure was explained in Section 1. After meltdown, one step plate casting and one shrink bar were produced. Then selected amount of alloying element (Sn, Al or Pb) was added and castings were produced. Boron was added as grain refiner in few of the trials either before or after the minor alloy addition.
The step plate casting was sectioned in the middle and polished for macro and micro examination. The macrostructure was revealed by a 50% nitric acid – alcohol solution. The microstructure was revealed by etching with ferric chloride – alcohol solution.
Results
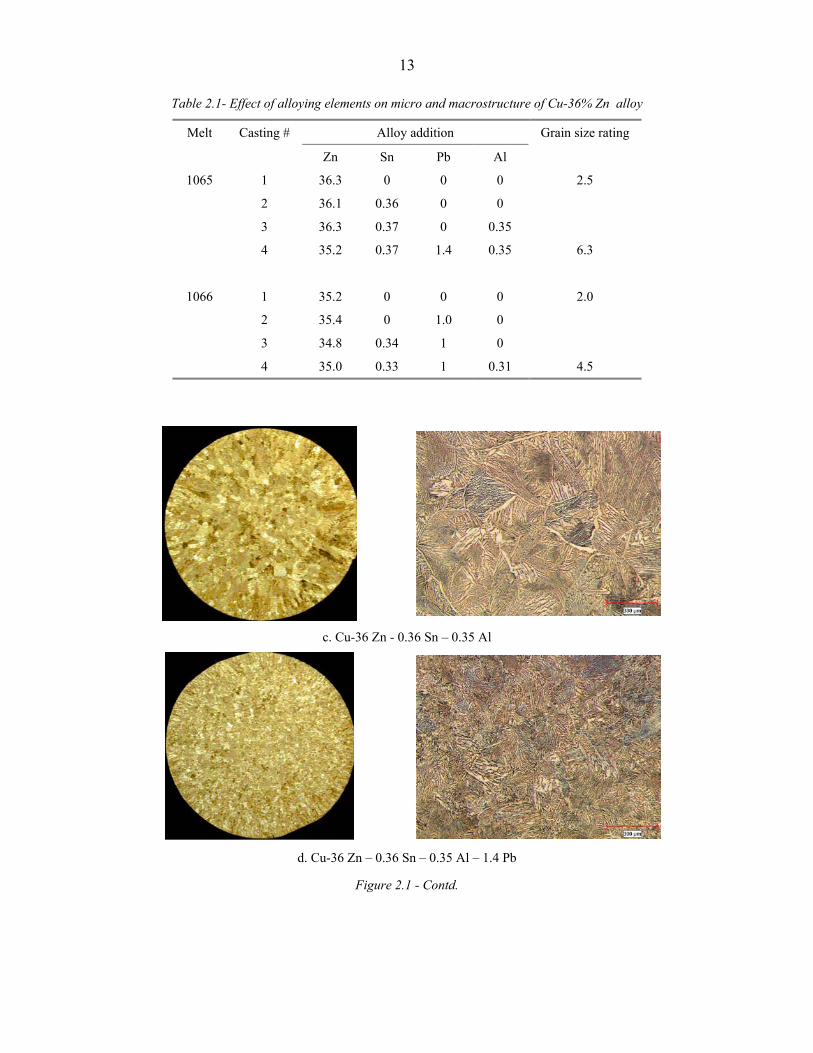
The results including the analysis of the alloys prepared to study the effect of alloying elements is shown in Table 2.1. Typical results from two melts are presented here. In the first melt Cu-Zn alloy was melted and Sn, Al and Pb were added successively. In the second melt the order was modified as Pb, Sn and Al. The grain size of these castings was evaluated using the scale developed as a part of the investigation which is explained in Appendix 1.
Melt 1065
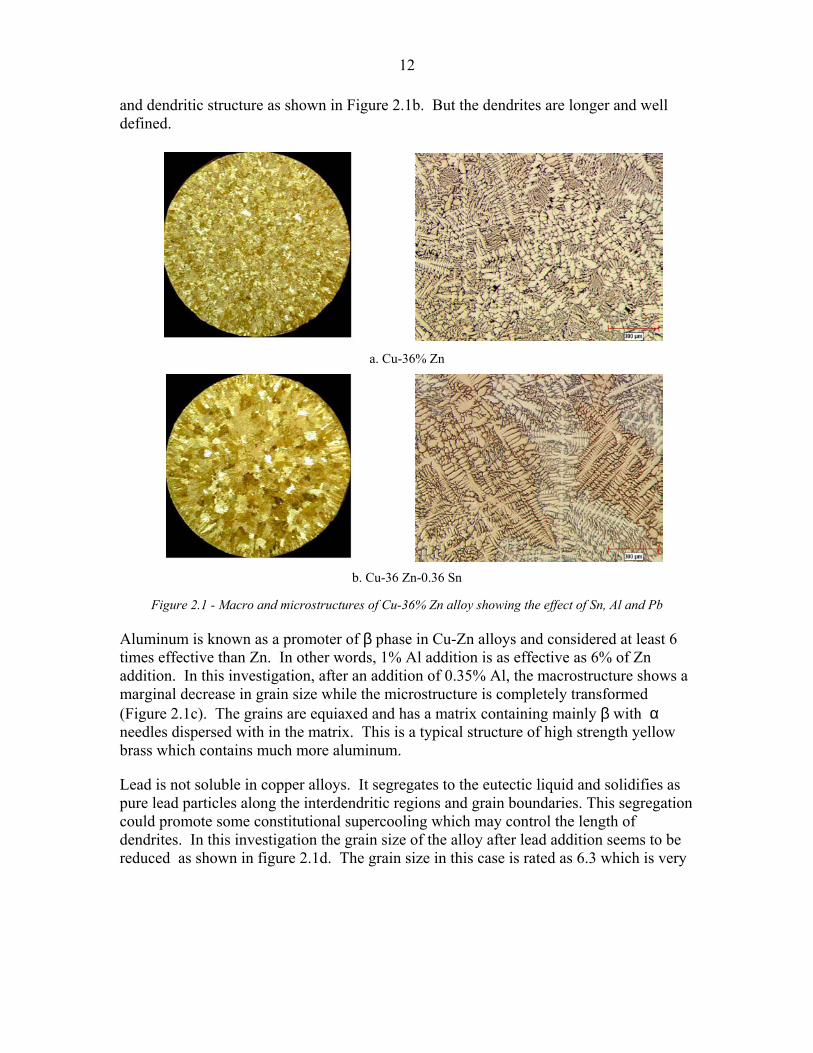
The macro and respective micro structures are presented in Figure 2.1. The Cu-36% Zn alloy had rather large grains (Figure 2.1a) which was rated as 2.5. The microstructure of this alloy contains primary α dendrites with some β phase in the interdendritic areas and grain boundaries. Every other element added to this alloy modifies the structure both in constituents and size.
Tin is completely soluble in copper and forms solid solution with copper. However, it drastically reduces the melting point of the alloy and is susceptible to segregation within the α phase causing coring. However it is not known to change the grain size of the alloy. In this work, the Cu-36% Zn alloy after a addition of 0.35% Sn still has a coarse
12
and dendritic structure as shown in Figure 2.1b. But the dendrites are longer and well defined.
a. Cu-36% Zn
b. Cu-36 Zn-0.36 Sn
Figure 2.1 - Macro and microstructures of Cu-36% Zn alloy showing the effect of Sn, Al and Pb
Aluminum is known as a promoter of β phase in Cu-Zn alloys and considered at least 6 times effective than Zn. In other words, 1% Al addition is as effective as 6% of Zn addition. In this investigation, after an addition of 0.35% Al, the macrostructure shows a marginal decrease in grain size while the microstructure is completely transformed (Figure 2.1c). The grains are equiaxed and has a matrix containing mainly β with α needles dispersed with in the matrix. This is a typical structure of high strength yellow brass which contains much more aluminum.
Lead is not soluble in copper alloys. It segregates to the eutectic liquid and solidifies as pure lead particles along the interdendritic regions and grain boundaries. This segregation could promote some constitutional supercooling which may control the length of dendrites. In this investigation the grain size of the alloy after lead addition seems to be reduced as shown in figure 2.1d. The grain size in this case is rated as 6.3 which is very
13
Table 2.1- Effect of alloying elements on micro and macrostructure of Cu-36% Zn alloy
Alloy addition Melt Casting #
Zn Sn Pb Al
Grain size rating
1065 1 36.3 0 0 0 2.5
2 36.1 0.36 0 0
3 36.3 0.37 0 0.35
4 35.2 0.37 1.4 0.35 6.3
1066 1 35.2 0 0 0 2.0
2 35.4 0 1.0 0
3 34.8 0.34 1 0
4 35.0 0.33 1 0.31 4.5
c. Cu-36 Zn - 0.36 Sn – 0.35 Al
d. Cu-36 Zn – 0.36 Sn – 0.35 Al – 1.4 Pb
Figure 2.1 - Contd.

14
fine compared to the base Cu-36Zn alloy. However, a ring of columnar grains could be still observed in the outer surface indicating lack of grain refinement in this alloy. The microstructure is also very fine.
Melt 1066
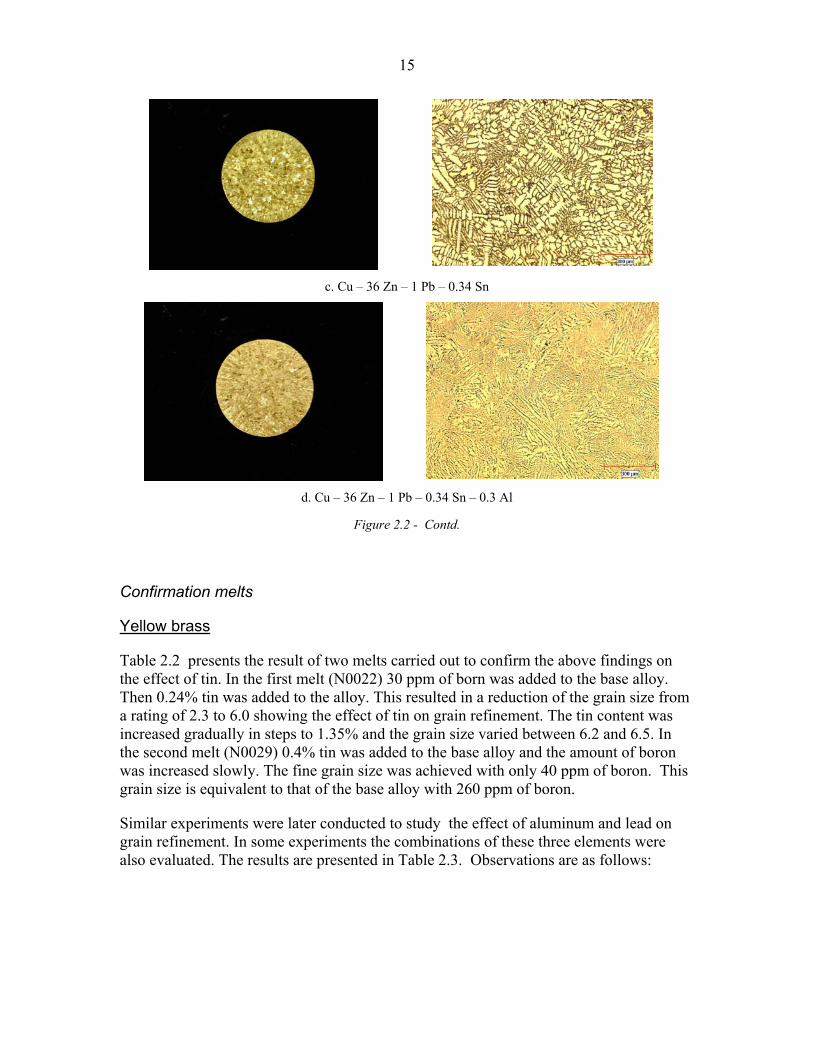
This melt was a repeat of 1065 but the order of addition was changed. The macro and micro structures of samples from this experiment are presented in Figure 2.2. The base Cu-Zn alloy has a coarse grain and dendritic structure (Figure 2.2a). After the addition of lead and tin the grain size is marginally reduced but the structure remains dendritic as shown in Figures 2.2b and 2.2c. The structure turns into an equiaxed mixture of β and α after the addition of aluminum and the grain size is reduced (Fig 2.2d). The grain size rating for this structure is 4.5. This is coarser when compared to the sample at the end of the melt 1065 (grain size 6.3) which may be due to the lower lead content.
a. Cu- 36% Zn
b. Cu – 36 Zn – 1 Pb
Figure 2.2 - Macro and microstructures of Cu-36% Zn alloy; the grain size is modified by the addition of Pb, Sn and Al
15
c. Cu – 36 Zn – 1 Pb – 0.34 Sn
d. Cu – 36 Zn – 1 Pb – 0.34 Sn – 0.3 Al
Figure 2.2 - Contd.
Confirmation melts
Yellow brass
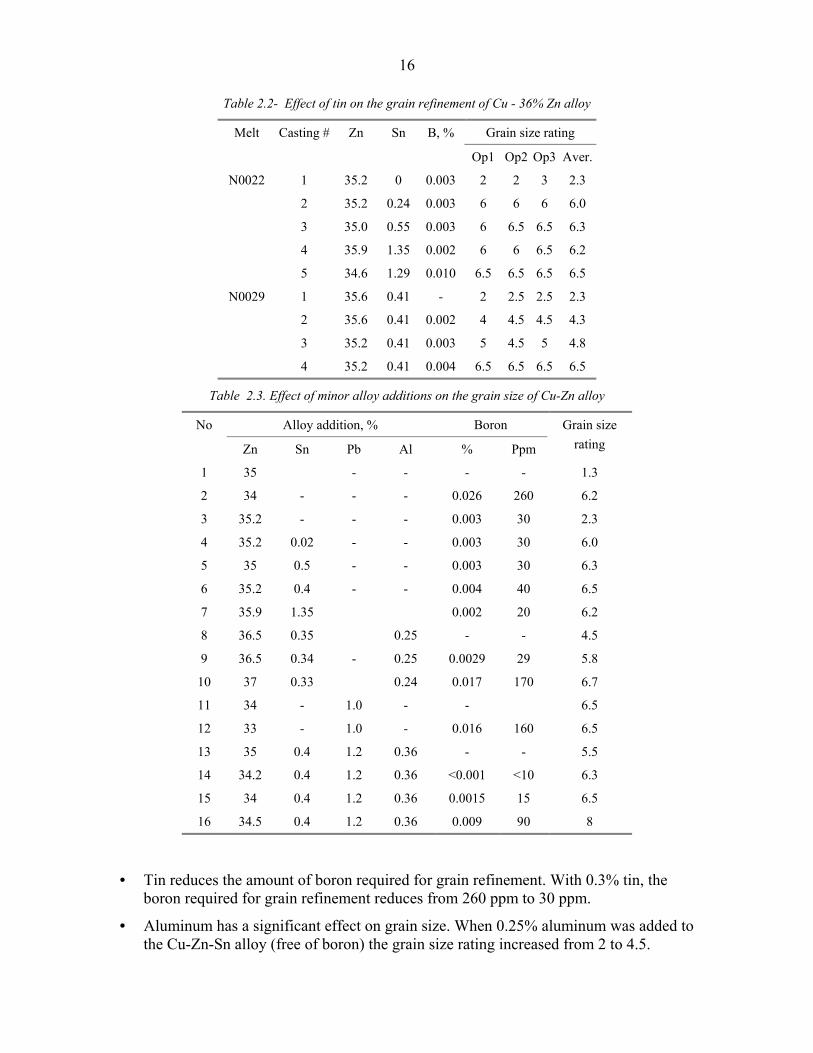
Table 2.2 presents the result of two melts carried out to confirm the above findings on the effect of tin. In the first melt (N0022) 30 ppm of born was added to the base alloy. Then 0.24% tin was added to the alloy. This resulted in a reduction of the grain size from a rating of 2.3 to 6.0 showing the effect of tin on grain refinement. The tin content was increased gradually in steps to 1.35% and the grain size varied between 6.2 and 6.5. In the second melt (N0029) 0.4% tin was added to the base alloy and the amount of boron was increased slowly. The fine grain size was achieved with only 40 ppm of boron. This grain size is equivalent to that of the base alloy with 260 ppm of boron.
Similar experiments were later conducted to study the effect of aluminum and lead on grain refinement. In some experiments the combinations of these three elements were also evaluated. The results are presented in Table 2.3. Observations are as follows:
16
Table 2.2- Effect of tin on the grain refinement of Cu - 36% Zn alloy
Grain size rating Melt Casting # Zn Sn B, %
Op1 Op2 Op3 Aver.
1 35.2 0 0.003 2 2 3 2.3
2 35.2 0.24 0.003 6 6 6 6.0
3 35.0 0.55 0.003 6 6.5 6.5 6.3
4 35.9 1.35 0.002 6 6 6.5 6.2
N0022
5 34.6 1.29 0.010 6.5 6.5 6.5 6.5
1 35.6 0.41 - 2 2.5 2.5 2.3
2 35.6 0.41 0.002 4 4.5 4.5 4.3
3 35.2 0.41 0.003 5 4.5 5 4.8
N0029
4 35.2 0.41 0.004 6.5 6.5 6.5 6.5
Table 2.3. Effect of minor alloy additions on the grain size of Cu-Zn alloy
Alloy addition, % Boron No
Zn Sn Pb Al % Ppm
Grain size rating
1 35 - - - - 1.3
2 34 - - - 0.026 260 6.2
3 35.2 - - - 0.003 30 2.3
4 35.2 0.02 - - 0.003 30 6.0
5 35 0.5 - - 0.003 30 6.3
6 35.2 0.4 - - 0.004 40 6.5
7 35.9 1.35 0.002 20 6.2
8 36.5 0.35 0.25 - - 4.5
9 36.5 0.34 - 0.25 0.0029 29 5.8
10 37 0.33 0.24 0.017 170 6.7
11 34 - 1.0 - - 6.5
12 33 - 1.0 - 0.016 160 6.5
13 35 0.4 1.2 0.36 - - 5.5
14 34.2 0.4 1.2 0.36 <0.001 <10 6.3
15 34 0.4 1.2 0.36 0.0015 15 6.5
16 34.5 0.4 1.2 0.36 0.009 90 8
• Tin reduces the amount of boron required for grain refinement. With 0.3% tin, the boron required for grain refinement reduces from 260 ppm to 30 ppm.
• Aluminum has a significant effect on grain size. When 0.25% aluminum was added to the Cu-Zn-Sn alloy (free of boron) the grain size rating increased from 2 to 4.5.

17
• Lead refines the structure quite effectively even before boron addition. The rating for the alloy with 1% lead is 6.5.
• The refinement of the alloy with all three elements could be achieved only with 10 ppm boron. The structure got finer as the boron content was increased from 10 ppm to 90 ppm and a rating of 8 could be achieved.
Bi/Se modified yellow brass
The effect of tin and aluminum was also investigated for the Bi/Se modified EnviroBrass III. Zirconium was used to refine this alloy and added as zirconium sponge. The results from this investigation are listed in Table 2.4. Initially, Bi and Se were added to Cu-Zn alloy to examine their effect on grain size. Presence of 0.5% nickel, specified for the alloy, will not have any impact on the grain size. Similar to the observations for lead in yellow brass, bismuth reduced the grain size of the base Cu-Zn alloy. Tin alone had no effect on grain refinement. However, it reduced the amount of zirconium required to grain refine the base alloy. Aluminum, on its own, had reduced the grain size of the base alloy. Similar to leaded yellow brass, EnviroBrass III with bismuth, tin and aluminum has a fine grain size even before the addition any grain refiner.
Table 2.4 - Effect of various minor alloy additions on the grain refinement of EnviroBrass III
Composition Zirconium No
Zn Bi Sn Al Others % Ppm
Grain size rating
1 35.3 - - - - - - 1.3
2 35.3 0.9 - - 0.6 Ni, 0.03 Se - - 4.3
3 35.3 0.9 - - 0.6 Ni, 0.03 Se 0.1 1000 7.0
4 35.1 0.9 0.2 - 0.6 Ni, 0.03 Se 0.03 300 7.0
5 34.1 0.9 0.55 - 0.6 Ni, 0.03 Se - - 4.2
6 34.2 0.9 0.55 0.5 0.6 Ni, 0.03 Se - - 6.3
7 34.1 0.9 0.55 0.5 0.6 Ni, 0.03 Se 0.03 300 6.8
Cooling Rate
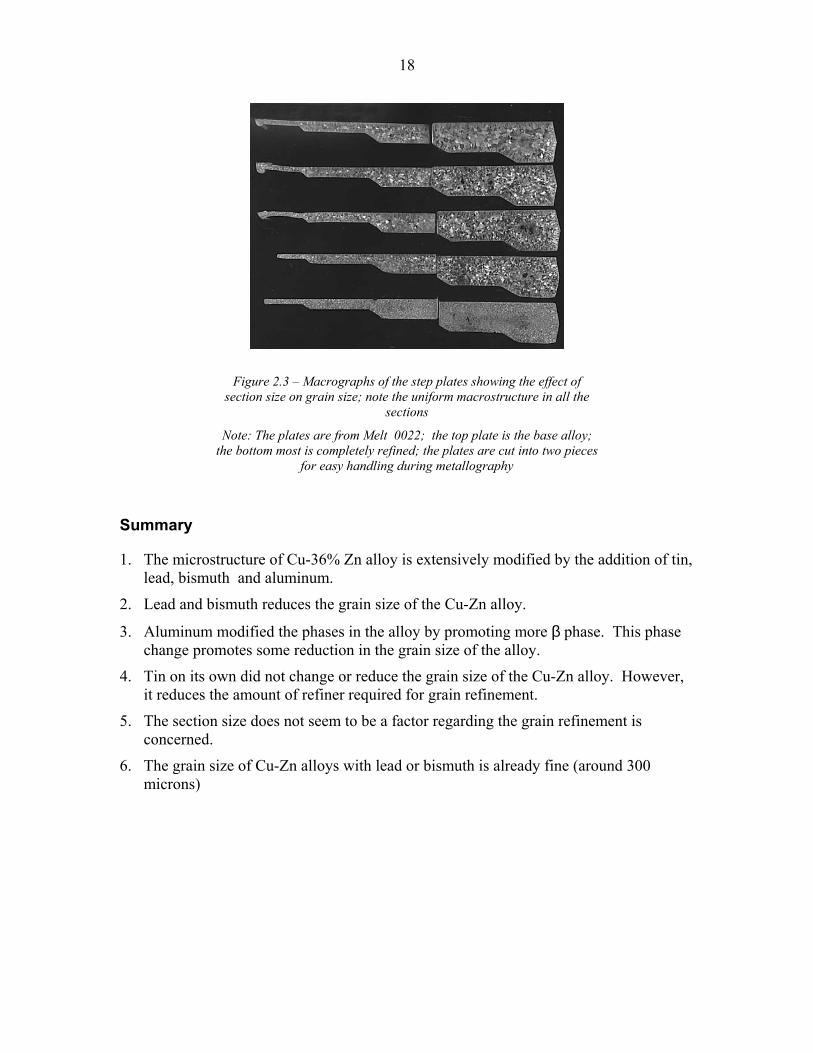
As mentioned earlier, the effect of cooling rate on the grain size and refinement was examined using the step plate mold. Typical macrostructures of the step plates are shown in figure 2.3. The step plates are sectioned in the middle. Half of the step plate was again cut into two pieces for handling purposes.
The steps in the casting undergo different cooling rates as the section sizes are different. It is evident from this photograph, the section size is not very much of a concern for grain refinement in permanent molds. The grain size is not varied even when the section sizes varied from 25 mm (1 in.) to 3 mm (0.125 in)
18
Figure 2.3 – Macrographs of the step plates showing the effect of section size on grain size; note the uniform macrostructure in all the
sections
Note: The plates are from Melt 0022; the top plate is the base alloy; the bottom most is completely refined; the plates are cut into two pieces
for easy handling during metallography
Summary
1. The microstructure of Cu-36% Zn alloy is extensively modified by the addition of tin, lead, bismuth and aluminum.
2. Lead and bismuth reduces the grain size of the Cu-Zn alloy.
3. Aluminum modified the phases in the alloy by promoting more β phase. This phase change promotes some reduction in the grain size of the alloy.
4. Tin on its own did not change or reduce the grain size of the Cu-Zn alloy. However, it reduces the amount of refiner required for grain refinement.
5. The section size does not seem to be a factor regarding the grain refinement is concerned.
6. The grain size of Cu-Zn alloys with lead or bismuth is already fine (around 300 microns)

19
SECTION 3
EFFECT OF GRAIN REFINERS
20
PART A – ALLOYS WITHOUT IRON
Introduction
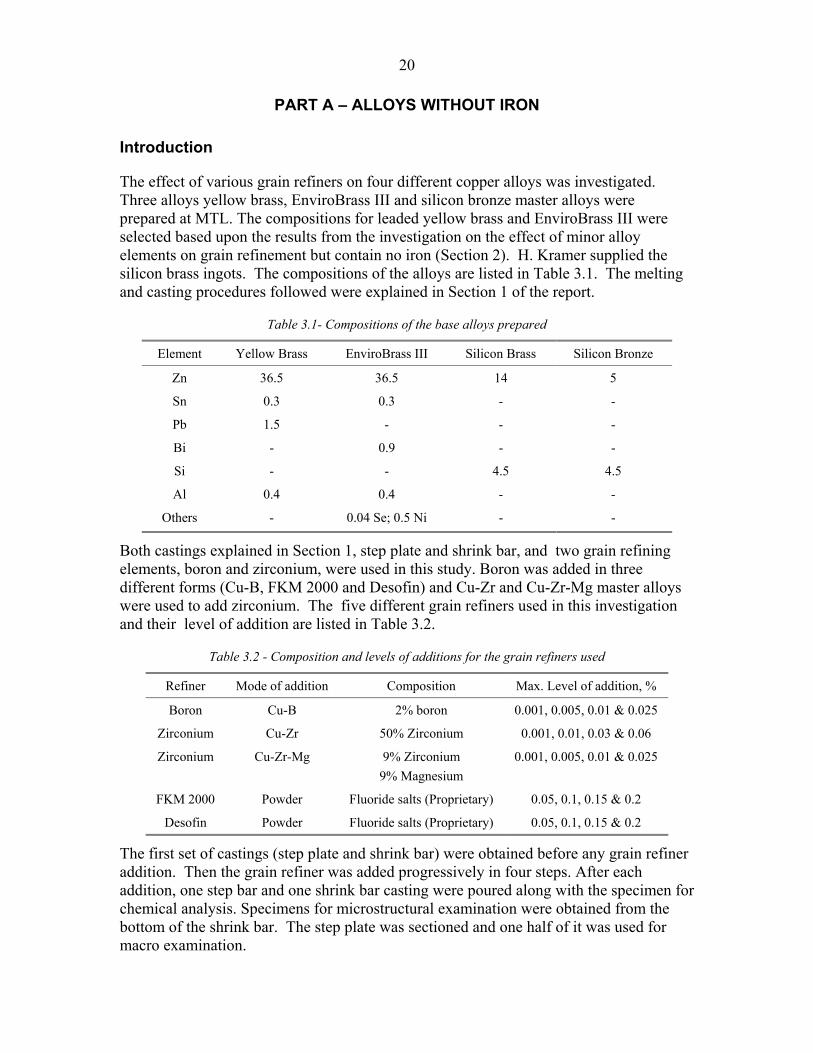
The effect of various grain refiners on four different copper alloys was investigated. Three alloys yellow brass, EnviroBrass III and silicon bronze master alloys were prepared at MTL. The compositions for leaded yellow brass and EnviroBrass III were selected based upon the results from the investigation on the effect of minor alloy elements on grain refinement but contain no iron (Section 2). H. Kramer supplied the silicon brass ingots. The compositions of the alloys are listed in Table 3.1. The melting and casting procedures followed were explained in Section 1 of the report.
Table 3.1- Compositions of the base alloys prepared
Element Yellow Brass EnviroBrass III Silicon Brass Silicon Bronze
Zn 36.5 36.5 14 5
Sn 0.3 0.3 - -
Pb 1.5 - - -
Bi - 0.9 - -
Si - - 4.5 4.5
Al 0.4 0.4 - -
Others - 0.04 Se; 0.5 Ni - -
Both castings explained in Section 1, step plate and shrink bar, and two grain refining elements, boron and zirconium, were used in this study. Boron was added in three different forms (Cu-B, FKM 2000 and Desofin) and Cu-Zr and Cu-Zr-Mg master alloys were used to add zirconium. The five different grain refiners used in this investigation and their level of addition are listed in Table 3.2.
Table 3.2 - Composition and levels of additions for the grain refiners used
Refiner Mode of addition Composition Max. Level of addition, %
Boron Cu-B 2% boron 0.001, 0.005, 0.01 & 0.025
Zirconium Cu-Zr 50% Zirconium 0.001, 0.01, 0.03 & 0.06
Zirconium Cu-Zr-Mg 9% Zirconium 9% Magnesium
0.001, 0.005, 0.01 & 0.025
FKM 2000 Powder Fluoride salts (Proprietary) 0.05, 0.1, 0.15 & 0.2
Desofin Powder Fluoride salts (Proprietary) 0.05, 0.1, 0.15 & 0.2
The first set of castings (step plate and shrink bar) were obtained before any grain refiner addition. Then the grain refiner was added progressively in four steps. After each addition, one step bar and one shrink bar casting were poured along with the specimen for chemical analysis. Specimens for microstructural examination were obtained from the bottom of the shrink bar. The step plate was sectioned and one half of it was used for macro examination.
21
Results and Discussion
Macrostructural Analysis
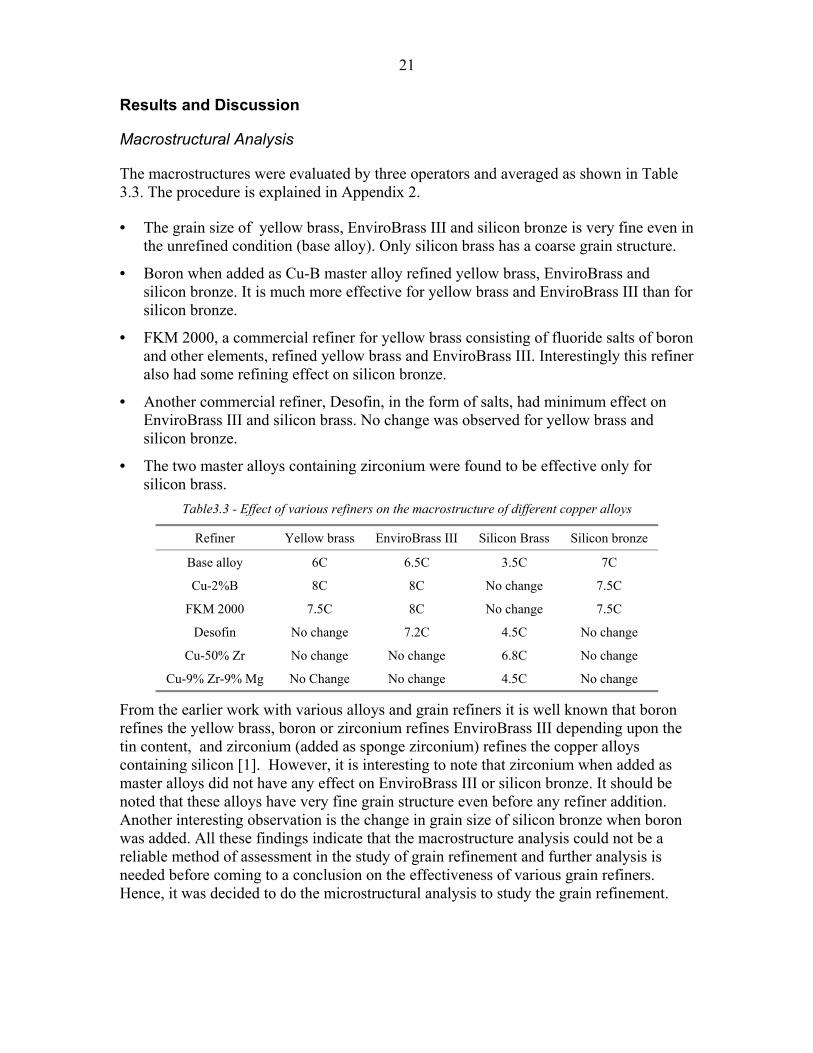
The macrostructures were evaluated by three operators and averaged as shown in Table 3.3. The procedure is explained in Appendix 2.
• The grain size of yellow brass, EnviroBrass III and silicon bronze is very fine even in the unrefined condition (base alloy). Only silicon brass has a coarse grain structure.
• Boron when added as Cu-B master alloy refined yellow brass, EnviroBrass and silicon bronze. It is much more effective for yellow brass and EnviroBrass III than for silicon bronze.
• FKM 2000, a commercial refiner for yellow brass consisting of fluoride salts of boron and other elements, refined yellow brass and EnviroBrass III. Interestingly this refiner also had some refining effect on silicon bronze.
• Another commercial refiner, Desofin, in the form of salts, had minimum effect on EnviroBrass III and silicon brass. No change was observed for yellow brass and silicon bronze.
• The two master alloys containing zirconium were found to be effective only for silicon brass.
Table3.3 - Effect of various refiners on the macrostructure of different copper alloys
Refiner Yellow brass EnviroBrass III Silicon Brass Silicon bronze
Base alloy 6C 6.5C 3.5C 7C
Cu-2%B 8C 8C No change 7.5C
FKM 2000 7.5C 8C No change 7.5C
Desofin No change 7.2C 4.5C No change
Cu-50% Zr No change No change 6.8C No change
Cu-9% Zr-9% Mg No Change No change 4.5C No change
From the earlier work with various alloys and grain refiners it is well known that boron refines the yellow brass, boron or zirconium refines EnviroBrass III depending upon the tin content, and zirconium (added as sponge zirconium) refines the copper alloys containing silicon [1]. However, it is interesting to note that zirconium when added as master alloys did not have any effect on EnviroBrass III or silicon bronze. It should be noted that these alloys have very fine grain structure even before any refiner addition. Another interesting observation is the change in grain size of silicon bronze when boron was added. All these findings indicate that the macrostructure analysis could not be a reliable method of assessment in the study of grain refinement and further analysis is needed before coming to a conclusion on the effectiveness of various grain refiners. Hence, it was decided to do the microstructural analysis to study the grain refinement.

22
Microstructural Analysis
The effect of zirconium addition on the macrostructure of leaded yellow brass, when added as Cu-9Zr-9Mg master alloy, is presented in Table 3.4. It should be noted that zirconium is reported as the level of addition. Also, the levels are cumulative, not absolute i.e., for the last casting (N1057-5) the addition is 0.006% making the total zirconium as 0.019%. The final residual zirconium will be lower than these values.
Table 3.4 - Grain size rating of yellow brass refined with zirconium
Specimen # N1057-1 N1057-2 N1057-3 N1057-4 N1057-5
Zr Content, % (addition) 0 0.004 0.008 0.013 0.019
Grain size rating 6C 5.7C 4C 5.8C 6.5C
As shown in this table, the macrostructure did not reveal significant increase in the grain rating indicating no grain refinement had been achieved with zirconium addition to yellow brass. As before, the microstructures of these alloys were analyzed (Figure 3.1).
a. Base alloy b. 0.004% Zr addition
c. 0.013% Zr addition d. 0.019% Zr addition
Figure 3.1 - Microstructures of zirconium added yellow brass

23
As it can be seen from the microstructures, the grain size of the yellow brass had been reduced even with 0.004% (40 ppm) of zirconium. This was not evident from the macrostructure. This aspect has not been reported earlier. Further analysis is required to confirm these results. However, the results from the preliminary evaluation of microstructures are listed in Table 3.5. The findings are as follows:
• Cu-B has refined yellow brass and EnviroBrass III. The microstructure of silicon brass and silicon bronze did not change with the addition of Cu-B.
• Zirconium refined all the four alloys, even though the relative effect varies with the type of alloy.
Table 3.5 - Grain refinement as evaluated by microstructure
Refiner Yellow brass EnviroBrass III Silicon Brass Silicon bronze
Cu-2%B Refined Refined Not refined Not refined
Cu-50% Zr Refined Refined Refined Refined
Cu-9% Zr-9% Mg Refined Refined Refined Refined
PART B - Cu-Zn ALLOYS WITH IRON
Introduction
The grain refinement of yellow brasses by boron was found to be inconsistent in the previous work. Also, the amount of boron required for refinement was found to be in a wide range than the industrially accepted value. The boron content required for effective refining was found to vary from 10 to 100 ppm whereas in industry anything more than 10 ppm of boron is not useful. However, the alloys used in the foundries contain at least 500 ppm (0.05%) iron.
In an earlier work (fading), it was observed that the grain refinement could not be revived successfully by using boron after it faded due to repeated melting [2]. This was not the case for zirconium, where it could be revived many times even though the effect lasted only few hours. Those experiments were conducted using alloys with very low levels of iron. Hence it will be interesting to evaluate the effect of iron on grain refinement in yellow brass.
Experimental Work
In this investigation, the effect of iron on the grain refinement was investigated. Only leaded yellow brass and EnviroBrass III were used in this experiment. Either FKM 2000 or Desofin was used as the grain refiner (Table 3.6). The experiments were conducted as follows:
• The alloy was melted and a sample was taken for analysis. This alloy was free of boron and very low iron (less than 50 ppm)
24
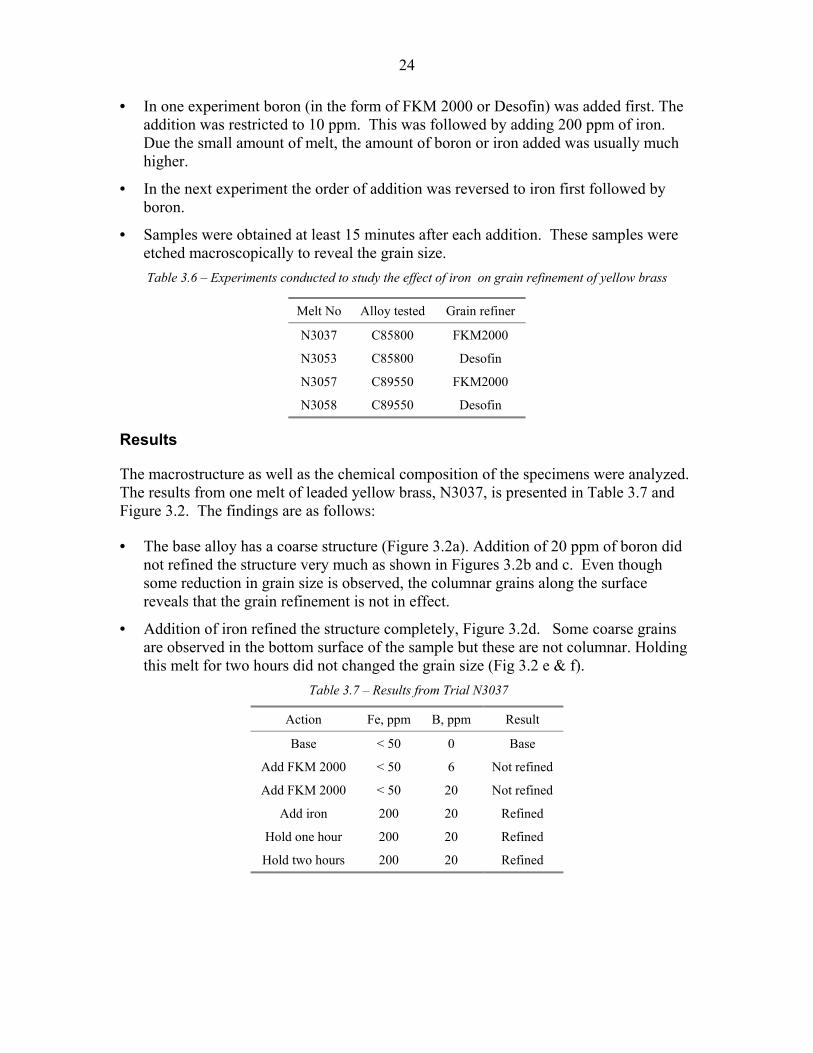
• In one experiment boron (in the form of FKM 2000 or Desofin) was added first. The addition was restricted to 10 ppm. This was followed by adding 200 ppm of iron. Due the small amount of melt, the amount of boron or iron added was usually much higher.
• In the next experiment the order of addition was reversed to iron first followed by boron.
• Samples were obtained at least 15 minutes after each addition. These samples were etched macroscopically to reveal the grain size. Table 3.6 – Experiments conducted to study the effect of iron on grain refinement of yellow brass
Melt No Alloy tested Grain refiner
N3037 C85800 FKM2000
N3053 C85800 Desofin
N3057 C89550 FKM2000
N3058 C89550 Desofin
Results
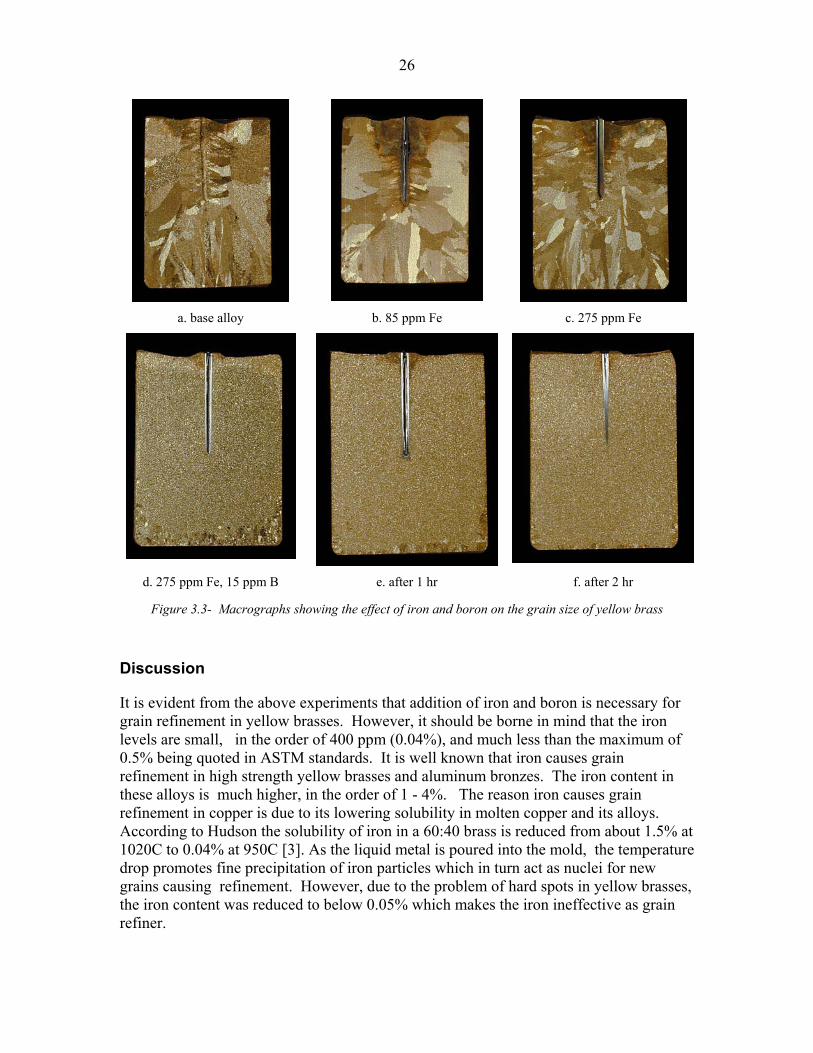
The macrostructure as well as the chemical composition of the specimens were analyzed. The results from one melt of leaded yellow brass, N3037, is presented in Table 3.7 and Figure 3.2. The findings are as follows:
• The base alloy has a coarse structure (Figure 3.2a). Addition of 20 ppm of boron did not refined the structure very much as shown in Figures 3.2b and c. Even though some reduction in grain size is observed, the columnar grains along the surface reveals that the grain refinement is not in effect.
• Addition of iron refined the structure completely, Figure 3.2d. Some coarse grains are observed in the bottom surface of the sample but these are not columnar. Holding this melt for two hours did not changed the grain size (Fig 3.2 e & f).
Table 3.7 – Results from Trial N3037
Action Fe, ppm B, ppm Result
Base < 50 0 Base
Add FKM 2000 < 50 6 Not refined
Add FKM 2000 < 50 20 Not refined
Add iron 200 20 Refined
Hold one hour 200 20 Refined
Hold two hours 200 20 Refined

25
a. base b. 6 ppm B c. 20 ppm B
d. 200 ppm Fe – 20 ppm B e. hold 1 hr f. hold 2 hr
Figure 3.2 - Macrographs showing the effect of boron and iron on the grain size of yellow brass
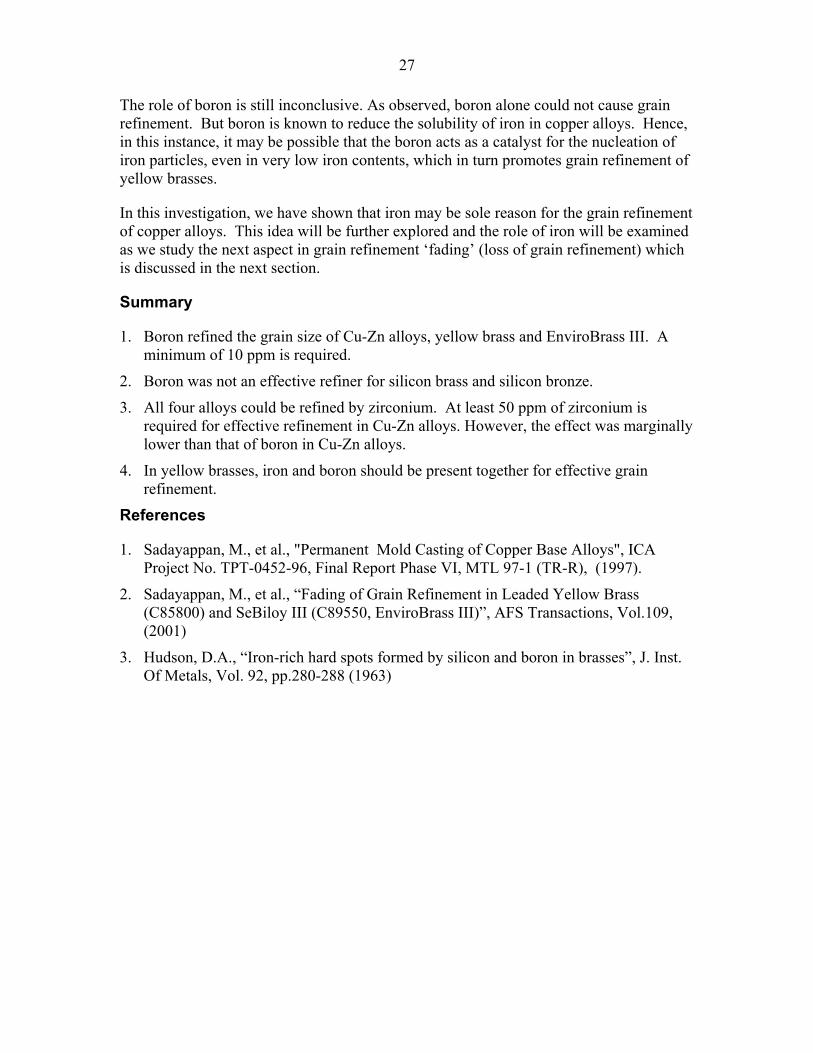
In the second melt, N3053, iron was added first followed by boron. The results are presented in Table 3.8 and the macrographs are shown in Figure 3.3. It is evident from these pictures that both elements, iron and boron, are necessary to obtain complete grain refinement in yellow brasses. The results are similar in case of EnviroBrass III (Melt N3057 and N3058).
Table 3.8 – Results from melt 3053 studying the effect on iron on grain refinement
Action Fe, ppm B, ppm Result
Base < 50 0 Base
Add iron 84 0 Not refined
Add iron 275 0 Not refined
Add FKM 2000 275 15 Refined
Hold one hour 250 15 Refined
Hold two hours 250 15 Refined
26
a. base alloy b. 85 ppm Fe c. 275 ppm Fe
d. 275 ppm Fe, 15 ppm B e. after 1 hr f. after 2 hr
Figure 3.3- Macrographs showing the effect of iron and boron on the grain size of yellow brass
Discussion
It is evident from the above experiments that addition of iron and boron is necessary for grain refinement in yellow brasses. However, it should be borne in mind that the iron levels are small, in the order of 400 ppm (0.04%), and much less than the maximum of 0.5% being quoted in ASTM standards. It is well known that iron causes grain refinement in high strength yellow brasses and aluminum bronzes. The iron content in these alloys is much higher, in the order of 1 - 4%. The reason iron causes grain refinement in copper is due to its lowering solubility in molten copper and its alloys. According to Hudson the solubility of iron in a 60:40 brass is reduced from about 1.5% at 1020C to 0.04% at 950C [3]. As the liquid metal is poured into the mold, the temperature drop promotes fine precipitation of iron particles which in turn act as nuclei for new grains causing refinement. However, due to the problem of hard spots in yellow brasses, the iron content was reduced to below 0.05% which makes the iron ineffective as grain refiner.
27
The role of boron is still inconclusive. As observed, boron alone could not cause grain refinement. But boron is known to reduce the solubility of iron in copper alloys. Hence, in this instance, it may be possible that the boron acts as a catalyst for the nucleation of iron particles, even in very low iron contents, which in turn promotes grain refinement of yellow brasses.
In this investigation, we have shown that iron may be sole reason for the grain refinement of copper alloys. This idea will be further explored and the role of iron will be examined as we study the next aspect in grain refinement ‘fading’ (loss of grain refinement) which is discussed in the next section.
Summary
1. Boron refined the grain size of Cu-Zn alloys, yellow brass and EnviroBrass III. A minimum of 10 ppm is required.
2. Boron was not an effective refiner for silicon brass and silicon bronze.
3. All four alloys could be refined by zirconium. At least 50 ppm of zirconium is required for effective refinement in Cu-Zn alloys. However, the effect was marginally lower than that of boron in Cu-Zn alloys.
4. In yellow brasses, iron and boron should be present together for effective grain refinement.
References
1. Sadayappan, M., et al., "Permanent Mold Casting of Copper Base Alloys", ICA Project No. TPT-0452-96, Final Report Phase VI, MTL 97-1 (TR-R), (1997).
2. Sadayappan, M., et al., “Fading of Grain Refinement in Leaded Yellow Brass (C85800) and SeBiloy III (C89550, EnviroBrass III)”, AFS Transactions, Vol.109, (2001)
3. Hudson, D.A., “Iron-rich hard spots formed by silicon and boron in brasses”, J. Inst. Of Metals, Vol. 92, pp.280-288 (1963)

28
SECTION 4
FADING
29
Introduction
The grain refiners, boron and zirconium, used in copper alloys are susceptible to oxidation and could be lost during holding or upon remelting. Induction furnaces with their stirring action will tend to increase such oxidation losses. This loss of the elements will reduce the effectiveness of grain refining, and is known as fading. In most foundries, pre-refined ingots are melted along with foundry returns. The latter can lower the level of grain refiner below a critical level. The critical levels of grain refiners required for refinement is not known for both boron and zirconium. Also, the ways to revive the grain refinement is not well defined in the literature.
In earlier work at CANMET-Materials Technology Laboratory, as part of another US Department of Energy –Cast Metals Coalition (US DOE-CMC) sponsored project, the fading in yellow brass refined by boron and EnviroBrass III refined with zirconium were investigated[1]. The findings were as follows:
Yellow Brass (C85800)
• Addition of only 100 ppm (0.01%) boron was sufficient to refine the grain size of yellow brass. The grain size of the grain-refined alloys was less than 0.01 mm.
• The grain refinement effect was not lost even after remelting 6 times or holding the melt 300 minutes in an induction furnace at a temperature of 1000oC (1830EF).
• After fading, the efforts to revive the grain refinement using boron were not effective.
• The mechanical properties of leaded yellow brass were not improved by grain refinement.
EnviroBrass III (C89550)
• The addition of 20 – 400 ppm (0.002-0.04%) zirconium refined the structure of EnviroBrass III. It also reduced the size of the columnar grains, particularly around the edge of the casting.
• About 50% of the zirconium was lost on melting or holding for an hour. Although the effect of zirconium fades, it could be recovered simply by adding zirconium.
• Pouring temperature of permanent mold cast products should be below 960oC (1760EF) to obtain the benefits of the grain refinement.
• The melting of a mix of returns and fresh ingot should not present a problem.
• The mechanical properties of SeBiLOY III were not improved by grain refining with zirconium.
The experiments were conducted in alloys free of iron to avoid the interaction in the above investigation. Iron is known to cause grain refinement on its own in high strength yellow brasses. The failure to revive the grain refinement after fading was found to be interesting as well the effect of pouring temperature in zirconium refined EnviroBrass III. In this investigation, it has been already proved that iron is the major source for grain refinement. In this section the role of iron in fading of grain refinement was examined.
30
As well the EnviroBrass III was also refined with boron so that it could be compared with leaded yellow brass. The study was extended to include grain refined silicon brass and silicon bronze with zirconium.
Experimental work
The base alloy compositions used in this work are given in Table 4.1. The procedure for producing these alloys are explained in Section 1.
Table 4.1 – Chemical composition of master alloys prepared for fading studies
Alloy Zn Sn Pb Si Other
Yellow brass 36 0 1.5 0.05% Fe
EnviroBrass III 36 0.3 0.9% Bi, 0.04% Se, 0.4%Al, 0.5%Ni
Silicon Brass 14 4.5
Silicon Bronze 5 4.5
These ingots were melted again in a push up type induction furnace using clay graphite crucible. The yellow brass and EnviroBrass III were grain refined with boron added as Cu-2% B master alloy. Zirconium was added as Cu-50% Zr master alloy to refine silicon brass and silicon bronze. The fading of grain refinement was evaluated as follows:
1. The base alloy was grain refined and held for an extended period of time.
2. Grain refined alloys were remelted and held for some time and cast into ingots. This procedure was repeated until the grain refinement was lost.
3. The grain refined charge was mixed with fresh unrefined ingots (80%, 65% and 50%) and the effect of mixing on the grain refinement was evaluated.
4. Once fading of grain refinement was observed, different concentrations of the grain refiner were added to determine the extent to which grain refinement could be revived.
In all of the above experiments, addition of Zn and Al was used to compensate for their loss during melting and holding. The actual additions were finalized based on the basis of previous melt analysis. Macro and micro structural analysis were carried out to evaluate the grain size.
Results and Discussion
Leaded Yellow Brass (C85800)
The grain refinement of yellow brass by boron and iron was found to be excellent and the effect did not fade for quite a long time. In this section results from two experiments, each containing two melts, which were carried out to explore the effects of holding time, remelting, charge-mix and revival of grain refinement when the alloy was refined with Cu-2% B master alloy are presented.
31
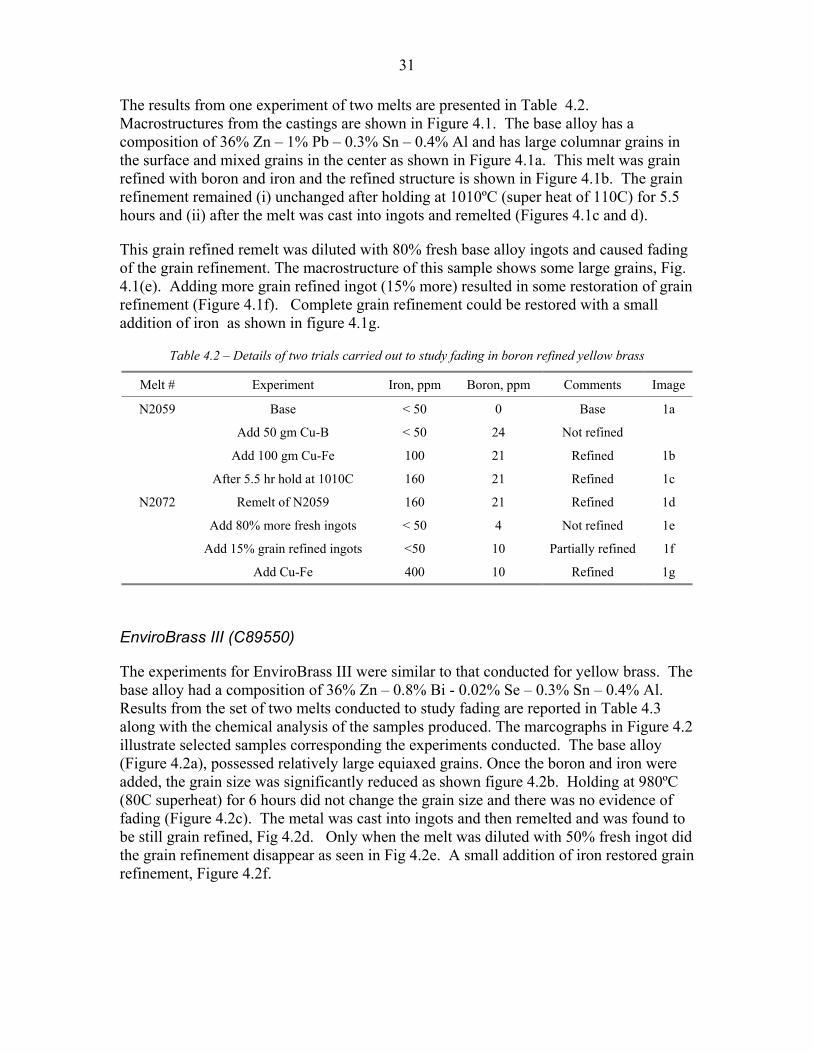
The results from one experiment of two melts are presented in Table 4.2. Macrostructures from the castings are shown in Figure 4.1. The base alloy has a composition of 36% Zn – 1% Pb – 0.3% Sn – 0.4% Al and has large columnar grains in the surface and mixed grains in the center as shown in Figure 4.1a. This melt was grain refined with boron and iron and the refined structure is shown in Figure 4.1b. The grain refinement remained (i) unchanged after holding at 1010ºC (super heat of 110C) for 5.5 hours and (ii) after the melt was cast into ingots and remelted (Figures 4.1c and d).
This grain refined remelt was diluted with 80% fresh base alloy ingots and caused fading of the grain refinement. The macrostructure of this sample shows some large grains, Fig. 4.1(e). Adding more grain refined ingot (15% more) resulted in some restoration of grain refinement (Figure 4.1f). Complete grain refinement could be restored with a small addition of iron as shown in figure 4.1g.
Table 4.2 – Details of two trials carried out to study fading in boron refined yellow brass
Melt # Experiment Iron, ppm Boron, ppm Comments Image
N2059 Base < 50 0 Base 1a
Add 50 gm Cu-B < 50 24 Not refined
Add 100 gm Cu-Fe 100 21 Refined 1b
After 5.5 hr hold at 1010C 160 21 Refined 1c
N2072 Remelt of N2059 160 21 Refined 1d
Add 80% more fresh ingots < 50 4 Not refined 1e
Add 15% grain refined ingots <50 10 Partially refined 1f
Add Cu-Fe 400 10 Refined 1g
EnviroBrass III (C89550)
The experiments for EnviroBrass III were similar to that conducted for yellow brass. The base alloy had a composition of 36% Zn – 0.8% Bi - 0.02% Se – 0.3% Sn – 0.4% Al. Results from the set of two melts conducted to study fading are reported in Table 4.3 along with the chemical analysis of the samples produced. The marcographs in Figure 4.2 illustrate selected samples corresponding the experiments conducted. The base alloy (Figure 4.2a), possessed relatively large equiaxed grains. Once the boron and iron were added, the grain size was significantly reduced as shown figure 4.2b. Holding at 980ºC (80C superheat) for 6 hours did not change the grain size and there was no evidence of fading (Figure 4.2c). The metal was cast into ingots and then remelted and was found to be still grain refined, Fig 4.2d. Only when the melt was diluted with 50% fresh ingot did the grain refinement disappear as seen in Fig 4.2e. A small addition of iron restored grain refinement, Figure 4.2f.
32
a. Base alloy b. Grain refined c. After 5.5hr holding
d. Remelted e. After adding 80% fresh ingots
f. After adding 15% grain refined ingots
g. Grain refined (Fe addition)
Fig.4.1-. Macrographs of Yellow Brass alloy C85800, 1X.
Copper-Silicon alloys
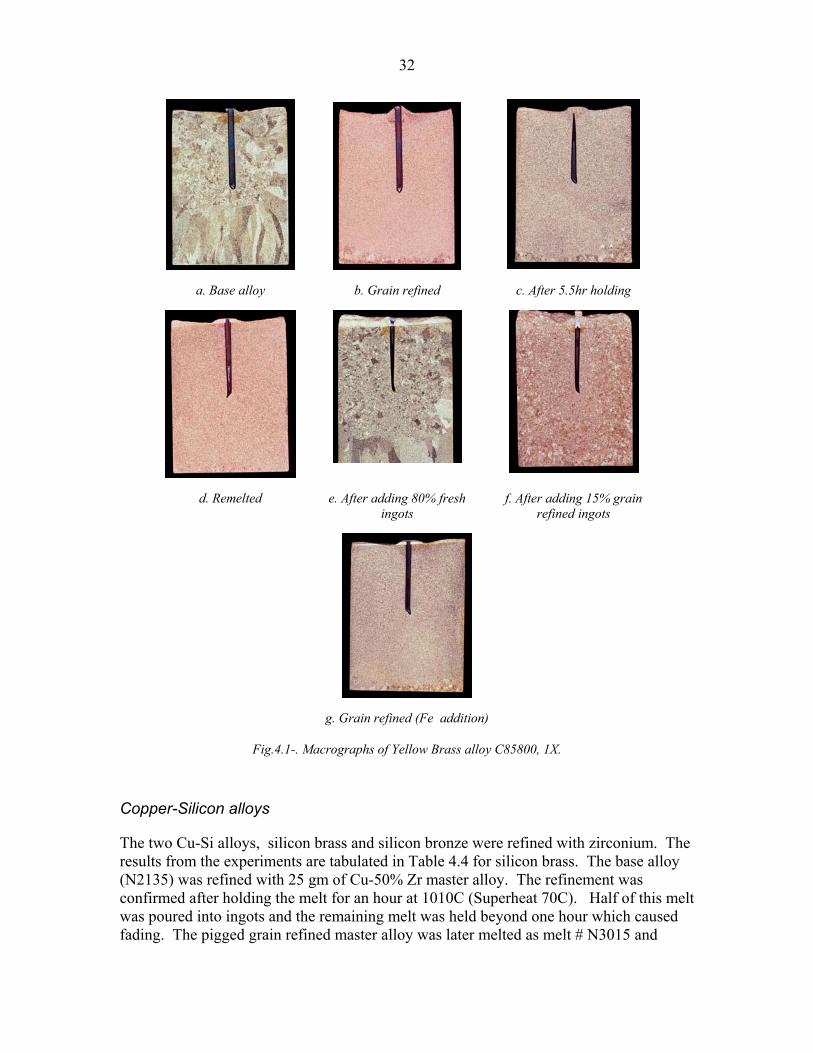
The two Cu-Si alloys, silicon brass and silicon bronze were refined with zirconium. The results from the experiments are tabulated in Table 4.4 for silicon brass. The base alloy (N2135) was refined with 25 gm of Cu-50% Zr master alloy. The refinement was confirmed after holding the melt for an hour at 1010C (Superheat 70C). Half of this melt was poured into ingots and the remaining melt was held beyond one hour which caused fading. The pigged grain refined master alloy was later melted as melt # N3015 and

33
found to be refined just after melting. This charge was diluted with 50% of fresh ingots resulting in fading of the grain refinement The refinement could be revived by adding extra Cu-Zr master alloy. The findings were similar in case of the silicon bronze alloy.
Table 4.3 – Details of trials carried out to study fading in boron refined EnviroBrass III
Melt # Experiment Iron, ppm Boron, ppm Comments Image
N2050 Base < 50 0 Base 2a
Add 50 gm Cu-B < 50 32 Not refined
Add 100 gm Cu-Fe 130 36 Refined 2b
After 6 hr hold at 1010C 130 35 Refined 2c
N2078 Remelt of N2050 100 28 Refined 2d
Add 50% fresh ingots < 50 8 Not refined 2e
Add 15% grain refined ingots <50 8 Partially refined
Add Cu-Fe 150 8 Refined 2f
a. Base b. Grain Refined c. After holding for 6h
d. Remelt of sample c e. After adding 50% more fresh unrefined charge
f. After addition of Fe
Fig.4.2- Macrographs of EnviroBrass III alloy C89550, 1X.

34
Table4.4 – Details of trials carried out to study fading in silicon brass refined with zirconium
Melt # Experiment Zirconium, ppm Comments
N2135 Base (60 kg melt) 0 Base
Add 25 gm Cu - Zr 207 refined
After 1 hr hold at 1010C - Refined
N3015 Remelt of N2135 166 Refined
Add 50% fresh ingots 64 Not refined
Add Cu-Zr 117 Refined
After 1 hr holding 91 Not Refined
Discussion
The results presented in previous sections and from earlier work [1] indicate that there is a minimum level of grain refining elements required to obtain fine grains. The Cu-Zn alloys (yellow brass and EnviroBrass III) need at least 50 ppm of iron and 3 ppm of boron. Similarly, Cu-Si alloys require 100 ppm of zirconium.
Grain refinement caused by the addition of boron, iron or zirconium is bound to fade away due to long holding of the melt, remelting of ingots or addition of unrefined metal to the refined melt and so on. The major cause of this is the oxidation of the elements at high temperatures. In this investigation efforts were made to understand the mechanism of fading and ways to revive the refinement after fading.
The fading trials indicated that the loss due to oxidation is very slow in case of Cu-Zn alloys. The melts could be held for nearly 6 hours or remelted a few times before losing the grain refinement. The grain refinement could be lost when adding fresh ingots to grain refined melts, but only when the residual iron limit fell below the minimum required level. The refinement could be successfully revived by the addition of iron. In this investigation, boron content was found to be more than adequate all the time.
In the case of Cu-Si alloys the trend is similar as long as the zirconium content remains higher than the minimum required. However, the oxidation loss of zirconium is much faster and the refinement fades away in just one hour of holding. The refinement could be revived by adding more zirconium.
The fading behaviour of yellow brass melts refined with boron was assessed in two foundries. The melts could be remelted or held for long periods, up to 100 hours, before any perceptible loss of grain refinement. Both foundries were operating with iron levels higher than 50 ppm and boron content between 3 and 5 ppm. The detailed report is presented in Section 8.
35
Conclusions
1. Fading occurred when the level of refining elements fell below the critical limits due to oxidation or melting losses. The limits are as follows:
In yellow brasses, at least 3 ppm of boron and 50 ppm of iron should be present.
In Cu-Si alloys the limit for zirconium was found to be 100 ppm.
2. In yellow brasses the loss of elements is slow and fading did not occur for over 100 hours of holding or repeated melting for at least six times.
3. The loss of zirconium in Cu-Si alloys was rapid and the grain refinement was lost only after holding for one hour.
4. In all the alloys investigated the refinement could be revived by adding the appropriate element, either boron or iron for yellow brasses and zirconium for Cu-Si alloys.
References
1. Sadayappan, M., et al., “Fading of Grain Refinement in Leaded Yellow Brass (C85800) and SeBiloy III (C89550, EnviroBrass III)”, AFS Transactions, Vol.109, (2001)

36
SECTION 5
THERMAL ANALYSIS
37
Introduction
The basis of thermal analysis is to detect various reactions such as phase transformations, precipitation etc., by identifying corresponding thermal arrests in the cooling curves. Even though this technique is widely used for aluminum alloys and cast irons, very limited work has been published for copper alloys.
There have been numerous publications on thermal analysis to study the solidification of aluminum casting alloys [1,2]. Previous work using thermal analysis techniques on copper alloys mostly focused on using it as a tool to predict mechanical properties [3] and phases present [4]. This aspect of the project was initiated because there is no testing method to predict grain refinement for copper base alloys. The inability to do so leads to rejection of components, sometimes after costly machining, polishing and plating operations.
Background
Two separate events, nucleation and growth, mark the solidification of any metal. The nucleation needs a driving force that has to be supplied to the system. In a regular melt, the driving force for nucleation is obtained through undercooling. If one records the temperature of the solidifying melt, the temperature of the melt will momentarily dip below the liquidus temperature and rise back to the equilibrium temperature. This process known as undercooling is very small, normally 3-4ºC for aluminum alloys and <1ºC for copper alloys [5]. Once some nuclei are generated they start to grow as independent grains. The heat released during the growth phase, due to the release of latent heat of fusion, increases the temperature of the remaining melt to the equilibrium growth temperature. This is a reaction known as recalescence. After this, regular growth phase of the melt will continue but no new nuclei will form due to undercooling. It is possible for other mechanisms, such as dendrite breaking, constitutional supercooling etc., to be in force for nucleating new grains during solidification. However, these reactions cannot be recorded through time-temperature curves. The purpose of grain refinement is to introduce nuclei intentionally in the liquid metal. So when the grain refining addition is made, the undercooling is not observed as the nuclei will start to grow as the growth temperature is reached. Similarly the recalescence will be absent.
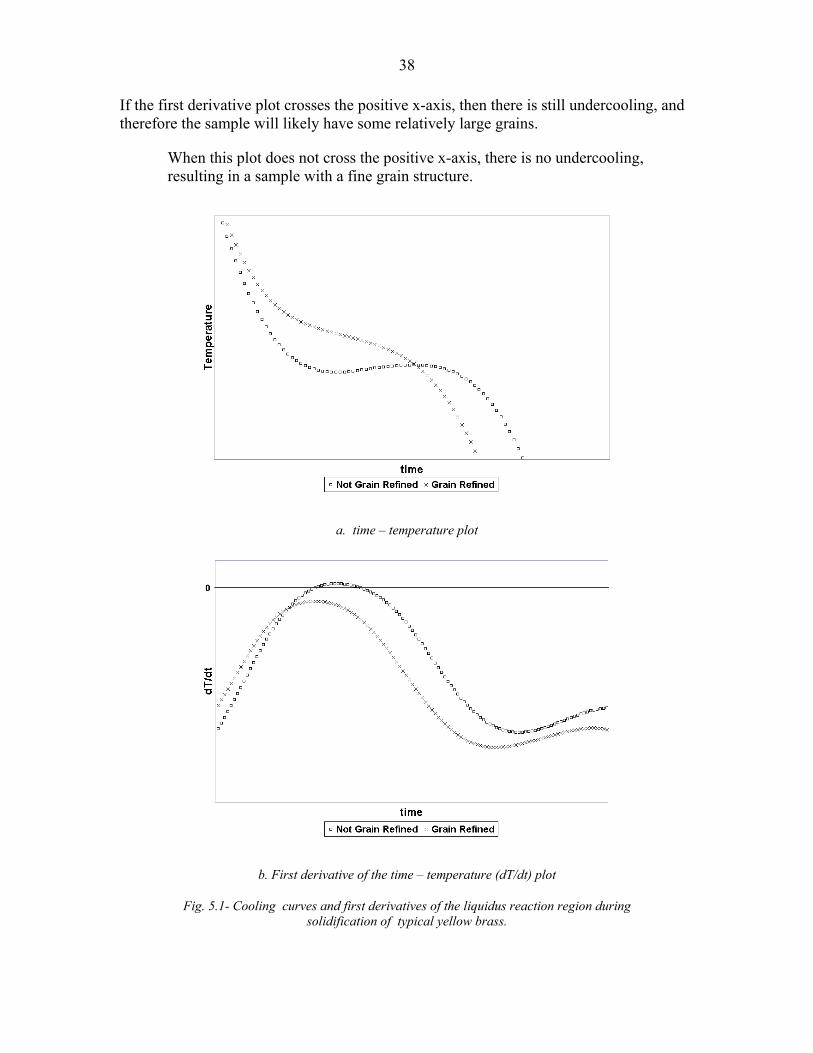
Observing the liquidus reaction in the time-temperature plot during solidification can indicate whether the addition is effective in providing nuclei for grain refinement. Two time-temperature (T-t) curves are shown in Fig. 5.1 illustrating the liquidus reaction of two yellow brass melts, one has refiner addition and other does not have any addition. Figure 5.1a shows T-t curves and Figure 5.1b illustrates the first derivative (dT/dt) plots for a typical yellow brass where T is temperature and t is cooling time. In some instances, it will be very difficult to identify the undercooling in copper alloys since it is very small (<1C). The first derivatives could identify the undercooling much more clearly as shown in Figure 5.1b. The analysis is as follows and in this investigation this interpretation will be used as the indicator of full refinement:
38
If the first derivative plot crosses the positive x-axis, then there is still undercooling, and therefore the sample will likely have some relatively large grains.
When this plot does not cross the positive x-axis, there is no undercooling, resulting in a sample with a fine grain structure.
a. time – temperature plot
b. First derivative of the time – temperature (dT/dt) plot
Fig. 5.1- Cooling curves and first derivatives of the liquidus reaction region during solidification of typical yellow brass.
39
Experimental
The thermal analysis experiments were carried out as part of the grain refinement studies. Cooling curves were recorded after each addition in all the experiments explained in previous sections. To record the cooling curves, a dedicated thermal analysis equipment was purchased from Foundry Information Systems. The hardware used is the same as that used for their aluminum version of Meltlab. The procedure, in general, is as follows:
• A small amount of liquid metal is obtained from the melt in a container; this container is usually dipped inside the melt, heated and the metal is scooped from well below the melt surface
• The container is placed in a stand and a sheathed thermocouple is placed in the metal. The thermocouple will be usually located in the center of the metal sample.
• The cooling curve is recorded using the dedicated data-logging and analysis software.
• The continuous cooling curve is monitored on a screen. The lack of undercooling will be taken as the indication of grain refinement.
The initial experiments were carried out using the standard cup, recommended by the supplier, used for the aluminum alloys. Later, experiments were conducted to standardize and optimize the test set-up as the results from the steel cup were not consistent. These experiments mainly involved in finding an appropriate test cup. The major concern was to obtain a solidification which is directional and leaves no shrinkage around the thermocouple. Several geometries and test procedures were tried to achieve these objectives.
Results
Process Optimization
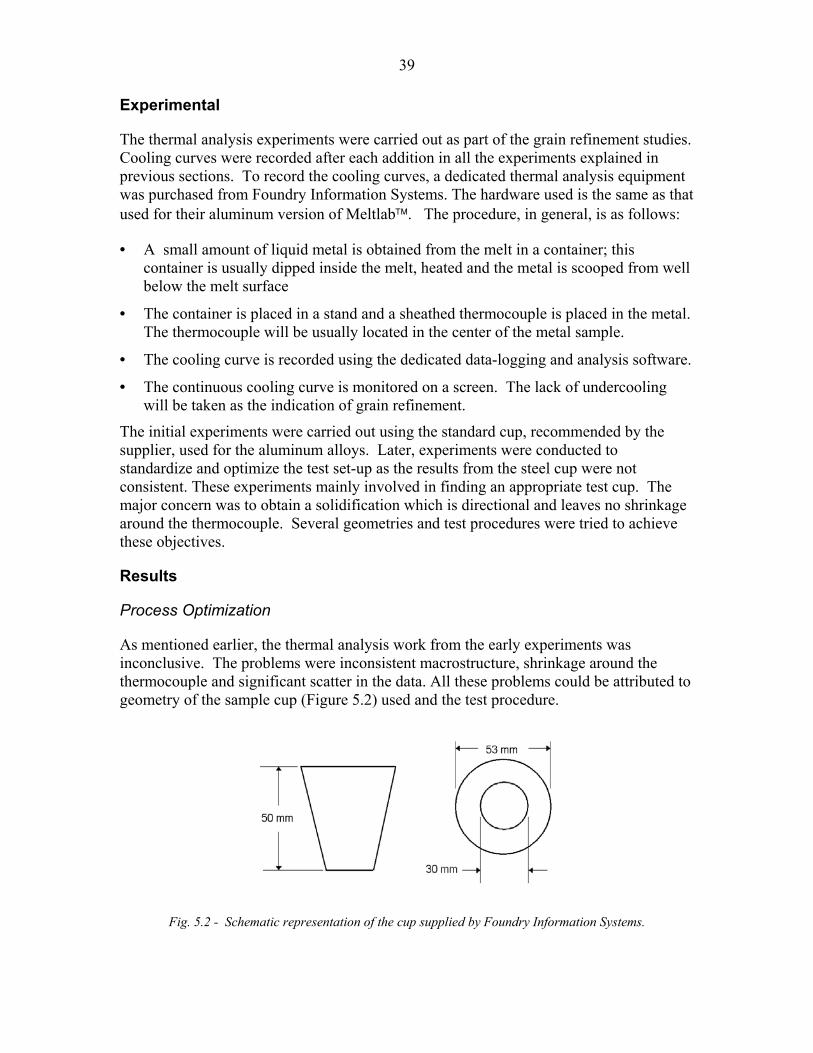
As mentioned earlier, the thermal analysis work from the early experiments was inconclusive. The problems were inconsistent macrostructure, shrinkage around the thermocouple and significant scatter in the data. All these problems could be attributed to geometry of the sample cup (Figure 5.2) used and the test procedure.
Fig. 5.2 - Schematic representation of the cup supplied by Foundry Information Systems.
40
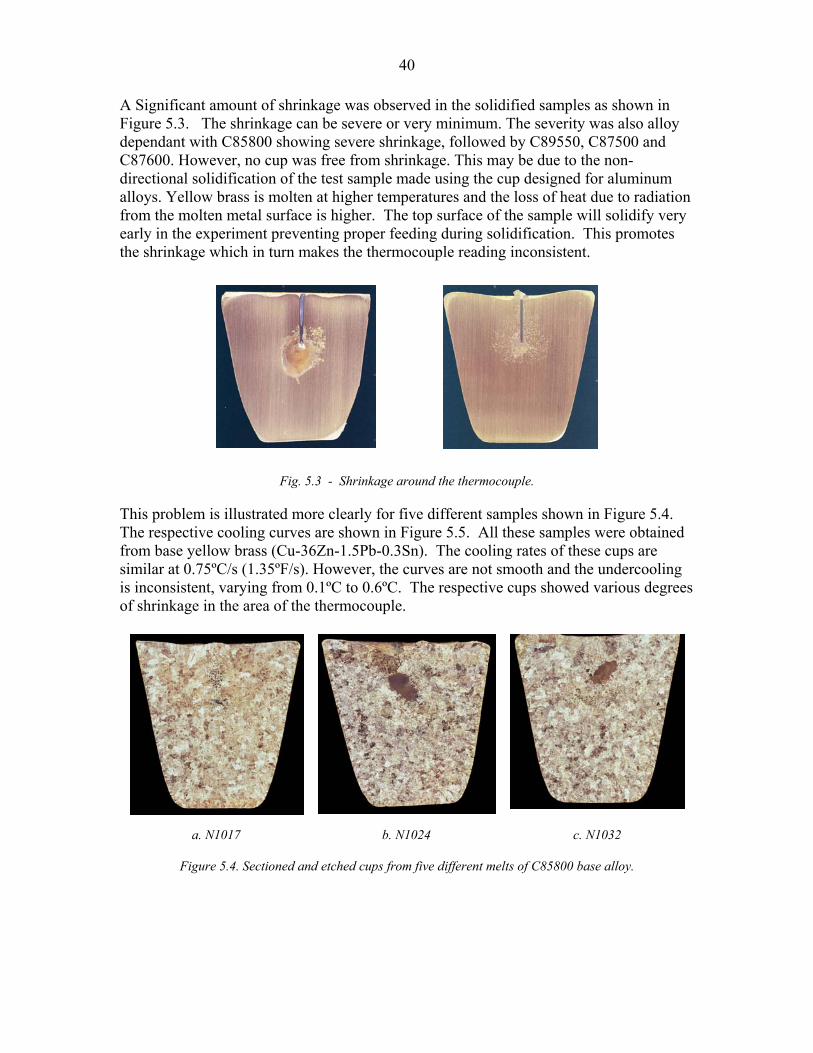
A Significant amount of shrinkage was observed in the solidified samples as shown in Figure 5.3. The shrinkage can be severe or very minimum. The severity was also alloy dependant with C85800 showing severe shrinkage, followed by C89550, C87500 and C87600. However, no cup was free from shrinkage. This may be due to the non-directional solidification of the test sample made using the cup designed for aluminum alloys. Yellow brass is molten at higher temperatures and the loss of heat due to radiation from the molten metal surface is higher. The top surface of the sample will solidify very early in the experiment preventing proper feeding during solidification. This promotes the shrinkage which in turn makes the thermocouple reading inconsistent.
Fig. 5.3 - Shrinkage around the thermocouple.
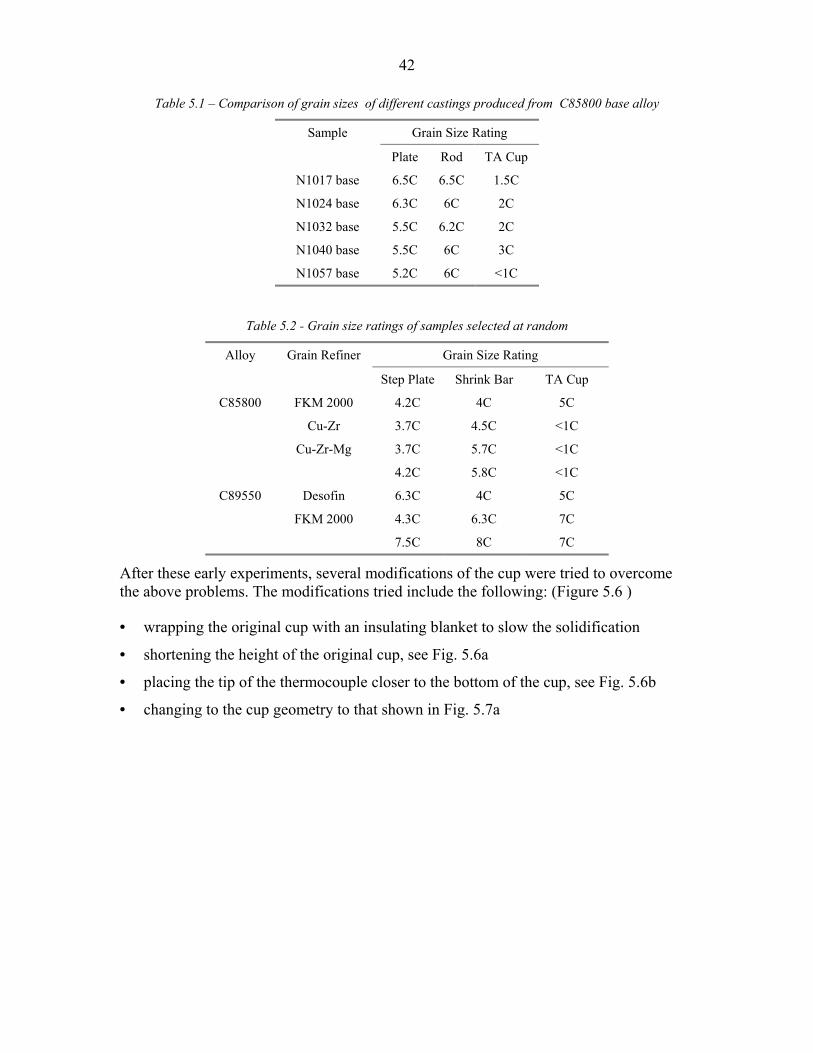
This problem is illustrated more clearly for five different samples shown in Figure 5.4. The respective cooling curves are shown in Figure 5.5. All these samples were obtained from base yellow brass (Cu-36Zn-1.5Pb-0.3Sn). The cooling rates of these cups are similar at 0.75ºC/s (1.35ºF/s). However, the curves are not smooth and the undercooling is inconsistent, varying from 0.1ºC to 0.6ºC. The respective cups showed various degrees of shrinkage in the area of the thermocouple.
a. N1017 b. N1024 c. N1032
Figure 5.4. Sectioned and etched cups from five different melts of C85800 base alloy.

41
d. N1040 e. N1057
Fig. 5.4 - Contd.
Fig.5.5 - Cooling curves from the C85800 base alloys showing the scatter in the data.
Another issue was that there was no correlation between the grain sizes observed in test castings and those obtained from the cups used in thermal analysis. Table 5.1 shows the grain size measurement from the five samples shown in Figure 5.4. The readings from the two other test castings, plate and shrink bar, are also shown for comparison. The grain size, measured in the cups is much larger than those from the test castings. This problem was observed even for grain refined samples. Table 5.2 shows the grain size data from samples selected at random from some grain refined alloys.
42
Table 5.1 – Comparison of grain sizes of different castings produced from C85800 base alloy
Grain Size Rating Sample
Plate Rod TA Cup
N1017 base 6.5C 6.5C 1.5C
N1024 base 6.3C 6C 2C
N1032 base 5.5C 6.2C 2C
N1040 base 5.5C 6C 3C
N1057 base 5.2C 6C <1C
Table 5.2 - Grain size ratings of samples selected at random
Grain Size Rating Alloy Grain Refiner
Step Plate Shrink Bar TA Cup
FKM 2000 4.2C 4C 5C
Cu-Zr 3.7C 4.5C <1C
3.7C 5.7C <1C
C85800
Cu-Zr-Mg
4.2C 5.8C <1C
Desofin 6.3C 4C 5C
4.3C 6.3C 7C
C89550
FKM 2000
7.5C 8C 7C
After these early experiments, several modifications of the cup were tried to overcome the above problems. The modifications tried include the following: (Figure 5.6 )
• wrapping the original cup with an insulating blanket to slow the solidification
• shortening the height of the original cup, see Fig. 5.6a
• placing the tip of the thermocouple closer to the bottom of the cup, see Fig. 5.6b
• changing to the cup geometry to that shown in Fig. 5.7a
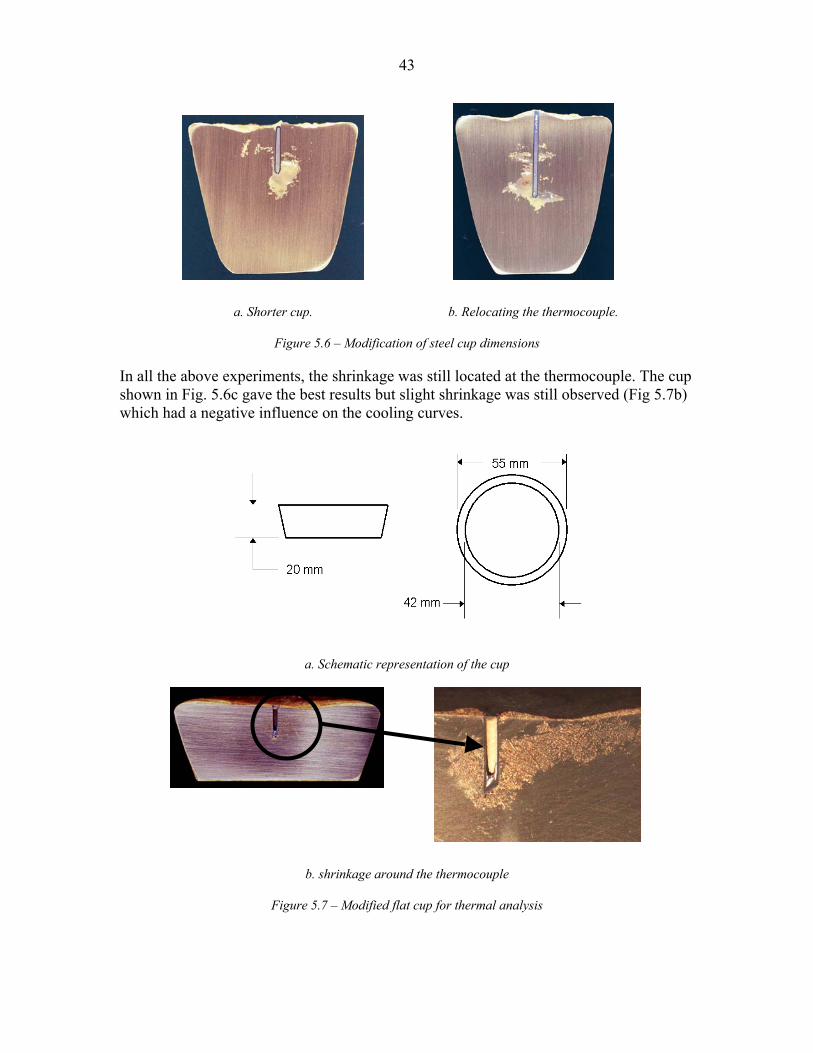
43
a. Shorter cup. b. Relocating the thermocouple.
Figure 5.6 – Modification of steel cup dimensions
In all the above experiments, the shrinkage was still located at the thermocouple. The cup shown in Fig. 5.6c gave the best results but slight shrinkage was still observed (Fig 5.7b) which had a negative influence on the cooling curves.
a. Schematic representation of the cup
b. shrinkage around the thermocouple
Figure 5.7 – Modified flat cup for thermal analysis
44
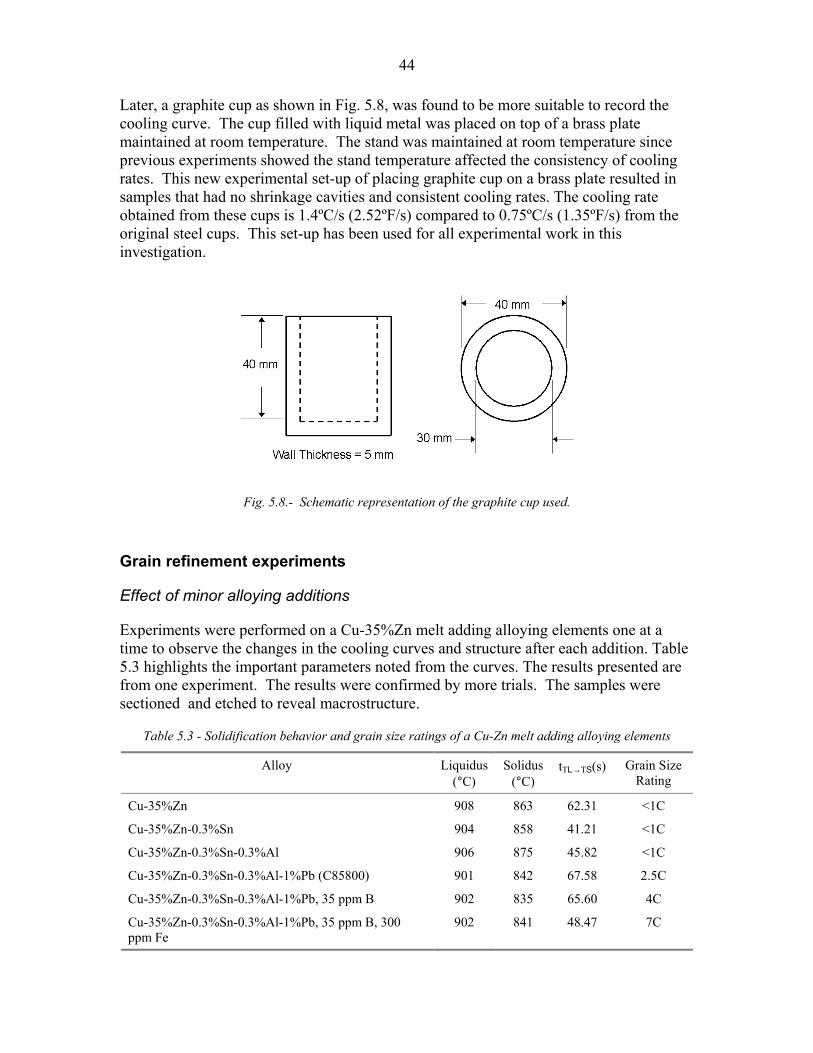
Later, a graphite cup as shown in Fig. 5.8, was found to be more suitable to record the cooling curve. The cup filled with liquid metal was placed on top of a brass plate maintained at room temperature. The stand was maintained at room temperature since previous experiments showed the stand temperature affected the consistency of cooling rates. This new experimental set-up of placing graphite cup on a brass plate resulted in samples that had no shrinkage cavities and consistent cooling rates. The cooling rate obtained from these cups is 1.4ºC/s (2.52ºF/s) compared to 0.75ºC/s (1.35ºF/s) from the original steel cups. This set-up has been used for all experimental work in this investigation.
Fig. 5.8.- Schematic representation of the graphite cup used.
Grain refinement experiments
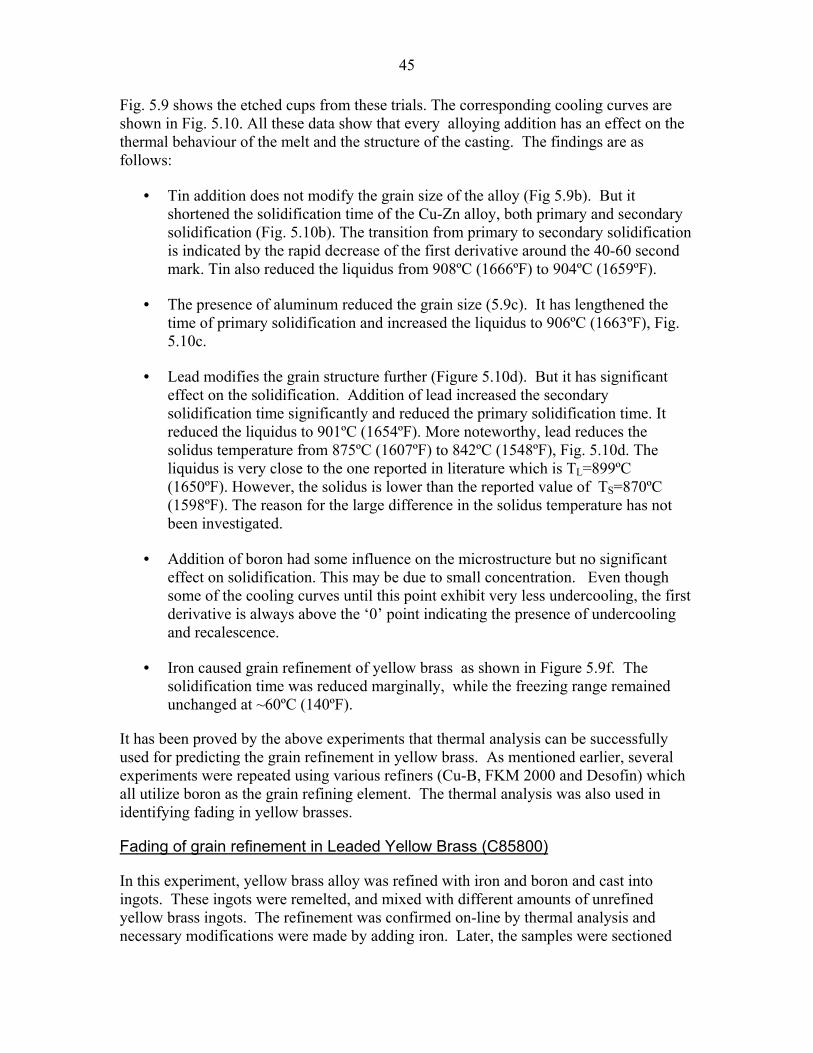
Effect of minor alloying additions
Experiments were performed on a Cu-35%Zn melt adding alloying elements one at a time to observe the changes in the cooling curves and structure after each addition. Table 5.3 highlights the important parameters noted from the curves. The results presented are from one experiment. The results were confirmed by more trials. The samples were sectioned and etched to reveal macrostructure.
Table 5.3 - Solidification behavior and grain size ratings of a Cu-Zn melt adding alloying elements
Alloy Liquidus (°C)
Solidus (°C)
tTL→TS(s) Grain Size Rating
Cu-35%Zn 908 863 62.31 <1C
Cu-35%Zn-0.3%Sn 904 858 41.21 <1C
Cu-35%Zn-0.3%Sn-0.3%Al 906 875 45.82 <1C
Cu-35%Zn-0.3%Sn-0.3%Al-1%Pb (C85800) 901 842 67.58 2.5C
Cu-35%Zn-0.3%Sn-0.3%Al-1%Pb, 35 ppm B 902 835 65.60 4C
Cu-35%Zn-0.3%Sn-0.3%Al-1%Pb, 35 ppm B, 300 ppm Fe
902 841 48.47 7C
45
Fig. 5.9 shows the etched cups from these trials. The corresponding cooling curves are shown in Fig. 5.10. All these data show that every alloying addition has an effect on the thermal behaviour of the melt and the structure of the casting. The findings are as follows:
• Tin addition does not modify the grain size of the alloy (Fig 5.9b). But it shortened the solidification time of the Cu-Zn alloy, both primary and secondary solidification (Fig. 5.10b). The transition from primary to secondary solidification is indicated by the rapid decrease of the first derivative around the 40-60 second mark. Tin also reduced the liquidus from 908ºC (1666ºF) to 904ºC (1659ºF).
• The presence of aluminum reduced the grain size (5.9c). It has lengthened the time of primary solidification and increased the liquidus to 906ºC (1663ºF), Fig. 5.10c.
• Lead modifies the grain structure further (Figure 5.10d). But it has significant effect on the solidification. Addition of lead increased the secondary solidification time significantly and reduced the primary solidification time. It reduced the liquidus to 901ºC (1654ºF). More noteworthy, lead reduces the solidus temperature from 875ºC (1607ºF) to 842ºC (1548ºF), Fig. 5.10d. The liquidus is very close to the one reported in literature which is TL=899ºC (1650ºF). However, the solidus is lower than the reported value of TS=870ºC (1598ºF). The reason for the large difference in the solidus temperature has not been investigated.
• Addition of boron had some influence on the microstructure but no significant effect on solidification. This may be due to small concentration. Even though some of the cooling curves until this point exhibit very less undercooling, the first derivative is always above the ‘0’ point indicating the presence of undercooling and recalescence.
• Iron caused grain refinement of yellow brass as shown in Figure 5.9f. The solidification time was reduced marginally, while the freezing range remained unchanged at ~60ºC (140ºF).
It has been proved by the above experiments that thermal analysis can be successfully used for predicting the grain refinement in yellow brass. As mentioned earlier, several experiments were repeated using various refiners (Cu-B, FKM 2000 and Desofin) which all utilize boron as the grain refining element. The thermal analysis was also used in identifying fading in yellow brasses.
Fading of grain refinement in Leaded Yellow Brass (C85800)
In this experiment, yellow brass alloy was refined with iron and boron and cast into ingots. These ingots were remelted, and mixed with different amounts of unrefined yellow brass ingots. The refinement was confirmed on-line by thermal analysis and necessary modifications were made by adding iron. Later, the samples were sectioned
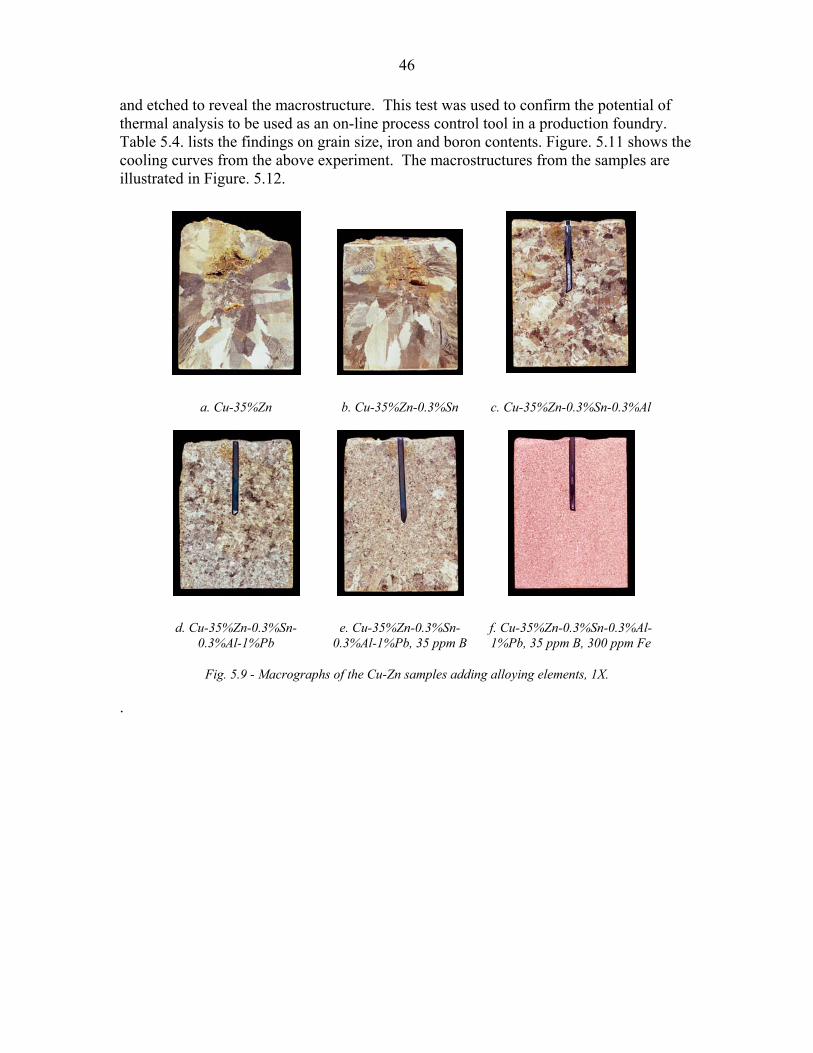
46
and etched to reveal the macrostructure. This test was used to confirm the potential of thermal analysis to be used as an on-line process control tool in a production foundry. Table 5.4. lists the findings on grain size, iron and boron contents. Figure. 5.11 shows the cooling curves from the above experiment. The macrostructures from the samples are illustrated in Figure. 5.12.
a. Cu-35%Zn b. Cu-35%Zn-0.3%Sn c. Cu-35%Zn-0.3%Sn-0.3%Al
d. Cu-35%Zn-0.3%Sn-0.3%Al-1%Pb
e. Cu-35%Zn-0.3%Sn-0.3%Al-1%Pb, 35 ppm B
f. Cu-35%Zn-0.3%Sn-0.3%Al-1%Pb, 35 ppm B, 300 ppm Fe
Fig. 5.9 - Macrographs of the Cu-Zn samples adding alloying elements, 1X.
.
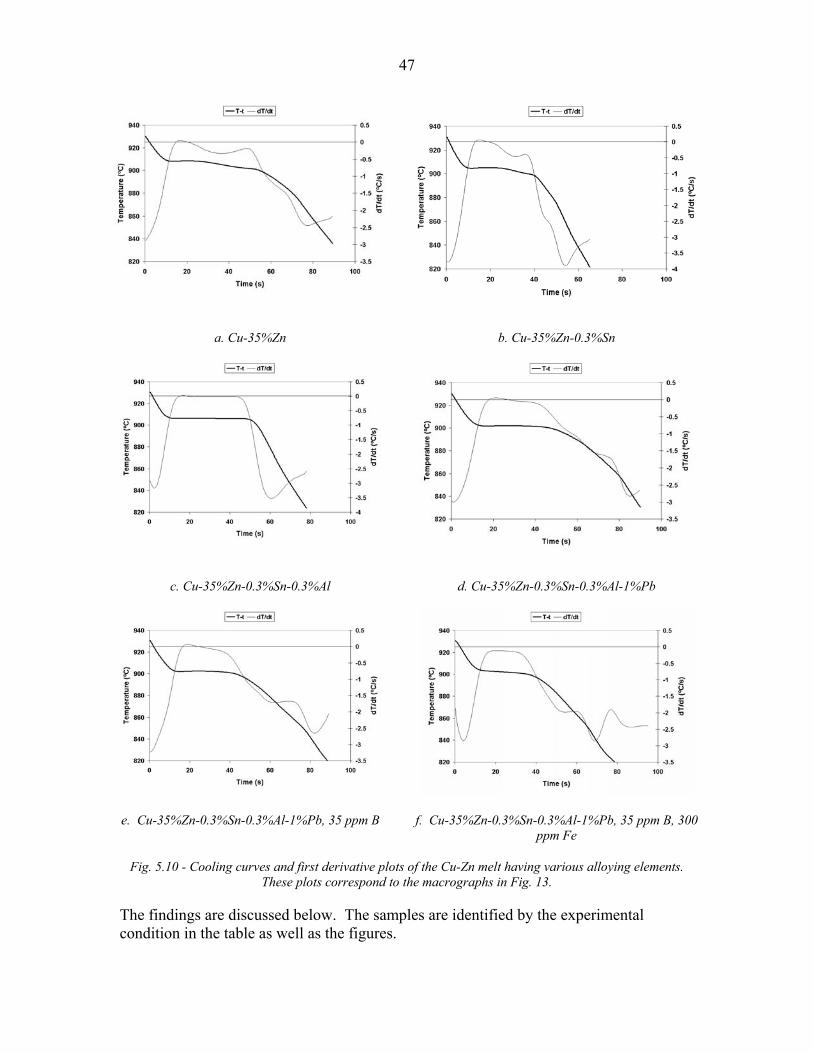
47
a. Cu-35%Zn b. Cu-35%Zn-0.3%Sn
c. Cu-35%Zn-0.3%Sn-0.3%Al d. Cu-35%Zn-0.3%Sn-0.3%Al-1%Pb
e. Cu-35%Zn-0.3%Sn-0.3%Al-1%Pb, 35 ppm B f. Cu-35%Zn-0.3%Sn-0.3%Al-1%Pb, 35 ppm B, 300 ppm Fe
Fig. 5.10 - Cooling curves and first derivative plots of the Cu-Zn melt having various alloying elements. These plots correspond to the macrographs in Fig. 13.
The findings are discussed below. The samples are identified by the experimental condition in the table as well as the figures.

48
Base - The base alloy shows very small amount of undercooling, ~0.3ºC (~0.54ºF). This undercooling is reflected in large grains seen in the sectioned sample, Fig. 5.12a.
GR - The undercooling disappeared once the melt was grain refined with the addition of boron and iron. The grain size is smaller as shown in Fig 5.12b
5.5h – The melt maintained its grain refinement potential after holding at 1010ºC (1850ºF) for 5.5 hours. No undercooling was observed and grain size is smaller (Fig 5.12c)
Pre GR - The melt was poured into ingots and remelted. The grain refinement was not lost (Fig 5.12d) and still no undercooling of the melt.
20GR 80Fresh - Diluting the melt with 80% fresh ingot gave a curve with an undercooling of ~0.6ºC (~1.08ºF), indicating that grain refinement is lost. The sample shows some larger grains, Fig. 5.12e
34GR 66Fresh - Adding more grain refined ingots reduced the undercooling ( ~0.2ºC). This reflects in the grain size which is also reduced.
Fe - Iron is added to achieve the grain refinement. The undercooling is completely removed and the grain size was reduced.
Table 5.4 - Grain size rating for leaded yellow brass (C85800)
Sample Macrograph Fig. 5.12
Grain Size Rating
Fe, ppm B, ppm
Base (a) <1C→6C <50 0
GR (b) 7.5C 100 24
5.5h (c) 7C 160 21
Pre GR (d) 7C 160 21
20GR 80Fresh (e) <1C→7C <50 4
34GR 66Fresh (f) <4C→7C <50 10
Fe (g) 7C 480 9

49
Fig. 5.11- Cooling curves for Yellow Brass alloy C85800.
Fading of grain refinement in EnviroBrass III (C89550)
Thermal analysis was used to identify the grain refinement in EnviroBrass III. One experiment similar to the yellow brass explained above will be presented here as an example. Base alloy EnviroBrass III was refined by the addition of boron and iron, held for some time, poured into ingots and remelted, this remelt was mixed with various amounts of unrefined alloy and after the loss of grain refinement it was revived using iron addition. Table 5.5 gives the grain size ratings of samples produced for these tests. Figure. 5.13 shows the cooling curves from this experiment and Fig. 5.14 shows the marcographs corresponding to the curves. The following observations were made:
• The base alloy exhibits nearly 0.6ºC (~1.08ºF) undercooling. The grain size is coarse, predicted by this undercooling, as seen in the sample, Fig. 5.14a.
• Once the boron and iron were added, the curve showed a dramatic decrease in solidification time and there was no undercooling. As predicted the macrostructure reveals a fine grain structure (Fig 5.14b).
• Holding the melt at 980ºC (1796ºF) for 6 hours lengthened the total solidification time with no undercooling and the grain size remained fine, Fig 5.14c.
• The metal was pigged and then remelted. The cooling curves shifted up due to zinc loss but the general shape did not change and the sample was still grain refined, Fig 5.14d.
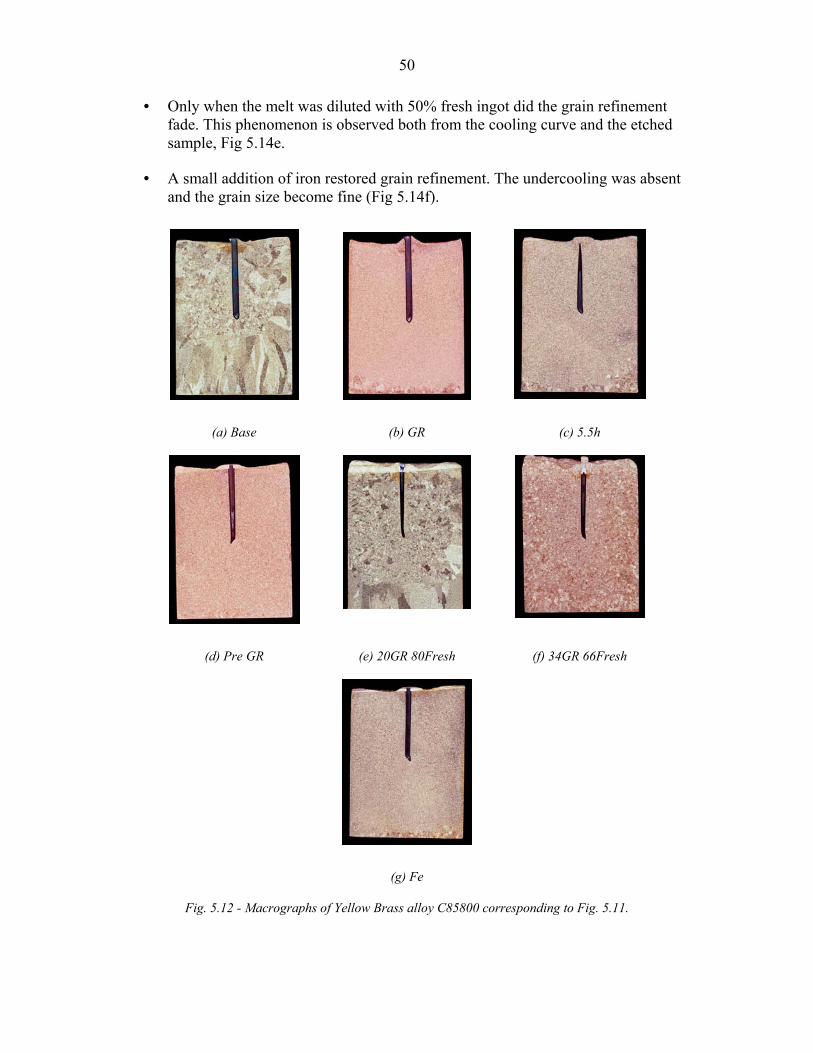
50
• Only when the melt was diluted with 50% fresh ingot did the grain refinement fade. This phenomenon is observed both from the cooling curve and the etched sample, Fig 5.14e.
• A small addition of iron restored grain refinement. The undercooling was absent and the grain size become fine (Fig 5.14f).
(a) Base (b) GR (c) 5.5h
(d) Pre GR (e) 20GR 80Fresh (f) 34GR 66Fresh
(g) Fe
Fig. 5.12 - Macrographs of Yellow Brass alloy C85800 corresponding to Fig. 5.11.
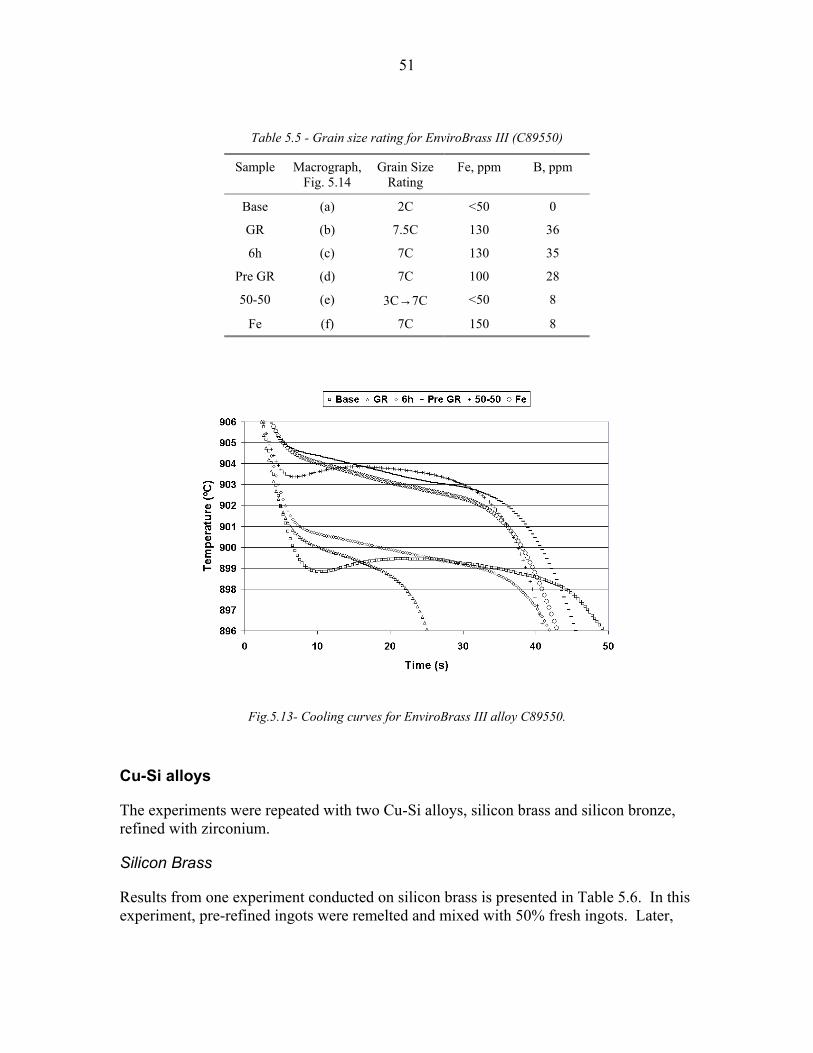
51
Table 5.5 - Grain size rating for EnviroBrass III (C89550)
Sample Macrograph, Fig. 5.14
Grain Size Rating
Fe, ppm B, ppm
Base (a) 2C <50 0
GR (b) 7.5C 130 36
6h (c) 7C 130 35
Pre GR (d) 7C 100 28
50-50 (e) 3C→7C <50 8
Fe (f) 7C 150 8
Fig.5.13- Cooling curves for EnviroBrass III alloy C89550.
Cu-Si alloys
The experiments were repeated with two Cu-Si alloys, silicon brass and silicon bronze, refined with zirconium.
Silicon Brass
Results from one experiment conducted on silicon brass is presented in Table 5.6. In this experiment, pre-refined ingots were remelted and mixed with 50% fresh ingots. Later,
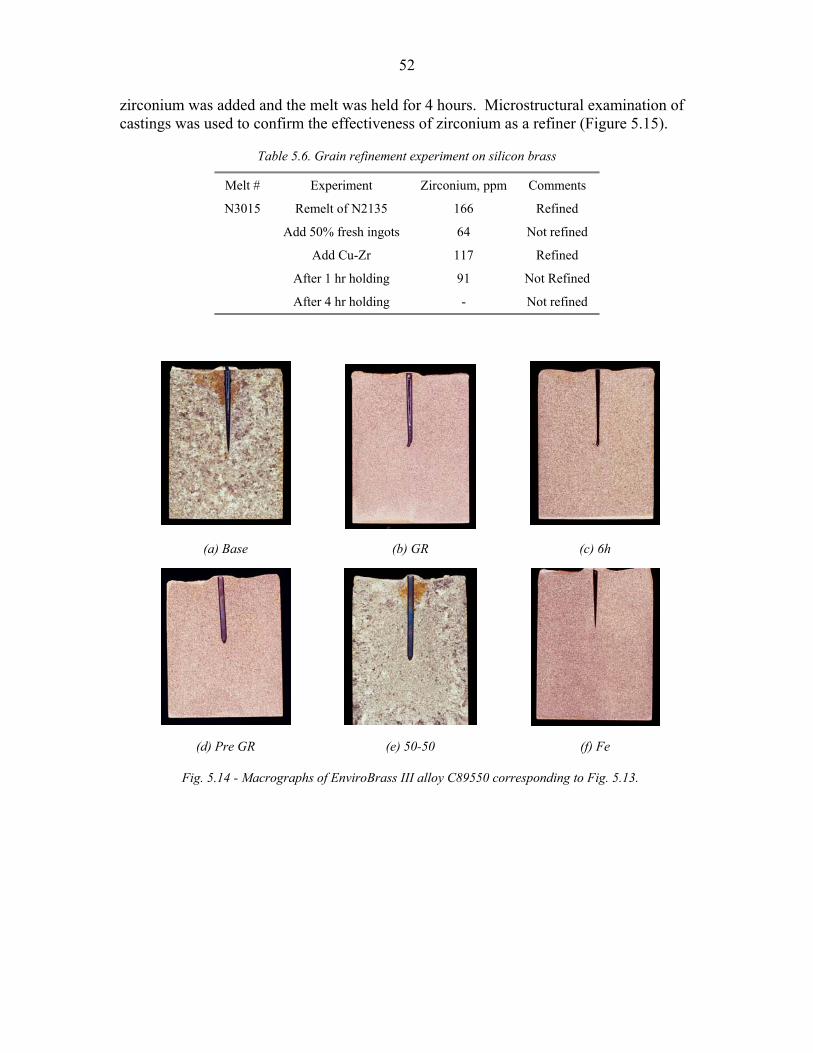
52
zirconium was added and the melt was held for 4 hours. Microstructural examination of castings was used to confirm the effectiveness of zirconium as a refiner (Figure 5.15).
Table 5.6. Grain refinement experiment on silicon brass
Melt # Experiment Zirconium, ppm Comments
N3015 Remelt of N2135 166 Refined
Add 50% fresh ingots 64 Not refined
Add Cu-Zr 117 Refined
After 1 hr holding 91 Not Refined
After 4 hr holding - Not refined
(a) Base (b) GR (c) 6h
(d) Pre GR (e) 50-50 (f) Fe
Fig. 5.14 - Macrographs of EnviroBrass III alloy C89550 corresponding to Fig. 5.13.
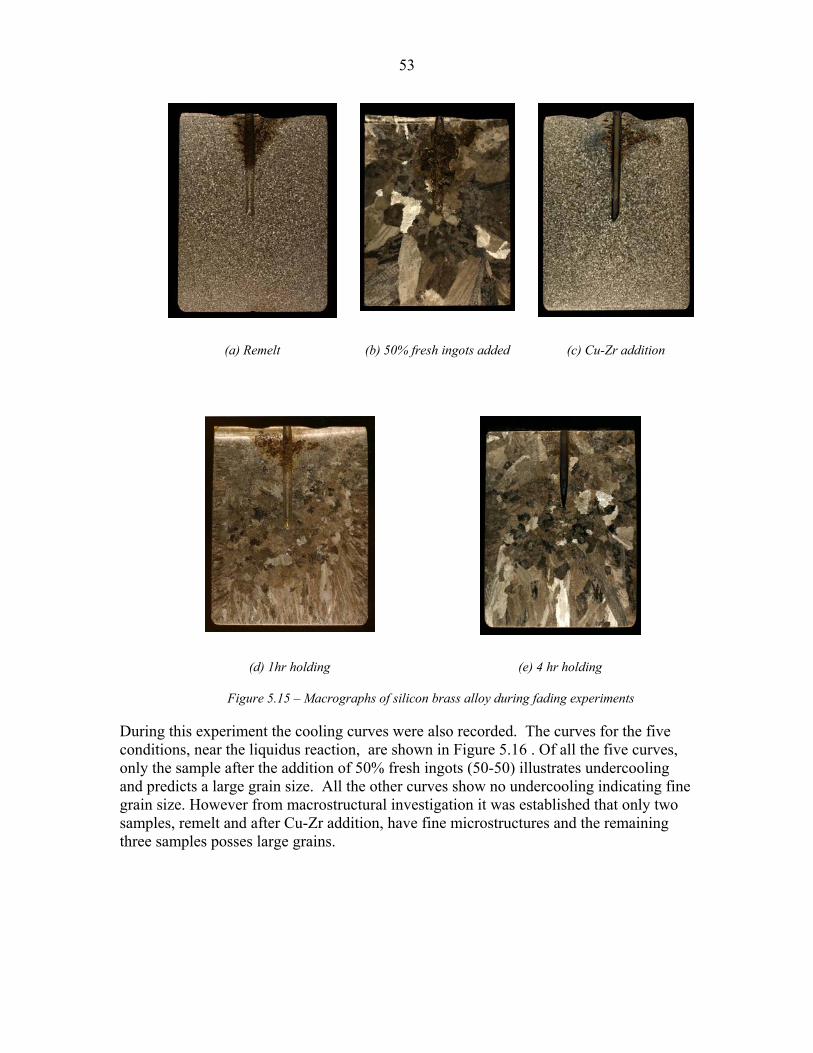
53
(a) Remelt (b) 50% fresh ingots added (c) Cu-Zr addition
(d) 1hr holding (e) 4 hr holding
Figure 5.15 – Macrographs of silicon brass alloy during fading experiments
During this experiment the cooling curves were also recorded. The curves for the five conditions, near the liquidus reaction, are shown in Figure 5.16 . Of all the five curves, only the sample after the addition of 50% fresh ingots (50-50) illustrates undercooling and predicts a large grain size. All the other curves show no undercooling indicating fine grain size. However from macrostructural investigation it was established that only two samples, remelt and after Cu-Zr addition, have fine microstructures and the remaining three samples posses large grains.
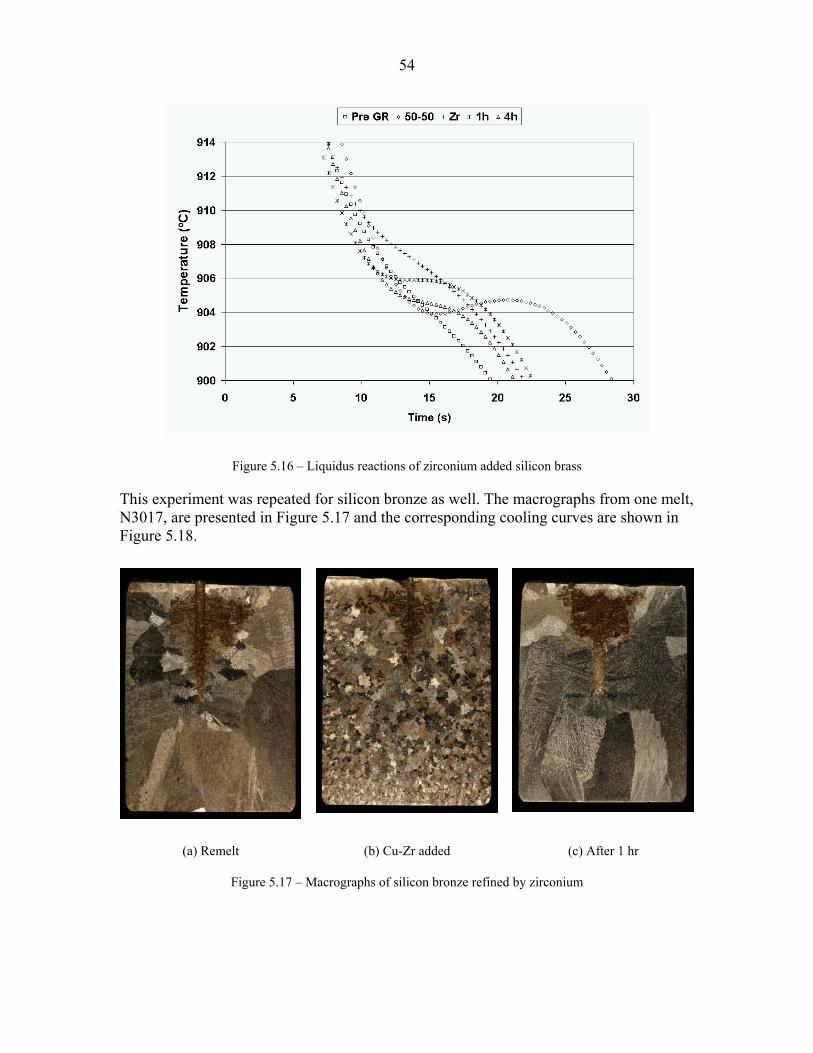
54
Figure 5.16 – Liquidus reactions of zirconium added silicon brass
This experiment was repeated for silicon bronze as well. The macrographs from one melt, N3017, are presented in Figure 5.17 and the corresponding cooling curves are shown in Figure 5.18.
(a) Remelt (b) Cu-Zr added (c) After 1 hr
Figure 5.17 – Macrographs of silicon bronze refined by zirconium
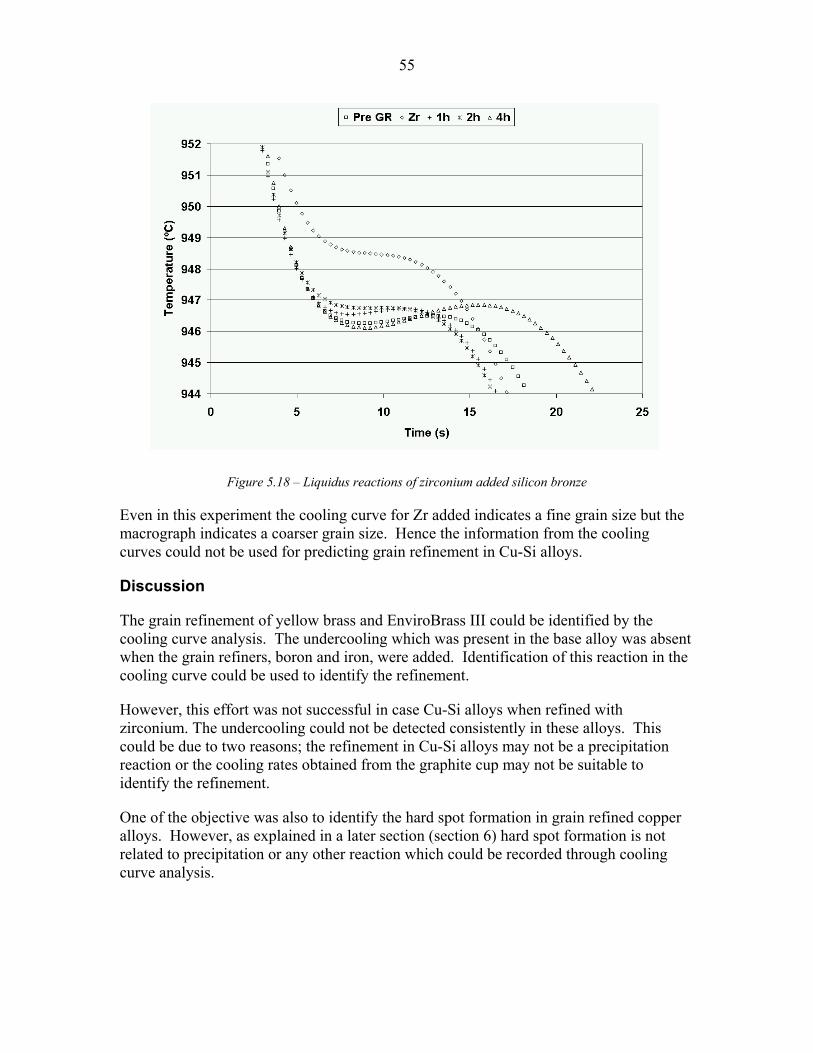
55
Figure 5.18 – Liquidus reactions of zirconium added silicon bronze
Even in this experiment the cooling curve for Zr added indicates a fine grain size but the macrograph indicates a coarser grain size. Hence the information from the cooling curves could not be used for predicting grain refinement in Cu-Si alloys.
Discussion
The grain refinement of yellow brass and EnviroBrass III could be identified by the cooling curve analysis. The undercooling which was present in the base alloy was absent when the grain refiners, boron and iron, were added. Identification of this reaction in the cooling curve could be used to identify the refinement.
However, this effort was not successful in case Cu-Si alloys when refined with zirconium. The undercooling could not be detected consistently in these alloys. This could be due to two reasons; the refinement in Cu-Si alloys may not be a precipitation reaction or the cooling rates obtained from the graphite cup may not be suitable to identify the refinement.
One of the objective was also to identify the hard spot formation in grain refined copper alloys. However, as explained in a later section (section 6) hard spot formation is not related to precipitation or any other reaction which could be recorded through cooling curve analysis.
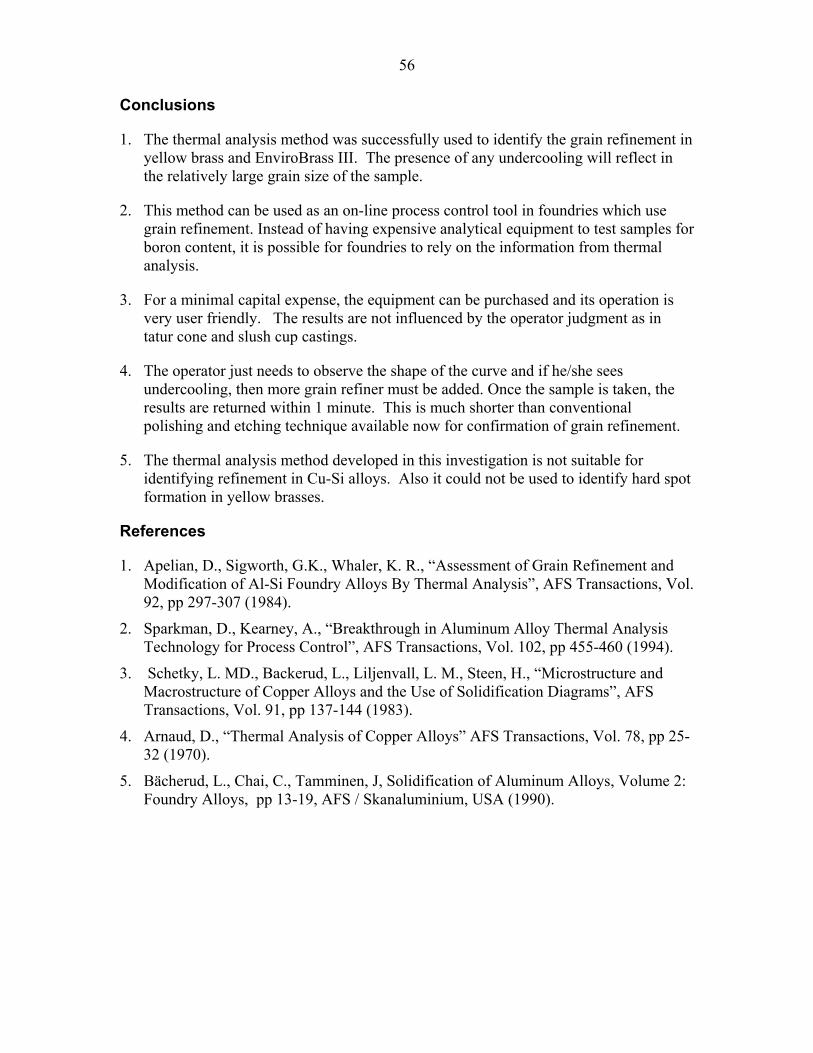
56
Conclusions
1. The thermal analysis method was successfully used to identify the grain refinement in yellow brass and EnviroBrass III. The presence of any undercooling will reflect in the relatively large grain size of the sample.
2. This method can be used as an on-line process control tool in foundries which use grain refinement. Instead of having expensive analytical equipment to test samples for boron content, it is possible for foundries to rely on the information from thermal analysis.
3. For a minimal capital expense, the equipment can be purchased and its operation is very user friendly. The results are not influenced by the operator judgment as in tatur cone and slush cup castings.
4. The operator just needs to observe the shape of the curve and if he/she sees undercooling, then more grain refiner must be added. Once the sample is taken, the results are returned within 1 minute. This is much shorter than conventional polishing and etching technique available now for confirmation of grain refinement.
5. The thermal analysis method developed in this investigation is not suitable for identifying refinement in Cu-Si alloys. Also it could not be used to identify hard spot formation in yellow brasses.
References
1. Apelian, D., Sigworth, G.K., Whaler, K. R., “Assessment of Grain Refinement and Modification of Al-Si Foundry Alloys By Thermal Analysis”, AFS Transactions, Vol. 92, pp 297-307 (1984).
2. Sparkman, D., Kearney, A., “Breakthrough in Aluminum Alloy Thermal Analysis Technology for Process Control”, AFS Transactions, Vol. 102, pp 455-460 (1994).
3. Schetky, L. MD., Backerud, L., Liljenvall, L. M., Steen, H., “Microstructure and Macrostructure of Copper Alloys and the Use of Solidification Diagrams”, AFS Transactions, Vol. 91, pp 137-144 (1983).
4. Arnaud, D., “Thermal Analysis of Copper Alloys” AFS Transactions, Vol. 78, pp 25-32 (1970).
5. Bächerud, L., Chai, C., Tamminen, J, Solidification of Aluminum Alloys, Volume 2: Foundry Alloys, pp 13-19, AFS / Skanaluminium, USA (1990).

57
SECTION 6
HARD SPOT FORMATION IN GRAIN REFINED YELLOW BRASS AND ENVIROBRASS III

58
Introduction
Yellow brasses, both leaded alloy (C85800) and its lead-free counter part EnviroBrass III (C89950) are grain refined using boron. However, some foundries prefer to stay away from grain refinement. The most often cited reason is the formation of hard spots which produce comet tails and spoil the surface finish of the components during polishing. The hard spots on a finished plumbing component and the formation of comet tails during polishing are shown in figure 6.1. These hard spots are intermetallics, usually rich in iron and thought to be iron boride particles formed due to the reaction between boron, present in most of the common grain refiners (including the proprietary ones), and iron in the alloy. In this work, the effect of iron, tin and boron contents on the hard spot formation has been investigated.
Figure 6.1- Hard spots on a grain refined plumbing fitting made from yellow bras and close-up look on the polished surface revealing comet tails due to hard spots
Background
Hard spot formation in copper-zinc alloys has been the subject of investigation for quite some time. Earlier references on this issue dates back to 1the 940’s but focuses on high strength yellow brasses known as manganese bronzes [1] . Manganese bronzes are strengthened by fine complex iron-aluminum-manganese precipitates uniformly distributed in an " + $ matrix. Originally the hard spots were thought to be formed due to segregation and growth of these precipitates due to excess iron, poor quality scrap and melt processing. These hard spots are huge (up to 3mm in diameter) and cause problems for machining. Maintaining a higher holding temperature has been found to reduce the problem of hard spots probably due to the dissolution of these precipitates. The discussion part of the report by Dreher is interesting because the reaction between silicon and iron was cited as the cause for the formation of these hard spots. However, no conclusions were drawn from the discussion.
Later studies in Britain confirmed the effect of silicon on the hard spot formation in high strength yellow brasses and 60:40 brasses [2]. The hard spots were separated and analyzed for the composition. These were found to contain iron, silicon, aluminum and copper in major quantities. Along with these, boron and manganese were also detected in

59
some of the particles. Boron was most probably picked up from the fluxes used as melt covers. It was proposed that silicon combined with the iron to form the hard spots. Silicon was also found to reduce the dissolution rate and solid solubility of iron in brasses.
In another report [3], it was stated that boron can form its own hard spots combining with iron in lower concentrations and these hard spots were acicular in shape. As the concentrations of iron and boron were increased (0.7% and 0.5% respectively) the hard spots grew larger and became spherical. This report also indicates that these particles formed well above the liquidus temperature due to reaction between boron, silicon and iron and were found to coarsen as the holding temperature was reduced.
The analysis of hard spots in manganese bronzes was the subject of a later publication from the University of Illinois [4]. In this report, the nature of the particle was determined to be dendritic and it was concluded that these particles were precipitated from the liquid itself well before the solidification started. In addition, the particles were found to be rich in manganese, aluminum, iron and silicon. However, the possible reasons for the formation of these particles were not discussed.
The issue of hard spots was studied more elaborately in Germany as explained in the review by Bohlinger [5]. In this review, various hard spots reported in the literature were catalogued and discussed. Possible steps to be undertaken to reduce hard spot formation were presented but the causes for the formation were not discussed.
In another study, the use of a proprietary master alloy containing boron used to refine yellow brasses was reported by Haupt [6]. The pre-refined yellow brass ingots could be remelted without the loss of grain refinement and formation of hard spots was not an issue. It was recommended that the combined Sn and Fe contents should not be more than 0.4% and Si should be less than 0.02%. It was also reported that the two hardening alloys developed earlier for brasses, Cu-13%Al-1%B and Cu-2%B, produced grain refinement but appearance of large hard spots / intermetallic inclusions rendered the components worthless.
It should be borne in mind that most of the above said studies are focused on high strength manganese bronzes which have very high amounts of iron ~ 2% or more. Also, to date very little R&D work has been performed on grain refinement and hard spot formation in the yellow brass and lead-free yellow brass (EnviroBrass III) used to produce plumbing components.
Scope of the Work
The above discussion clearly illustrates that the issue of hard spots in yellow brasses, containing low amounts of iron and silicon, is not addressed in detail. This is currently more important now as more and more foundries are adapting permanent mold casting process to produce plumbing components using yellow brass or EnviroBrass III. These alloys are routinely being refined with boron to overcome the problem of hot tearing.
60
During the ‘International Workshop on Permanent Mold Casting of Copper-Base Alloys’ conducted in 1998, formation of hard spots in yellow brasses was one of the topics raised during panel discussion; The summary of the discussion is as follows:
• The interactions between various impurity elements such as Fe, Ni, Sn and Si present in the alloy were considered to be the main cause for the hard spot formation. Boron could be the catalyst for these interactions. However, it is possible that hard particles could form even in alloys free of boron. These hard spots were usually observed in the final stages of production, polishing and finishing, of components.
It became clear from the above discussion and the available literature that it is necessary to investigate the effect of various impurity elements and grain refiners on the hard spot formation in yellow brass. Also the levels of elements required for the formation of inclusions in yellow brass alloy C85800 should be optimized. These studies should also be extended to the EnviroBrass III. Hence, the current investigation was undertaken to analyze the effects of iron, tin and boron on the formation of hard spots in yellow brass and EnviroBrass III.
Previous Work
Grain refinement and hard spot formation in permanent mold cast yellow brasses was investigated at MTL as part of earlier projects funded by International Copper Association / Copper Development Association. Most of these experiments were conducted with relatively low residual levels of boron and iron. The results from these earlier work will be presented here.
Two casting trials were performed to study the effect of iron on the intermetallic (iron boride) formation in yellow brass (C85800) by adding iron (as Cu-10% Fe) and boron (as Cu-2%B) in steps [7]. In the first trial, the iron content was increased gradually after adding the optimum level of boron for grain refinement. For the second melt, the boron level was gradually increased at a given iron content.
Addition of iron to grain refined alloy, in concentrations greater than about 0.06%, resulted in the formation of iron-boride intermetallic needles in the structure. When the iron content was increased further to 0.14 % boride inclusions started to appear in greater number. In an alloy with low level of iron (<0.055 %Fe) inclusions were not observed even when boron content was raised to 0.012%. Another finding was that boron caused coarsening of grains instead of refinement when added beyond the optimum level of 200 ppm (0.02%). Once the particles were formed, the volume fraction increased as either the boron or the iron content increased.
Two distinct morphologies, fine particles and needles, of inclusions were observed. These inclusions appeared together in the intergranular regions. Some times, the inclusions formed as clusters and when magnified, were found to be needles and particles in nature (Figure 6.2a &b). The microhardness of these inclusions was measured to be

61
980HK whereas the matrix had a hardness of 120HK. The presence of iron was confirmed by spot analysis using EDX (Figure 6.2c).
a. Cluster of particles b. Needles in the cluster c. Spot analysis of particle
Figure 6.2 - Hard spots in yellow brass
Subsequently, some elemental mapping was carried out to find the other elements in the particles. A cluster of hard spots containing both needles and fine particles is presented in Figure 6.3a. The iron and boron were detected using elemental mapping. As shown, the needles are mostly made of iron (Figure 6.3b) and some boron (Figure 6.3c). The actual composition of the particles was not determined during this investigation.
a. SEM Image b. Iron map c. Boron map
Figure 6.3 - The microstructural analysis of hard spots in yellow brass
Experimental Details (Current investigation)
25 kg of base alloy was melted in a push up type induction furnace using a clay graphite crucible. After pouring one shrink bar casting, either Cu-B or Fe was added to the alloy. Ten minutes after the addition one shrink bar casting was produced and further addition
62
of Cu-B or Fe was made. The pouring temperature was maintained between 960C and 970C. The mold was maintained between 160 and 200C.
The shrink bar castings were machined to remove the surface layer to have uniform finish before polishing and buffing. Starline Manufacturing Inc., carried out the polishing and buffing operations. The surfaces of the castings were checked for hard spots. If the particles were detected, they were subjected to microstructural and chemical analysis using optical and scanning electron microscopes as well as EPMA.
Results
During this investigation experiments were conducted to confirm the results obtained from earlier studies using high zinc alloys (yellow brass and EnviroBrass III). In addition, the effect of tin content (0.3% and 1.0%) on hard spot formation was investigated. Cu-2% B master alloy was used as the refiner. Since the recovery was not consistent from Cu-10% Fe master alloys, electrolytic iron was used for the present experiments. The castings were polished and the observations from the visual inspection of the polished castings are presented in Table 6.1 for yellow brass and Table 6.2 for EnviroBrass III.
The addition levels for iron and boron were same in all the six melts presented in the two tables. The addition levels are shown for the first two melts in Table 6.1 (since the analysis was not carried out in full) and actual levels are shown for the other four melts. However, it is safe to assume the actual levels in the first two melts will be similar to the other melts.
The recovery of boron when added initially was around 50% and this did not increase with time. On the other hand, the recovery of iron was time dependent and complete recovery was not observed even after one hour of holding. As shown in the two tables, in each melt 0.3% iron was added but at the end of the melt, the maximum iron content reported was only 0.2% representing 66% recovery.
In this investigation, hard spots were observed only in grain refined samples having an iron content greater than 0.06%. Addition of fresh grain refiner to an alloy already containing at least 0.05% Fe produced large number of hard particles. The trend is the same for both yellow brass and EnviroBrass III. In fact, boron recovery in an alloy having a higher amount of iron is very low as seen in samples 1125-5 in Table 6.1 and 1138-5 in Table 6.2.
Tin content did not have an effect on the hard spot formation. Alloys having either 0.3% or 1% tin formed hard spots only after dissolving a critical amount of iron. Although hard spots were observed in alloys containing more than 0.06% Fe, it is surprising that sample #1124-3 with an iron content of 0.13% is free of hard spots. This phenomenon could be attributed to the presence of free iron which will be discussed in detail later.
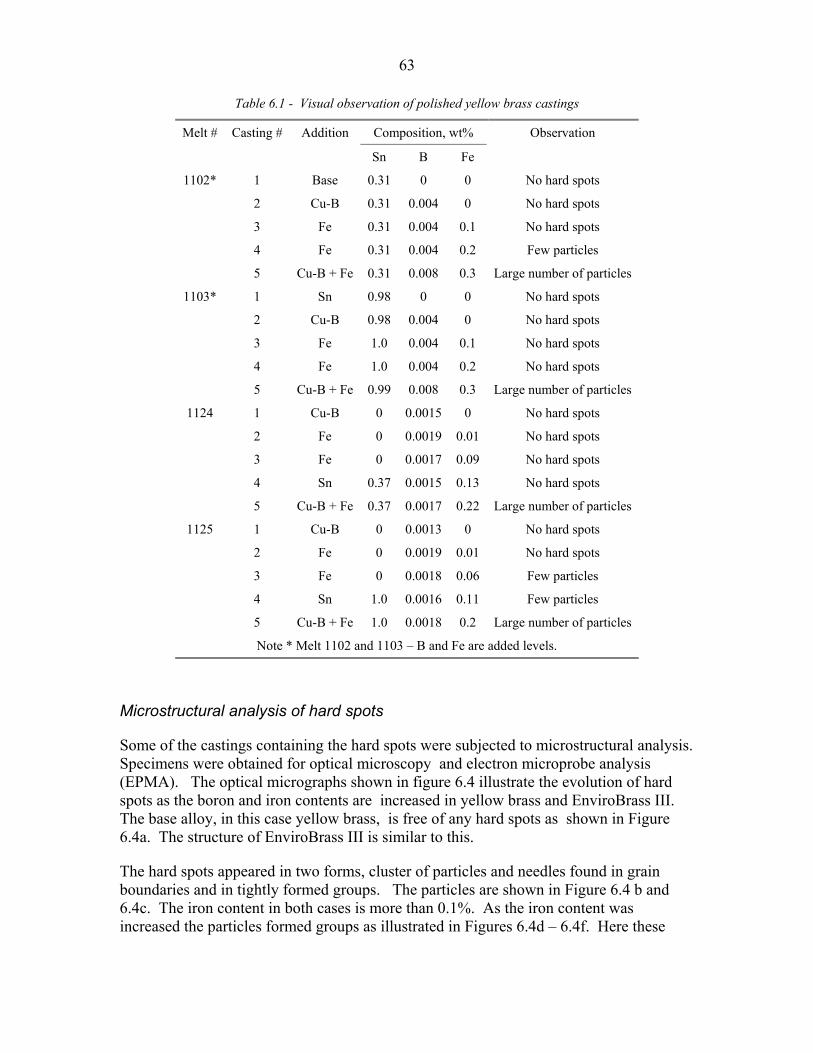
63
Table 6.1 - Visual observation of polished yellow brass castings
Composition, wt% Melt # Casting # Addition
Sn B Fe
Observation
1102* 1 Base 0.31 0 0 No hard spots
2 Cu-B 0.31 0.004 0 No hard spots
3 Fe 0.31 0.004 0.1 No hard spots
4 Fe 0.31 0.004 0.2 Few particles
5 Cu-B + Fe 0.31 0.008 0.3 Large number of particles
1103* 1 Sn 0.98 0 0 No hard spots
2 Cu-B 0.98 0.004 0 No hard spots
3 Fe 1.0 0.004 0.1 No hard spots
4 Fe 1.0 0.004 0.2 No hard spots
5 Cu-B + Fe 0.99 0.008 0.3 Large number of particles
1124 1 Cu-B 0 0.0015 0 No hard spots
2 Fe 0 0.0019 0.01 No hard spots
3 Fe 0 0.0017 0.09 No hard spots
4 Sn 0.37 0.0015 0.13 No hard spots
5 Cu-B + Fe 0.37 0.0017 0.22 Large number of particles
1125 1 Cu-B 0 0.0013 0 No hard spots
2 Fe 0 0.0019 0.01 No hard spots
3 Fe 0 0.0018 0.06 Few particles
4 Sn 1.0 0.0016 0.11 Few particles
5 Cu-B + Fe 1.0 0.0018 0.2 Large number of particles
Note * Melt 1102 and 1103 – B and Fe are added levels.
Microstructural analysis of hard spots
Some of the castings containing the hard spots were subjected to microstructural analysis. Specimens were obtained for optical microscopy and electron microprobe analysis (EPMA). The optical micrographs shown in figure 6.4 illustrate the evolution of hard spots as the boron and iron contents are increased in yellow brass and EnviroBrass III. The base alloy, in this case yellow brass, is free of any hard spots as shown in Figure 6.4a. The structure of EnviroBrass III is similar to this.
The hard spots appeared in two forms, cluster of particles and needles found in grain boundaries and in tightly formed groups. The particles are shown in Figure 6.4 b and 6.4c. The iron content in both cases is more than 0.1%. As the iron content was increased the particles formed groups as illustrated in Figures 6.4d – 6.4f. Here these
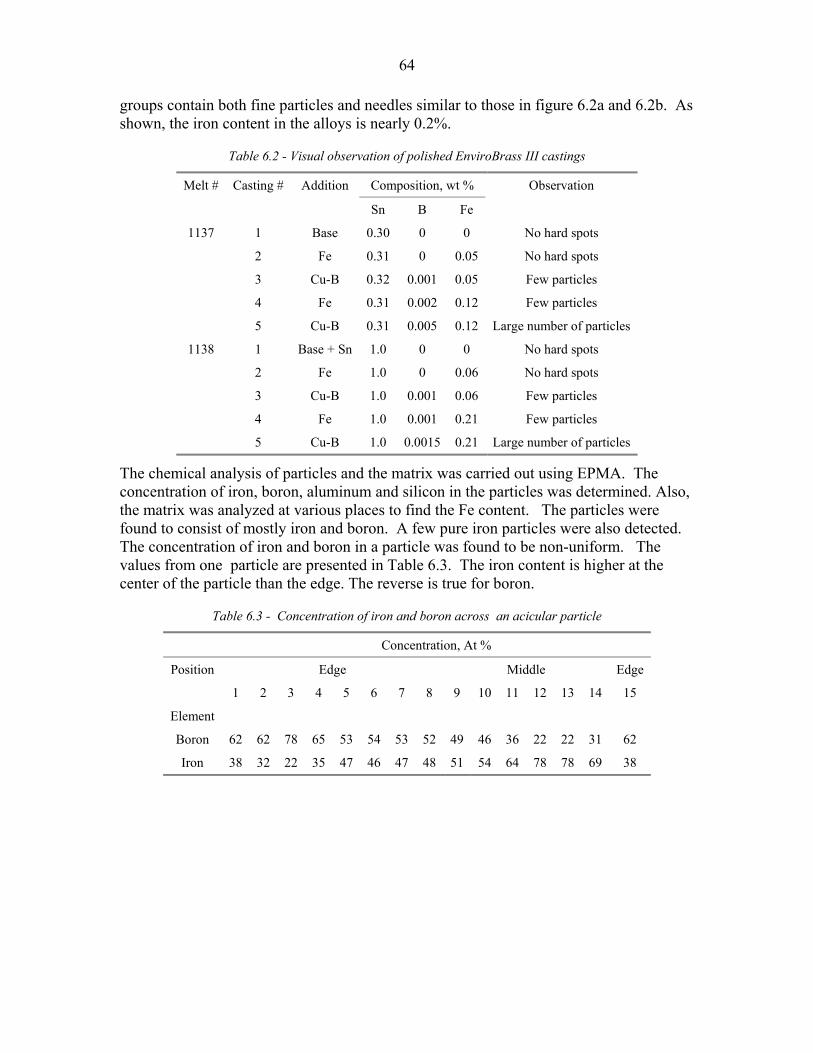
64
groups contain both fine particles and needles similar to those in figure 6.2a and 6.2b. As shown, the iron content in the alloys is nearly 0.2%.
Table 6.2 - Visual observation of polished EnviroBrass III castings
Composition, wt % Melt # Casting # Addition
Sn B Fe
Observation
1137 1 Base 0.30 0 0 No hard spots
2 Fe 0.31 0 0.05 No hard spots
3 Cu-B 0.32 0.001 0.05 Few particles
4 Fe 0.31 0.002 0.12 Few particles
5 Cu-B 0.31 0.005 0.12 Large number of particles
1138 1 Base + Sn 1.0 0 0 No hard spots
2 Fe 1.0 0 0.06 No hard spots
3 Cu-B 1.0 0.001 0.06 Few particles
4 Fe 1.0 0.001 0.21 Few particles
5 Cu-B 1.0 0.0015 0.21 Large number of particles
The chemical analysis of particles and the matrix was carried out using EPMA. The concentration of iron, boron, aluminum and silicon in the particles was determined. Also, the matrix was analyzed at various places to find the Fe content. The particles were found to consist of mostly iron and boron. A few pure iron particles were also detected. The concentration of iron and boron in a particle was found to be non-uniform. The values from one particle are presented in Table 6.3. The iron content is higher at the center of the particle than the edge. The reverse is true for boron.
Table 6.3 - Concentration of iron and boron across an acicular particle
Concentration, At %
Position Edge Middle Edge
1 2 3 4 5 6 7 8 9 10 11 12 13 14 15
Element
Boron 62 62 78 65 53 54 53 52 49 46 36 22 22 31 62
Iron 38 32 22 35 47 46 47 48 51 54 64 78 78 69 38
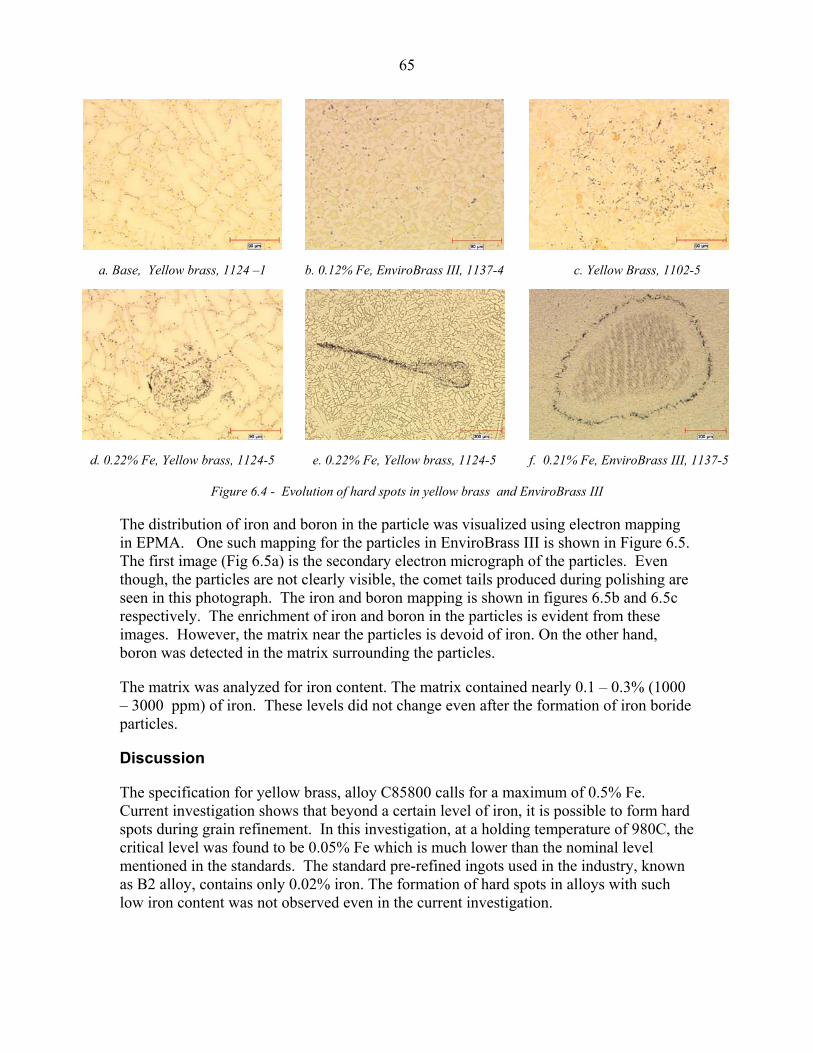
65
a. Base, Yellow brass, 1124 –1 b. 0.12% Fe, EnviroBrass III, 1137-4 c. Yellow Brass, 1102-5
d. 0.22% Fe, Yellow brass, 1124-5 e. 0.22% Fe, Yellow brass, 1124-5 f. 0.21% Fe, EnviroBrass III, 1137-5
Figure 6.4 - Evolution of hard spots in yellow brass and EnviroBrass III
The distribution of iron and boron in the particle was visualized using electron mapping in EPMA. One such mapping for the particles in EnviroBrass III is shown in Figure 6.5. The first image (Fig 6.5a) is the secondary electron micrograph of the particles. Even though, the particles are not clearly visible, the comet tails produced during polishing are seen in this photograph. The iron and boron mapping is shown in figures 6.5b and 6.5c respectively. The enrichment of iron and boron in the particles is evident from these images. However, the matrix near the particles is devoid of iron. On the other hand, boron was detected in the matrix surrounding the particles.
The matrix was analyzed for iron content. The matrix contained nearly 0.1 – 0.3% (1000 – 3000 ppm) of iron. These levels did not change even after the formation of iron boride particles.
Discussion
The specification for yellow brass, alloy C85800 calls for a maximum of 0.5% Fe. Current investigation shows that beyond a certain level of iron, it is possible to form hard spots during grain refinement. In this investigation, at a holding temperature of 980C, the critical level was found to be 0.05% Fe which is much lower than the nominal level mentioned in the standards. The standard pre-refined ingots used in the industry, known as B2 alloy, contains only 0.02% iron. The formation of hard spots in alloys with such low iron content was not observed even in the current investigation.

66
Iron is not soluble in solid copper. Its solubility in liquid copper and its alloys is temperature dependent. In pure copper, iron has complete solubility only above 1300C. As a Cu-Fe melt is cooled down from 1300C, iron precipitates from the melt. Even in rapid cooling of Cu-Fe alloys, the iron is present as particles. A microstructure of Cu-10% Fe master alloy is shown in Figure 6.6.
a. SEM Image b. Iron map c. Boron map
Figure 6.5 - EDS analysis of hard spots in EnviroBrass III showing the enrichment of iron and boron in the particles EnviroBrass III, 1138-5
The solubility of iron in copper alloys is very similar. Hudson reports that the solubility of iron in a 60:40 brass reduced from about 1.5% at 1020C to 0.04% at 950C [2]. This reduction happened over a period of time when the melt was held at the test temperature. This indicates that the iron precipitates over a period of time instead of coming as a bulk. However, there is no indication that the iron particles grow over this period of time.
Figure 6.6 – Iron dendrites in copper matrix of a Cu-10% Fe master alloy particle
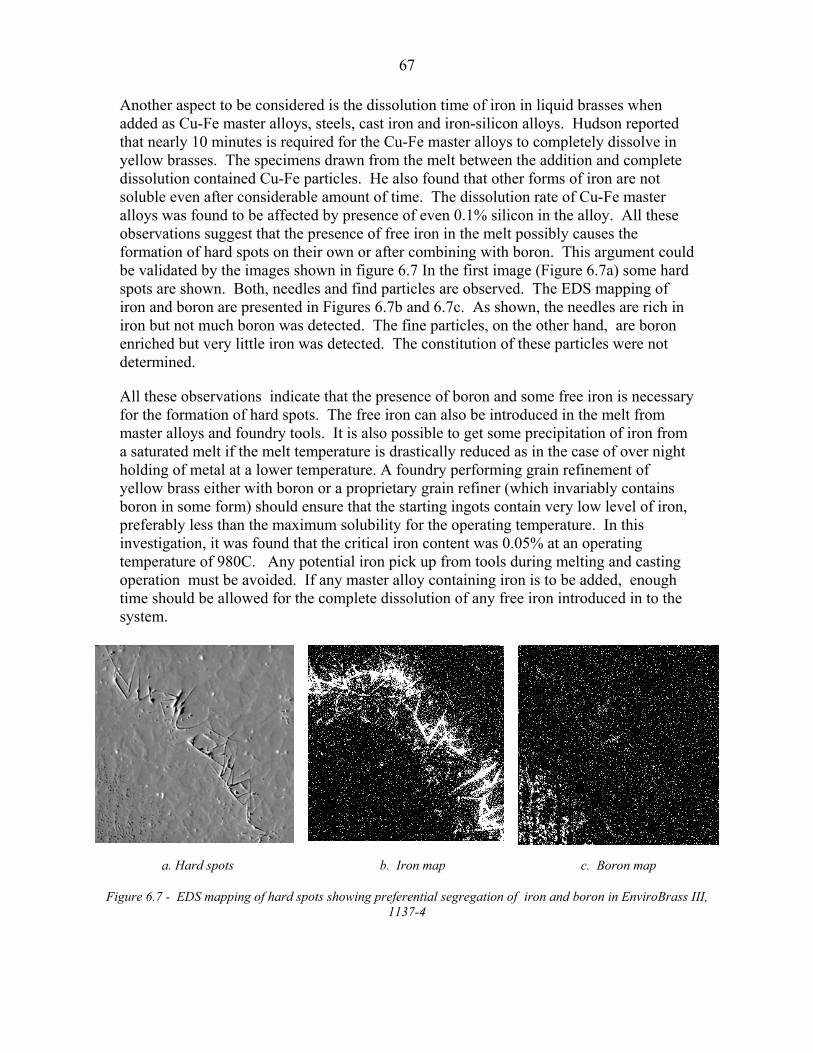
67
Another aspect to be considered is the dissolution time of iron in liquid brasses when added as Cu-Fe master alloys, steels, cast iron and iron-silicon alloys. Hudson reported that nearly 10 minutes is required for the Cu-Fe master alloys to completely dissolve in yellow brasses. The specimens drawn from the melt between the addition and complete dissolution contained Cu-Fe particles. He also found that other forms of iron are not soluble even after considerable amount of time. The dissolution rate of Cu-Fe master alloys was found to be affected by presence of even 0.1% silicon in the alloy. All these observations suggest that the presence of free iron in the melt possibly causes the formation of hard spots on their own or after combining with boron. This argument could be validated by the images shown in figure 6.7 In the first image (Figure 6.7a) some hard spots are shown. Both, needles and find particles are observed. The EDS mapping of iron and boron are presented in Figures 6.7b and 6.7c. As shown, the needles are rich in iron but not much boron was detected. The fine particles, on the other hand, are boron enriched but very little iron was detected. The constitution of these particles were not determined.
All these observations indicate that the presence of boron and some free iron is necessary for the formation of hard spots. The free iron can also be introduced in the melt from master alloys and foundry tools. It is also possible to get some precipitation of iron from a saturated melt if the melt temperature is drastically reduced as in the case of over night holding of metal at a lower temperature. A foundry performing grain refinement of yellow brass either with boron or a proprietary grain refiner (which invariably contains boron in some form) should ensure that the starting ingots contain very low level of iron, preferably less than the maximum solubility for the operating temperature. In this investigation, it was found that the critical iron content was 0.05% at an operating temperature of 980C. Any potential iron pick up from tools during melting and casting operation must be avoided. If any master alloy containing iron is to be added, enough time should be allowed for the complete dissolution of any free iron introduced in to the system.
a. Hard spots b. Iron map c. Boron map
Figure 6.7 - EDS mapping of hard spots showing preferential segregation of iron and boron in EnviroBrass III, 1137-4
68
Conclusions
1. The effect of iron, boron and tin contents on the hard spot formation in yellow brass and EnviroBrass III was investigated.
2. Hard spots were formed in alloys containing more than 0.05% iron when refined with boron at an operating temperature of 980C.
3. The dissolved iron in the matrix remained unchanged even after the hard spot formation. This indicates that the iron causing hard spot formation is present in the free form.
4. Most of the particles were found to be rich in iron and boron along with some pure iron particles.
5. The composition of the particles was found to be non-uniform with higher amounts of iron and lower amounts of boron in the center compared to the edges.
6. Tin content is not a factor in hard spot formation in yellow brass or EnviroBrass III. The critical iron content remains same irrespective of the tin content.
References
1. Dreher, G.K., “Manganese Bronze”, AFS Transactions, Vol. 54, pp. 502-506, (1946).
2. Hudson, D.A., “Iron-rich hard spots formed by silicon and boron in brasses”, J. Inst. Of Metals, Vol. 92, pp.280-288 (1963)
3. Stock, D.C., Smellie, W.J., “The character, formation, and prevention of hard spots in high-tensile brasses”, J. Inst. Of Metals, Vol. 92, pp.275-280, (1963)
4. Weins, M.J. et al., “Hard spots in manganese bronzes”, AFS Transactions, Vol. 81, pp.557-565, (1973)
5. Bohlinger, I., Wuth, W., “Formation of hard spots in secondary brasses”, EPD Congress, Ed. B.Mishra, Proceeding of conference pp.518-535, (1998)
6. Haupt, R. H. "Development of a Copper Alloy Composition for Gravity, Low-Pressure, and High-Pressure Die Casting", AFS Transactions, Vol. 98, pp . 327-330, (1990).
7. Sadayappan, M., et al., "Permanent Mold Casting of Copper Base Alloys", ICA Project No. TPT-0452-96, Final Report Phase VI, MTL 97-1 (TR-R), (1997).

69
SECTION 7
CORROSION RESISTANCE
70
Introduction
Evaluation of corrosion resistance of selected copper base alloys was completed as a part of the work on grain refinement. In the present studies, focus is given to the corrosion resistance of four copper alloys in unrefined and refined conditions. Alloys included in this study are EnviroBrass III, yellow brass, silicon brass and silicon bronze. The objective is to compare the corrosion resistance of these copper alloys.
Long-term weight loss and potentiodynamic polarization techniques are complementary methods for studying corrosion behavior of the base and grain refined brasses. According to the American Water Works Association (AWWA) pH is an important variable and data at pH 6 and 8 are crucial. Thus non-aerated buffer consisting of KH2PO4/NaOH at pH 6 and 8 medium was used for both weight loss and potentiodynamic polarization tests. Dezincification tests also show the corrosion resistance of brasses and hence, dezincification tests were performed on the alloys by the Australian test protocol. In this report, 5, 15, 52 and 120 days weight loss, linear polarization, potential dynamic and dezincification data are included.
Experimental
Alloys
Table 1 shows the alloys that were prepared at CANMET. All samples were cut to required geometric size and original surface was preserved for testing. For instance, plates of size 50x25x5 mm were used in weight loss test, samples of size 16 mm diameter were machined for potential dynamic polarization test and samples of size 25x25x5 mm were used for dezincification test. The edges of the samples were polished using 120 grit silicon carbide papers.
Corrosion Tests
Weight-Loss Experiments
Coupons of size 50x25x5 mm were drilled to facilitate suspension with Teflon tape in the test environments. The samples were cleaned by immersion in 50/50 HCl for 30 minutes before immersion in triplicate in the following test solutions:
pH 6 and 8 buffer solution of KH2PO4 and NaOH with a phosphate concentration of 0.05M
Weight loss tests were carried out for 5, 15, 52 and 120 days. At the end of test time samples were cleaned in 50/50 HCl, as recommended in ASTM G-1, washed with distilled water and dried thoroughly before weighing.

71
Table 7.1 - Chemical Composition of alloys prepared for corrosion testing
Alloy Melt # Zn Sn Pb Bi Se Si Al B Zr
N2131-1 36.1 0.31 1.0 - - - 0.4 0 -
N2131-2 36.1 0.31 1.0 - - - 0.41 0.002 -
N2142-1 36.5 0.44 1.0 - - - 0.33 0 -
Yellow Brass
N2142-2 35.9 0.44 1.0 - - - 0.32 0.001 -
N3005-1 36.1 0.23 - 0.9 0.04 - 0.26 - - Enviro Brass III N3005-2 35.7 0.23 - 0.9 0.04 - 0.25 - -
N2136-1 5.4 - - - - 4.5 0.36 - 0
N2136-2 5.5 - - - - 4.5 0.36 - 0.022
N2141-1 5.3 - - - - 4.6 0.39 - 0
Silicon Bronze
N2141-2 5.3 - - - - 4.6 0.39 - 0.024
N2135-1 15.6 - - - - 3.8 0.35 - 0 Silicon Brass N2135-2 15.7 - - - - 3.8 0.34 - 0.02
The suffix after the melt number indicates status of alloy. Nxxxx–1 indicates base alloy; Nxxxx-2 indicates grain-refined alloy.
Linear Polarization:
Linear polarization tests were also conducted to compare with the weight loss data. The half-cell (or corrosion) potential and corrosion current were measured on each of the 4 alloys (base and refined). Samples were ground to 600 grit, cleaned in HCl 50/50 for 30 sec., rinsed with distilled water and then, dry using compressed air. The electrochemical measurements were made using a Gamry potentiostat and a saturated calomel reference electrode (SCE). Polarization experiments were performed at a scan rate of 0.125 mV/s (ASTM G59 recommends a scan rate of < 0.1667mV/s). Samples were held at open-circuit potential for 5 minutes. They were initiated at 20 mV below the free corrosion potential and terminated at a maximum of 20 mV above the free corrosion potential. The IR drop can be corrected for (Rp = ∆V/Imeasured-Rc,) using the concrete resistance obtained from impedance measurement. However, in this study the correction was insignificant due to the small current.
Potentiodynamic Polarization Experiments
Polarization tests were carried out in duplicate in test solutions (a) and (b) listed above. Potentiodynamic scan was performed subsequently after the linear polarization scans.
Potentiodynamic polarization measurements were done using Gamry potentiostat. The electrochemical cell was open to air. Platinum plate counter electrode and saturated calomel reference electrode were used.
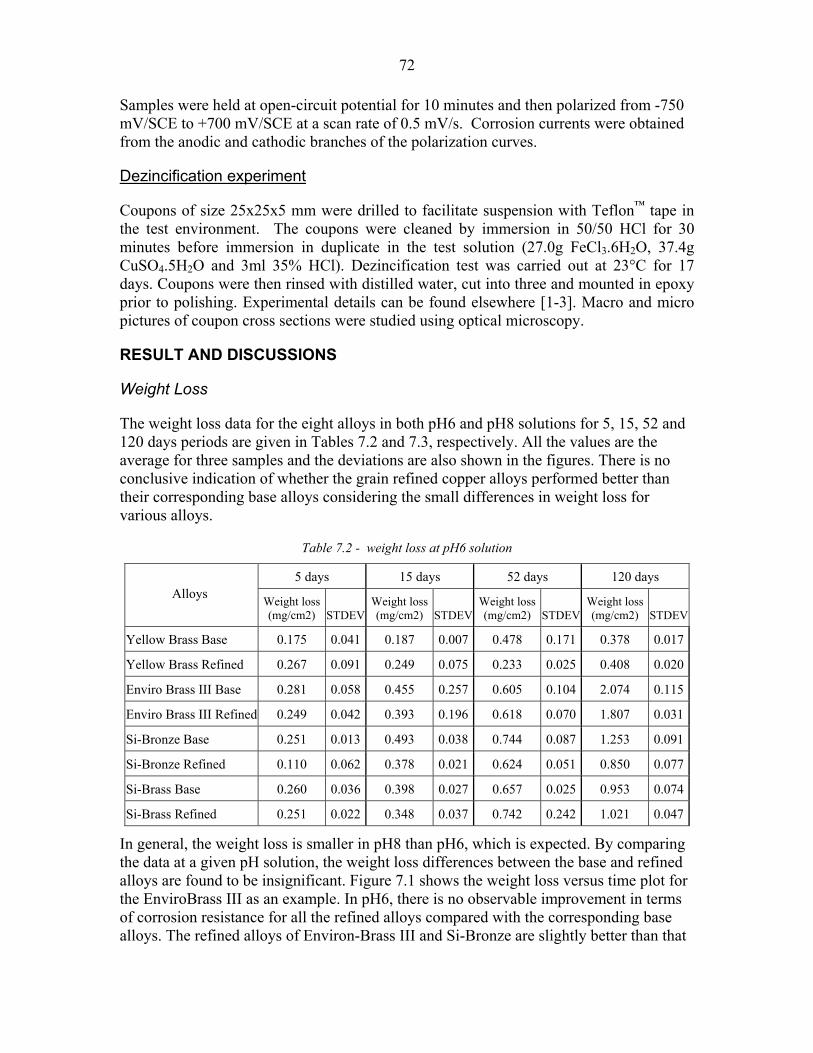
72
Samples were held at open-circuit potential for 10 minutes and then polarized from -750 mV/SCE to +700 mV/SCE at a scan rate of 0.5 mV/s. Corrosion currents were obtained from the anodic and cathodic branches of the polarization curves.
Dezincification experiment
Coupons of size 25x25x5 mm were drilled to facilitate suspension with Teflon™ tape in the test environment. The coupons were cleaned by immersion in 50/50 HCl for 30 minutes before immersion in duplicate in the test solution (27.0g FeCl3.6H2O, 37.4g CuSO4.5H2O and 3ml 35% HCl). Dezincification test was carried out at 23°C for 17 days. Coupons were then rinsed with distilled water, cut into three and mounted in epoxy prior to polishing. Experimental details can be found elsewhere [1-3]. Macro and micro pictures of coupon cross sections were studied using optical microscopy.
RESULT AND DISCUSSIONS
Weight Loss
The weight loss data for the eight alloys in both pH6 and pH8 solutions for 5, 15, 52 and 120 days periods are given in Tables 7.2 and 7.3, respectively. All the values are the average for three samples and the deviations are also shown in the figures. There is no conclusive indication of whether the grain refined copper alloys performed better than their corresponding base alloys considering the small differences in weight loss for various alloys.
Table 7.2 - weight loss at pH6 solution
5 days 15 days 52 days 120 days Alloys
Weight loss (mg/cm2) STDEV
Weight loss (mg/cm2) STDEV
Weight loss (mg/cm2) STDEV
Weight loss (mg/cm2) STDEV
Yellow Brass Base 0.175 0.041 0.187 0.007 0.478 0.171 0.378 0.017
Yellow Brass Refined 0.267 0.091 0.249 0.075 0.233 0.025 0.408 0.020
Enviro Brass III Base 0.281 0.058 0.455 0.257 0.605 0.104 2.074 0.115
Enviro Brass III Refined 0.249 0.042 0.393 0.196 0.618 0.070 1.807 0.031
Si-Bronze Base 0.251 0.013 0.493 0.038 0.744 0.087 1.253 0.091
Si-Bronze Refined 0.110 0.062 0.378 0.021 0.624 0.051 0.850 0.077
Si-Brass Base 0.260 0.036 0.398 0.027 0.657 0.025 0.953 0.074
Si-Brass Refined 0.251 0.022 0.348 0.037 0.742 0.242 1.021 0.047
In general, the weight loss is smaller in pH8 than pH6, which is expected. By comparing the data at a given pH solution, the weight loss differences between the base and refined alloys are found to be insignificant. Figure 7.1 shows the weight loss versus time plot for the EnviroBrass III as an example. In pH6, there is no observable improvement in terms of corrosion resistance for all the refined alloys compared with the corresponding base alloys. The refined alloys of Environ-Brass III and Si-Bronze are slightly better than that

73
of corresponding base alloys in pH8; however, it is not conclusive and further tests should be conducted to confirm the results. Overall, it cannot be concluded based on the weight loss results that either the base or the refined alloy has a better corrosion resistance as the variations are within the experimental errors. This observation is also supported by the values obtained in linear polarization study.
Table 7.3- weight loss at pH8 solution
5 days 15 days 52 days 120 days Alloy
Weight loss (mg/cm2) STDEV
Weight loss (mg/cm2) STDEV
Weight loss (mg/cm2) STDEV
Weight loss (mg/cm2) STDEV
Yellow Brass Base 0.057 0.007 0.138 0.028 0.156 0.008 0.120 0.013
Yellow Brass Refined 0.069 0.006 0.146 0.069 0.156 0.023 0.133 0.019
Enviro Brass III Base 0.120 0.024 0.230 0.100 0.201 0.042 0.152 0.020
Enviro Brass III Refined 0.095 0.035 0.190 0.014 0.188 0.043 0.160 0.024
Si-Bronze Base 0.073 0.000 0.133 0.005 0.443 0.020 0.130 0.024
Si-Bronze Refined 0.019 0.006 0.114 0.009 0.072 0.013 0.110 0.006
Si-Brass Base 0.070 0.003 0.147 0.007 0.174 0.040 0.116 0.060
Si-Brass Refined 0.075 0.009 0.150 0.006 0.186 0.065 0.150 0.006
WEIGHT LOSS OF ENVIRO-BRASS at pH 6 & pH 8
0.00
0.50
1.00
1.50
2.00
2.50
0 20 40 60 80 100 120 140
TI M E ( da y s)
Base pH 6
Ref ined pH 6
Base pH 8
Ref ined pH 8
Figure 7.1- Weight loss graph of EnviroBrass III (base and refined) at pH 6 & pH 8.
Potential Dynamic Polarization
The polarization curves for the four sets of alloys were also studied. Figures 7.2 and 7.3 display the EnviroBrass III base and refined alloys at pH6 solution respectively, as an example. It should be noted that these tests were done using polished samples as

74
described earlier. As it can be seen in the Figures, there are insignificant differences observed between the base and its corresponding refined alloy. The anodic curve shows a small region of passivation followed by trans-passive region. It appears the passivation region remained very similar in both base alloy and its corresponding grain refined one.
Figure 7.2: Potential dynamic polarization of EnviroBrass III (Base) at pH6 solution.
Figure 7.3: Potential dynamic polarization of EnviroBrass III (Refined) at pH 6 solution.
As the chemical composition of the base alloy and its refined alloy is essentially the same or very similar, it is the microstructure that alters corrosion behavior. It is recommended that the microstructural characterization of both base and refined alloys be done alone with the corrosion resistance determination.
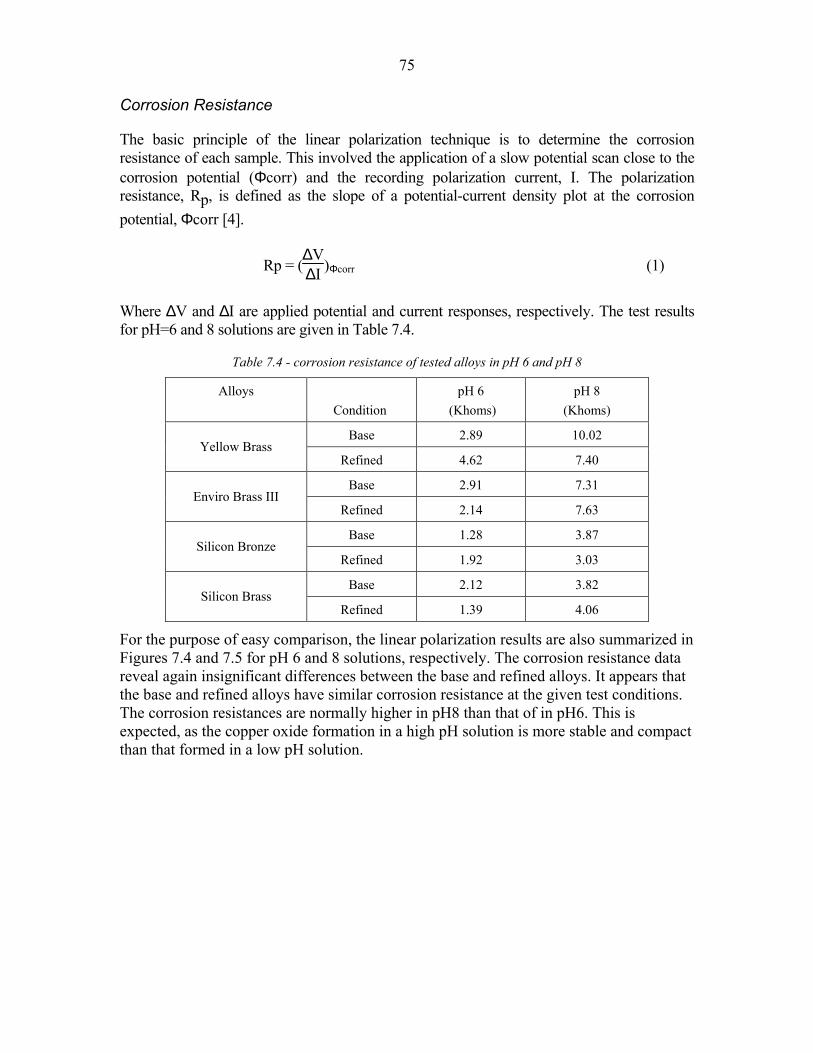
75
Corrosion Resistance
The basic principle of the linear polarization technique is to determine the corrosion resistance of each sample. This involved the application of a slow potential scan close to the corrosion potential (Φcorr) and the recording polarization current, I. The polarization resistance, Rp, is defined as the slope of a potential-current density plot at the corrosion potential, Φcorr [4].
Rp = (∆V∆I )Φcorr (1)
Where ∆V and ∆I are applied potential and current responses, respectively. The test results for pH=6 and 8 solutions are given in Table 7.4.
Table 7.4 - corrosion resistance of tested alloys in pH 6 and pH 8
Alloys Condition
pH 6 (Khoms)
pH 8 (Khoms)
Base 2.89 10.02 Yellow Brass
Refined 4.62 7.40
Base 2.91 7.31 Enviro Brass III
Refined 2.14 7.63
Base 1.28 3.87 Silicon Bronze
Refined 1.92 3.03
Base 2.12 3.82 Silicon Brass
Refined 1.39 4.06
For the purpose of easy comparison, the linear polarization results are also summarized in Figures 7.4 and 7.5 for pH 6 and 8 solutions, respectively. The corrosion resistance data reveal again insignificant differences between the base and refined alloys. It appears that the base and refined alloys have similar corrosion resistance at the given test conditions. The corrosion resistances are normally higher in pH8 than that of in pH6. This is expected, as the copper oxide formation in a high pH solution is more stable and compact than that formed in a low pH solution.
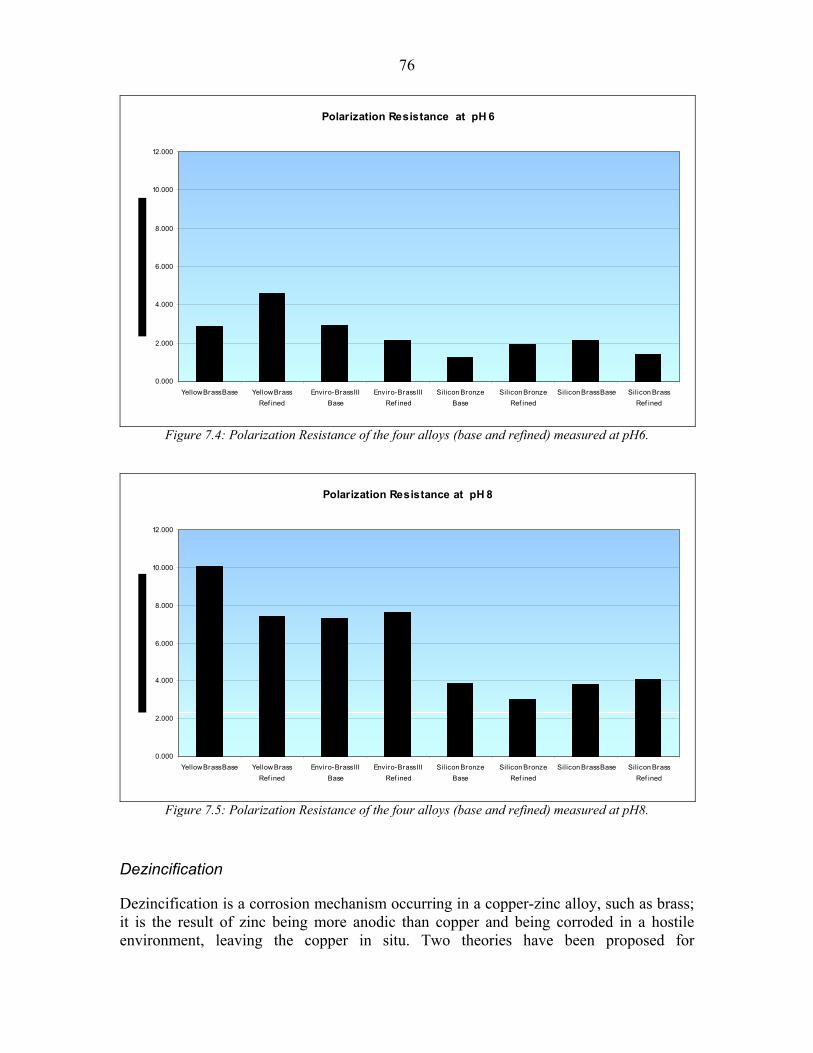
76
Polarization Resistance at pH 6
0.000
2.000
4.000
6.000
8.000
10.000
12.000
Yellow Brass Base Yellow BrassRef ined
Enviro-Brass IIIBase
Enviro-Brass IIIRef ined
Silicon BronzeBase
Silicon BronzeRef ined
Silicon Brass Base Silicon BrassRef ined
Figure 7.4: Polarization Resistance of the four alloys (base and refined) measured at pH6.
Polarization Resistance at pH 8
0.000
2.000
4.000
6.000
8.000
10.000
12.000
Yellow Brass Base Yellow BrassRef ined
Enviro-Brass IIIBase
Enviro-Brass IIIRef ined
Silicon BronzeBase
Silicon BronzeRef ined
Silicon Brass Base Silicon BrassRef ined
Figure 7.5: Polarization Resistance of the four alloys (base and refined) measured at pH8.
Dezincification
Dezincification is a corrosion mechanism occurring in a copper-zinc alloy, such as brass; it is the result of zinc being more anodic than copper and being corroded in a hostile environment, leaving the copper in situ. Two theories have been proposed for
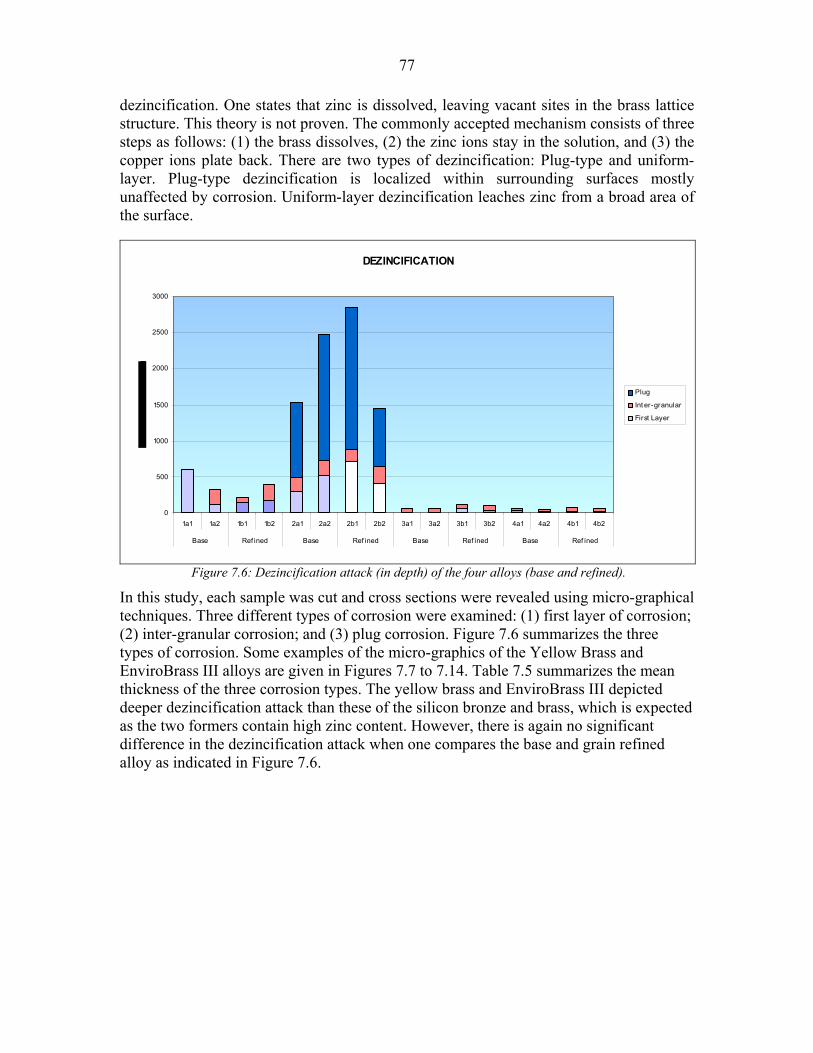
77
dezincification. One states that zinc is dissolved, leaving vacant sites in the brass lattice structure. This theory is not proven. The commonly accepted mechanism consists of three steps as follows: (1) the brass dissolves, (2) the zinc ions stay in the solution, and (3) the copper ions plate back. There are two types of dezincification: Plug-type and uniform-layer. Plug-type dezincification is localized within surrounding surfaces mostly unaffected by corrosion. Uniform-layer dezincification leaches zinc from a broad area of the surface.
DEZINCIFICATION
0
500
1000
1500
2000
2500
3000
1a1 1a2 1b1 1b2 2a1 2a2 2b1 2b2 3a1 3a2 3b1 3b2 4a1 4a2 4b1 4b2
Base Ref ined Base Ref ined Base Ref ined Base Ref ined
Plug
Int er-granular
Figure 7.6: Dezincification attack (in depth) of the four alloys (base and refined).
First Layer
In this study, each sample was cut and cross sections were revealed using micro-graphical techniques. Three different types of corrosion were examined: (1) first layer of corrosion; (2) inter-granular corrosion; and (3) plug corrosion. Figure 7.6 summarizes the three types of corrosion. Some examples of the micro-graphics of the Yellow Brass and EnviroBrass III alloys are given in Figures 7.7 to 7.14. Table 7.5 summarizes the mean thickness of the three corrosion types. The yellow brass and EnviroBrass III depicted deeper dezincification attack than these of the silicon bronze and brass, which is expected as the two formers contain high zinc content. However, there is again no significant difference in the dezincification attack when one compares the base and grain refined alloy as indicated in Figure 7.6.
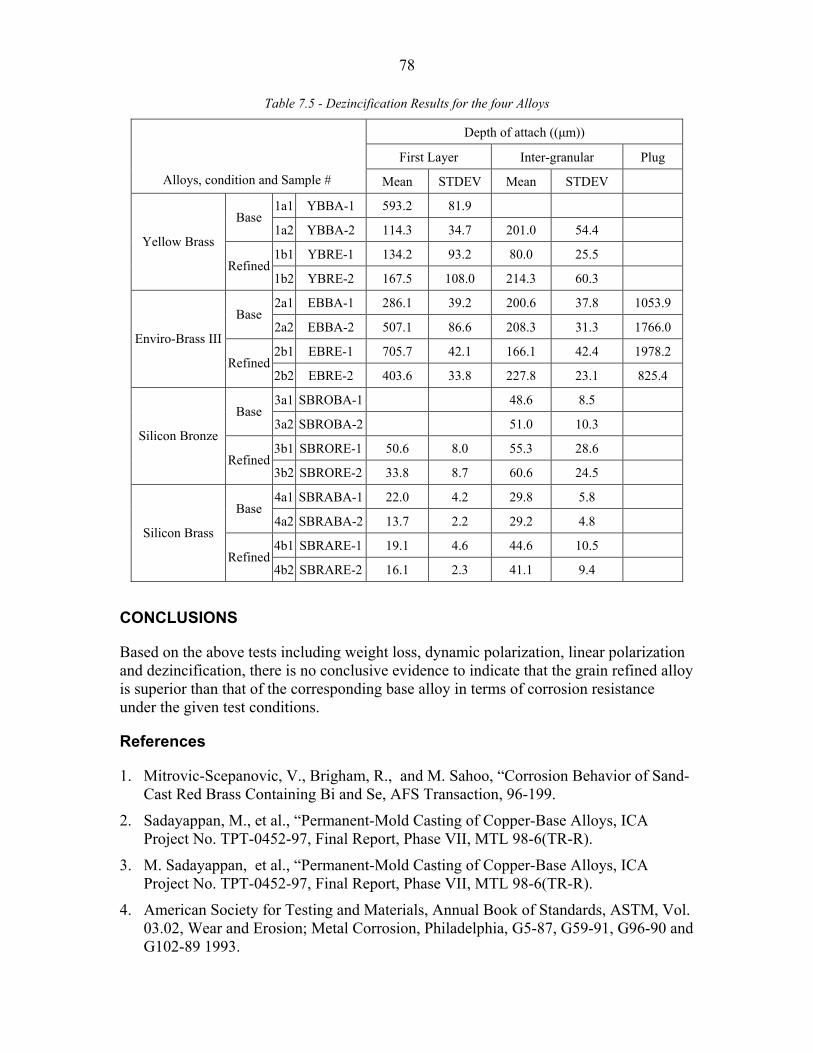
78
Table 7.5 - Dezincification Results for the four Alloys
Depth of attach ((µm))
First Layer Inter-granular Plug
Alloys, condition and Sample # Mean STDEV Mean STDEV
1a1 YBBA-1 593.2 81.9 Base
1a2 YBBA-2 114.3 34.7 201.0 54.4
1b1 YBRE-1 134.2 93.2 80.0 25.5 Yellow Brass
Refined 1b2 YBRE-2 167.5 108.0 214.3 60.3
2a1 EBBA-1 286.1 39.2 200.6 37.8 1053.9 Base
2a2 EBBA-2 507.1 86.6 208.3 31.3 1766.0
2b1 EBRE-1 705.7 42.1 166.1 42.4 1978.2 Enviro-Brass III
Refined 2b2 EBRE-2 403.6 33.8 227.8 23.1 825.4
3a1 SBROBA-1 48.6 8.5 Base
3a2 SBROBA-2 51.0 10.3
3b1 SBRORE-1 50.6 8.0 55.3 28.6 Silicon Bronze
Refined 3b2 SBRORE-2 33.8 8.7 60.6 24.5
4a1 SBRABA-1 22.0 4.2 29.8 5.8 Base
4a2 SBRABA-2 13.7 2.2 29.2 4.8
4b1 SBRARE-1 19.1 4.6 44.6 10.5 Silicon Brass
Refined 4b2 SBRARE-2 16.1 2.3 41.1 9.4
CONCLUSIONS
Based on the above tests including weight loss, dynamic polarization, linear polarization and dezincification, there is no conclusive evidence to indicate that the grain refined alloy is superior than that of the corresponding base alloy in terms of corrosion resistance under the given test conditions.
References
1. Mitrovic-Scepanovic, V., Brigham, R., and M. Sahoo, “Corrosion Behavior of Sand-Cast Red Brass Containing Bi and Se, AFS Transaction, 96-199.
2. Sadayappan, M., et al., “Permanent-Mold Casting of Copper-Base Alloys, ICA Project No. TPT-0452-97, Final Report, Phase VII, MTL 98-6(TR-R).
3. M. Sadayappan, et al., “Permanent-Mold Casting of Copper-Base Alloys, ICA Project No. TPT-0452-97, Final Report, Phase VII, MTL 98-6(TR-R).
4. American Society for Testing and Materials, Annual Book of Standards, ASTM, Vol. 03.02, Wear and Erosion; Metal Corrosion, Philadelphia, G5-87, G59-91, G96-90 and G102-89 1993.

79
Figure 7.7: Cross section of corrosion layers of Yellow Brass (base), sample #1, after
dezincification test.
Figure 7.8: Cross section of corrosion layers of Yellow Brass (base), sample #2, after
dezincification test.
Figure 7.9: Cross section of the matrix of Yellow Brass (base), sample #2, after dezincification test.
Figure 7.10: Cross section of corrosion layers of Yellow Brass (refined), sample #1, after
dezincification test.
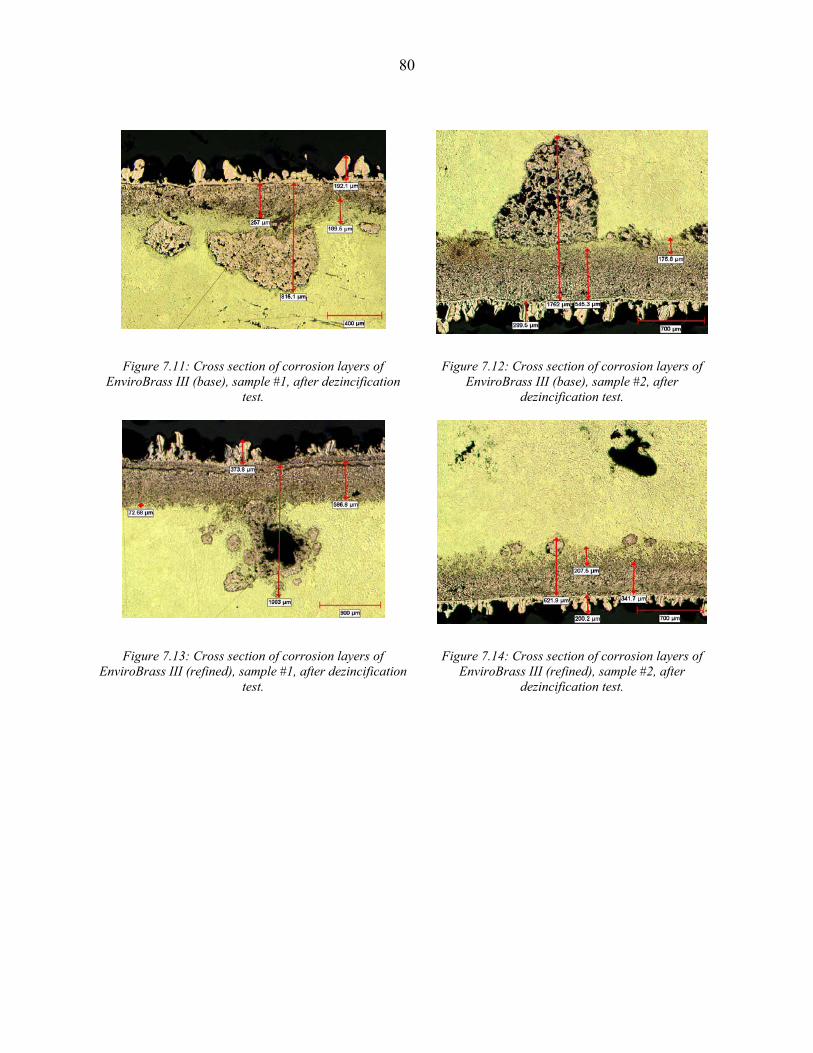
80
Figure 7.11: Cross section of corrosion layers of EnviroBrass III (base), sample #1, after dezincification
test.
Figure 7.12: Cross section of corrosion layers of EnviroBrass III (base), sample #2, after
dezincification test.
Figure 7.13: Cross section of corrosion layers of EnviroBrass III (refined), sample #1, after dezincification
test.
Figure 7.14: Cross section of corrosion layers of EnviroBrass III (refined), sample #2, after
dezincification test.

81
SECTION 8
TECHNOLOGY TRANSFER

82
Introduction
The thermal analysis technique developed in the lab could be used as an on-line process control tool in the foundry. To achieve this goal, trials were conducted in two foundries using the equipment and test set-up used in the lab. The aim of the investigation is to test the robustness of the set-up and prove the assumptions made during the development of the process.
Background
The data acquisition system, along with the software package was purchased from Foundry Information Systems. The graphite sample cup and brass stand were designed at CANMET-MTL. A typical test procedure is as follows:
• The liquid metal is scooped out of the melt using the sample cup and placed on the brass plate
• The thermocouple is placed in the liquid metal to record the solidification.
• The cooling curve is logged using the data acquisition system and displayed on the lap-top computer screen.
• The set up is shown in Figure 8.1. The data was validated later by sectioning and etching the sample in the lab.
Figure 8.1 - Equipment used for the experiments.
The thermal analysis method was tested in two foundries using yellow brass (leaded and lead-free alloys) for permanent mold cast components. Foundry I, conducts grain refinement in-house by adding commercial grain refiner. The usual procedure for the
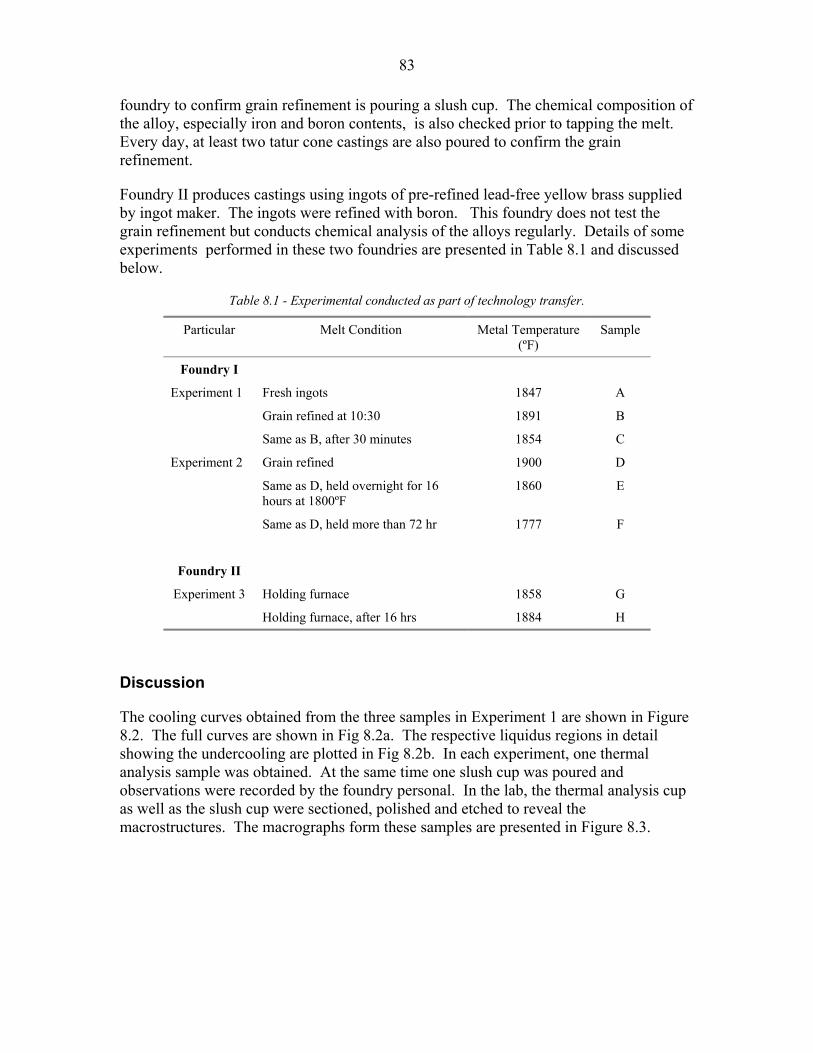
83
foundry to confirm grain refinement is pouring a slush cup. The chemical composition of the alloy, especially iron and boron contents, is also checked prior to tapping the melt. Every day, at least two tatur cone castings are also poured to confirm the grain refinement.
Foundry II produces castings using ingots of pre-refined lead-free yellow brass supplied by ingot maker. The ingots were refined with boron. This foundry does not test the grain refinement but conducts chemical analysis of the alloys regularly. Details of some experiments performed in these two foundries are presented in Table 8.1 and discussed below.
Table 8.1 - Experimental conducted as part of technology transfer.
Particular Melt Condition Metal Temperature (ºF)
Sample
Foundry I
Experiment 1 Fresh ingots 1847 A
Grain refined at 10:30 1891 B
Same as B, after 30 minutes 1854 C
Experiment 2 Grain refined 1900 D
Same as D, held overnight for 16 hours at 1800ºF
1860 E
Same as D, held more than 72 hr 1777 F
Foundry II
Experiment 3 Holding furnace 1858 G
Holding furnace, after 16 hrs 1884 H
Discussion
The cooling curves obtained from the three samples in Experiment 1 are shown in Figure 8.2. The full curves are shown in Fig 8.2a. The respective liquidus regions in detail showing the undercooling are plotted in Fig 8.2b. In each experiment, one thermal analysis sample was obtained. At the same time one slush cup was poured and observations were recorded by the foundry personal. In the lab, the thermal analysis cup as well as the slush cup were sectioned, polished and etched to reveal the macrostructures. The macrographs form these samples are presented in Figure 8.3.
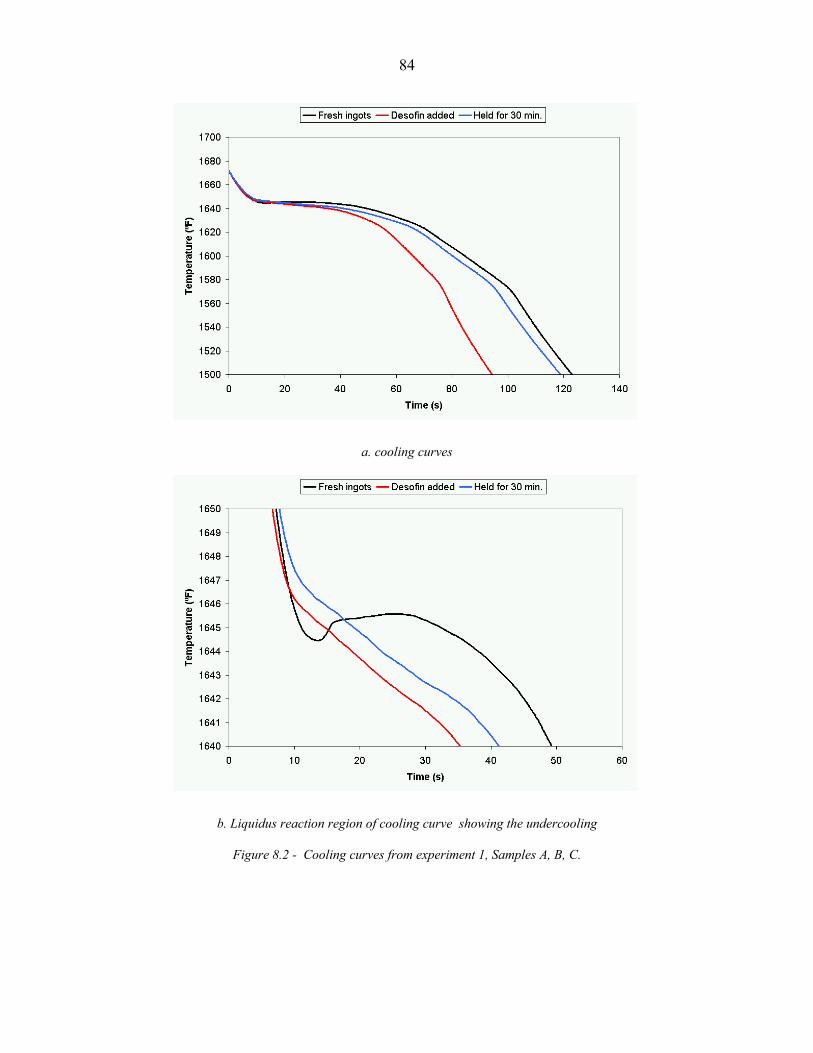
84
a. cooling curves
b. Liquidus reaction region of cooling curve showing the undercooling
Figure 8.2 - Cooling curves from experiment 1, Samples A, B, C.

85
a. Fresh ingots
b. Desofin added
c. Held for 30 minutes
Figure 8.3 - Macrostructures of thermal analysis cups and slush cups, experiment 1.
Samples A, B, C; Etch: 50% nitric acid, 50% water
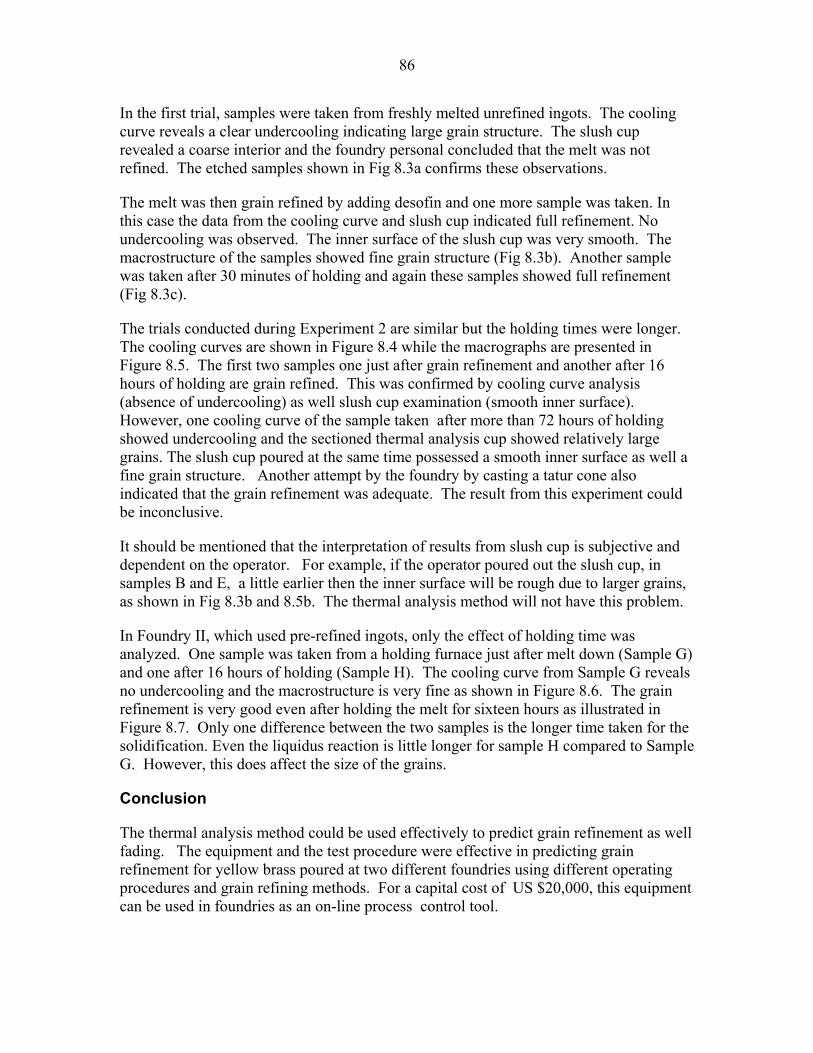
86
In the first trial, samples were taken from freshly melted unrefined ingots. The cooling curve reveals a clear undercooling indicating large grain structure. The slush cup revealed a coarse interior and the foundry personal concluded that the melt was not refined. The etched samples shown in Fig 8.3a confirms these observations.
The melt was then grain refined by adding desofin and one more sample was taken. In this case the data from the cooling curve and slush cup indicated full refinement. No undercooling was observed. The inner surface of the slush cup was very smooth. The macrostructure of the samples showed fine grain structure (Fig 8.3b). Another sample was taken after 30 minutes of holding and again these samples showed full refinement (Fig 8.3c).
The trials conducted during Experiment 2 are similar but the holding times were longer. The cooling curves are shown in Figure 8.4 while the macrographs are presented in Figure 8.5. The first two samples one just after grain refinement and another after 16 hours of holding are grain refined. This was confirmed by cooling curve analysis (absence of undercooling) as well slush cup examination (smooth inner surface). However, one cooling curve of the sample taken after more than 72 hours of holding showed undercooling and the sectioned thermal analysis cup showed relatively large grains. The slush cup poured at the same time possessed a smooth inner surface as well a fine grain structure. Another attempt by the foundry by casting a tatur cone also indicated that the grain refinement was adequate. The result from this experiment could be inconclusive.
It should be mentioned that the interpretation of results from slush cup is subjective and dependent on the operator. For example, if the operator poured out the slush cup, in samples B and E, a little earlier then the inner surface will be rough due to larger grains, as shown in Fig 8.3b and 8.5b. The thermal analysis method will not have this problem.
In Foundry II, which used pre-refined ingots, only the effect of holding time was analyzed. One sample was taken from a holding furnace just after melt down (Sample G) and one after 16 hours of holding (Sample H). The cooling curve from Sample G reveals no undercooling and the macrostructure is very fine as shown in Figure 8.6. The grain refinement is very good even after holding the melt for sixteen hours as illustrated in Figure 8.7. Only one difference between the two samples is the longer time taken for the solidification. Even the liquidus reaction is little longer for sample H compared to Sample G. However, this does affect the size of the grains.
Conclusion
The thermal analysis method could be used effectively to predict grain refinement as well fading. The equipment and the test procedure were effective in predicting grain refinement for yellow brass poured at two different foundries using different operating procedures and grain refining methods. For a capital cost of US $20,000, this equipment can be used in foundries as an on-line process control tool.
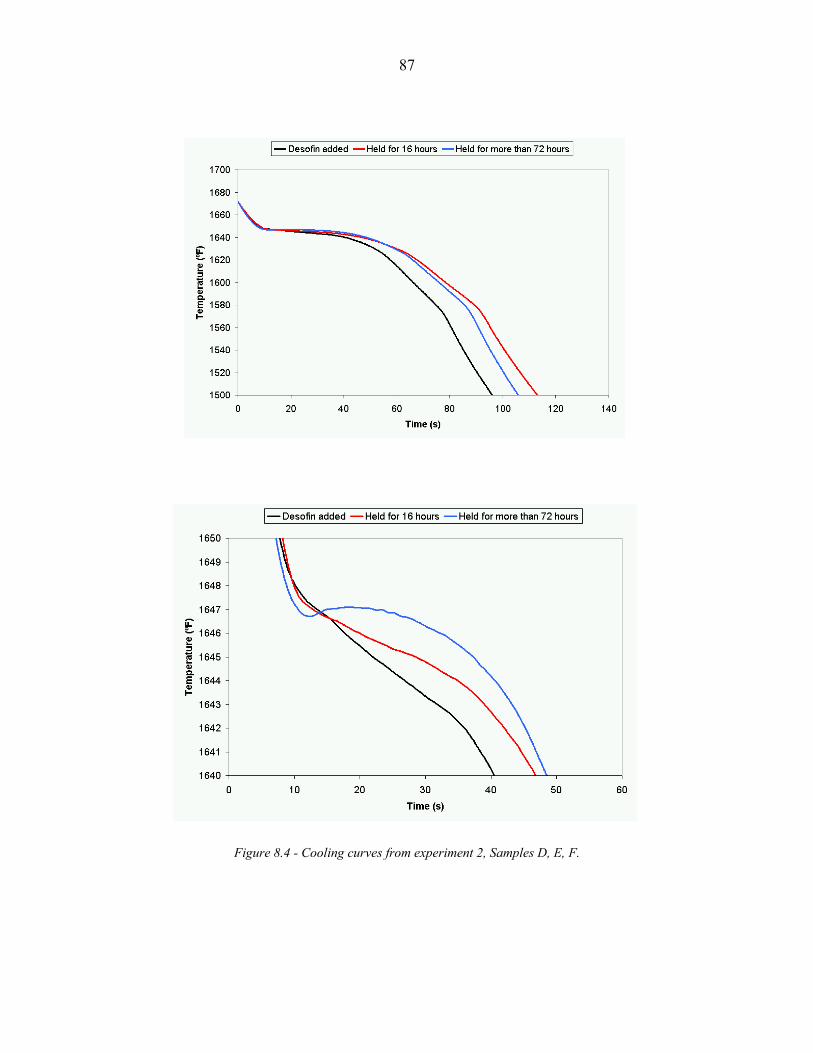
87
Figure 8.4 - Cooling curves from experiment 2, Samples D, E, F.
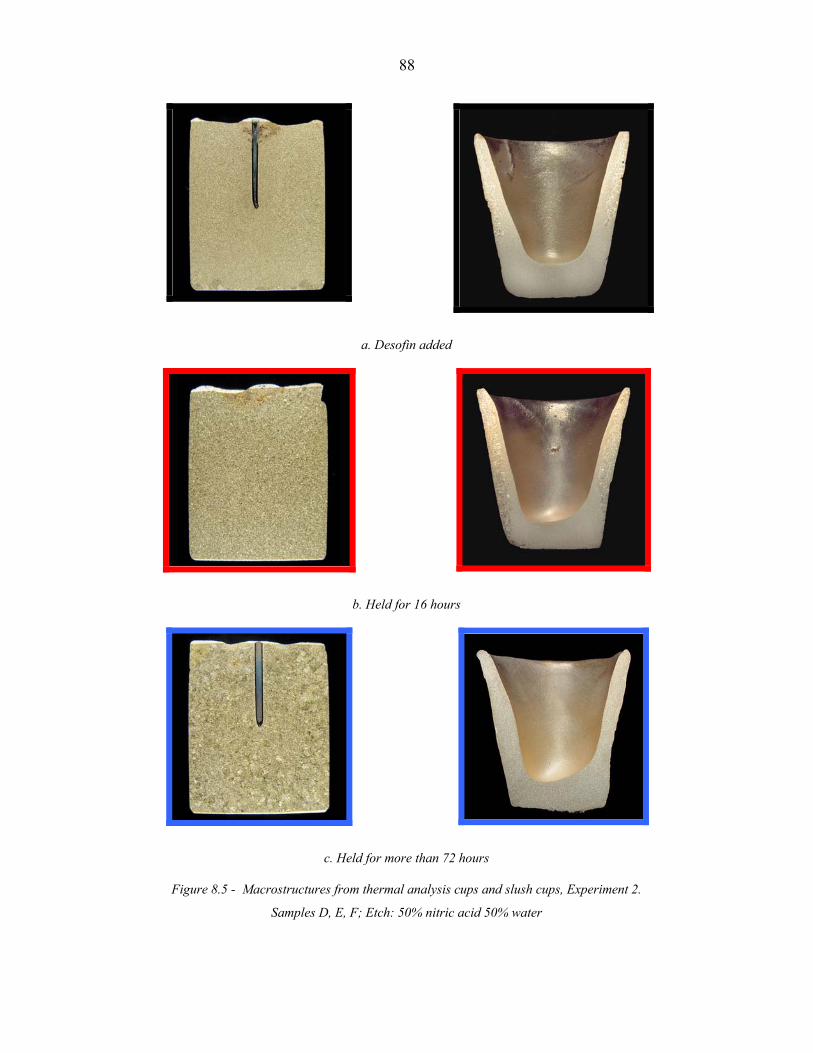
88
a. Desofin added
b. Held for 16 hours
c. Held for more than 72 hours
Figure 8.5 - Macrostructures from thermal analysis cups and slush cups, Experiment 2.
Samples D, E, F; Etch: 50% nitric acid 50% water

89
a. cooling curve
Figure 8.6 -Cooling curve from sample G and resulting macrostructure from the sample (bottom right).
90
Figure 8.7 - Cooling curve from sample H showing entire solidification (top), a close up of the liquidus reaction (bottom), and the resulting macrostructure from the sample taken (bottom right).

A-i
APPENDIX
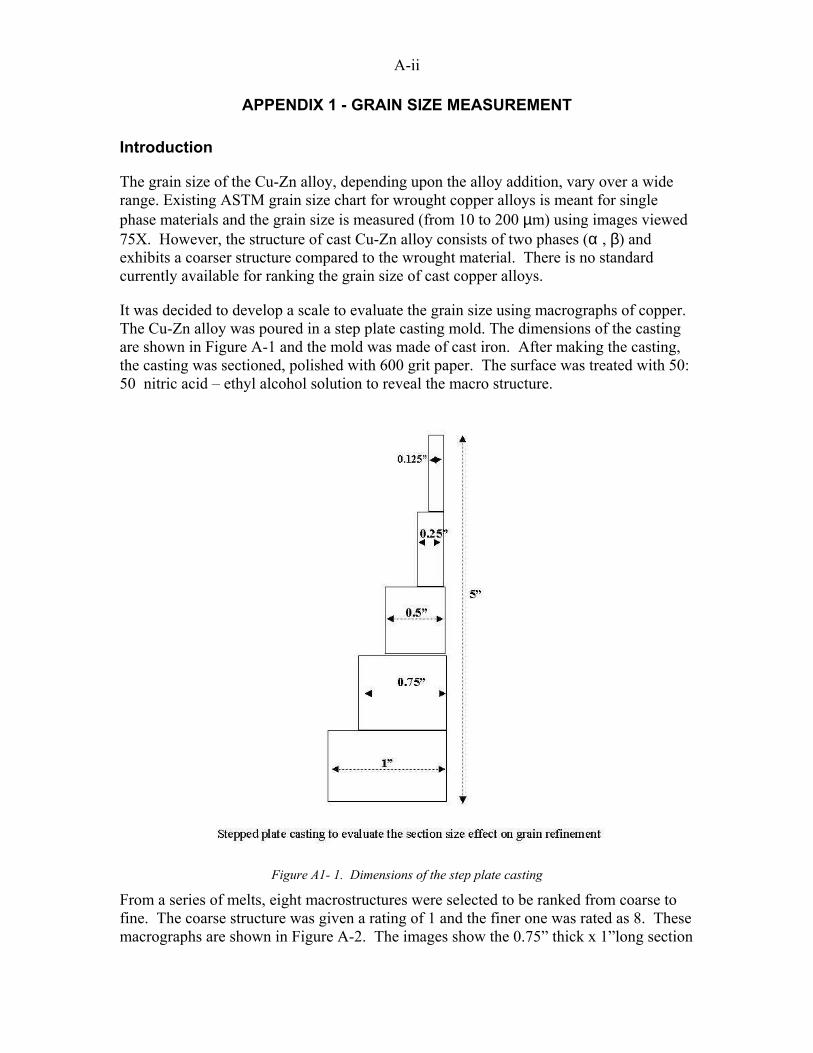
A-ii
APPENDIX 1 - GRAIN SIZE MEASUREMENT
Introduction
The grain size of the Cu-Zn alloy, depending upon the alloy addition, vary over a wide range. Existing ASTM grain size chart for wrought copper alloys is meant for single phase materials and the grain size is measured (from 10 to 200 µm) using images viewed 75X. However, the structure of cast Cu-Zn alloy consists of two phases (α , β) and exhibits a coarser structure compared to the wrought material. There is no standard currently available for ranking the grain size of cast copper alloys.
It was decided to develop a scale to evaluate the grain size using macrographs of copper. The Cu-Zn alloy was poured in a step plate casting mold. The dimensions of the casting are shown in Figure A-1 and the mold was made of cast iron. After making the casting, the casting was sectioned, polished with 600 grit paper. The surface was treated with 50: 50 nitric acid – ethyl alcohol solution to reveal the macro structure.
Figure A1- 1. Dimensions of the step plate casting
From a series of melts, eight macrostructures were selected to be ranked from coarse to fine. The coarse structure was given a rating of 1 and the finer one was rated as 8. These macrographs are shown in Figure A-2. The images show the 0.75” thick x 1”long section

A-iii
of the step plate casting (representing a magnification of 2.5 times). It should be noted that the chart does not measure the actual size of the grains but only a relative scale.
Figure A1-2. Scale of macrostructure (50% Nital etch)

A-iv
Later using image analysis technique the absolute grain sizes were measured. The coarser grains (size 1) measured approximately 3000 µm and the finer size (size 8) be of the order of 100 µm. This scale covers much wider range than the current ASTM chart and could be used for castings more effectively.
The rating procedure was as follows; The castings were etched; the etched surfaces revealing the macrostructure were assessed by three operators and rated; the ratings were averaged. A typical rating for one melt is presented in Table A-1. The base alloy, casting 1, has a rating of 1.3 indicating that the grain size falls between size 1 and size 2. As the boron content was increased from 0.002% (20 ppm) to 0.026% (260) ppm the structure got refined progressively. The grain size of casting 5 has a rating of 6.2 which is finer than size 6 but coarser than size 7 shown in Figure A-2. This rating procedure was repeated for all the melts produced.
Table A1-1. Macrostructure of Cu-36% Zn alloy
Grain size rating Melt Casting # Addition Zn B, %
I R J Aver.
1 Base 35.3 0 1 1 2 1.3
2 50 gm Cu-B 35.1 0.002 2 2 2.5 2.2
3 25 gm Cu-B 34.2 0.003 2 1.5 2 1.8
4 50 gm Cu-B 31.7 0.005 3 3 3 3.0
N0017
5 400 gm Cu-B 33.9 0.026 6 6 6.5 6.2
A-v
APPENDIX 2 - GRAIN SIZE MEASUREMENT
Introduction
The scale developed in this investigation, explained in Appendix 1, was used to measure the grain size of all the castings produced. The procedure for macrostructural examination was also explained in Appendix 1.
Four alloys, yellow brass, EnviroBrass III, silicon bronze and silicon brass, were tested in the project. Two elements, boron and zirconium, were used as grain refiner. Boron was added as Cu-2% B master alloy or a commercial pre-made refiner (FKM 2000 or Desofin). Master alloys such as Cu-50% Zr or Cu-9Zr-9Mg, were used to add zirconium.
The etched samples were examined by three independent operators who ranked the grain size by comparing with the scale. The operators ranked samples from the step plate and shrink bar separately. They were allowed to mark samples in between the scales but restricted to one value 0.5. The three readings were later tabulated and averaged. Most of the time, these values from two different samples confirmed each other but it was not always the case.
The results from the 20 melts carried out to evaluate the grain refiners are listed in the following tables. The discussion regarding these results are in Section 3.

A-vi
Results
Table A2-1 – Grain refinement using Cu-2% B as the refiner
Observation (Step Block) Observation (Shrink Bar)
Melt # Alloy A R J Ave. A R J Ave.
N1017-1 Yellow Brass 6.5 6.5 6.5 6.5 6.5 6.5 6.5 6.5
N1017-2 Yellow Brass 5.5 5 5 5.2 6 4.5 5 5.2
N1017-3 Yellow Brass 5 5.5 6 5.5 4.5 4 4.5 4.3
N1017-4 Yellow Brass 5.5 5.5 4 5 5 4.5 5 4.8
N1017-5 Yellow Brass 6 6.5 6 6.2 6 6 6 6
N1007-1 EnviroBrass III 6.5 6.5 6.5 6.5 6 6.5 6.5 6.3
N1007-2 EnviroBrass III 6.5 5 5 5.5 6.5 6.5 6.5 6.5
N1007-3 EnviroBrass III 5 5 4 4.7 5 4 4 4.3
N1007-4 EnviroBrass III 6.5 7 7 6.8 6.5 6.5 6.5 6.5
N1007-5 EnviroBrass III 8 8 7.5 7.8 8 8 8 8
N1008-1 Silicon Bronze 7 7 7 7 7 7.5 7.5 7.3
N1008-2 Silicon Bronze 6 6.5 6.5 6.3 6 6.5 6.5 6.3
N1008-3 Silicon Bronze 6.5 6.5 6.5 6.5 6 6 6.5 6.2
N1008-4 Silicon Bronze 6 7 6.5 6.5 5 5.5 5.5 5.3
N1008-5 Silicon Bronze 7 8 7.5 7.5 5.5 5.5 6 5.7
N1018-1 Silicon Brass 3.5 3.5 3 3.3 3.5 3.5 3.5 3.5
N1018-2 Silicon Brass 4 3.5 3 3.5 4 3.5 3.5 3.7
N1018-3 Silicon Brass 3 3 3 3 3.5 4 3.5 3.7
N1018-4 Silicon Brass 3.5 3.5 3 3.3 4 3.5 4 3.8
N1018-5 Silicon Brass 3 3.5 3.5 3.3 3.5 3.5 3.5 3.5
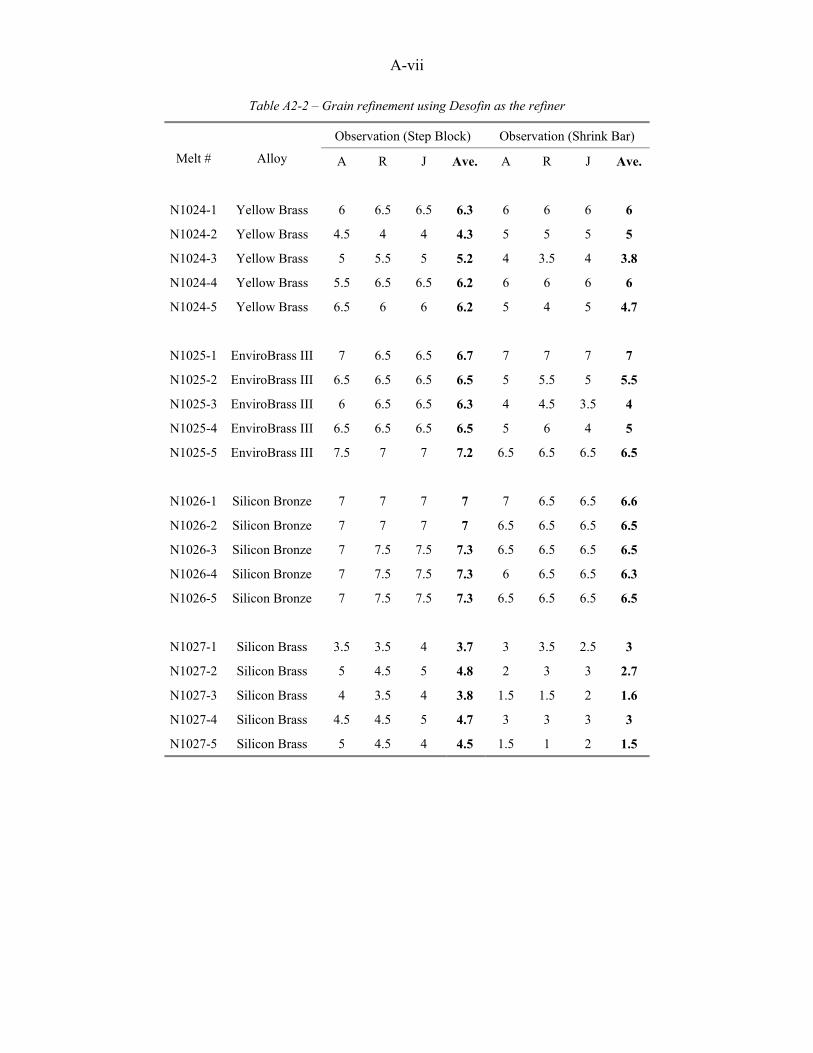
A-vii
Table A2-2 – Grain refinement using Desofin as the refiner
Observation (Step Block) Observation (Shrink Bar)
Melt # Alloy A R J Ave. A R J Ave.
N1024-1 Yellow Brass 6 6.5 6.5 6.3 6 6 6 6
N1024-2 Yellow Brass 4.5 4 4 4.3 5 5 5 5
N1024-3 Yellow Brass 5 5.5 5 5.2 4 3.5 4 3.8
N1024-4 Yellow Brass 5.5 6.5 6.5 6.2 6 6 6 6
N1024-5 Yellow Brass 6.5 6 6 6.2 5 4 5 4.7
N1025-1 EnviroBrass III 7 6.5 6.5 6.7 7 7 7 7
N1025-2 EnviroBrass III 6.5 6.5 6.5 6.5 5 5.5 5 5.5
N1025-3 EnviroBrass III 6 6.5 6.5 6.3 4 4.5 3.5 4
N1025-4 EnviroBrass III 6.5 6.5 6.5 6.5 5 6 4 5
N1025-5 EnviroBrass III 7.5 7 7 7.2 6.5 6.5 6.5 6.5
N1026-1 Silicon Bronze 7 7 7 7 7 6.5 6.5 6.6
N1026-2 Silicon Bronze 7 7 7 7 6.5 6.5 6.5 6.5
N1026-3 Silicon Bronze 7 7.5 7.5 7.3 6.5 6.5 6.5 6.5
N1026-4 Silicon Bronze 7 7.5 7.5 7.3 6 6.5 6.5 6.3
N1026-5 Silicon Bronze 7 7.5 7.5 7.3 6.5 6.5 6.5 6.5
N1027-1 Silicon Brass 3.5 3.5 4 3.7 3 3.5 2.5 3
N1027-2 Silicon Brass 5 4.5 5 4.8 2 3 3 2.7
N1027-3 Silicon Brass 4 3.5 4 3.8 1.5 1.5 2 1.6
N1027-4 Silicon Brass 4.5 4.5 5 4.7 3 3 3 3
N1027-5 Silicon Brass 5 4.5 4 4.5 1.5 1 2 1.5

A-viii
Table A2-3 – Grain refinement using FKM 2000 as the refiner
Observation (Step Block) Observation (Shrink Bar)
Melt # Alloy A R J Ave. A R J Ave.
N1032-1 Yellow Brass 6 5.5 5 5.5 6.5 6 6 6.2
N1032-2 Yellow Brass 4.5 4 4 4.2 4 4 4 4
N1032-3 Yellow Brass 5.5 5.5 5 5.3 6 6 6 6
N1032-4 Yellow Brass 7.5 7.5 7 7.3 8 8 8 8
N1032-5 Yellow Brass 7.5 7.5 7 7.3 8 8 8 8
N1033-1 EnviroBrass III 6.5 6.5 7 6.7 7 7 7 7
N1033-2 EnviroBrass III 4 5 4 4.3 6.5 6.5 6 6.3
N1033-3 EnviroBrass III 6.5 6.5 6.5 6.5 7 7 6.5 6.8
N1033-4 EnviroBrass III 7.5 7.5 7.5 7.5 8 8 8 8
N1033-5 EnviroBrass III 8 8 8 8 8 8.5 8 8.2
N1034-1 Silicon Bronze 7 7 7 7 6 6.5 6.5 6.3
N1034-2 Silicon Bronze 7 7 7 7 5 5 7 5.7
N1034-3 Silicon Bronze 7 7 6.5 7.9 6 6.5 6.5 6.3
N1034-4 Silicon Bronze 7 7 6.5 7.9 7 6.5 6 6.5
N1034-5 Silicon Bronze 7 7.5 7 7.2 6.5 6.5 6.5 6.5
N1035-1 Silicon Brass 6.5 6.5 6 6.3 5 4 5 4.7
N1035-2 Silicon Brass 6 6 6 6 4 3.5 5 4.2
N1035-3 Silicon Brass 5.5 6 6 5.9 3 2.5 3.5 3
N1035-4 Silicon Brass 5 5.5 5.5 5.3 3.5 3.5 4 3.7
N1035-5 Silicon Brass 5 6 6 5.7 4.5 4.5 5 5.7
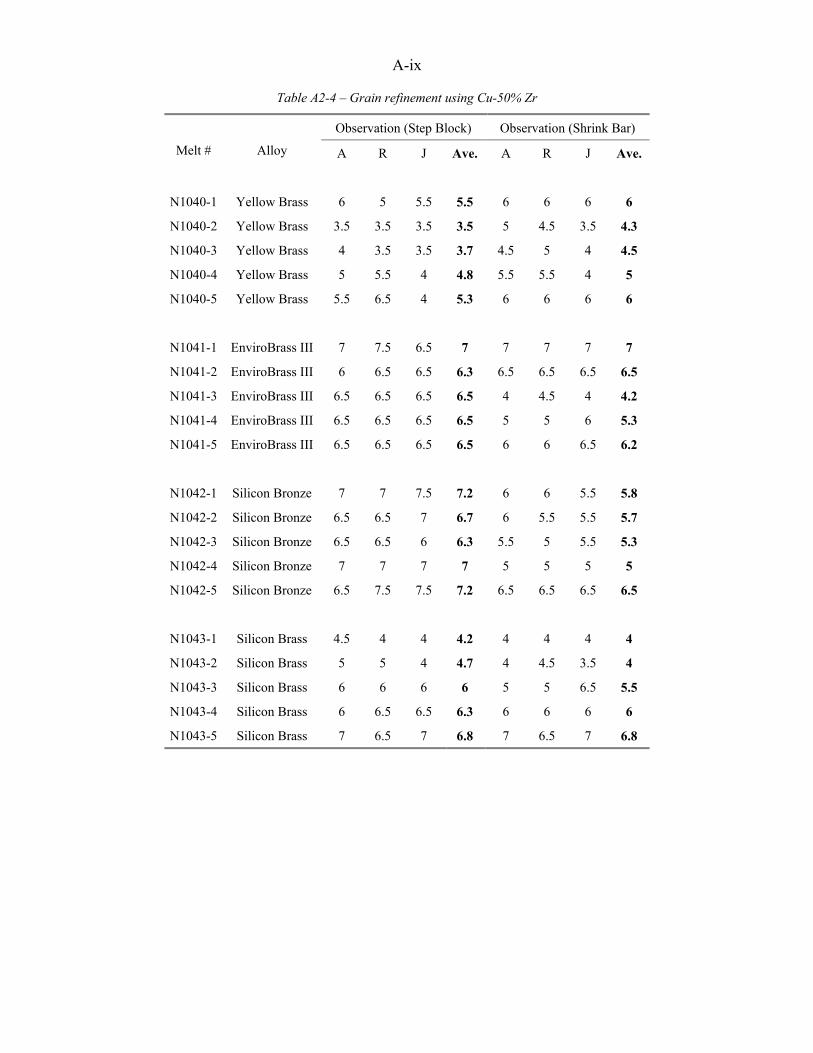
A-ix
Table A2-4 – Grain refinement using Cu-50% Zr
Observation (Step Block) Observation (Shrink Bar)
Melt # Alloy A R J Ave. A R J Ave.
N1040-1 Yellow Brass 6 5 5.5 5.5 6 6 6 6
N1040-2 Yellow Brass 3.5 3.5 3.5 3.5 5 4.5 3.5 4.3
N1040-3 Yellow Brass 4 3.5 3.5 3.7 4.5 5 4 4.5
N1040-4 Yellow Brass 5 5.5 4 4.8 5.5 5.5 4 5
N1040-5 Yellow Brass 5.5 6.5 4 5.3 6 6 6 6
N1041-1 EnviroBrass III 7 7.5 6.5 7 7 7 7 7
N1041-2 EnviroBrass III 6 6.5 6.5 6.3 6.5 6.5 6.5 6.5
N1041-3 EnviroBrass III 6.5 6.5 6.5 6.5 4 4.5 4 4.2
N1041-4 EnviroBrass III 6.5 6.5 6.5 6.5 5 5 6 5.3
N1041-5 EnviroBrass III 6.5 6.5 6.5 6.5 6 6 6.5 6.2
N1042-1 Silicon Bronze 7 7 7.5 7.2 6 6 5.5 5.8
N1042-2 Silicon Bronze 6.5 6.5 7 6.7 6 5.5 5.5 5.7
N1042-3 Silicon Bronze 6.5 6.5 6 6.3 5.5 5 5.5 5.3
N1042-4 Silicon Bronze 7 7 7 7 5 5 5 5
N1042-5 Silicon Bronze 6.5 7.5 7.5 7.2 6.5 6.5 6.5 6.5
N1043-1 Silicon Brass 4.5 4 4 4.2 4 4 4 4
N1043-2 Silicon Brass 5 5 4 4.7 4 4.5 3.5 4
N1043-3 Silicon Brass 6 6 6 6 5 5 6.5 5.5
N1043-4 Silicon Brass 6 6.5 6.5 6.3 6 6 6 6
N1043-5 Silicon Brass 7 6.5 7 6.8 7 6.5 7 6.8
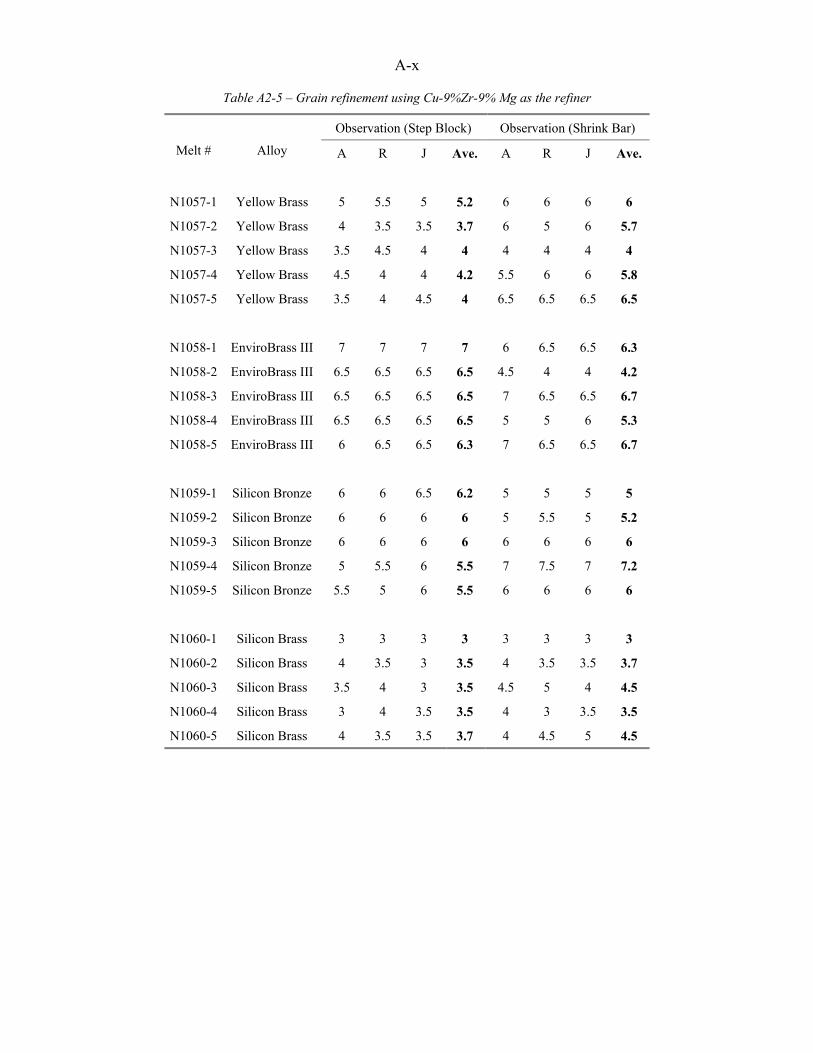
A-x
Table A2-5 – Grain refinement using Cu-9%Zr-9% Mg as the refiner
Observation (Step Block) Observation (Shrink Bar)
Melt # Alloy A R J Ave. A R J Ave.
N1057-1 Yellow Brass 5 5.5 5 5.2 6 6 6 6
N1057-2 Yellow Brass 4 3.5 3.5 3.7 6 5 6 5.7
N1057-3 Yellow Brass 3.5 4.5 4 4 4 4 4 4
N1057-4 Yellow Brass 4.5 4 4 4.2 5.5 6 6 5.8
N1057-5 Yellow Brass 3.5 4 4.5 4 6.5 6.5 6.5 6.5
N1058-1 EnviroBrass III 7 7 7 7 6 6.5 6.5 6.3
N1058-2 EnviroBrass III 6.5 6.5 6.5 6.5 4.5 4 4 4.2
N1058-3 EnviroBrass III 6.5 6.5 6.5 6.5 7 6.5 6.5 6.7
N1058-4 EnviroBrass III 6.5 6.5 6.5 6.5 5 5 6 5.3
N1058-5 EnviroBrass III 6 6.5 6.5 6.3 7 6.5 6.5 6.7
N1059-1 Silicon Bronze 6 6 6.5 6.2 5 5 5 5
N1059-2 Silicon Bronze 6 6 6 6 5 5.5 5 5.2
N1059-3 Silicon Bronze 6 6 6 6 6 6 6 6
N1059-4 Silicon Bronze 5 5.5 6 5.5 7 7.5 7 7.2
N1059-5 Silicon Bronze 5.5 5 6 5.5 6 6 6 6
N1060-1 Silicon Brass 3 3 3 3 3 3 3 3
N1060-2 Silicon Brass 4 3.5 3 3.5 4 3.5 3.5 3.7
N1060-3 Silicon Brass 3.5 4 3 3.5 4.5 5 4 4.5
N1060-4 Silicon Brass 3 4 3.5 3.5 4 3 3.5 3.5
N1060-5 Silicon Brass 4 3.5 3.5 3.7 4 4.5 5 4.5
A-xi
APPENDIX 3 - IMAGES FROM CORROSION EXPERIMENTS
Part 1: Weight loss
Figure A3 - 1: Weight loss graph of Yellow Brass (base and refined) at pH 6 & pH 8.
Figure A3 - 2: Weight loss graph of Silicon Bronze (base and refined) at pH 6 & pH 8.
Figure A3 - 3: Weight loss graph of Silicon Brass (base and refined) at pH 6 & pH 8.
Part II: Potentio-dynamic Polarization
Figure A3 - 4: Potential dynamic polarization of Yellow Brass (Base) at pH = 6 solution.
Figure A3- 5: Potential dynamic polarization of Yellow Brass (Refined) at pH = 6 solution.
Figure A3 - 6: Potential dynamic polarization of Silicon Bronze (Base) at pH = 6 solution.
Figure A3 - 7: Potential dynamic polarization of Silicon Bronze (Refined) at pH = 6 solution.
Figure A3 - 8: Potential dynamic polarization of Silicon Brass (Base) at pH = 6 solution.
Figure A3 - 9: Potential dynamic polarization of Silicon Brass (Refined) at pH = 6 solution.
Figure A3 - 10: Potential dynamic polarization of Yellow Brass (Base) at pH = 8 solution.
Figure A3 - 11: Potential dynamic polarization of Yellow Brass (Refined) at pH = 8 solution.
Figure A3 - 12: Potential dynamic polarization of EnviroBrass III (Base) at pH = 8 solution.
Figure A3 - 13: Potential dynamic polarization of EnviroBrass III (Refined) at pH = 8 solution.
Figure A3 - 14: Potential dynamic polarization of Silicon Bronze (Base) at pH = 8 solution.
Figure A3 - 15: Potential dynamic polarization of Silicon Bronze (Refined) at pH = 8 solution.
Figure A3 - 16: Potential dynamic polarization of Silicon Brass (Base) at pH = 8 solution.
A-xii
Figure A3 - 17: Potential dynamic polarization of Silicon Brass (Refined) at pH = 8 solution.
Part III: Dezincification
Figure A3 - 18: Cross sections of Yellow Brass (base) after dezincification test.
Figure A3 - 19: Cross sections of Yellow Brass (refined) after dezincification test.
Figure A3 - 20: Cross sections of EnviroBrass III (base) after dezincification test.
Figure A3 - 21: Cross sections of EnviroBrass III (refined) after dezincification test.
Figure A3 - 22: Cross sections of Silicon Bronze (base) after dezincification test.
Figure A3 - 23: Cross sections of Silicon Bronze (refined) after dezincification test.
Figure A3 - 24: Cross sections of Silicon Brass (base) after dezincification test.
Figure A3 - 25: Cross sections of Silicon Brass (refined) after dezincification test.
Figure A3 - 26: Cross section of corrosion layers of Yellow Brass (refined), sample #1, after dezincification test.
Figure A3 - 27: Cross section of corrosion layers of Yellow Brass (refined), sample #2, after dezincification test.
Figure A3 - 28: Cross section of corrosion layers of Silicon Bronze (base), sample #1, after dezincification test.
Figure A3 - 29: Cross section of corrosion layers of Silicon Bronze (base), sample #2, after dezincification test.
Figure A3 - 30: Cross section of corrosion layers of Silicon Bronze (refined), sample #1, after dezincification test.
Figure A3 - 31: Cross section of corrosion layers of Silicon Bronze (refined), sample #2, after dezincification test.
Figure A3 - 32: Cross section of corrosion layers of Silicon Brass (base), sample #1, after dezincification test.
Figure A3 - 33: Cross section of corrosion layers of Silicon Brass (base), sample #2, after dezincification test.
Figure A3 - 34: Cross section of corrosion layers of Silicon Brass (refined), sample #1, after dezincification test.

A-xiii
Figure A3 - 35: Cross section of corrosion layers of Silicon Brass (refined), sample #2, after dezincification test.

A-xiv
PART 1: WEIGHT LOSS
WEIGHT LOSS OF YELLOW BRASS at pH 6 & pH 8
0.00
0.50
1.00
1.50
2.00
2.50
0 20 40 60 80 100 120 140
TIME (days)
Wei
ght L
oss
(mg
/ cm
2)
Base pH 6
Refined pH 6
Base pH 8
Refined pH 8
Figure A3-1- Weight loss graph of Yellow Brass (base and refined) at pH 6 & pH 8.
WEIGHT LOSS OF SILICON BRONZE at pH 6 & pH 8
0.00
0.50
1.00
1.50
2.00
2.50
0 20 40 60 80 100 120 140
TIME (days)
Wei
ght L
oss
(mg
/ cm
2)
Base pH 6
Refined pH 6
Base pH 8
Refined pH 8
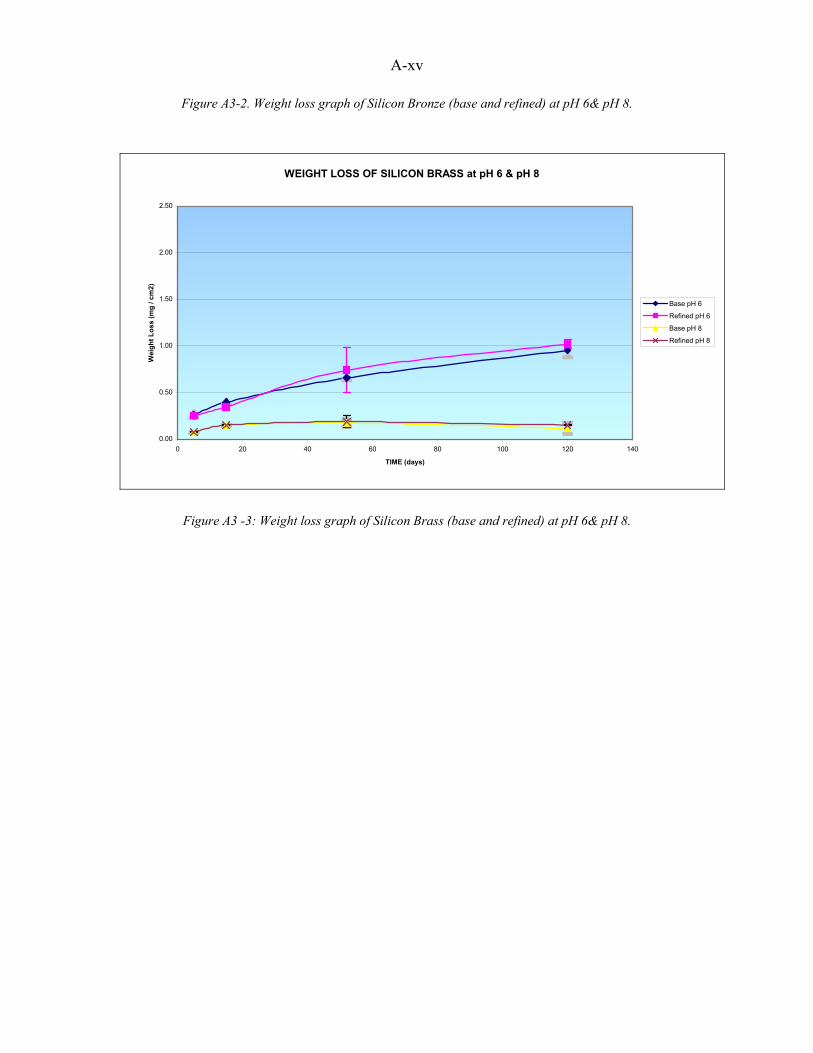
A-xv
Figure A3-2. Weight loss graph of Silicon Bronze (base and refined) at pH 6& pH 8.
WEIGHT LOSS OF SILICON BRASS at pH 6 & pH 8
0.00
0.50
1.00
1.50
2.00
2.50
0 20 40 60 80 100 120 140
TIME (days)
Wei
ght L
oss
(mg
/ cm
2)
Base pH 6
Refined pH 6
Base pH 8
Refined pH 8
Figure A3 -3: Weight loss graph of Silicon Brass (base and refined) at pH 6& pH 8.
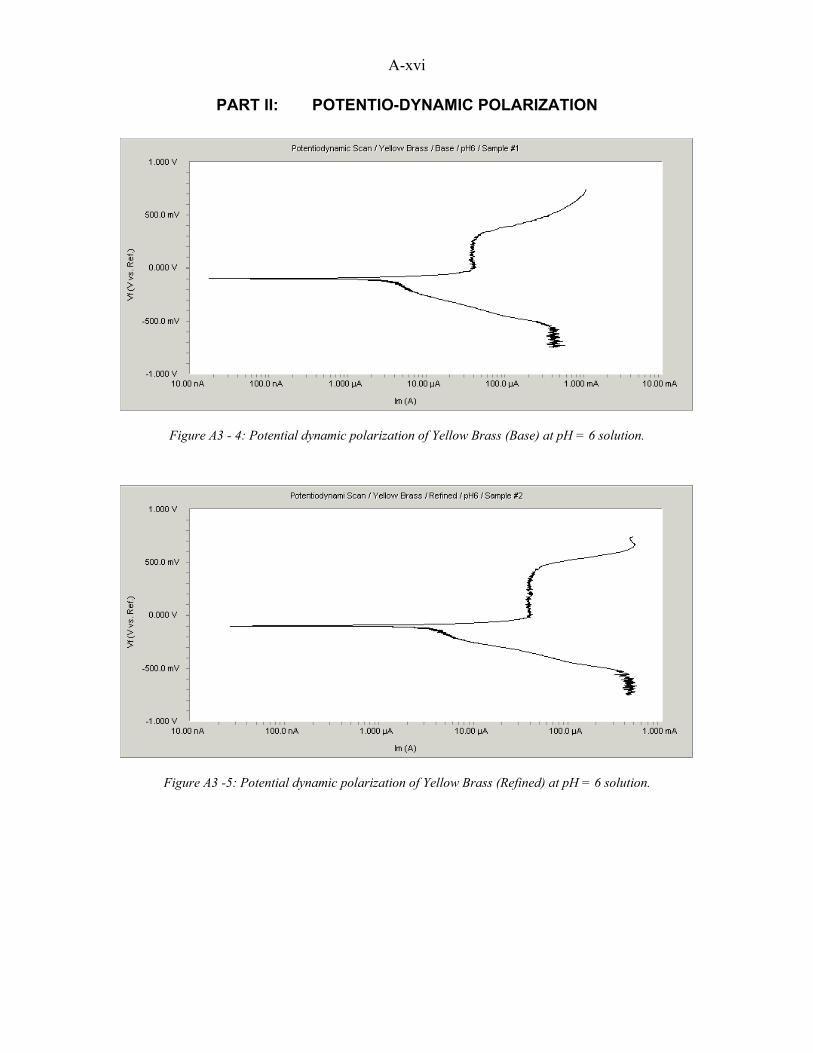
A-xvi
PART II: POTENTIO-DYNAMIC POLARIZATION
Figure A3 - 4: Potential dynamic polarization of Yellow Brass (Base) at pH = 6 solution.
Figure A3 -5: Potential dynamic polarization of Yellow Brass (Refined) at pH = 6 solution.
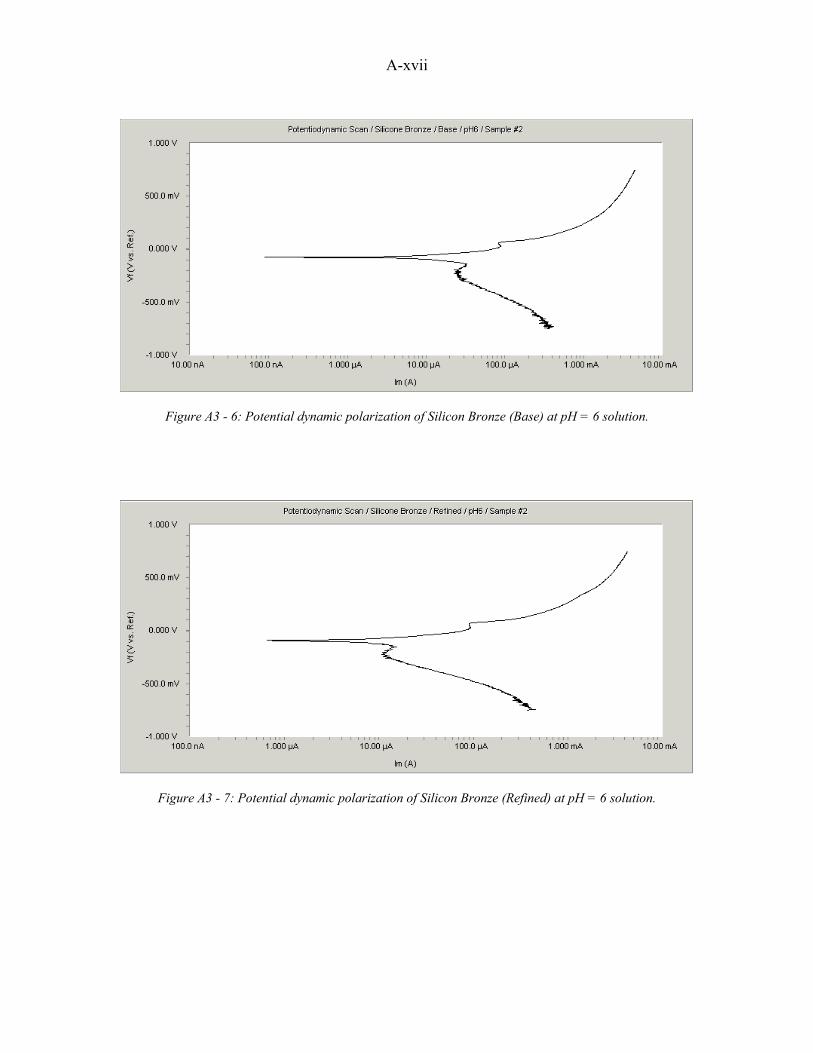
A-xvii
Figure A3 - 6: Potential dynamic polarization of Silicon Bronze (Base) at pH = 6 solution.
Figure A3 - 7: Potential dynamic polarization of Silicon Bronze (Refined) at pH = 6 solution.

A-xviii
Figure A3 - 8: Potential dynamic polarization of Silicon Brass (Base) at pH = 6 solution.
Figure A3 - 9: Potential dynamic polarization of Silicon Brass (Refined) at pH = 6 solution.
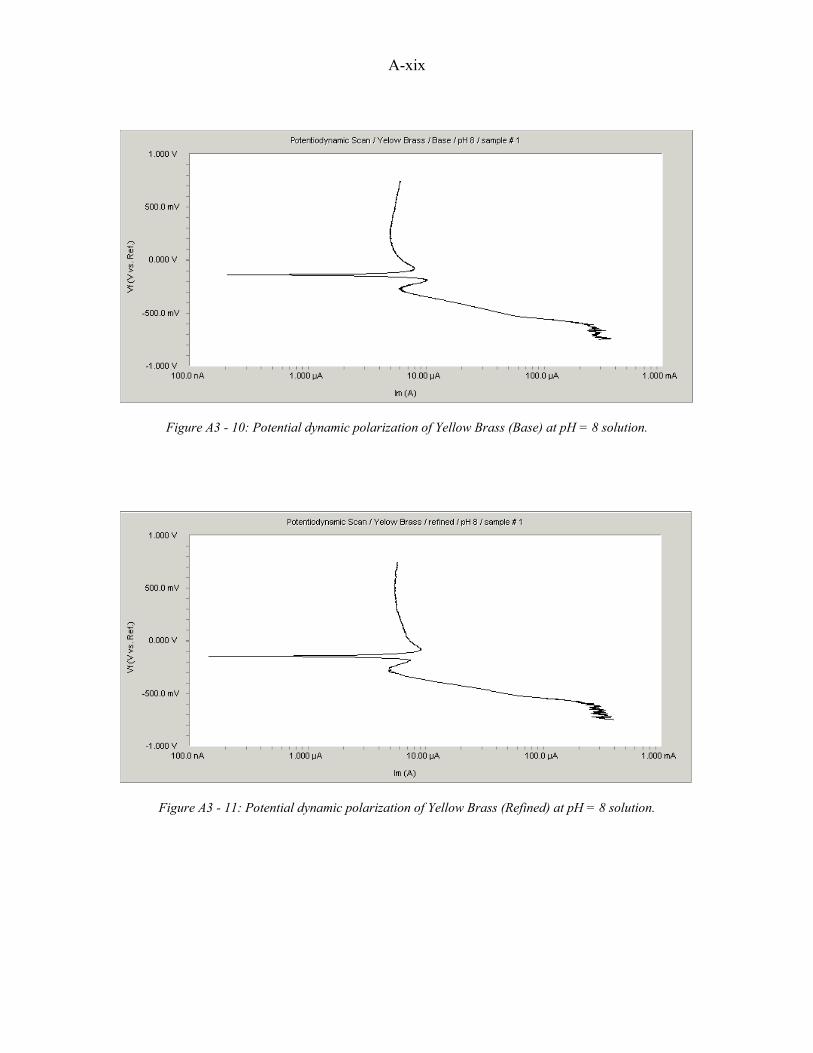
A-xix
Figure A3 - 10: Potential dynamic polarization of Yellow Brass (Base) at pH = 8 solution.
Figure A3 - 11: Potential dynamic polarization of Yellow Brass (Refined) at pH = 8 solution.
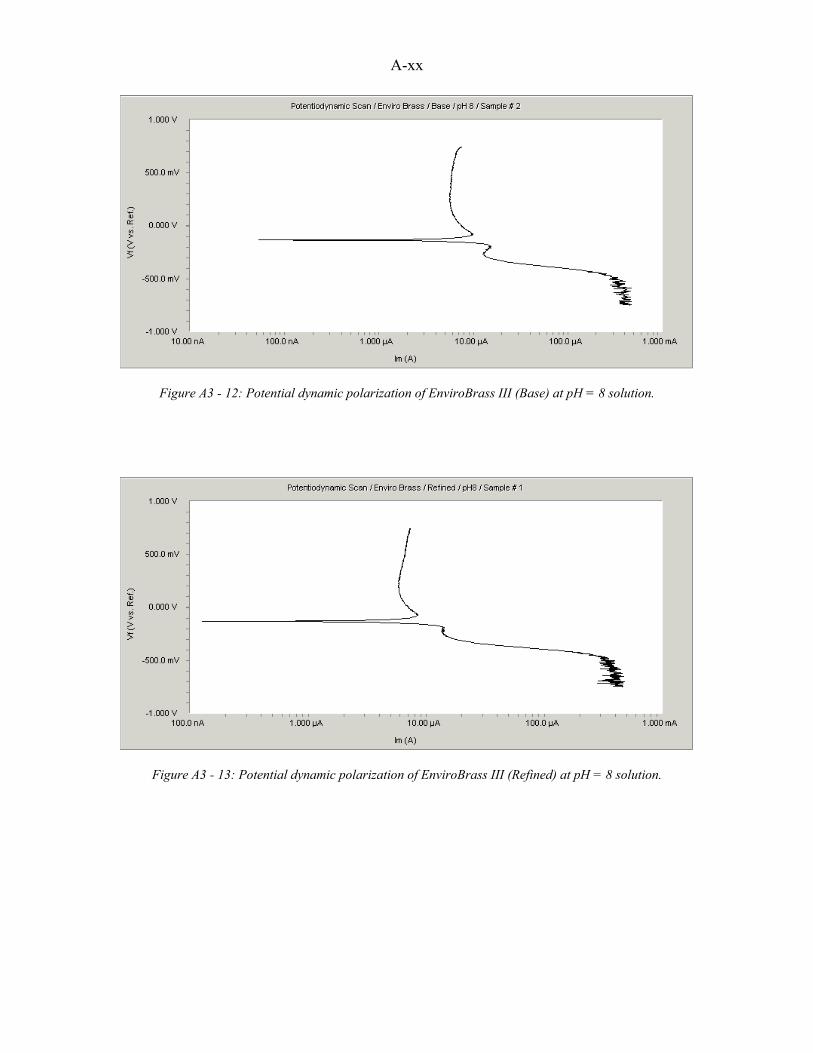
A-xx
Figure A3 - 12: Potential dynamic polarization of EnviroBrass III (Base) at pH = 8 solution.
Figure A3 - 13: Potential dynamic polarization of EnviroBrass III (Refined) at pH = 8 solution.
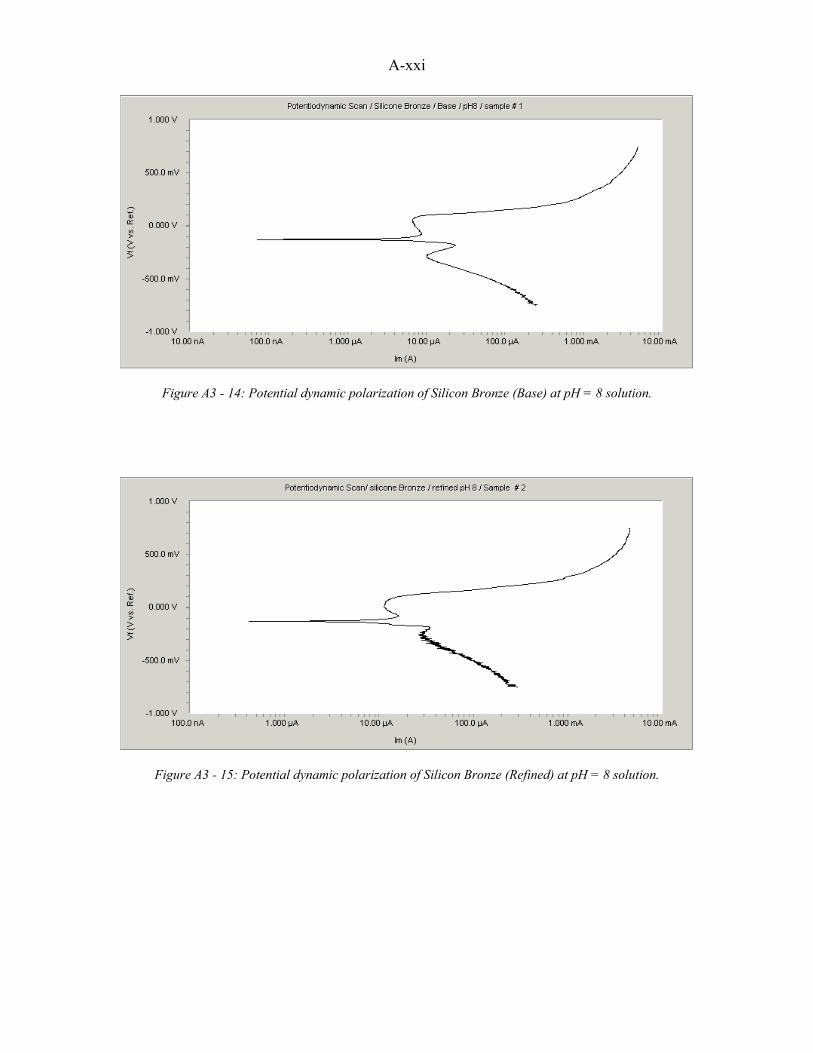
A-xxi
Figure A3 - 14: Potential dynamic polarization of Silicon Bronze (Base) at pH = 8 solution.
Figure A3 - 15: Potential dynamic polarization of Silicon Bronze (Refined) at pH = 8 solution.

A-xxii
Figure A3 - 16: Potential dynamic polarization of Silicon Brass (Base) at pH = 8 solution.
Figure A3 - 17: Potential dynamic polarization of Silicon Brass (Refined) at pH = 8 solution.
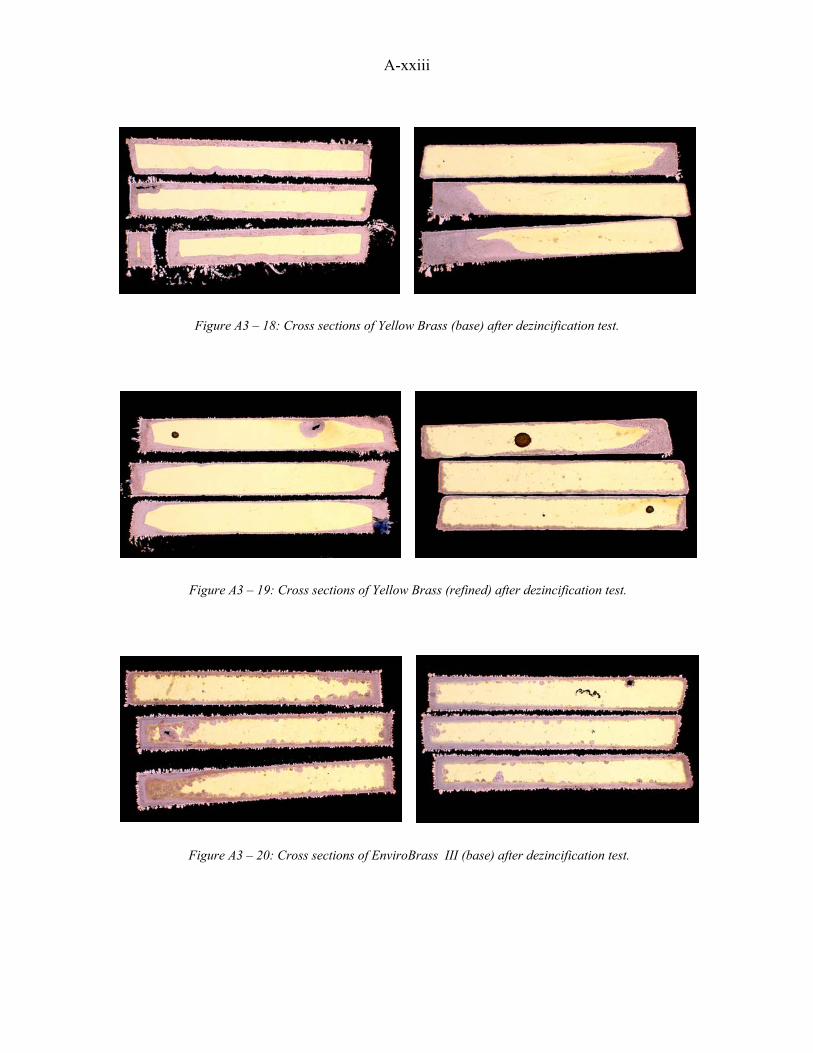
A-xxiii
Figure A3 – 18: Cross sections of Yellow Brass (base) after dezincification test.
Figure A3 – 19: Cross sections of Yellow Brass (refined) after dezincification test.
Figure A3 – 20: Cross sections of EnviroBrass III (base) after dezincification test.
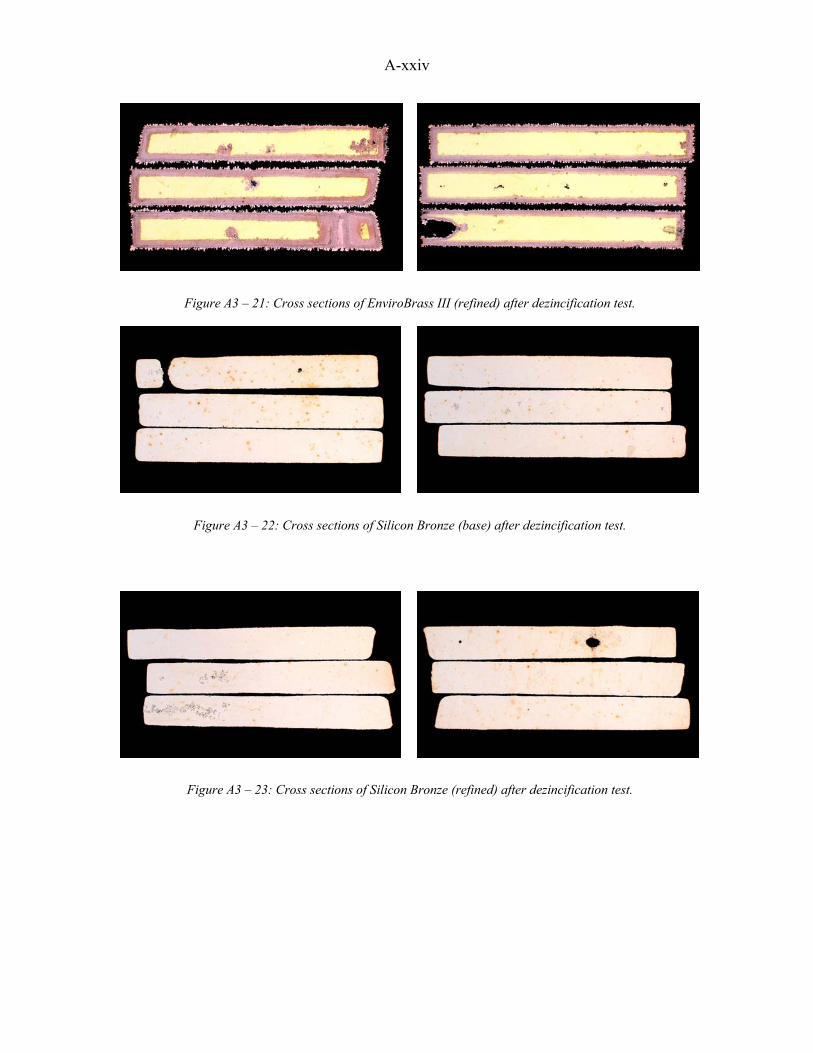
A-xxiv
Figure A3 – 21: Cross sections of EnviroBrass III (refined) after dezincification test.
Figure A3 – 22: Cross sections of Silicon Bronze (base) after dezincification test.
Figure A3 – 23: Cross sections of Silicon Bronze (refined) after dezincification test.
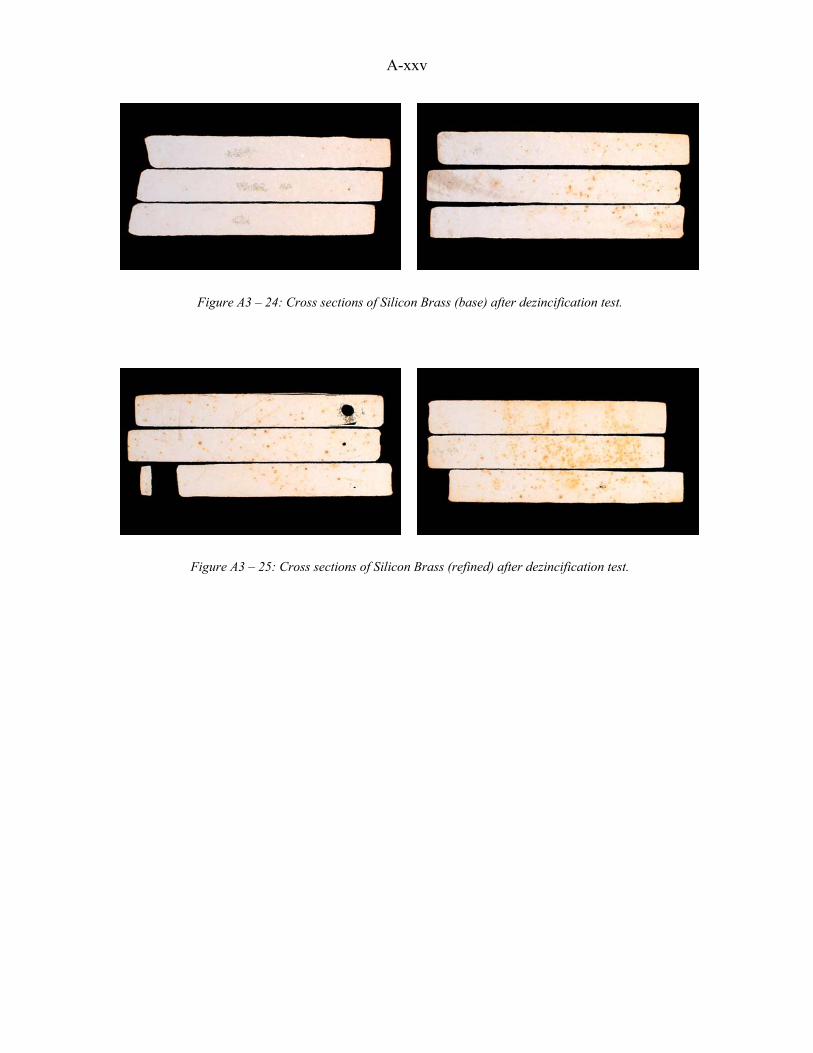
A-xxv
Figure A3 – 24: Cross sections of Silicon Brass (base) after dezincification test.
Figure A3 – 25: Cross sections of Silicon Brass (refined) after dezincification test.
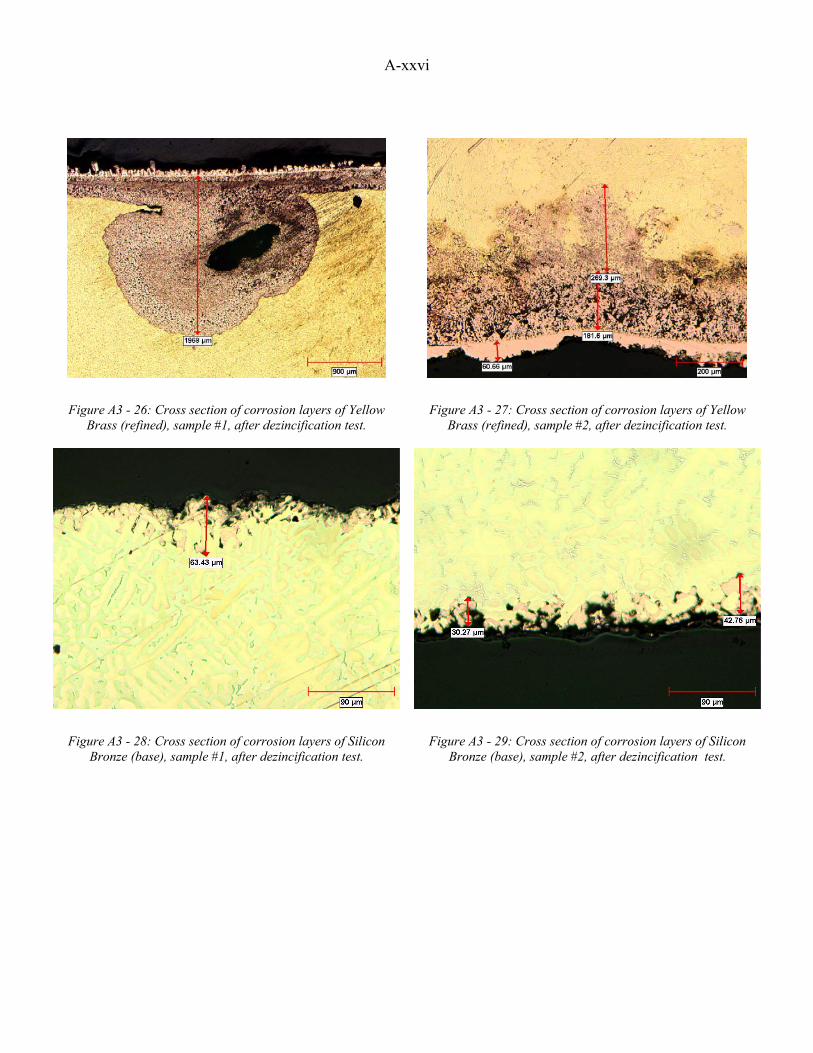
A-xxvi
Figure A3 - 26: Cross section of corrosion layers of Yellow Brass (refined), sample #1, after dezincification test.
Figure A3 - 27: Cross section of corrosion layers of Yellow Brass (refined), sample #2, after dezincification test.
Figure A3 - 28: Cross section of corrosion layers of Silicon Bronze (base), sample #1, after dezincification test.
Figure A3 - 29: Cross section of corrosion layers of Silicon Bronze (base), sample #2, after dezincification test.
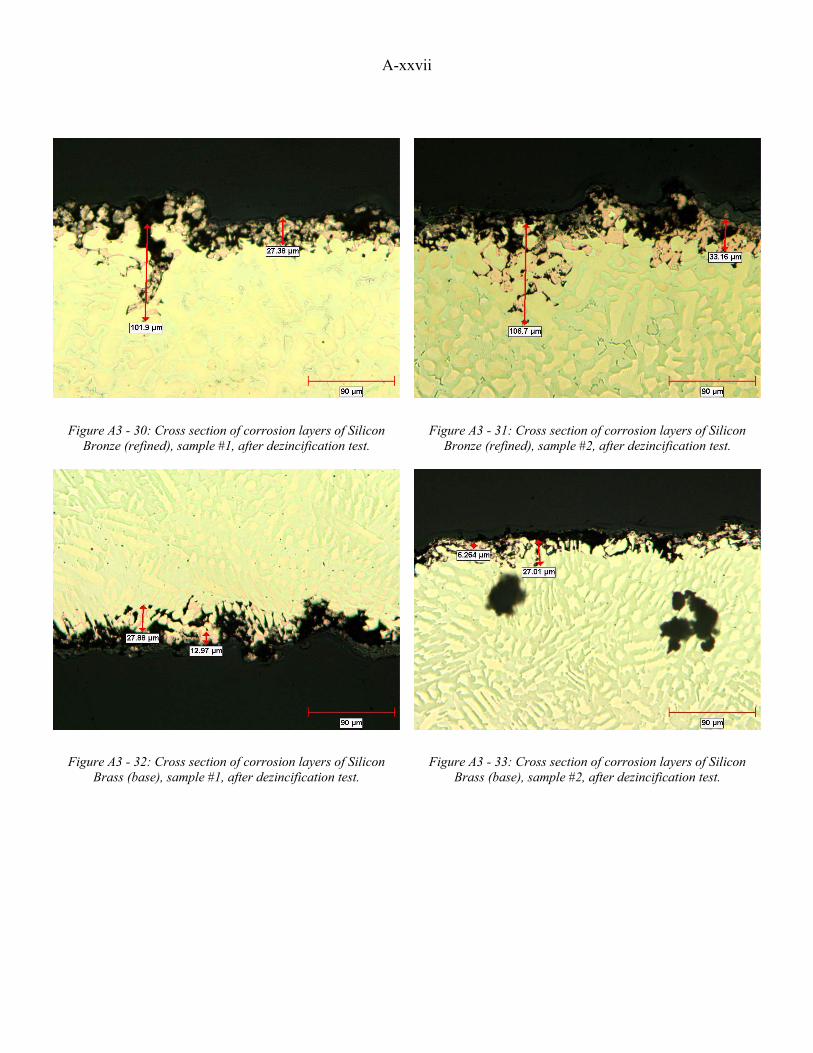
A-xxvii
Figure A3 - 30: Cross section of corrosion layers of Silicon Bronze (refined), sample #1, after dezincification test.
Figure A3 - 31: Cross section of corrosion layers of Silicon Bronze (refined), sample #2, after dezincification test.
Figure A3 - 32: Cross section of corrosion layers of Silicon Brass (base), sample #1, after dezincification test.
Figure A3 - 33: Cross section of corrosion layers of Silicon Brass (base), sample #2, after dezincification test.

A-xxviii
Figure A3 - 34: Cross section of corrosion layers of Silicon Brass (refined), sample #1, after dezincification test.
Figure A3 - 35: Cross section of corrosion layers of Silicon Brass (refined), sample #2, after dezincification test.