graduates by subject and institution experimental … and earnings outcomes of higher education...
36
Employment and earnings outcomes of higher education graduates by subject and institution: experimental statistics using the Longitudinal Education Outcomes (LEO) data SFR 18/2017, 13 June 2017 This is the third in a series of higher education data releases from the Department for Education’s new Longitudinal Education Outcomes dataset. It focuses on the employment and earnings outcomes in the tax year 2014/15 for those who graduated with an undergraduate degree in 2008/09, 2010/11 and 2012/13 from a higher education institution (HEI) in Great Britain. Data is presented for 23 subject areas and split by sex, subject studied and HEI. To provide context, splits by HEI are accompanied by information on graduates’ average attainment prior to commencing their studies and, as an indicator of disadvantage, their Participation of Local Areas (POLAR) classification. The figure below summarises the distribution of median earnings for all institutions across each subject. Some subjects show a wider range of median earnings than others. Section 1 discusses some of the factors that influence graduates’ earnings outcomes. In particular, earnings figures used in this publication do not included earnings from self-employment. Users should take these factors into consideration when comparing outcomes for different institutions. Distribution of median annualised earnings across HEIs for each subject area five years after graduation (minimum, lower quartile, median, upper quartile, maximum). Graduating cohort 2008/09, sorted by medians
Transcript of graduates by subject and institution experimental … and earnings outcomes of higher education...

Employment and earnings outcomes of higher education
graduates by subject and institution: experimental
statistics using the Longitudinal Education Outcomes
(LEO) data
SFR 18/2017, 13 June 2017
This is the third in a series of higher education data releases from the Department for Education’s new
Longitudinal Education Outcomes dataset. It focuses on the employment and earnings outcomes in the tax
year 2014/15 for those who graduated with an undergraduate degree in 2008/09, 2010/11 and 2012/13 from
a higher education institution (HEI) in Great Britain. Data is presented for 23 subject areas and split by sex,
subject studied and HEI. To provide context, splits by HEI are accompanied by information on graduates’
average attainment prior to commencing their studies and, as an indicator of disadvantage, their Participation
of Local Areas (POLAR) classification.
The figure below summarises the distribution of median earnings for all institutions across each subject.
Some subjects show a wider range of median earnings than others. Section 1 discusses some of the factors
that influence graduates’ earnings outcomes. In particular, earnings figures used in this publication do not
included earnings from self-employment. Users should take these factors into consideration when comparing
outcomes for different institutions.
Distribution of median annualised earnings across HEIs for each subject area five years after graduation (minimum, lower quartile, median, upper quartile, maximum). Graduating cohort 2008/09, sorted by medians

2
Contents
SFR 18/2017, 13 June 2017 ..................................................................................... 1
1. Introduction .................................................................................................... 4
Background to the Longitudinal Education Outcomes (LEO) dataset .............................................. 4
Coverage........................................................................................................................................ 4
Years after graduation .................................................................................................................... 5
Subject areas ................................................................................................................................. 6
Employment outcomes ................................................................................................................... 7
Contextual information.................................................................................................................... 7
2. Results .......................................................................................................... 8
Earnings outcomes across HEIs and subjects ................................................................................ 8
Employment outcomes across HEIs and subjects ........................................................................ 12
Median earnings and prior attainment by HEI ............................................................................... 13
3. Data quality .................................................................................................. 21
Employment and earnings data .................................................................................................... 21
Coverage...................................................................................................................................... 21
Timeliness .................................................................................................................................... 23
Benefits data ................................................................................................................................ 24
Suppression and rounding ............................................................................................................ 24
4. Methodology ................................................................................................ 24
Time period .................................................................................................................................. 24
Sustained employment ................................................................................................................. 25
Sustained employment defined by self-assessment data ............................................................. 25
Further study ................................................................................................................................ 25
No sustained destination .............................................................................................................. 26
Activity not captured ..................................................................................................................... 26
Unmatched ................................................................................................................................... 26
Annualised earnings ..................................................................................................................... 27
5. Contextual information ................................................................................. 28
Prior attainment ....................................................................................................................... 28
Coverage...................................................................................................................................... 28
Banding ........................................................................................................................................ 29

3
Medicine & Dentistry and Veterinary Science ............................................................................... 30
POLAR .................................................................................................................................... 30
6. Data matching and match rates ................................................................... 30
Overall match rates ...................................................................................................................... 31
Match rate by graduate characteristic ........................................................................................... 32
7. Next steps .................................................................................................... 33
8. Accompanying tables ................................................................................... 33
9. Feedback ..................................................................................................... 33
10. Glossary ...................................................................................................... 33
11. Experimental statistics ................................................................................. 35
12. Get in touch ................................................................................................. 35
4
1. Introduction
Background to the Longitudinal Education Outcomes (LEO) dataset
The Small Business, Employment and Enterprise Act 2015 enabled government, for the first time, to link
higher education and tax data together to chart the transition of graduates from higher education into the
workplace1. One of the advantages of linking data from existing administrative sources is that it provides a
unique insight into the destinations of graduates without imposing any additional data collection burdens on
universities, employers or members of the public. Compared to existing sources of graduate outcomes data,
it is also based on a considerably larger sample, does not rely on survey methodology, and can track
outcomes across time to a greater extent than was previously possible.
The LEO dataset links information about students, including
personal characteristics such as sex, ethnic group and age
education, including schools, colleges and higher education institution attended, courses taken and qualifications achieved
employment and income
benefits claimed
It is created by combining data from the following sources:
the National pupil database (NPD), held by the Department for Education (DfE)
Higher Education Statistics Agency (HESA) data on students at UK publicly funded higher education institutions and some alternative providers, held by DfE
Individualised Learner Record data (ILR) on students at further education colleges, held by DfE
employment data (P45 and P14), held by Her Majesty’s Revenue and Customs (HMRC)
the National Benefit Database, Labour Market System and Juvos data, held by the Department for Work and Pensions (DWP)
By combining these sources, we can look at the progress of higher education leavers into the labour market.
The focus of this release is on employment and earnings outcomes of leavers from higher education by
subject and institution, using HESA records to link graduates to HMRC and DWP data. Please see section
3: Data quality for consideration of the strengths and weaknesses of the LEO dataset, section 6: Data
matching and match rates for further information on matching processes, and the glossary for the definitions
used throughout this publication.
The privacy notice explaining how personal data in this project is shared and used can be found here.
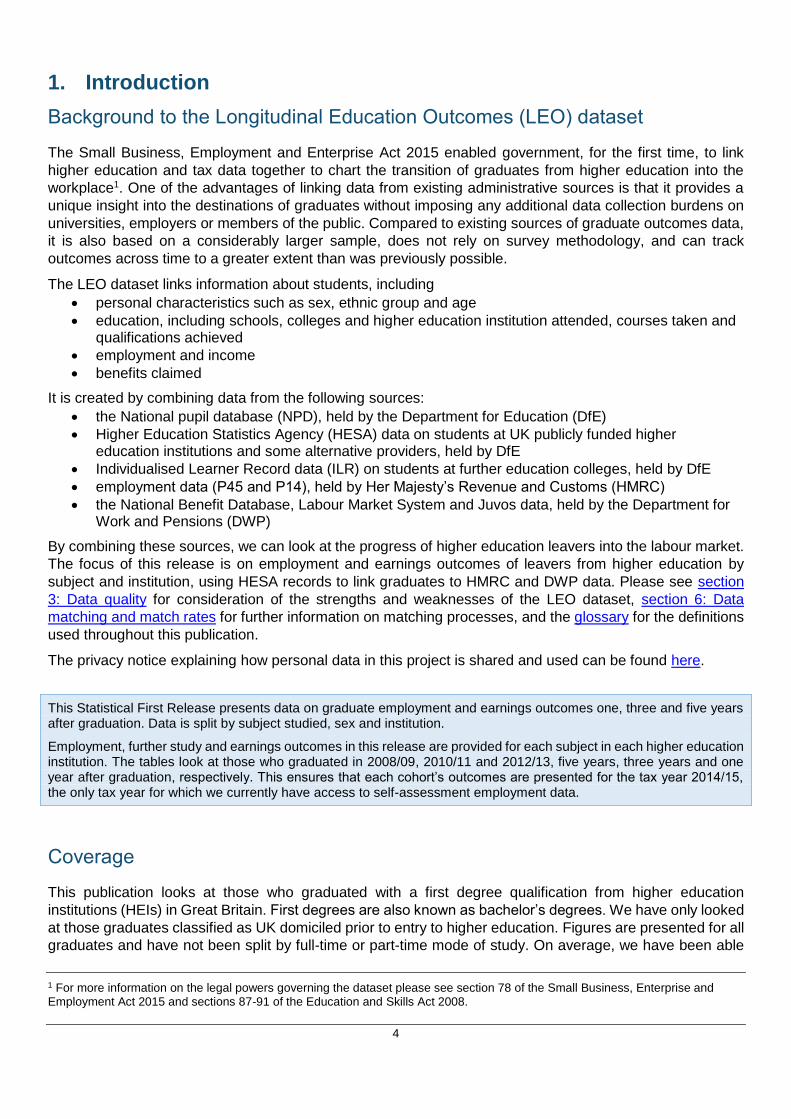
This Statistical First Release presents data on graduate employment and earnings outcomes one, three and five years after graduation. Data is split by subject studied, sex and institution.
Employment, further study and earnings outcomes in this release are provided for each subject in each higher education institution. The tables look at those who graduated in 2008/09, 2010/11 and 2012/13, five years, three years and one year after graduation, respectively. This ensures that each cohort’s outcomes are presented for the tax year 2014/15, the only tax year for which we currently have access to self-assessment employment data.
Coverage
This publication looks at those who graduated with a first degree qualification from higher education
institutions (HEIs) in Great Britain. First degrees are also known as bachelor’s degrees. We have only looked
at those graduates classified as UK domiciled prior to entry to higher education. Figures are presented for all
graduates and have not been split by full-time or part-time mode of study. On average, we have been able
1 For more information on the legal powers governing the dataset please see section 78 of the Small Business, Enterprise and Employment Act 2015 and sections 87-91 of the Education and Skills Act 2008.

5
to link over 95% of each graduate cohort to tax and/or benefit data. Please see section 6: Data matching and
match rates for more information.
Designated alternative providers are not included in this publication as they were not required to return
complete student level data to HESA prior to the 2015/16 academic year. The University of Buckingham has
historically returned HESA data so is included in the publication.
The employment data largely covers those with records submitted through the Pay As You Earn (PAYE)
system. The core purpose of PAYE is to collect tax, and its coverage reflects this. Up until April 2013,
employers were not required to supply information to HMRC for individuals who earned below the Lower
Earnings Limit (LEL)2 for National Insurance contributions, although for large employers these individuals
were thought to be included due to the methods of data transfer. Since then, employers have been required
to provide earnings information for all employees if even one employee of the company is paid above the
LEL threshold. Please see section 3: Data quality for more information on this.
The PAYE system does not collect information on the number of hours worked; therefore, whether an
individual is working full-time or part-time cannot be ascertained.
We have also obtained self-assessment data for the 2014/15 tax year and have selected the graduate cohorts
included in our publication to make the most use of self-employment data. We currently have no access to
self-assessment earnings, and earnings outcomes in this publication are therefore not fully representative of
graduates in self-employment as only their PAYE earnings will be included. Self-employment rates vary
between subject and university. Please see section 3: Data quality for more information on the impact of
including self-employment data.
All figures are based on UK tax, benefit and student records only: activity of those who move abroad to work
or study after graduating is not reflected in the employment or further study figures. Instead, these individuals
are included in the ‘activity not captured’ category.
The methodology for defining employment and earnings outcomes is set out in section 4: Methodology.
Years after graduation
The time periods used in this publication are one, three and five years after graduation, which refers to the
first, third and fifth full tax year after graduation, respectively. For instance, for the 2012/13 graduation cohort,
the figures one year after graduation refer to employment and earnings outcomes in the 2014/15 tax year.
This time period was picked as graduates are unlikely to have been engaged in economic activity for the
whole tax year that overlaps with the graduation date. This is displayed graphically in Figure 1 below.
Figure 1: Relationship between academic year, tax year and definitions of ‘years after graduation’ used in this publication
Cohorts in bold are covered in this publication
2 The threshold for the 2014/15 tax year was £112 per week.
Tax year
2010/11 2011/12 2012/13 2013/14 2014/15
Aca
de
mic
yea
r o
f
gra
du
ati
on
2008/09 1 year 2 years 3 years 4 years 5 years
2009/10 1 year 2 years 3 years 4 years
2010/11 1 year 2 years 3 years
2011/12 1 year 2 years
2012/13 1 year

6
Subject areas
The subjects covered by this publication are based on version 3.0 of the Joint Academic Coding System
(JACS). In previous publications, we presented results for Economics separately from the other subjects in
Social Studies. Following consultation on the subject splits, we are additionally extracting Nursing from the
other Subjects Allied to Medicine, Psychology from the Biological Sciences and English Studies from the
other Languages. We therefore cover the following 23 subjects:
JACS code Subject
1 Medicine & Dentistry
2 Subjects Allied to Medicine (excluding Nursing)
B7 Nursing
3 Biological Sciences (excluding Psychology)
C8 Psychology
4 Veterinary Science
5 Agriculture & Related Subjects
6 Physical Sciences
7 Mathematical Sciences
8 Computer Science
9 Engineering & Technology
A Architecture, Building & Planning
B Social Studies (excluding Economics)
L1 Economics
C Law
D Business & Administrative Studies
E Mass Communications & Documentation
F Languages (excluding English Studies)
Q3 English Studies
G Historical & Philosophical Studies
H Creative Arts & Design
I Education
J Combined
It is important to note that, even with these additional splits, each JACS subject area can still include a diverse
range of subjects, some of which will lead to significantly different employment and earnings outcomes. For
example, ‘Physical Sciences’ contains courses ranging from Physics to Forensic & archaeological sciences.
We have not attempted to split the JACS codes down further, as the resulting cohorts would be smaller, and
more data would therefore need to be suppressed to protect individual graduates’ confidentiality.

7
Employment outcomes
Outcomes are presented for graduates who have been successfully matched to the Department for Work
and Pensions’ Customer Information System (CIS) or if they have been matched to a further study instance
on the HESA Student Record. In this publication, these individuals are referred to as matched. Graduates
who have not been matched to CIS or a further study record are referred to as unmatched.
Graduates who have been matched are then placed in one of five outcomes categories. These are:
Activity not captured: graduates who have been successfully matched to CIS but do not have any
employment, out-of-work benefits or further study records in the tax year of interest. Reasons for appearing
in this category include: moving out of the UK after graduation for either work or study, earning below the
Lower Earnings Limit or voluntarily leaving the labour force.
No sustained destination: graduates who have an employment or out-of-work benefits record in the tax
year in question but were not classified as being in ‘sustained employment’ and do not have a further study
record.
Sustained employment only: graduates are considered to be in sustained employment if they were
employed for at least one day for five out of the six months between October and March of the tax year in
question or if they had a self-employment record in that tax year. To be in the sustained employment only
category, graduates must not have a record of further study in the tax year in question.
Sustained employment with or without further study: includes all graduates with a record of sustained
employment, regardless of whether they also have a record of further study. A graduate is defined as being
in further study if they have a valid higher education study record at any UK HEI on the HESA database in
the relevant tax year. The further study does not have to be at postgraduate level to be counted. Further
study undertaken at further education colleges is not reflected in these figures as this information is not
collected by HESA.
Sustained employment, further study or both: includes all graduates with a record of sustained
employment or further study. This category includes all graduates in the ‘sustained employment with or
without further study’ category as well as those with a further study record only.
It is important to note that our definition of sustained employment does not distinguish between the different
types of work that graduates are engaged in and so cannot provide an indication of the proportion of
graduates who are employed in graduate occupations. Furthermore, we do not distinguish between full-time
and part-time employment.
Contextual information
There are a number of factors that can influence the employment and earnings outcomes of graduates
beyond the subject and institution attended. The outcomes presented in this release are ‘raw’ outcomes, they
do not control for differences in the characteristics of students studying different subjects or attending
different institutions that might influence graduate employment outcomes. This should be borne in mind when
making comparisons across subjects and institutions. However, in order to aid comparisons between similar
universities, we have provided additional data about the characteristics of the students graduating. We have
included data on prior attainment using qualifications obtained from the NPD and on disadvantage using the
participation of local areas (POLAR) classification, which groups areas across the UK based on the proportion
of the young population that participates in higher education. We use this information in the following forms:
Prior attainment band: institutions in England are ranked by the median UCAS points of the graduates in a
given subject and cohort; the upper quartile of HEIs forms band 1, the middle 50% form band 2, and the
bottom quartile band 3. We have not placed Scottish or Welsh institutions into prior attainment bands.

8
Proportion in POLAR3 quintile 1: graduates in quinitile 1 (most disadvantaged) of POLAR3 as a proportion
of those non-mature students for whom we have this information (graduates from English and Welsh HEIs
only).
The contextual data provides useful information where universities have a reasonable proportion of their
students included in the measures. For some universities, the contextual data only covers a small proportion
of their graduates. We have therefore provided the following coverage indicators alongside the contextual
measures.
Included in prior attainment band: this column shows the proportion of matched graduates who are
included in our calculation of the prior attainment band. As the NPD only contains data on the key stage 5
qualifications obtained by 16–18 year olds in England since 2002, not all graduates will be included in the
prior attainment band for each university. Since this information is limited to England, we have not placed
Scottish or Welsh institutions into prior attainment bands.
Included in POLAR3 quintile 1: graduates from English and Welsh HEIs for whom we have POLAR3
information on the HESA student record and who were non-mature when entering higher education, as a
proportion of matched graduates.
We are continuing to investigate how best to compare employment and earnings outcomes for universities
that have a low proportion of students covered by the contextual data (mainly universities with a high
proportion of mature and/or part-time students, where employment and earnings trajectories may differ when
compared to young full-time students).
There are also well-documented regional difference in pay across the UK. We have published the region
that each university is located in. However, we do not have the current address of the graduates, so we do
not know whether they have stayed within the region where they went to university or have moved to a
different region to access a job with higher pay.
2. Results
The main output of this publication is the table ‘Activity of graduates by subject and institution one, three and
five years after graduation’ that accompanies this document3.
Earnings outcomes across HEIs and subjects
In Figure 2, we present the distribution of median earnings across institutions for each subject five years after
graduation. These charts show the spread of median earnings across institutions offering a given subject.
They are not to be confused with the earnings distributions of graduates of a given subject. Figure 3 provides
guidance on how to interpret the chart in Figure 2.
3 https://www.gov.uk/government/statistics/graduate-outcomes-for-all-subjects-by-university

9
Figure 2: Distribution of median annualised earnings across HEIs for each subject area five years after graduation (minimum, lower quartile, median, upper quartile, maximum). ‘University A’ represents an example institution. Female + male graduates, graduating cohort 2008/09, sorted by medians
Figure 3: How to read boxplots in this publication
Minimum: £20,000 Median: £35,000 Maximum: £50,000
Upper quartile: £42,500 Lower quartile:
£27,500 HEI with median earnings
of £40,000
University A
10
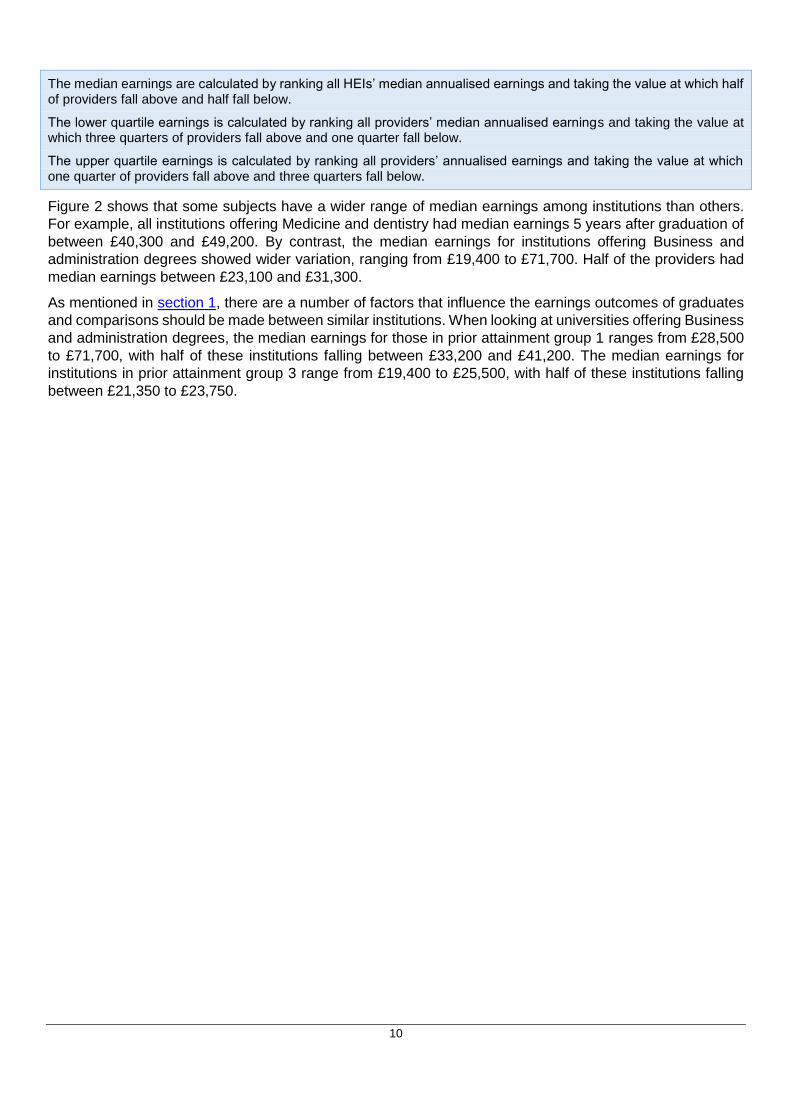
The median earnings are calculated by ranking all HEIs’ median annualised earnings and taking the value at which half of providers fall above and half fall below.
The lower quartile earnings is calculated by ranking all providers’ median annualised earnings and taking the value at which three quarters of providers fall above and one quarter fall below.
The upper quartile earnings is calculated by ranking all providers’ annualised earnings and taking the value at which one quarter of providers fall above and three quarters fall below.
Figure 2 shows that some subjects have a wider range of median earnings among institutions than others.
For example, all institutions offering Medicine and dentistry had median earnings 5 years after graduation of
between £40,300 and £49,200. By contrast, the median earnings for institutions offering Business and
administration degrees showed wider variation, ranging from £19,400 to £71,700. Half of the providers had
median earnings between £23,100 and £31,300.
As mentioned in section 1, there are a number of factors that influence the earnings outcomes of graduates
and comparisons should be made between similar institutions. When looking at universities offering Business
and administration degrees, the median earnings for those in prior attainment group 1 ranges from £28,500
to £71,700, with half of these institutions falling between £33,200 and £41,200. The median earnings for
institutions in prior attainment group 3 range from £19,400 to £25,500, with half of these institutions falling
between £21,350 to £23,750.

11
Figure 4: Distribution of difference between male and female median earnings across HEIs for each subject area, five years after graduation. Graduating cohort 2008/09
Figure 4 shows the difference between male and female median earnings across institutions five years after
graduation. For all subjects except English Studies, male median earnings exceed female median earnings

12
at more than 50% of institutions offering that subject. In 12 subjects, male earnings are greater than female
earnings at more than 75% of institutions.
Employment outcomes across HEIs and subjects
Figure 5: Distribution of proportion in sustained employment, further study or both across HEIs for each subject area five years after graduation (minimum, lower quartile, median, upper quartile, maximum). Female + male graduates, graduating cohort 2008/09
Figure 5 shows the distribution of each institution’s proportion of graduates in sustained employment, further
study or both five years after graduation. While median proportions lie consistently between 75% and 85%
across subjects, there is significant variation within subjects. For Subjects Allied to Medicine (excluding
Nursing), for example, the difference between the highest and lowest proportion reaches 51 percentage
points. The lowest median proportion is for those who studied languages. It is possible, however, that
graduates of such courses are more likely to be living (and working) abroad five years after graduation. If so,
they would be more likely to appear in the ‘activity not known’ category.

13
Median earnings and prior attainment by HEI
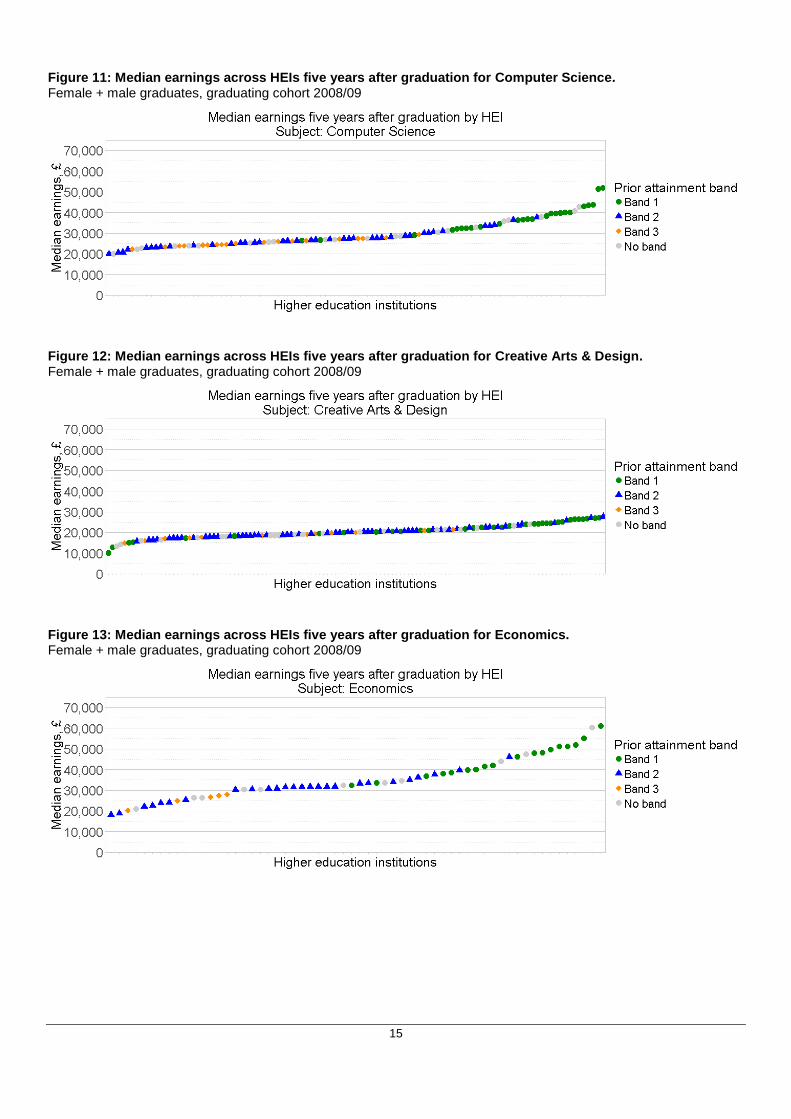
In Figures 6 to 28, we show the median earnings and prior attainment of graduates from each institution for
each subject. For the majority of subjects, institutions in prior-attainment band 1 (highest prior attainment)
tend to have higher median earnings five years after graduation than those in bands 2 or 3. This relationship
between prior attainment and median earnings is clearer in some subjects than in others. Note that only
institutions with at least 11 graduates are included; see section 3 for details.
Figure 6: Median earnings across HEIs five years after graduation for Agriculture & Related Subjects. Female + male graduates, graduating cohort 2008/09
Figure 7: Median earnings across HEIs five years after graduation for Architecture, Building & Planning. Female + male graduates, graduating cohort 2008/09

14
Figure 8: Median earnings across HEIs five years after graduation for Biological Sciences (excluding Psychology). Female + male graduates, graduating cohort 2008/09
Figure 9: Median earnings across HEIs five years after graduation for Business & Administrative Studies. Female + male graduates, graduating cohort 2008/09
Figure 10: Median earnings across HEIs five years after graduation for Combined. Female + male graduates, graduating cohort 2008/09
15
Figure 11: Median earnings across HEIs five years after graduation for Computer Science. Female + male graduates, graduating cohort 2008/09
Figure 12: Median earnings across HEIs five years after graduation for Creative Arts & Design. Female + male graduates, graduating cohort 2008/09
Figure 13: Median earnings across HEIs five years after graduation for Economics. Female + male graduates, graduating cohort 2008/09

16
Figure 14: Median earnings across HEIs five years after graduation for Education. Female + male graduates, graduating cohort 2008/09
Figure 15: Median earnings across HEIs five years after graduation for Engineering & Technology. Female + male graduates, graduating cohort 2008/09
Figure 16: Median earnings across HEIs five years after graduation for English Studies. Female + male graduates, graduating cohort 2008/09

17
Figure 17: Median earnings across HEIs five years after graduation for Historical & Philosophical Studies. Female + male graduates, graduating cohort 2008/09
Figure 18: Median earnings across HEIs five years after graduation for Languages (excluding English Studies). Female + male graduates, graduating cohort 2008/09
Figure 19: Median earnings across HEIs five years after graduation for Law. Female + male graduates, graduating cohort 2008/09

18
Figure 20: Median earnings across HEIs five years after graduation for Mass Communication & Documentation. Female + male graduates, graduating cohort 2008/09
Figure 21: Median earnings across HEIs five years after graduation for Mathematical Sciences. Female + male graduates, graduating cohort 2008/09
Figure 22: Median earnings across HEIs five years after graduation for Medicine & Dentistry.
Female + male graduates, graduating cohort 2008/09. Prior attainment bands are not included for Medicine & dentistry; see section 5 for details.

19
Figure 23: Median earnings across HEIs five years after graduation for Nursing. Female + male graduates, graduating cohort 2008/09
Figure 24: Median earnings across HEIs five years after graduation for Physical Sciences. Female + male graduates, graduating cohort 2008/09
Figure 25: Median earnings across HEIs five years after graduation for Psychology. Female + male graduates, graduating cohort 2008/09

20
Figure 26: Median earnings across HEIs five years after graduation for Social Studies (excluding Economics). Female + male graduates, graduating cohort 2008/09
Figure 27: Median earnings across HEIs five years after graduation for Subjects Allied to Medicine (excluding Nursing). Female + male graduates, graduating cohort 2008/09
Figure 28: Median earnings across HEIs five years after graduation for Veterinary Science. Female + male graduates, graduating cohort 2008/09. Prior attainment bands are not included for Veterinary Science; see section 5 for details.
21
3. Data quality
Employment and earnings data
The employment data covers those with P45 and P14 records submitted through the Pay As You Earn
(PAYE) system. These figures have been derived from administrative IT systems that, as with any large-
scale recording system, are subject to possible errors with data entry and processing. While some data
cleaning was necessary, the resulting data looks to provide a good reflection of an individual’s employment
and earnings for the year.
Issues encountered with the employment data included duplicate records and invalid records (for example,
where an employment start date occurred after the end date).
Additionally, for the purposes of collecting taxes, accurate start dates are not required, just the tax year and
earnings. Therefore, a number of returns are found to have missing start dates due to the employer not
forwarding a timely P45. The default dates recorded in the dataset are either 6 April (the first day of the tax
year) or, where only an end date is known, the day before that end date. Similarly, for records where the
employment is known to have come to an end within a tax year but the end date is not known, the record is
given a default 5 April end date, the last day of the tax year.
Individuals can also have overlapping spells of employment. Before carrying out analysis, the P45 and P14
records for each individual were cleaned and then merged into a single record to give a longitudinal picture
of their employment and a total sum of their earnings in each tax year.
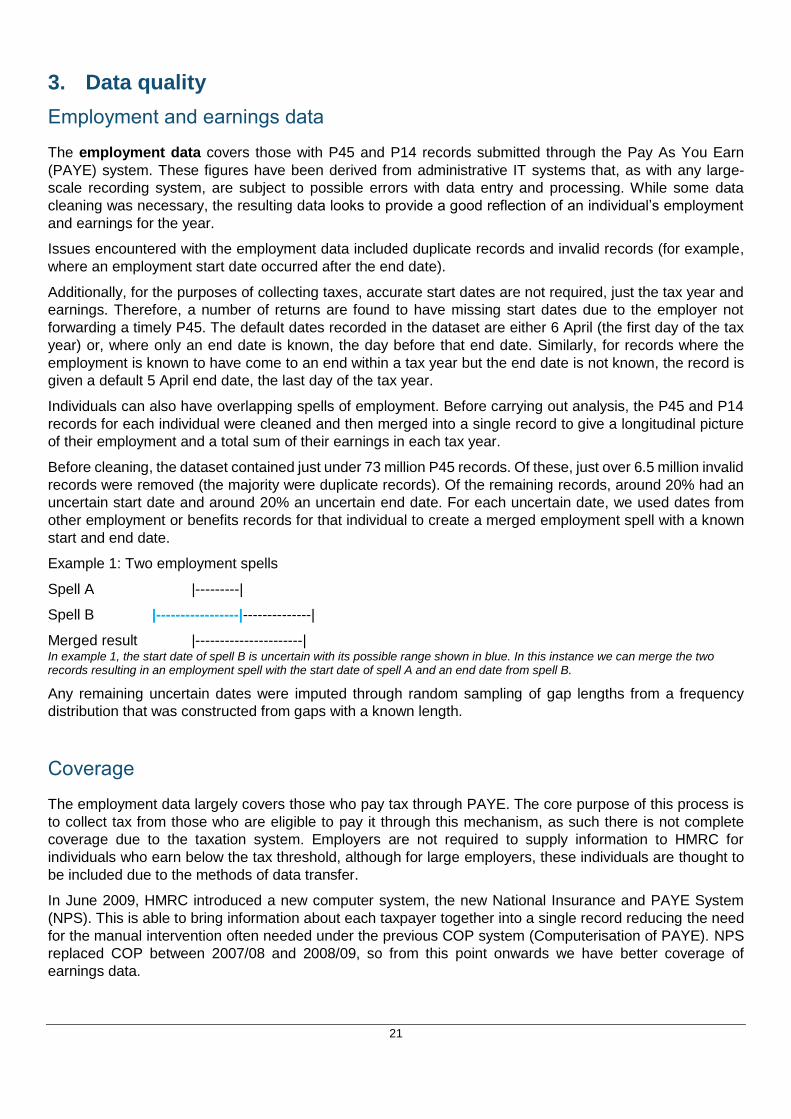
Before cleaning, the dataset contained just under 73 million P45 records. Of these, just over 6.5 million invalid
records were removed (the majority were duplicate records). Of the remaining records, around 20% had an
uncertain start date and around 20% an uncertain end date. For each uncertain date, we used dates from
other employment or benefits records for that individual to create a merged employment spell with a known
start and end date.
Example 1: Two employment spells
Spell A |---------|
Spell B |-----------------|--------------|
Merged result |----------------------| In example 1, the start date of spell B is uncertain with its possible range shown in blue. In this instance we can merge the two records resulting in an employment spell with the start date of spell A and an end date from spell B.
Any remaining uncertain dates were imputed through random sampling of gap lengths from a frequency
distribution that was constructed from gaps with a known length.
Coverage
The employment data largely covers those who pay tax through PAYE. The core purpose of this process is
to collect tax from those who are eligible to pay it through this mechanism, as such there is not complete
coverage due to the taxation system. Employers are not required to supply information to HMRC for
individuals who earn below the tax threshold, although for large employers, these individuals are thought to
be included due to the methods of data transfer.
In June 2009, HMRC introduced a new computer system, the new National Insurance and PAYE System
(NPS). This is able to bring information about each taxpayer together into a single record reducing the need
for the manual intervention often needed under the previous COP system (Computerisation of PAYE). NPS
replaced COP between 2007/08 and 2008/09, so from this point onwards we have better coverage of
earnings data.

22
Beginning in April 2013, the P45 reporting system was phased out in favour of the Real Time Information
(RTI) system, which requires employers to submit information to HMRC each time an employee is paid. This
system has now reached full deployment. RTI offers substantial improvements to the P45 system in terms of
data coverage, since employers must now provide information on all their employees if even one employee
of the company is paid above the Lower Earnings Limit. The move to RTI will mean that data coverage is
higher for the most recent tax years.
We have obtained self-assessment data for the 2014/15 tax year and have selected the graduate cohorts
included in our publication to make the most use of this data. An analysis of how self-assessment data affects
outcomes for different subjects and at different points after graduation can be found in our previous
publication4.
We currently have no access to self-assessment earnings. Earnings outcomes in this publication are
therefore not fully representative of graduates in self-employment. Figure 29 shows the effect of self-
assessment data on the proportion in sustained employment, further study or both. This effect varies between
subjects, and we would equally expect the effect of self-assessment earnings on overall earnings outcomes
to vary between subjects and institutions. We are in the process of obtaining more self-assessment data
(including earnings) so it can be included more fully in the future.
4 https://www.gov.uk/government/statistics/graduate-outcomes-by-degree-subject-and-university

23
Figure 29: Proportion of 2008/09 graduates in sustained employment, further study or both five years after graduation: comparison with and without self-assessment data
Timeliness
All data used in this process is drawn from administrative sources, which take time to process and collate.
There are therefore lags between the reference period and availability of the dataset for analysis.
Employment data is matched to DWP data on a regular basis. There are cleaning rules applied to this data,
which identify old records when updated with new information. As new information can come through about
a job after it has ended this is a source of constant change, analysis suggests that the data is about 90%
complete 6 months after the end of the tax year. Self-assessment data takes longer to collect and is finalised
by HMRC 16 months after the end of the tax year. The data used in this publication was received just before
the cut-off point and should therefore be treated as provisional.
0.0 10.0 20.0 30.0 40.0 50.0 60.0 70.0 80.0 90.0 100.0
Creative Arts & Design
Medicine & Dentistry
Agriculture & Related Subjects
Mass Communications & Documentation
Architecture, Building & Planning
Veterinary Science
Subjects Allied to Medicine
Languages
Combined
Law
Historical & Philosophical Studies
Computer Science
Engineering & Technology
Biological Sciences
Business & Administrative Studies
Social Studies (excluding Economics)
Physical Sciences
Education
Economics
Mathematical Sciences
With self-employment data Without self-employment data

24
Benefits data
Benefits data is taken from the underlying payments systems and supplemented by the information entered
by Jobcentre advisers. The data therefore captures basic information accurately, but non-compulsory fields
in either the labour market system or the payment system may be incomplete. Due to the size and technical
complexity, these systems are not accessed directly, but at regular intervals, scans are taken that build up a
longitudinal picture from repeated snapshots of the data.
Start dates are entered on to the system and are accurate dates of benefit payment, thus providing precise
timing and duration for benefit claims. However, while Job Seekers Allowance (JSA) dates have very few
discrepancies due to the way the data is scanned, the end dates recorded for other benefits may diverge to
some extent from the events they are recording. The potential discrepancy varies from up to two weeks for
Employment Support Allowance (ESA) to up to six weeks for Incapacity Benefit (IB).
The National Benefits Database (NBD) does not currently include any information relating to claims to
Universal Credit. Further work is being undertaken to assess whether Universal Credit claims can be brought
into the matching database.
Graduates are considered to be in receipt of an out-of-work benefit if they have a record at any point in the
tax year for: Job Seekers Allowance (JSA), Incapacity Benefit (IB), Income Support (IS), Permanent Injury
Benefit (PIB), Severe Disablement Allowance (SDA), Pension Credit (PC), Employment and Support
Allowance (ESA).
Suppression and rounding
In line with our disclosure control rules, we have suppressed information based on cohorts with fewer than
11 graduates (matched or total).
We have rounded all counts to the nearest five, percentages to one decimal place, and earnings to the
nearest £100.
4. Methodology
Time period
The earliest time period for which employment and earnings data is reported is one year after graduation.
This refers to the first full tax year after graduation. So, for the 2012/13 graduation cohort the figures one year
after graduation refer to employment and earnings outcomes in the 2014/15 tax year. This time period was
picked as using the tax year that overlaps with the graduation date would mean that graduates are unlikely
to have been engaged in economic activity for the whole tax year.

25
Sustained employment
The ‘sustained employment’ measure aims to count the proportion of graduates in sustained employment
following the completion of their course. The definition of sustained employment is consistent with the
definition used for 16-19 accountability and the outcome based success measures published for adult further
education5. This definition looks at employment activity in the six month October to March period starting
from the first tax year after graduation. A graduate needs to be in paid employment for five out of six months
between October and March to be classified as being in ‘sustained employment’.
For example, those who graduated in the 2012/13 academic year would be counted as being in sustained
employment one year after graduation if they were in paid employment for at least one day a month in the
five out of six months between October 2014 and March 2015. If they are employed in all five months from
October to February, but do not have an employment record for March, then they must have an additional
employment record in April to be considered as being in sustained employment.
Sustained employment defined by self-assessment data
This publication incorporates self-assessment data into measures of sustained employment. Self-
assessment data captures the activity of individuals with income that is not taxed through PAYE, such as
income from self-employment, savings and investments, property rental, and shares6. Currently, only data
for the 2014/15 tax year is available for inclusion in LEO. For this reason, we have included the graduating
cohorts of academic years 2008/09, 2010/11 and 2012/13 in this publication, since for these cohorts, the tax
year 2014/15 corresponds to five years, three years and one year after graduation, respectively.
For the purposes of this publication, individuals are classed as being in sustained employment in the 2014/15
tax year if they meet our definition of sustained employment based on PAYE or have returned a self-
assessment form stating that they have received income from self-employment. These individuals may or
may not have an additional PAYE record. Individuals who have received income through self-assessed
means other than self-employment, such as through rental of property, and do not have a PAYE record, are
not classed as being in employment (either sustained or unsustained).
Further study
A graduate is defined as being in further study if they have a valid higher education study record at any UK
HEI on the HESA Student Record in the relevant tax year. Further study undertaken at further education
colleges is not reflected in these figures as this information is not collected by HESA. The further study does
not have to be at postgraduate level to be counted. The purpose of this category is to identify how students
spent their time in the relevant tax year and as such cannot be used to calculate the proportion of graduates
who go on to postgraduate study. Students enrolled on further education courses, on some initial teacher
training enhancement, booster and extension courses, whose study status is dormant or who were on
sabbatical are excluded from this indicator.
As a tax year overlaps with two academic years, some students would be coming to the end of their further
study in the tax year in question and some would be starting their further study. For example, those who
graduated in the 2012/13 academic year and went straight on to a one-year masters course would be counted
as being in further study in the 2014/15 tax year (one year after graduation) as their course would finish in
September 2014. If a graduate from 2012/13 waited a year before starting their one-year masters course
then they would be counted as being in further study in the 2014/15 tax year (one year after graduation) as
their course would start in September 2014.
5 https://www.gov.uk/government/statistics/adult-further-education-outcome-based-success-measures 6 A full list of income sources that must be declared through a self-assessment return can be found here, https://www.gov.uk/self-assessment-tax-returns/who-must-send-a-tax-return

26
We have not used a sustained definition when defining further study. The majority of higher education courses
last longer than 6 months and dropout rates tend to be low, especially at postgraduate level.
No sustained destination
This category consists of graduates who have an employment or out-of-work benefits record in the tax year
in question but were not classified as being in ‘sustained employment’ (and do not have a further study record
as defined above).
Activity not captured
These graduates are successfully matched to DWP’s Customer Information System (CIS) but do not have
any employment or ’out of work’ benefits records. Reasons for appearing in this category include: being
employed outside of the UK after graduation, being self-employed in the relevant tax year or earning below
the Lower Earnings Limit.
Unmatched
These graduates were not found on DWP’s Customer information System (CIS), either because they had
never been issued with a National Insurance number or because the personal details provided from the HESA
data did not fulfil the matching criteria. These graduates are excluded from any calculations. More
information on match rates is given in section 6: Data matching and match rates. If a graduate is unmatched
on the CIS but has a further study record for the tax year in question then they will be moved out of the
‘unmatched’ category and into the ‘further study’ category.

27
Table A: Classification of LEO graduate outcomes based on underlying further study, employment and benefits
records. = graduate has record of this outcome, = graduate does not have record of this outcome.
Graduate has a record of:
Further study Sustained employment
Any employment Out-of-work Benefits
Graduated classed as being ‘unmatched’
(and unmatched
to CIS)
(and unmatched
to CIS) (and unmatched
to CIS)
Graduated classed as ‘activity not captured ‘
Graduated classed as being in ‘no sustained destination’
Graduated classed as being in ‘sustained employment only’
Graduated classed as being in ‘sustained employment (with or without further study)’
Graduated classed as being in ‘sustained employment, further study or both’
(and unmatched
to CIS)
(and unmatched
to CIS)
(and unmatched
to CIS)
Annualised earnings
Earnings figures are only reported for those classified as being in sustained employment and where we have
a valid earnings record from the P14. Those in further study are excluded, as their earnings would be more
likely to relate to part-time jobs. Earnings from self-assessment are not included.
For each graduate, the earnings reported on the HMRC P14 data for a given tax year are divided by the
number of days recorded in employment across that same tax year. This provides an average daily wage
that is then multiplied by the number of days in the tax year to calculate their annualised earnings.
28
This calculation has been used to maintain consistency with figures reported for further education learners
after study. It provides students with an indication of the earnings they might receive once in stable and
sustained employment.
The annualised earnings calculated are slightly higher than the raw earnings reported in the tax year. This is
because the earnings of those who did not work for the entire tax year will be higher when annualised. The
difference between the annualised and raw figures decreases as time elapses after graduation. Median
annualised earnings one year after graduation are around £1,000 higher than the median raw earnings
reported in the P14 data. Five years after graduation, the median annualised earnings are less than £500
higher than the median raw earnings.
All earnings presented are nominal. They represent the cash amount an individual was paid and are not
adjusted for inflation (the general increase in the price of goods and services).
5. Contextual information
Prior attainment
Information on prior attainment was obtained from the national pupil database (NPD). The NPD contains data
on the key stage 5 qualifications obtained by 16–18 year olds in England since 2002. Both the NPD and the
HESA data have been matched to DWP’s Customer Information System (CIS) through the process set out
in section 6: Data matching and match rates; this enables HESA and NPD records to be linked through
matches to a common CIS record. This publication uses A levels only to assess attainment prior to entering
higher education.
Coverage
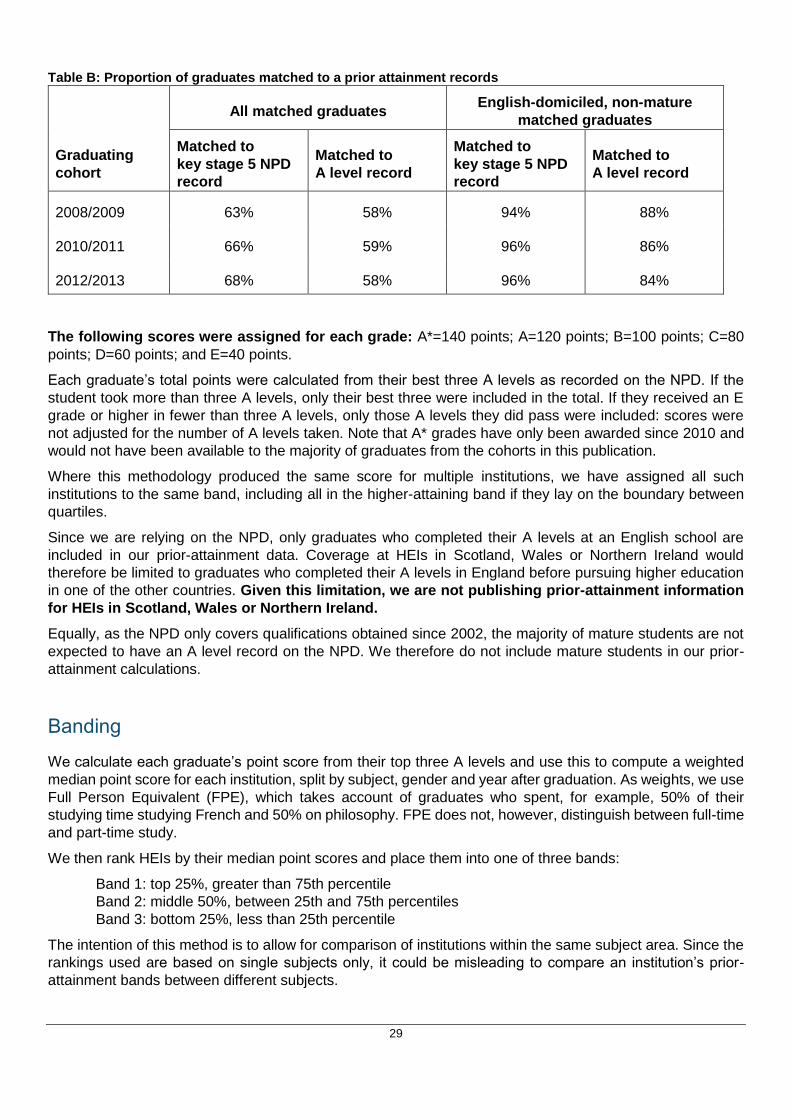
For the cohorts in this publication, at least 64% of graduates could be matched to a key stage 5 NPD record
and at least 59% could be matched to an A level record through this method.
When we restrict the cohorts to those graduates we could reasonably expect to find an NPD record for (that
is, those whose domicile was classified as ‘English’ and who were not classified as a ‘mature’ student), we
match at least 94% to an NPD record and at least 84% to an A level record. Figures for each of our graduating
cohorts are listed in Table B, below.
Reasons why a graduate could not be matched to an A level record include:
they took an alternative key stage 5 level qualification (for example, a BTEC, the International Baccalaureate)
they took their A levels prior to the 2001/02 academic year or when they were aged above 18
they took their key stage 5 qualifications outside of England
the HESA record we have for them could not be matched to DWP’s CIS spine and therefore could not be matched back to an NPD record using this method
29
Table B: Proportion of graduates matched to a prior attainment records
All matched graduates English-domiciled, non-mature
matched graduates
Graduating
cohort
Matched to
key stage 5 NPD
record
Matched to
A level record
Matched to
key stage 5 NPD
record
Matched to
A level record
2008/2009 63% 58% 94% 88%
2010/2011 66% 59% 96% 86%
2012/2013 68% 58% 96% 84%
The following scores were assigned for each grade: A*=140 points; A=120 points; B=100 points; C=80
points; D=60 points; and E=40 points.
Each graduate’s total points were calculated from their best three A levels as recorded on the NPD. If the
student took more than three A levels, only their best three were included in the total. If they received an E
grade or higher in fewer than three A levels, only those A levels they did pass were included: scores were
not adjusted for the number of A levels taken. Note that A* grades have only been awarded since 2010 and
would not have been available to the majority of graduates from the cohorts in this publication.
Where this methodology produced the same score for multiple institutions, we have assigned all such
institutions to the same band, including all in the higher-attaining band if they lay on the boundary between
quartiles.
Since we are relying on the NPD, only graduates who completed their A levels at an English school are
included in our prior-attainment data. Coverage at HEIs in Scotland, Wales or Northern Ireland would
therefore be limited to graduates who completed their A levels in England before pursuing higher education
in one of the other countries. Given this limitation, we are not publishing prior-attainment information
for HEIs in Scotland, Wales or Northern Ireland.
Equally, as the NPD only covers qualifications obtained since 2002, the majority of mature students are not
expected to have an A level record on the NPD. We therefore do not include mature students in our prior-
attainment calculations.
Banding
We calculate each graduate’s point score from their top three A levels and use this to compute a weighted
median point score for each institution, split by subject, gender and year after graduation. As weights, we use
Full Person Equivalent (FPE), which takes account of graduates who spent, for example, 50% of their
studying time studying French and 50% on philosophy. FPE does not, however, distinguish between full-time
and part-time study.
We then rank HEIs by their median point scores and place them into one of three bands:
Band 1: top 25%, greater than 75th percentile
Band 2: middle 50%, between 25th and 75th percentiles
Band 3: bottom 25%, less than 25th percentile
The intention of this method is to allow for comparison of institutions within the same subject area. Since the
rankings used are based on single subjects only, it could be misleading to compare an institution’s prior-
attainment bands between different subjects.

30
It is recognised that the prior attainment bandings can be expanded further to include the points for those
who took other key stage 5 qualifications.
Medicine & Dentistry and Veterinary Science
We found that our prior-attainment methodology would lead to misleading results for two of the subjects we
cover, Medicine & Dentistry and Veterinary Science. For those subjects, all institutions for which prior
attainment would not be suppressed show very similar median UCAS point scores, so bands based on
percentiles would give the appearance of differentiation where there is none.
POLAR
The Participation of Local Areas (POLAR) classification places local areas into five groups, based on the
proportion of 18 year olds who enter higher education at age 18 or 19. The most recent iteration of this
classification is POLAR3, which we use in this publication. Detailed information about the POLAR
methodology is available from HEFCE7.
Here, we publish the proportion of non-mature matched graduates whose postcode on the student record
placed them in quintile 1 (the most disadvantaged group) of POLAR3 before applying for or entering higher
education. This information is split by subject studied, institution, gender and year after graduation.
For mature students, their postcode immediately before entering higher education is less likely to be indicative
of the environment they grew up in, and hence their POLAR classification would have to be interpreted
differently from that of non-mature students. We therefore exclude mature students from our POLAR
measure.
HESA do not publish POLAR figures for Scotland, as Scotland’s relatively high participation rate and the high
proportion of higher education students in further education colleges could misrepresent Scottish
contributions to widening participation. Following that line of reasoning, this publication does not include
POLAR figures for Scottish HEIs either.
6. Data matching and match rates
The HESA student records are matched to DWP’s Customer Information System (CIS)8 using an established
matching algorithm based on the following personal characteristics: National Insurance Number (NINO),
forename, surname, date of birth, postcode and sex. Some of these characteristics are simplified to make
the matching process less time-intensive and allow more matches. Only the first initial of the forename is
used, the surname is encoded using an English sound-based algorithm called SOUNDEX9, and for most
matches only the sector of the postcode is used.
All records accessed for analysis are anonymous so that individuals cannot be identified. The personal
identifying records used in the actual matching process are accessed under strict security controls.
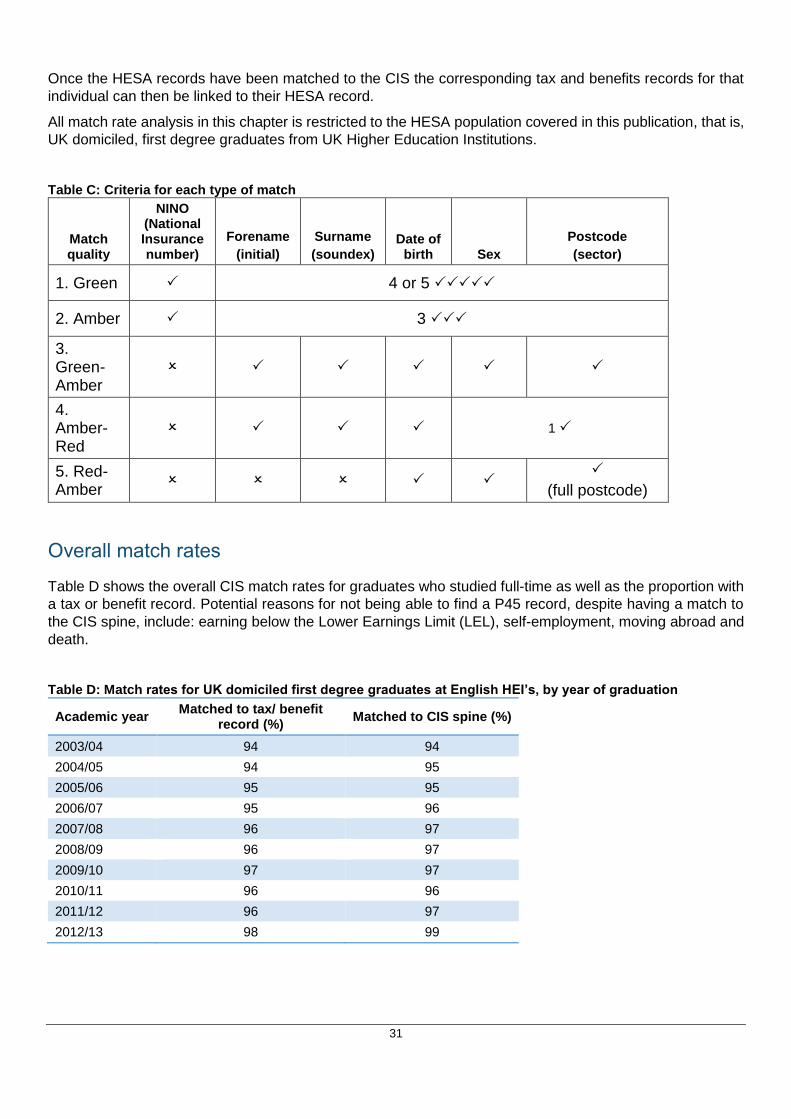
There are five match processes carried out, ranging from the highest quality and most likely to be accurate
(Green) to the lowest quality and most likely to be a false match (Red-Amber). Table C shows the criteria for
each match type.
7 http://www.hefce.ac.uk/analysis/yp/POLAR/ 8 The CIS is a computer system used by the Department for Work and Pensions to store basic identifying information about customers and provides information on all individuals who have ever had a national insurance number. 9 SAS function that turns a surname into a code representing what it sounds like, which allows some flexibility for different spellings. For example Wilson=Willson
31
Once the HESA records have been matched to the CIS the corresponding tax and benefits records for that
individual can then be linked to their HESA record.
All match rate analysis in this chapter is restricted to the HESA population covered in this publication, that is,
UK domiciled, first degree graduates from UK Higher Education Institutions.
Table C: Criteria for each type of match
Match quality
NINO (National Insurance number)
Forename
(initial)
Surname
(soundex) Date of
birth Sex
Postcode
(sector)
1. Green 4 or 5
2. Amber 3
3. Green-Amber
4. Amber-Red
1
5. Red-Amber
(full postcode)
Overall match rates
Table D shows the overall CIS match rates for graduates who studied full-time as well as the proportion with
a tax or benefit record. Potential reasons for not being able to find a P45 record, despite having a match to
the CIS spine, include: earning below the Lower Earnings Limit (LEL), self-employment, moving abroad and
death.
Table D: Match rates for UK domiciled first degree graduates at English HEI’s, by year of graduation
Academic year Matched to tax/ benefit
record (%) Matched to CIS spine (%)
2003/04 94 94
2004/05 94 95
2005/06 95 95
2006/07 95 96
2007/08 96 97
2008/09 96 97
2009/10 97 97
2010/11 96 96
2011/12 96 97
2012/13 98 99

32
Table D shows that the match rate was very high for the most recent cohorts: 99% of full-time graduates in
2012/13 were matched using the CIS, and almost all of these had at least one tax or out-of-work benefit
record. This compares to a match rate of 94% of graduates in 2003/04. The higher match rates for more
recent cohorts is at least partly explained because the CIS holds the most recent names and addresses for
individuals, and so if the details change after someone graduates there is less chance that they will be
matched.
Due to improvements in the matching process since our first publication, our match rates increased slightly
from our first to our second publication. This is particularly apparent for the 2010/11 and 2011/12 cohorts,
which had a dip in the match rate in our first publication compared to other cohorts. Match rates for these
cohorts are now more comparable with other cohorts. The dataset used for this publication is identical to that
in our second publication.
Match rate by graduate characteristic
Table E shows match rates by sex. The match rate for females is slightly lower in the earlier years than for
males, but this difference is negligible or non-existent in recent cohorts. As the CIS holds the latest information
about an individual, anyone that has changed their name since graduation will have a different name on the
CIS compared to their HESA record. This particularly affects females, due to a higher likelihood than males
of changing their name upon marriage.
Table E: CIS match rate by sex
Academic year Female (%) Male (%)
2003/04 92 97
2004/05 93 97
2005/06 93 98
2006/07 95 98
2007/08 96 98
2008/09 96 98
2009/10 97 98
2010/11 96 97
2011/12 96 97
2012/13 99 99
2013/14 99 99
The match rates were also compared for different ethnic groups out of the UK-domiciled students. There was
little consistent difference between the groups, the only exception being graduates whose self-declared
ethnicity was Chinese, where the match rate was 91% in 2012/13. Further investigation showed that this was
most likely due to the ethnically Chinese forenames and surnames being switched on one of the databases.
This is more common for Chinese names, because the family name traditionally comes before the individual
name. This hypothesis is further corroborated by the fact that ethnically Chinese students with common
English names have match rates that are very similar to graduates from other ethnic groups.
The number of forenames or surnames an individual has can affect the match rate, because with multiple
names it is more likely that they will not all be recorded, or there may be forenames recorded as surnames
or vice versa. Analysis of the match rates showed that those with at least two surnames had a slightly lower
match rate than those with only one.

33
7. Next steps
We welcome user feedback on the data contained in this release, and those wishing to provide comments
should send them to [email protected]. As we develop the LEO data further, we will look to publish
further experimental statistical releases as well as establish a regular cycle of publications covering graduate
outcomes to inform public understanding of the higher education system and improve the information
available to students when deciding on higher education institutions and subjects.
8. Accompanying tables
The following table is available in Excel format on the department’s statistics website.
Subject by institution table (Excel .xls)
Table 1: Activity of graduates by subject and institution one, three and five years after graduation
9. Feedback
We welcome feedback on this publication. Contact details can be found in section 12: Get in touch.
10. Glossary
Academic year: Runs from 1 August to 31 July. For example, the 2012/13 academic year ran from 1 August
2012 to 31 July 2013.
Customer Information System (CIS): A computer system used by the Department for Work and Pensions
that contains a record for all individuals that have been issued with a National Insurance (NINO) number. It
contains basic identifying information such as name, address, date of birth and NINO.
First degree qualification: This covers qualifications commonly known as bachelor’s degrees and includes
postgraduate bachelor’s degrees at H level. Not all undergraduate courses are included: for example, the
Professional Graduate Certificate in Education (PGCE), foundation degrees and Higher National Diplomas
(HND) are excluded. For further information on this classification, please refer to the Higher Education
Statistics Agency at the link referenced below.10 Note that it does not necessarily mean that the degree is the
first higher education qualification undertaken by the student.
Further study: The HESA Student Record is used to identify instances of further study in higher education.
Students enrolled on further education courses, on some initial teacher training enhancement, booster and
extension courses, whose study status is dormant or who were on sabbatical are excluded from this indicator.
Each tax year spans two academic years; therefore, graduates will be flagged as being in further study if they
have a HESA record in one of these two academic years.
HEI: Higher Education Institution.
Higher Education Statistics Agency (HESA): collects data from universities, higher education colleges and
other specialist providers of higher education. In this publication, we have used the HESA Student Record to
identify our graduate base population and higher education further study instances.
Individualised Learner Record (ILR): used by the further education (FE) and skills sector in England to
collect data about learners in the system and the learning undertaken by each of them.
Joint Academic Coding System (JACS): a standardised way of classifying academic subjects and
modules, maintained by HESA and the Universities and Colleges Admissions Service (UCAS). In this
10 Under ‘Field Explanations’: https://www.hesa.ac.uk/support/definitions/students#level-study-qualification-obtained

34
publication, we group subjects using JACS high-level subject groupings. Previous research has shown that
the earnings profile of economics graduates differs substantially from graduates of other social sciences;
therefore, in this publication we have presented Nursing separately from other Subjects Allied to Medicine,
Psychology separately from other Biological Sciences, economics separately from other social sciences, and
English Studies separately from other Language.
JACS code Subject
1 Medicine & Dentistry
2 Subjects Allied to Medicine (excluding Nursing)
B7 Nursing
3 Biological Sciences (excluding Psychology)
C8 Psychology
4 Veterinary Science
5 Agriculture & Related Subjects
6 Physical Sciences
7 Mathematical Sciences
8 Computer Science
9 Engineering & Technology
A Architecture, Building & Planning
B Social Studies (excluding Economics)
L1 Economics
C Law
D Business & Administrative Studies
E Mass Communications & Documentation
F Languages (excluding English Studies)
Q3 English Studies
G Historical & Philosophical Studies
H Creative Arts & Design
I Education
J Combined
Mature students: We define mature students as those who were 21 or above on the 30 September of the
academic year in which they commenced their studies and young students to be those who were below 21
on that date. 72.8% of matched 2008/09 graduates are classed as young students and 27.2% as mature.
National pupil database (NPD): contains information about pupils in schools and colleges in England. It
includes information on test and exam results, prior attainment and pupil progress, as well as pupil
characteristics such as sex, ethnicity and eligibility for free school meals.
Nominal earnings: Nominal earnings represent the cash amount an individual was paid. They are not
adjusted for inflation (the general increase in the price of goods and services).
PAYE: HMRC’s system to collect Income Tax and National Insurance from employment. The LEO project
uses information from the P45 to ascertain employment spell length and from the P14 (P60) to determine
annual earnings. See section 3: Data quality for a discussion of how PAYE data has been used in LEO.

35
Self-assessment: Self-assessment data captures the activity of individuals with income that is not taxed
through PAYE, such as income from self-employment, savings and investments, property rental, and shares.
Sustained employment: A learner is counted in sustained employment if they were recorded as being
employed in 5 out of the 6 months between October and March in the tax year, for example, 5 out of 6 months
between October 2010 and March 2011 for the 2010/11 tax year. Additionally, graduates are counted in
sustained employment if they have returned a self-assessment form for the relevant tax year stating that they
have received income from self-employment.
Sustained annualised earnings: The calculated average daily wage across the tax year grossed up to the
equivalent annual figure. This is only calculated where the learner was in sustained employment. Earnings
figures in this publication are nominal. Self-assessed earnings data is not available.
Tax year: Runs from 6 April to 5 April the following year. For example, the reference period covered by the
2014/15 tax year runs from 6 April 2014 to 5 April 2015.
UK Domiciled: indicates that the student was domiciled in England, Scotland, Wales or Northern Ireland
prior to entry of the course. Students who were domiciled in the Channel Islands or the Isle of Man are not
considered to be UK domiciled in this publication.
11. Experimental statistics
Experimental statistics are new official statistics that are undergoing evaluation. These statistics are being
published as experimental statistics in order to involve users and stakeholders in their development and as
a means to further improve the use of the data in the future.
The Department has a set of statistical policies in line with the Code of Practice for Official Statistics.
12. Get in touch
Media enquiries
Press Office News Desk, Department for Education, Sanctuary Buildings, Great Smith Street, London SW1P
3BT.
Tel: 020 7783 8300
Other enquiries/feedback
Trevor Pinto, Higher Education Analysis, Department for Education, Sanctuary Buildings, Great Smith St,
London SW1P 3BT.
Tel: 07388 372209 Email: [email protected]

36
© Crown copyright 2015
This publication (not including logos) is licensed under the terms of the
Open Government Licence v3.0 except where otherwise stated. Where
we have identified any third party copyright information you will need to
obtain permission from the copyright holders concerned.
To view this licence:
visit www.nationalarchives.gov.uk/doc/open-government-licence/version/3
email [email protected]
write to Information Policy Team, The National Archives, Kew, London, TW9 4DU
About this publication:
enquiries: Trevor Pinto, Higher Education Analysis, Department for Education, Sanctuary
Buildings, Great Smith Street, London SW1P 3BT. Tel: 07388 372 209
email: [email protected]
https://www.gov.uk/government/statistics?departments%5B%5D=department-for-education
Reference: [SFR 18/2017]
Follow us on Twitter: @educationgovuk
Like us on Facebook: facebook.com/educationgovuk