Graduate Program in Engineering and Technology Management Simulation of Discrete Event Systems Aslı...
30
Graduate Program in Engineering and Technology Management Simulation of Discrete Event Systems Aslı Sencer
-
Upload
rachel-craig -
Category
Documents
-
view
217 -
download
2
Transcript of Graduate Program in Engineering and Technology Management Simulation of Discrete Event Systems Aslı...

Graduate Program in Engineering and Technology Management
Simulation of Discrete Event Systems
Aslı Sencer

2
Dynamic Simulation:Queueing System
Arrivals Departures
Service
is identified by:
•Arrival rate, interarrival time distribution•Service rate, service time distribution•# servers•# queues•Queue capacities•Queue disciplines, FIFO, LIFO, etc.
Aslı Sencer

3
M/M/1 Queueing System
Arrivals Departures
Service
M: interarrival time is exponentially distributedM: service time is exponentially distributed1: There is a single server
Aslı Sencer

4
Ex3: Model Specifics Initially (time 0) empty and idle Base time units: minutes Input data (assume given for now …), in minutes:
Part Number Arrival Time Interarrival Time Service Time1 0.00 1.73 2.902 1.73 1.35 1.763 3.08 0.71 3.394 3.79 0.62 4.525 4.41 14.28 4.466 18.69 0.70 4.367 19.39 15.52 2.078 34.91 3.15 3.369 38.06 1.76 2.37
10 39.82 1.00 5.3811 40.82 . .
. . . .
. . . . Stop when 20 minutes of (simulated) time have
passed
Aslı Sencer

5
Queuing Simulation Random variables:
Time between arrivals Service time represented by probability distributions.
Events: Arrival of a customer to the system Departure from the system.
State variables: # customers in the queue Worker status {busy, idle}
Output measures: Average waiting time in the queue % utilization of the server Average time spent in the system
Aslı Sencer

6
Output Performance Measures
Total production of parts over the run (P) Average waiting time of parts in queue:
Maximum waiting time of parts in queue:
N = no. of parts completing queue waitWQi = waiting time in queue of ith partKnow: WQ1 = 0 (why?)
N > 1 (why?)N
WQN
ii
1
iNi
WQmax,...,1
Aslı Sencer

7
Output Performance Measures (cont’d.)
Time-average number of parts in queue:
Maximum number of parts in queue:
Average and maximum total time in system of parts:
Q(t) = number of parts in queue at time t
20
)(200 dttQ
)(max200
tQt
iPi
P
ii
TSP
TS
max,...,1
1 ,
TSi = time in system of part i
Aslı Sencer

8
Output Performance Measures (cont’d.)
Utilization of the machine (proportion of time busy)
Many others possible (information overload?)
t
ttB
dttB
timeat idle is machine the if0
timeat busy is machine the if1)(,
20
)(200
Aslı Sencer

9
Simulation by Hand
Manually track state variables, statistical accumulators
Use “given” interarrival, service times Keep track of event calendar “Lurch” clock from one event to the next Will omit times in system, “max” computations
here (see text for complete details)
Aslı Sencer

10
System
Clock
B(t)
Q(t)
Arrival times of custs. in queue
Event calendar
Number of completed waiting times in queue
Total of waiting times in queue
Area under Q(t)
Area under B(t)
Q(t) graph B(t) graph
Time (Minutes) Interarrival times 1.73, 1.35, 0.71, 0.62, 14.28, 0.70, 15.52, 3.15, 1.76, 1.00, ...
Service times 2.90, 1.76, 3.39, 4.52, 4.46, 4.36, 2.07, 3.36, 2.37, 5.38, ...
Simulation by Hand: Setup
0
1
2
3
4
0 5 10 15 20
012
0 5 10 15 20
Aslı Sencer

11
System
Clock 0.00
B(t) 0
Q(t) 0
Arrival times of custs. in queue
<empty>
Event calendar [1, 0.00, Arr] [–, 20.00, End]
Number of completed waiting times in queue 0
Total of waiting times in queue 0.00
Area under Q(t) 0.00
Area under B(t) 0.00
Q(t) graph B(t) graph
Time (Minutes) Interarrival times 1.73, 1.35, 0.71, 0.62, 14.28, 0.70, 15.52, 3.15, 1.76, 1.00, ...
Service times 2.90, 1.76, 3.39, 4.52, 4.46, 4.36, 2.07, 3.36, 2.37, 5.38, ...
Simulation by Hand: t = 0.00, Initialize
0
1
2
3
4
0 5 10 15 20
012
0 5 10 15 20
Aslı Sencer

12
System
Clock 0.00
B(t) 1
Q(t) 0
Arrival times of custs. in queue
<empty>
Event calendar [2, 1.73, Arr] [1, 2.90, Dep] [–, 20.00, End]
Number of completed waiting times in queue 1
Total of waiting times in queue 0.00
Area under Q(t) 0.00
Area under B(t) 0.00
Q(t) graph B(t) graph
Time (Minutes) Interarrival times 1.73, 1.35, 0.71, 0.62, 14.28, 0.70, 15.52, 3.15, 1.76, 1.00, ...
Service times 2.90, 1.76, 3.39, 4.52, 4.46, 4.36, 2.07, 3.36, 2.37, 5.38, ...
Simulation by Hand: t = 0.00, Arrival of Part 1
0
1
2
3
4
0 5 10 15 20
012
0 5 10 15 20
1
Aslı Sencer

13
System
Clock 1.73
B(t) 1
Q(t) 1
Arrival times of custs. in queue
(1.73)
Event calendar [1, 2.90, Dep] [3, 3.08, Arr] [–, 20.00, End]
Number of completed waiting times in queue 1
Total of waiting times in queue 0.00
Area under Q(t) 0.00
Area under B(t) 1.73
Q(t) graph B(t) graph
Time (Minutes) Interarrival times 1.73, 1.35, 0.71, 0.62, 14.28, 0.70, 15.52, 3.15, 1.76, 1.00, ...
Service times 2.90, 1.76, 3.39, 4.52, 4.46, 4.36, 2.07, 3.36, 2.37, 5.38, ...
Simulation by Hand: t = 1.73, Arrival of Part 2
0
1
2
3
4
0 5 10 15 20
012
0 5 10 15 20
12
Aslı Sencer

14
System
Clock 2.90
B(t) 1
Q(t) 0
Arrival times of custs. in queue
<empty>
Event calendar [3, 3.08, Arr] [2, 4.66, Dep] [–, 20.00, End]
Number of completed waiting times in queue 2
Total of waiting times in queue 1.17
Area under Q(t) 1.17
Area under B(t) 2.90
Q(t) graph B(t) graph
Time (Minutes) Interarrival times 1.73, 1.35, 0.71, 0.62, 14.28, 0.70, 15.52, 3.15, 1.76, 1.00, ...
Service times 2.90, 1.76, 3.39, 4.52, 4.46, 4.36, 2.07, 3.36, 2.37, 5.38, ...
Simulation by Hand: t = 2.90, Departure of Part 1
0
1
2
3
4
0 5 10 15 20
012
0 5 10 15 20
2
Aslı Sencer

15
System
Clock 3.08
B(t) 1
Q(t) 1
Arrival times of custs. in queue
(3.08)
Event calendar [4, 3.79, Arr] [2, 4.66, Dep] [–, 20.00, End]
Number of completed waiting times in queue 2
Total of waiting times in queue 1.17
Area under Q(t) 1.17
Area under B(t) 3.08
Q(t) graph B(t) graph
Time (Minutes) Interarrival times 1.73, 1.35, 0.71, 0.62, 14.28, 0.70, 15.52, 3.15, 1.76, 1.00, ...
Service times 2.90, 1.76, 3.39, 4.52, 4.46, 4.36, 2.07, 3.36, 2.37, 5.38, ...
Simulation by Hand: t = 3.08, Arrival of Part 3
0
1
2
3
4
0 5 10 15 20
012
0 5 10 15 20
23
Aslı Sencer

16
System
Clock 3.79
B(t) 1
Q(t) 2
Arrival times of custs. in queue
(3.79, 3.08)
Event calendar [5, 4.41, Arr] [2, 4.66, Dep] [–, 20.00, End]
Number of completed waiting times in queue 2
Total of waiting times in queue 1.17
Area under Q(t) 1.88
Area under B(t) 3.79
Q(t) graph B(t) graph
Time (Minutes) Interarrival times 1.73, 1.35, 0.71, 0.62, 14.28, 0.70, 15.52, 3.15, 1.76, 1.00, ...
Service times 2.90, 1.76, 3.39, 4.52, 4.46, 4.36, 2.07, 3.36, 2.37, 5.38, ...
Simulation by Hand: t = 3.79, Arrival of Part 4
0
1
2
3
4
0 5 10 15 20
012
0 5 10 15 20
234
Aslı Sencer

17
System
Clock 4.41
B(t) 1
Q(t) 3
Arrival times of custs. in queue
(4.41, 3.79, 3.08)
Event calendar [2, 4.66, Dep] [6, 18.69, Arr] [–, 20.00, End]
Number of completed waiting times in queue 2
Total of waiting times in queue 1.17
Area under Q(t) 3.12
Area under B(t) 4.41
Q(t) graph B(t) graph
Time (Minutes)
Interarrival times 1.73, 1.35, 0.71, 0.62, 14.28, 0.70, 15.52, 3.15, 1.76, 1.00, ...
Service times 2.90, 1.76, 3.39, 4.52, 4.46, 4.36, 2.07, 3.36, 2.37, 5.38, ...
Simulation by Hand: t = 4.41, Arrival of Part 5
0
1
2
3
4
0 5 10 15 20
012
0 5 10 15 20
2345
Aslı Sencer

18
System
Clock 4.66
B(t) 1
Q(t) 2
Arrival times of custs. in queue
(4.41, 3.79)
Event calendar [3, 8.05, Dep] [6, 18.69, Arr] [–, 20.00, End]
Number of completed waiting times in queue 3
Total of waiting times in queue 2.75
Area under Q(t) 3.87
Area under B(t) 4.66
Q(t) graph B(t) graph
Time (Minutes)
Interarrival times 1.73, 1.35, 0.71, 0.62, 14.28, 0.70, 15.52, 3.15, 1.76, 1.00, ...
Service times 2.90, 1.76, 3.39, 4.52, 4.46, 4.36, 2.07, 3.36, 2.37, 5.38, ...
Simulation by Hand: t = 4.66, Departure of Part 2
0
1
2
3
4
0 5 10 15 20
012
0 5 10 15 20
345
Aslı Sencer

19
System
Clock 8.05
B(t) 1
Q(t) 1
Arrival times of custs. in queue
(4.41)
Event calendar [4, 12.57, Dep] [6, 18.69, Arr] [–, 20.00, End]
Number of completed waiting times in queue 4
Total of waiting times in queue 7.01
Area under Q(t) 10.65
Area under B(t) 8.05
Q(t) graph B(t) graph
Time (Minutes)
Interarrival times 1.73, 1.35, 0.71, 0.62, 14.28, 0.70, 15.52, 3.15, 1.76, 1.00, ...
Service times 2.90, 1.76, 3.39, 4.52, 4.46, 4.36, 2.07, 3.36, 2.37, 5.38, ...
Simulation by Hand: t = 8.05, Departure of Part 3
0
1
2
3
4
0 5 10 15 20
012
0 5 10 15 20
45
Aslı Sencer

20
System
Clock 12.57
B(t) 1
Q(t) 0
Arrival times of custs. in queue
()
Event calendar [5, 17.03, Dep] [6, 18.69, Arr] [–, 20.00, End]
Number of completed waiting times in queue 5
Total of waiting times in queue 15.17
Area under Q(t) 15.17
Area under B(t) 12.57
Q(t) graph B(t) graph
Time (Minutes)
Interarrival times 1.73, 1.35, 0.71, 0.62, 14.28, 0.70, 15.52, 3.15, 1.76, 1.00, ...
Service times 2.90, 1.76, 3.39, 4.52, 4.46, 4.36, 2.07, 3.36, 2.37, 5.38, ...
Simulation by Hand: t = 12.57, Departure of Part 4
0
1
2
3
4
0 5 10 15 20
012
0 5 10 15 20
5
Aslı Sencer

21
System
Clock 17.03
B(t) 0
Q(t) 0
Arrival times of custs. in queue ()
Event calendar [6, 18.69, Arr] [–, 20.00, End]
Number of completed waiting times in queue 5
Total of waiting times in queue 15.17
Area under Q(t) 15.17
Area under B(t) 17.03
Q(t) graph B(t) graph
Time (Minutes)
Interarrival times 1.73, 1.35, 0.71, 0.62, 14.28, 0.70, 15.52, 3.15, 1.76, 1.00, ...
Service times 2.90, 1.76, 3.39, 4.52, 4.46, 4.36, 2.07, 3.36, 2.37, 5.38, ...
Simulation by Hand: t = 17.03, Departure of Part 5
0
1
2
3
4
0 5 10 15 20
012
0 5 10 15 20
Aslı Sencer

22
System
Clock 18.69
B(t) 1
Q(t) 0
Arrival times of custs. in queue ()
Event calendar [7, 19.39, Arr] [–, 20.00, End] [6, 23.05, Dep]
Number of completed waiting times in queue 6
Total of waiting times in queue 15.17
Area under Q(t) 15.17
Area under B(t) 17.03
Q(t) graph B(t) graph
Time (Minutes)
Interarrival times 1.73, 1.35, 0.71, 0.62, 14.28, 0.70, 15.52, 3.15, 1.76, 1.00, ...
Service times 2.90, 1.76, 3.39, 4.52, 4.46, 4.36, 2.07, 3.36, 2.37, 5.38, ...
Simulation by Hand: t = 18.69, Arrival of Part 6
0
1
2
3
4
0 5 10 15 20
012
0 5 10 15 20
6
Aslı Sencer

23
System
Clock 19.39
B(t) 1
Q(t) 1
Arrival times of custs. in queue
(19.39)
Event calendar [–, 20.00, End] [6, 23.05, Dep] [8, 34.91, Arr]
Number of completed waiting times in queue 6
Total of waiting times in queue 15.17
Area under Q(t) 15.17
Area under B(t) 17.73
Q(t) graph B(t) graph
Time (Minutes)
Interarrival times 1.73, 1.35, 0.71, 0.62, 14.28, 0.70, 15.52, 3.15, 1.76, 1.00, ...
Service times 2.90, 1.76, 3.39, 4.52, 4.46, 4.36, 2.07, 3.36, 2.37, 5.38, ...
Simulation by Hand: t = 19.39, Arrival of Part 7
0
1
2
3
4
0 5 10 15 20
012
0 5 10 15 20
67
Aslı Sencer

24
Simulation by Hand: t = 20.00, The End
0
1
2
3
4
0 5 10 15 20
012
0 5 10 15 20
67
System
Clock 20.00
B(t) 1
Q(t) 1
Arrival times of custs. in queue
(19.39)
Event calendar [6, 23.05, Dep] [8, 34.91, Arr]
Number of completed waiting times in queue 6
Total of waiting times in queue 15.17
Area under Q(t) 15.78
Area under B(t) 18.34
Q(t) graph B(t) graph
Time (Minutes)
Interarrival times 1.73, 1.35, 0.71, 0.62, 14.28, 0.70, 15.52, 3.15, 1.76, 1.00, ...
Service times 2.90, 1.76, 3.39, 4.52, 4.46, 4.36, 2.07, 3.36, 2.37, 5.38, ...
Aslı Sencer

25
Ex3:Complete Record of the Hand Simulation
Aslı Sencer

26
Ex3: Simulation by Hand:Finishing Up Average waiting time in queue:
Time-average number in queue:
Utilization of drill press:
part per minutes 53261715
queue in times of No.queue in times of Total
..
part 79.020
78.15
eclock valu Final
curve )(under Area
tQ
less)(dimension 92.020
34.18
eclock valu Final
curve )(under Area
tB
Aslı Sencer

Entity Based-Simulation
Aslı Sencer 27
ITEM #INTERARRIVAL TIME
ARRIVAL TIME
SERVICE TIME
START SERVICE TIME
END SERVICE TIME WAIT TIME
TIME IN SYSTEM
1 1,73 0,00 2,90 0,00 2,90 0,00 2,90
2 1,35 1,73 1,76 2,90 4,66 1,17 2,93
3 0,71 3,08 3,39 4,66 8,05 1,58 4,97
4 0,62 3,79 4,52 8,05 12,57 4,26 8,78
5 14,28 4,41 4,46 12,57 17,03 8,16 12,62
6 0,70 18,69 4,36 18,69 23,05 0,00 4,36
7 15,52 19,39 2,07 23,05
8 3,15 34,91
Average wait time=(0+1.17+1.58+4.26+8.16+0)/6=2.53min
Average time in system=(2.9+2.93+4.97+8.78+12.62+4.36)/6=36.56/6=6.09min
Since simulation ends at 20th minute, 6th item’s process
will not be completed!
The last event that occurs in a simulation will be the arrival of 7th item!
28
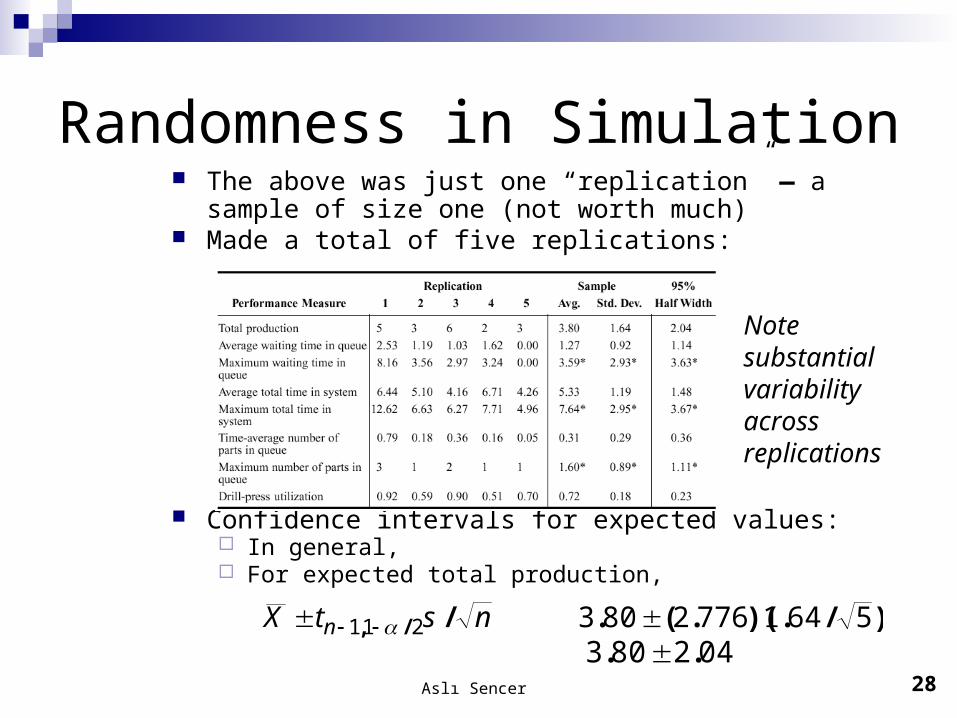
Randomness in Simulation The above was just one “replication” — a sample of size
one (not worth much) Made a total of five replications:
Confidence intervals for expected values: In general, For expected total production,
nstX n //, 211 )/.)(.(. 56417762803 042803 ..
Notesubstantialvariabilityacrossreplications
Aslı Sencer

29
Comparing Alternatives
Usually, simulation is used for more than just a single model “configuration”
Often want to compare alternatives, select or search for the best (via some criterion)
Simple processing system: What would happen if the arrival rate were to double? Cut interarrival times in half Rerun the model for double-time arrivals Make five replications
Aslı Sencer

30
Results: Original vs. Double-Time Arrivals
Original – circles Double-time – triangles Replication 1 – filled in Replications 2-5 – hollow Note variability Danger of making
decisions based on one (first) replication
Hard to see if there are really differences
Need: Statistical analysis of simulation output data
Aslı Sencer