
Grading Dysplasia in Barrett’s Oesophagus Virtual ... · Barrett’s Oesophagus Virtual Pathology...
24
Grading Dysplasia in Barrett’s Oesophagus Virtual Pathology Slides AFZAN ADAM [[email protected]] MEDICAL & HEALTHCARE INFORMATICS LAB CENTER FOR ARTIFICIAL INTELLIGENCE TECHNOLOGY THE NATIONAL UNIVERSITY OF MALAYSIA
Transcript of Grading Dysplasia in Barrett’s Oesophagus Virtual ... · Barrett’s Oesophagus Virtual Pathology...

Grading Dysplasia in Barrett’s Oesophagus Virtual Pathology SlidesAFZAN ADAM [[email protected]]
MEDICAL & HEALTHCARE INFORMATICS LAB
CENTER FOR ARTIFICIAL INTELLIGENCE TECHNOLOGY
THE NATIONAL UNIVERSITY OF MALAYSIA

Dysplasia in Barrett’s Oesophagus
Illustration of dysplasia staging in Oesophagus [1]
[1] John Hopkins Pathology: understanding barret’s. 2000-2015. What is Barrett’s Esophagus. http://pathology2.jhu.edu/beweb/Definition.cfm [18 Sept 2015 ].

◦ Pre-malignant but treatable condition where ‘any portion of the normal squamous lining has been replaced by a metaplastic columnar epithelium that is visible microscopically’[1].
◦ 30-50 times greater chance to develop into oesophagus adenocarcinoma, 10 times to oesophagus cancer[2].
◦ Continuous changes of tissue structure and architecture during transition from Barrett’s->Low Grade Dysplasia (LGD)->High Grade Dysplasia (HGD)->IntraMucosalCarcinoma(IMC)
[1] GUIDELINES FOR THE DIAGNOSIS AND MANAGEMENT OF BARRETT’S CLO . BSG GUIDELINES IN GASTROENTEROLOGY. (28), 2005.[2] SOLAYMANI DODARAN ET.AL. RISK OF OESOPHAGEAL CANCER IN BARRETT’S OESOPHAGUS AND GASTRO OESOPHAGUS REUX. INTERNATIONAL JOURNAL OF GASTROENTEROLOGY AND HEPATOLOGY. 53:1070-1074, 2004
Normal Barrett’s LGD HGD IMC
Dysplasia in Barrett’s Oesophagus

The need for a diagnosis toolLack of universally accepted definition of Barrett’s Oesophagus[2]
Variations of observation results. ◦ Overall agreeement:57%[3]
Continuous transitions of tissue structure and pattern:◦ Poor kappa score (k=0.32) for LGD [4]
◦ Good kappa score (k=0.65)for HGD alone[4]
◦ Fair kappa score (k=0.42) to compare HGD to ICM[5]
The tissue’s cytological and architectural features characterise the level of dysplasia severity [6] and these changes may be too subtle for humans to measure.
[3] TREANOR D ET AL. TRACKING WITH VIRTUAL SLIDES: A TOOL TO STUDY DIAGNOSIS ERROR IN HISTOPATHOLOGY. HISTOPATHOLOGY, 2009[4] MONTGOMERY E, ET AL, DYSPLASIA AS A PREDICTIVE MARKER FOR INVASIVE CARCINOMA IN BARRETT’S ESOPGAHUS, HUMAN PATHOLOGY, 32(4):2001[5] ORMSBY A.H ET AL. OBSERVATION VARIATION IN THE DIAGNOSIS OF SUPERFICIAL OESOPHAGUS ADENOCARCINOMA. INTERNATIONAL JOURNAL OF GASTROENTEROLOGY AND HEPATOLOGY, 671-676:2002[6] RD. ODZE. DIAGNOSIS AND GRADING DYSPLASIA IN BARRETT’S OESOPHAGUS. JOURNAL OF CLINICAL PATHOLOGY, PAGES 1029–1038, 2006.

Some of the challenges:
1. Lack of literature review focuses on finding texture of dysplasia in BO

2. GROUND TRUTH: annotated regions contain ambiguity.
Using consensus diagnosis.
Virtual slide no: 11013 consensus diagnosis: 4
Grade 4 Grade 2 Grade 4Low grade indefinite-probably low gradedysplasia negative dysplasia
Some of the challenges:

Grading scale
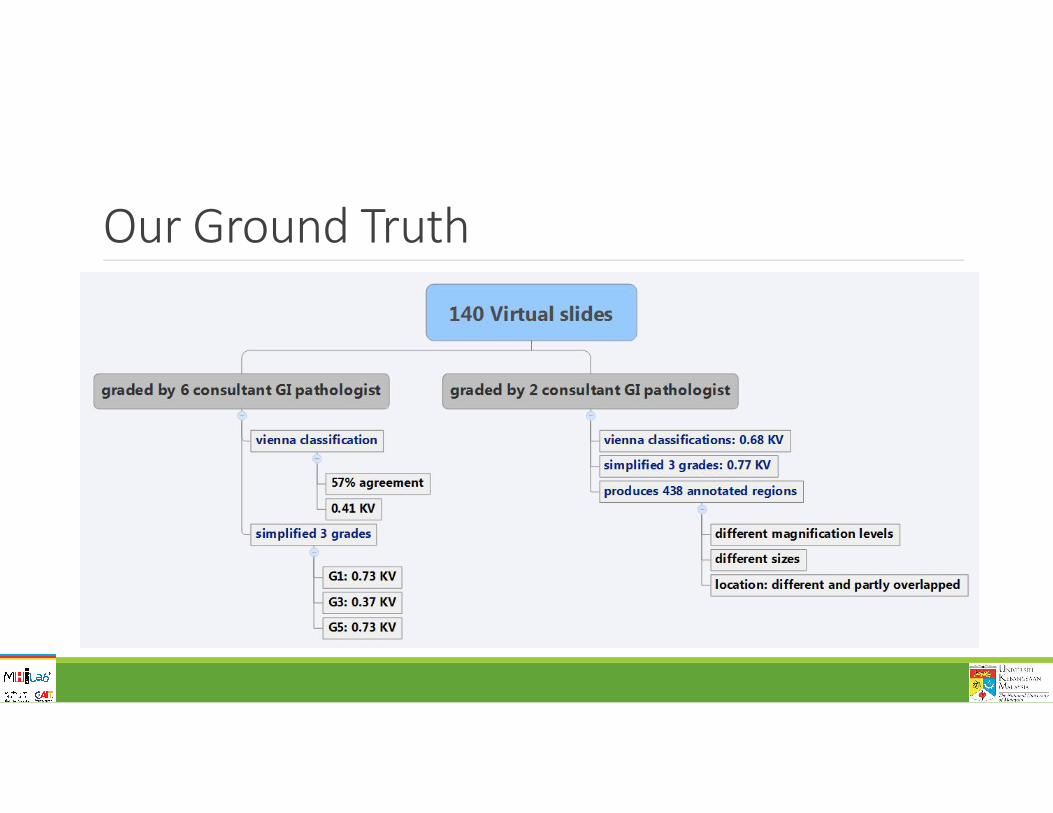
Our Ground Truth
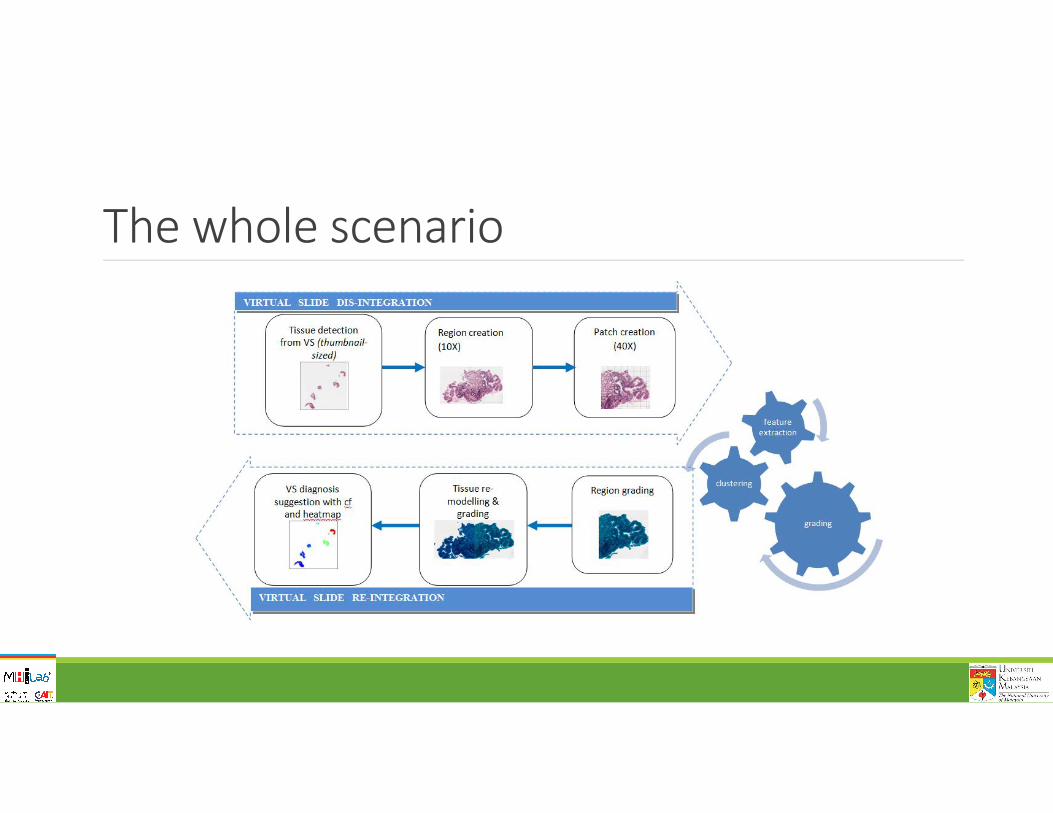
The whole scenario

Stages

Virtual slides: Tissue detection
Preprocess: eliminates
tear-off .

Region creationFor each detected tissue:
1800pix*1800pix
@40X
Rejected regionshighlighted
Region selection process

Region selection processes
ARTEFACTS ELIMINATIONS
1. candidate regions (cr) are indexed2. 1800 pix2 >cr >800 pix2
3. Reject cr if1. Background > 65%2. Average greylevel<0.753. Not in accepted region
*around the bounding box
Filtered out:
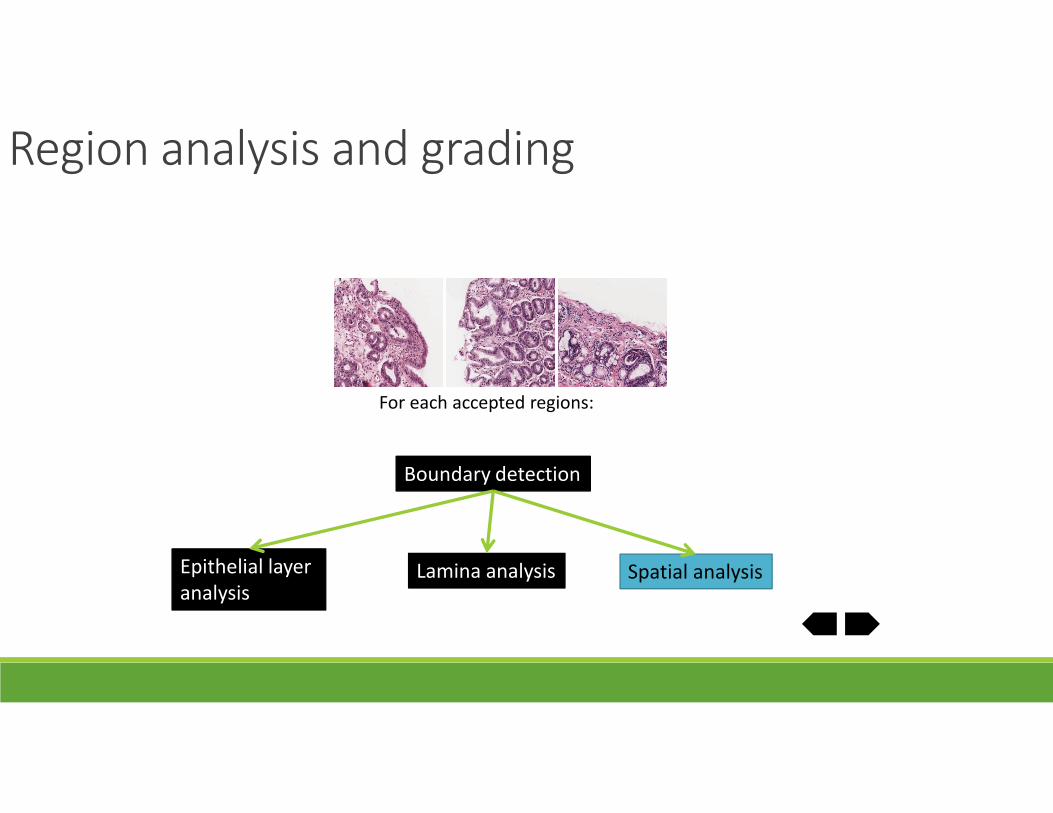
Region analysis and grading
Boundary detection
Epithelial layer analysis
Spatial analysis
For each accepted regions:
Lamina analysis

Epithelial layer analysis
Presented at BMVA technical meeting, London, July 2010
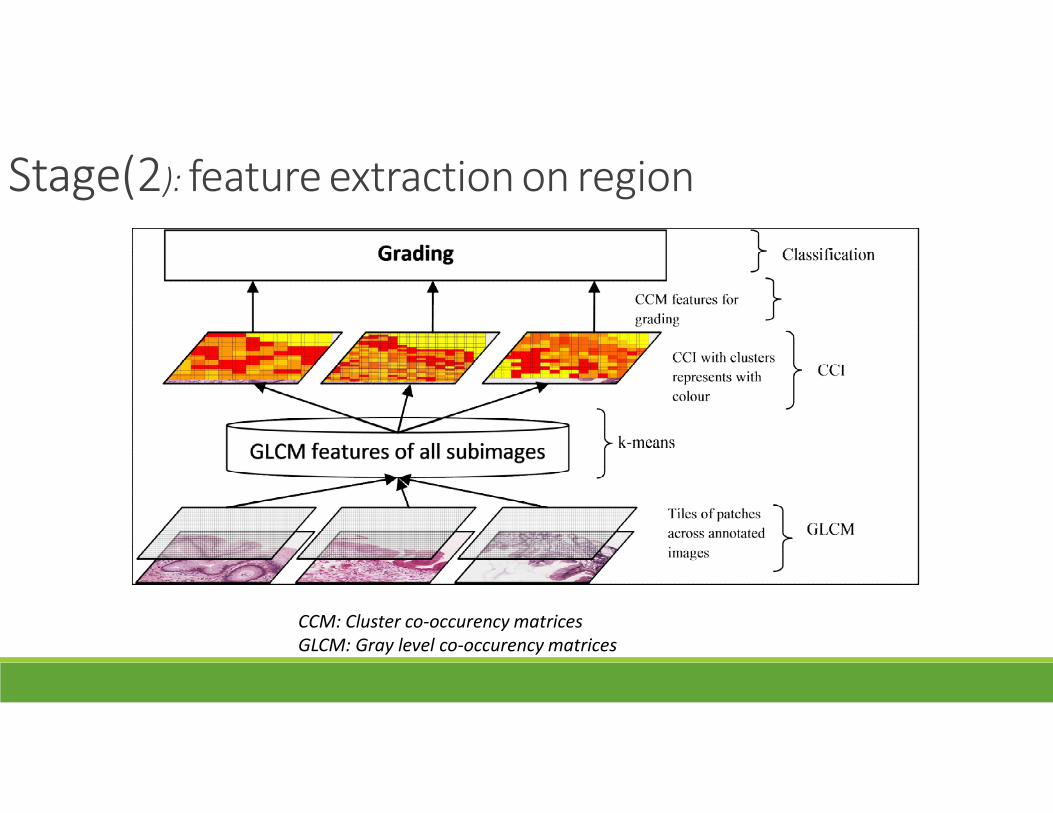
Stage(2): feature extraction on region
CCM: Cluster co-occurency matricesGLCM: Gray level co-occurency matrices

Lamina analysis
Clustered patches CCI from EXP1 and EXP2
Published in MIUA ‘11

Lamina analysis
Published in HIMA workshop, (MICCAI ‘12)
Upgrade result from MIUA with 7 sets of features, binary decision tree, and colour not normalised

Stage(2): feature extraction on region
features Best Result (Accuracy %)
Confusion matrix
FREQUENCY OF CLUSTER5
66.70.17 [0.24]
G1 G3 G5G1 5 2 1G3 2 3 3G5 0 1 7
Single tree (3 grades)
Patch features
GLCM with correlation GLCM without correlation
Grade G1 vs non G3 vs non G5 vs non G1 vs non G3 vs non G5 vs non
CCMfeatures
Full CCM CCM without correlation (CCMWC)
Full CCM Clusterfrequency
Average full CCMfeaturesover eachdirection
Average CCMWC over each direction
AP/ KAPPAVALUE (KV)
75.0 0.5 [0.33]
75.0 [72%] 0.5
81.25 0.63 [0.6]
87.5 0.75 [0.33]
75.0 [72%] 0.50
75.00.5 [0.6]
Confusionmatrix
7 13 5
6 22 6
6 21 7
8 02 6
4 40 8
7 13 5
binary tree

Stage(3): extract spatial features

Region analysis and gradingEpithelial Lamina Spatial
Selected method Clusters co-occurence on boundary-based line
Unsupervisedclustering of patches, CCM & freq
Clusters relative to boundary (3 bins)
Selected parameter
Unrotatedpatches, k=5, R=150, j=100,zoom=10X
k=5, pz=100, n=10, zoom=20X
Surface(<200pix), far(>500pix),middle
Output classification 3 BDT models 3 BDT models
Performance 82.5% AP[Dyp vs non]
A72 0.75 [0.33]A41 75% [72%]A11 0.63 [0.60]
EXP2 0.50EXP1 68.8%EXP1 0.37
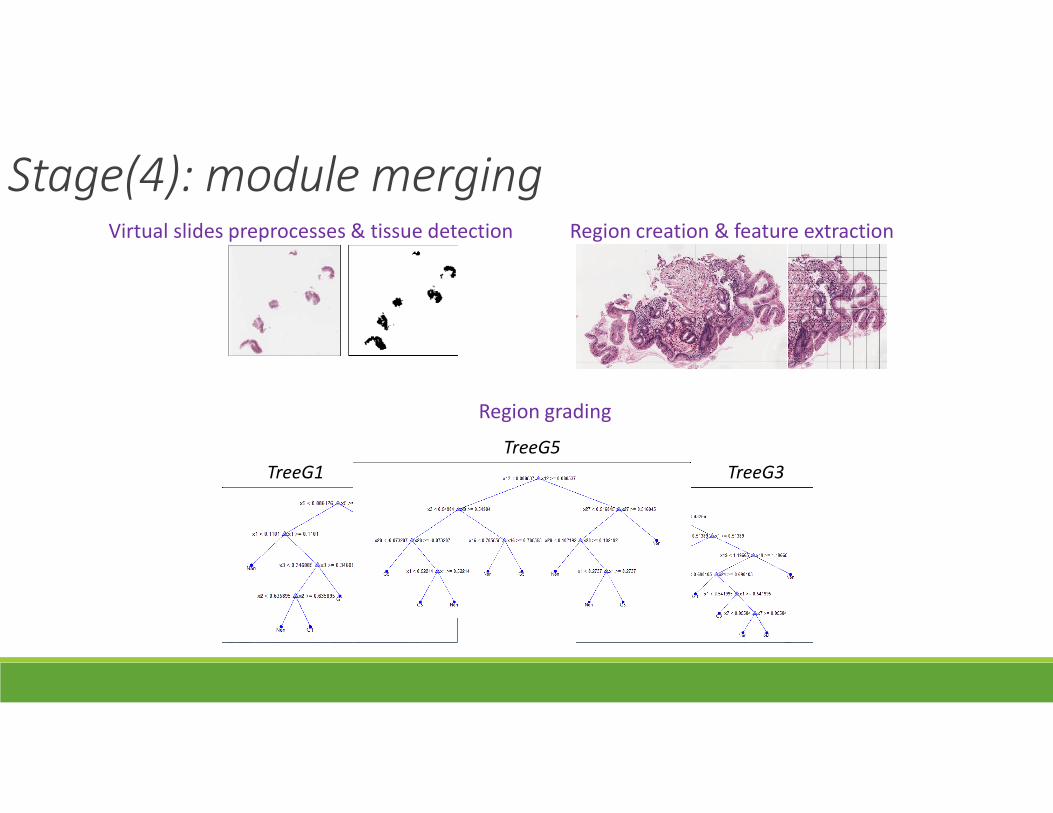
Stage(4): module mergingVirtual slides preprocesses & tissue detection Region creation & feature extraction
TreeG1 TreeG3
TreeG5
Region grading

Conclusions
1. Solution for boundary effect for BO virtual slides.
*separate method to analyse tissue around boundary
2. Texture mapping method (CCI)*translate regions into map of different tissue
texture
3. Understand the spatial arrangement of tissue texture with reference to the epithelial layer.
• Help identify and measure dysplasia conditions with textural and spatial features.
• High agreement score with 0.80 KVwith our pathologist
•
CONTRIBUTIONS OBJECTIVE ACHIEVED?

Thanks to:Dr Andrew J Bulpitt @ School of Computing, University of Leeds
Dr Darren Treanor, Consultant Pathologist @ St James’s Hospital, Leeds
Machine Vision Group @ University of Leeds
Leeds Institute of Molecular Medicine
Pattern Recognition Group @ Faculty of Information Science & Technology, UKM
Center for Artificial intelligence Technology@ Universiti Kebangsaan Malaysia


