Grade 7 Mathematics Standards Resource Guide Document · Indiana Academic Standards for Mathematics...
19
Indiana Academic Standards for Mathematics – Grade 7 Mathematics Standards Resource Guide Document Page 1 of 19 – updated July 2018 This Teacher Resource Guide, revised in July 2018, provides supporting materials to help educators successfully implement the Indiana Academic Standards for Seventh Grade. This resource guide is provided to help ensure all students meet the rigorous learning expectations set by the academic standards. Use of this guide and the resources on the web page is optional – teachers should decide which resources will work best for their students. However, all guidance contained in this document and on the website has been chosen to best support effective teaching practices and promote the Mathematics Process Standards. With an increased emphasis on content area literacy, academic vocabulary has been noted. Best practices should be utilized when teaching students academic vocabulary. Please see the Literacy Framework and the Science and Technical Subjects Content Area Literacy Standards for examples of best practices. Examples have been removed from the document as they tend to limit interpretation and classroom application. Rather, success criteria, in the form of “I can” statements, have been included. According to Hattie (2017), success criteria is specific, concrete and measurable, describing what success looks like when a learning goal is reached. Additionally, success criteria contributes to teacher clarity, which has a 0.75 effect size! An effect size of 0.40 reportedly indicates one year of growth. Utilizing success criteria in the classroom allows students to monitor their own learning and increases motivation (Hattie, p. 57). It is important to note that the success criteria provided here are not intended to be limiting. Teachers may have additional success criteria for their students. Guidance around vertical articulation has been provided in the last two columns. Knowing what was expected of students at previous grade levels will help teachers connect new learning to prior knowledge. Additionally, understanding what a student will be expected to learn in the future provides the teacher a context for the current learning. This information is not exhaustive; rather it is provided to give teachers a quick understanding of how the work builds from previous grade levels into subsequent courses. The Indiana Department of Education (IDOE) math team recommends teachers further study this vertical articulation to situate their course objectives in the broader math context. If you have any questions, please do not hesitate to reach out to the IDOE math team. Contact information for the Elementary and Secondary Math Specialists can be found on the website: https://www.doe.in.gov/standards/mathematics. If you have suggested resources for the website, please share those as well. Hattie, J., Fisher, D., Frey, N., Gojak, L. M., Moore, S. D., & Mellman, W. (2017). Visible learning for mathematics: What works best to optimize student learning, grades K-12. Thousand Oaks, CA: Corwin Mathematics.
Transcript of Grade 7 Mathematics Standards Resource Guide Document · Indiana Academic Standards for Mathematics...
Indiana Academic Standards for Mathematics – Grade 7 Mathematics Standards Resource Guide Document
Page 1 of 19 – updated July 2018
This Teacher Resource Guide, revised in July 2018, provides supporting materials to help educators successfully implement the Indiana Academic Standards for Seventh Grade. This resource guide is provided to help ensure all students meet the rigorous learning expectations set by the academic standards. Use of this guide and the resources on the web page is optional – teachers should decide which resources will work best for their students. However, all guidance contained in this document and on the website has been chosen to best support effective teaching practices and promote the Mathematics Process Standards. With an increased emphasis on content area literacy, academic vocabulary has been noted. Best practices should be utilized when teaching students academic vocabulary. Please see the Literacy Framework and the Science and Technical Subjects Content Area Literacy Standards for examples of best practices.
Examples have been removed from the document as they tend to limit interpretation and classroom application. Rather, success criteria, in the form of “I can” statements, have been included. According to Hattie (2017), success criteria is specific, concrete and measurable, describing what success looks like when a learning goal is reached. Additionally, success criteria contributes to teacher clarity, which has a 0.75 effect size! An effect size of 0.40 reportedly indicates one year of growth. Utilizing success criteria in the classroom allows students to monitor their own learning and increases motivation (Hattie, p. 57). It is important to note that the success criteria provided here are not intended to be limiting. Teachers may have additional success criteria for their students.
Guidance around vertical articulation has been provided in the last two columns. Knowing what was expected of students at previous grade levels will help teachers connect new learning to prior knowledge. Additionally, understanding what a student will be expected to learn in the future provides the teacher a context for the current learning. This information is not exhaustive; rather it is provided to give teachers a quick understanding of how the work builds from previous grade levels into subsequent courses. The Indiana Department of Education (IDOE) math team recommends teachers further study this vertical articulation to situate their course objectives in the broader math context. If you have any questions, please do not hesitate to reach out to the IDOE math team. Contact information for the Elementary and Secondary Math Specialists can be found on the website: https://www.doe.in.gov/standards/mathematics. If you have suggested resources for the website, please share those as well. Hattie, J., Fisher, D., Frey, N., Gojak, L. M., Moore, S. D., & Mellman, W. (2017). Visible learning for mathematics: What works best to optimize student learning, grades K-12. Thousand Oaks, CA: Corwin Mathematics.
Indiana Academic Standards for Mathematics – Grade 7 Mathematics Standards Resource Guide Document
Page 2 of 19 – updated July 2018
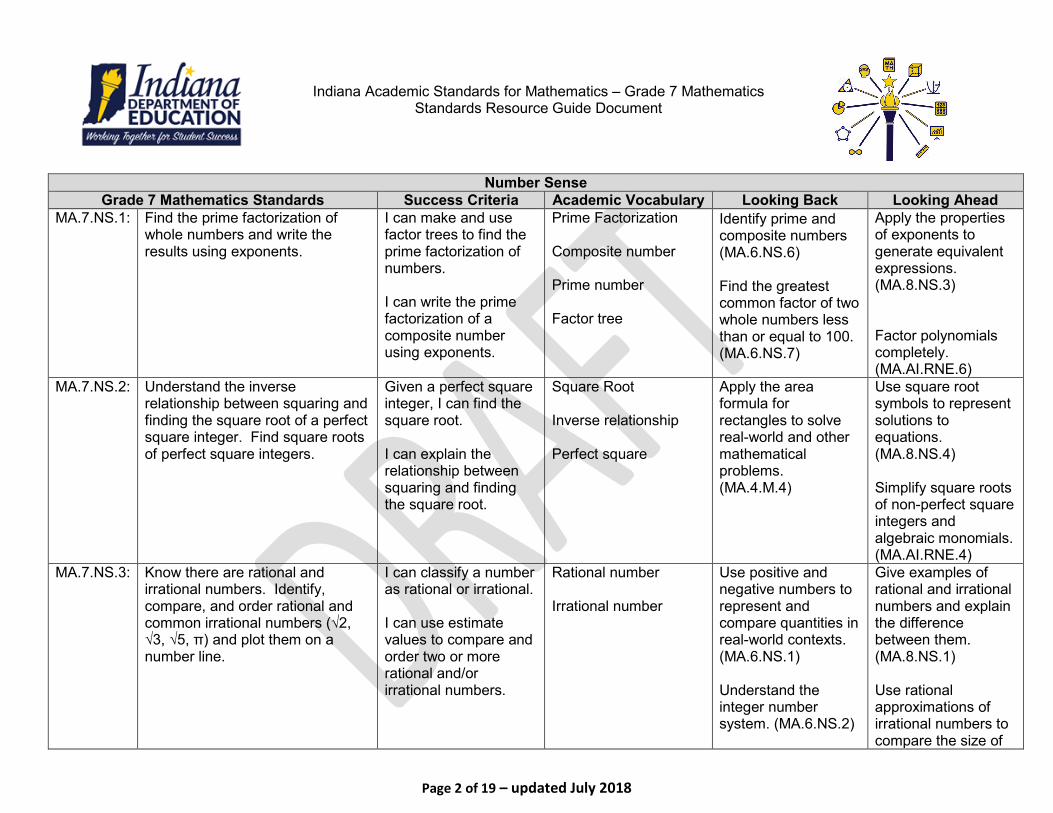
Number Sense Grade 7 Mathematics Standards Success Criteria Academic Vocabulary Looking Back Looking Ahead
MA.7.NS.1: Find the prime factorization of whole numbers and write the results using exponents.
I can make and use factor trees to find the prime factorization of numbers. I can write the prime factorization of a composite number using exponents.
Prime Factorization Composite number Prime number Factor tree
Identify prime and composite numbers (MA.6.NS.6) Find the greatest common factor of two whole numbers less than or equal to 100. (MA.6.NS.7)
Apply the properties of exponents to generate equivalent expressions. (MA.8.NS.3) Factor polynomials completely. (MA.AI.RNE.6)
MA.7.NS.2: Understand the inverse relationship between squaring and finding the square root of a perfect square integer. Find square roots of perfect square integers.
Given a perfect square integer, I can find the square root. I can explain the relationship between squaring and finding the square root.
Square Root Inverse relationship Perfect square
Apply the area formula for rectangles to solve real-world and other mathematical problems. (MA.4.M.4)
Use square root symbols to represent solutions to equations. (MA.8.NS.4) Simplify square roots of non-perfect square integers and algebraic monomials. (MA.AI.RNE.4)
MA.7.NS.3: Know there are rational and irrational numbers. Identify, compare, and order rational and common irrational numbers (√2, √3, √5, π) and plot them on a number line.
I can classify a number as rational or irrational. I can use estimate values to compare and order two or more rational and/or irrational numbers.
Rational number Irrational number
Use positive and negative numbers to represent and compare quantities in real-world contexts. (MA.6.NS.1) Understand the integer number system. (MA.6.NS.2)
Give examples of rational and irrational numbers and explain the difference between them. (MA.8.NS.1) Use rational approximations of irrational numbers to compare the size of
Indiana Academic Standards for Mathematics – Grade 7 Mathematics Standards Resource Guide Document
Page 3 of 19 – updated July 2018
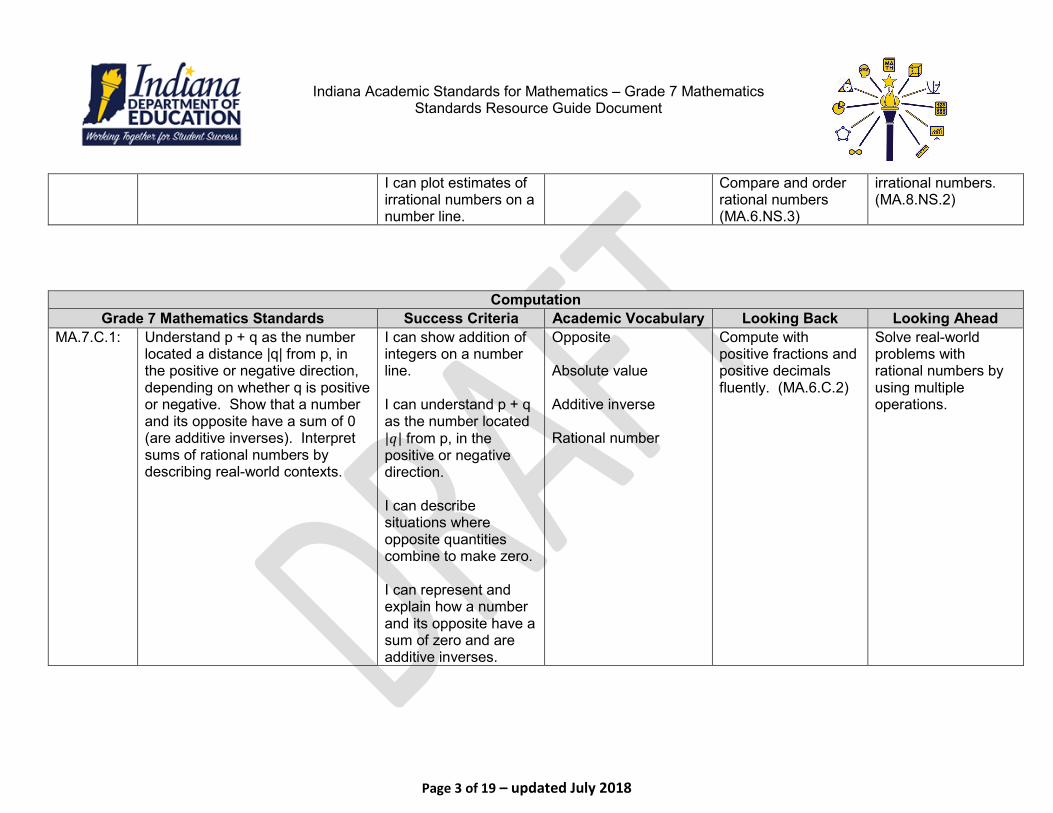
I can plot estimates of irrational numbers on a number line.
Compare and order rational numbers (MA.6.NS.3)
irrational numbers. (MA.8.NS.2)
Computation Grade 7 Mathematics Standards Success Criteria Academic Vocabulary Looking Back Looking Ahead
MA.7.C.1: Understand p + q as the number located a distance |q| from p, in the positive or negative direction, depending on whether q is positive or negative. Show that a number and its opposite have a sum of 0 (are additive inverses). Interpret sums of rational numbers by describing real-world contexts.
I can show addition of integers on a number line. I can understand p + q as the number located |𝑞𝑞| from p, in the positive or negative direction. I can describe situations where opposite quantities combine to make zero. I can represent and explain how a number and its opposite have a sum of zero and are additive inverses.
Opposite Absolute value Additive inverse Rational number
Compute with positive fractions and positive decimals fluently. (MA.6.C.2)
Solve real-world problems with rational numbers by using multiple operations.
Indiana Academic Standards for Mathematics – Grade 7 Mathematics Standards Resource Guide Document
Page 4 of 19 – updated July 2018
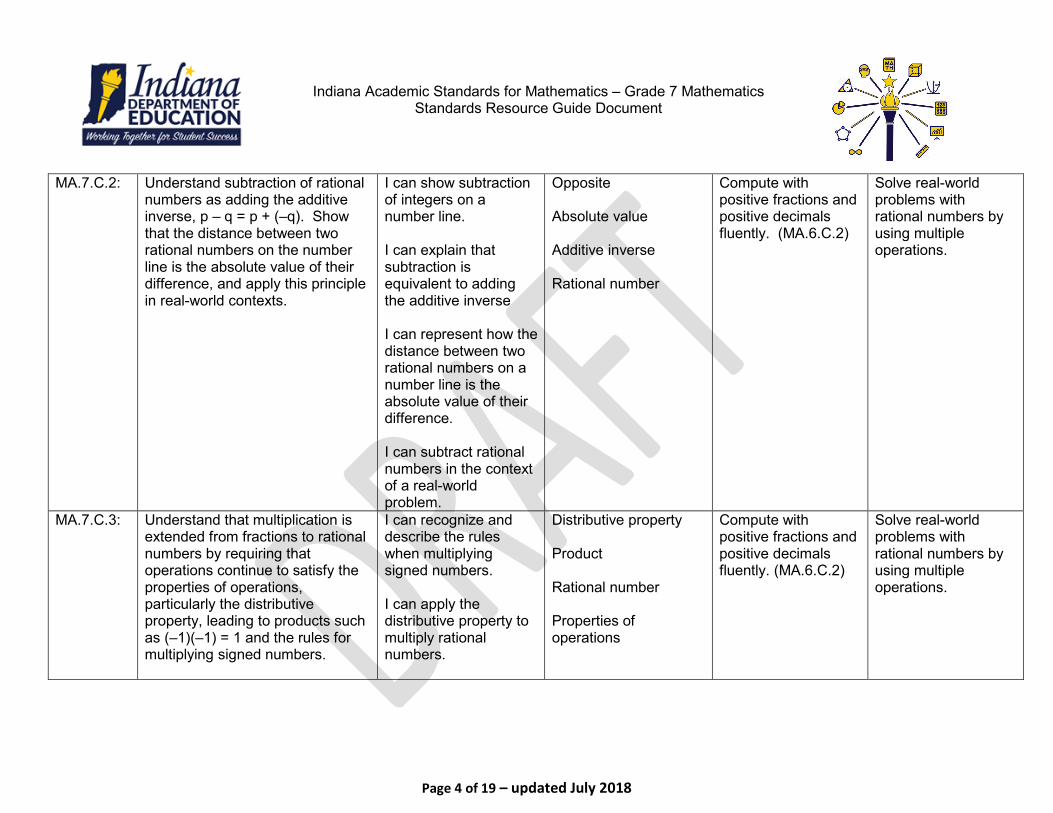
MA.7.C.2: Understand subtraction of rational numbers as adding the additive inverse, p – q = p + (–q). Show that the distance between two rational numbers on the number line is the absolute value of their difference, and apply this principle in real-world contexts.
I can show subtraction of integers on a number line. I can explain that subtraction is equivalent to adding the additive inverse I can represent how the distance between two rational numbers on a number line is the absolute value of their difference. I can subtract rational numbers in the context of a real-world problem.
Opposite Absolute value Additive inverse Rational number
Compute with positive fractions and positive decimals fluently. (MA.6.C.2)
Solve real-world problems with rational numbers by using multiple operations.
MA.7.C.3: Understand that multiplication is extended from fractions to rational numbers by requiring that operations continue to satisfy the properties of operations, particularly the distributive property, leading to products such as (–1)(–1) = 1 and the rules for multiplying signed numbers.
I can recognize and describe the rules when multiplying signed numbers. I can apply the distributive property to multiply rational numbers.
Distributive property Product Rational number Properties of operations
Compute with positive fractions and positive decimals fluently. (MA.6.C.2)
Solve real-world problems with rational numbers by using multiple operations.
Indiana Academic Standards for Mathematics – Grade 7 Mathematics Standards Resource Guide Document
Page 5 of 19 – updated July 2018
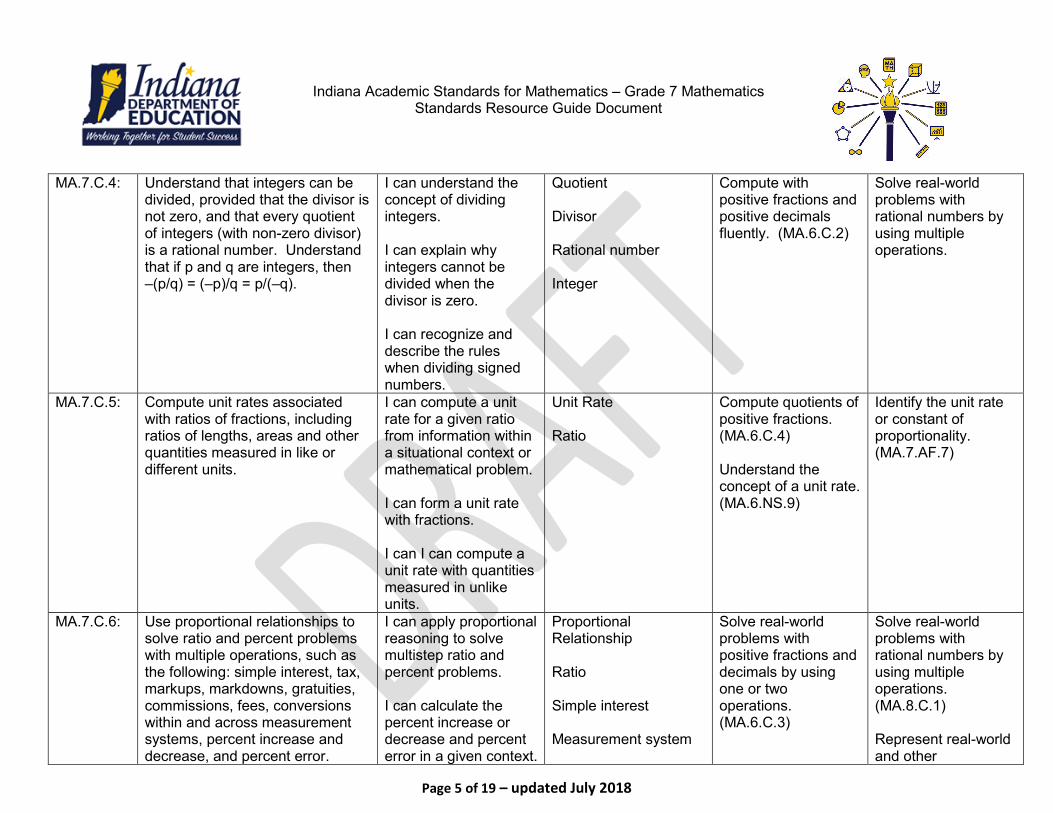
MA.7.C.4: Understand that integers can be divided, provided that the divisor is not zero, and that every quotient of integers (with non-zero divisor) is a rational number. Understand that if p and q are integers, then –(p/q) = (–p)/q = p/(–q).
I can understand the concept of dividing integers. I can explain why integers cannot be divided when the divisor is zero. I can recognize and describe the rules when dividing signed numbers.
Quotient Divisor Rational number Integer
Compute with positive fractions and positive decimals fluently. (MA.6.C.2)
Solve real-world problems with rational numbers by using multiple operations.
MA.7.C.5: Compute unit rates associated with ratios of fractions, including ratios of lengths, areas and other quantities measured in like or different units.
I can compute a unit rate for a given ratio from information within a situational context or mathematical problem. I can form a unit rate with fractions. I can I can compute a unit rate with quantities measured in unlike units.
Unit Rate Ratio
Compute quotients of positive fractions. (MA.6.C.4) Understand the concept of a unit rate. (MA.6.NS.9)
Identify the unit rate or constant of proportionality. (MA.7.AF.7)
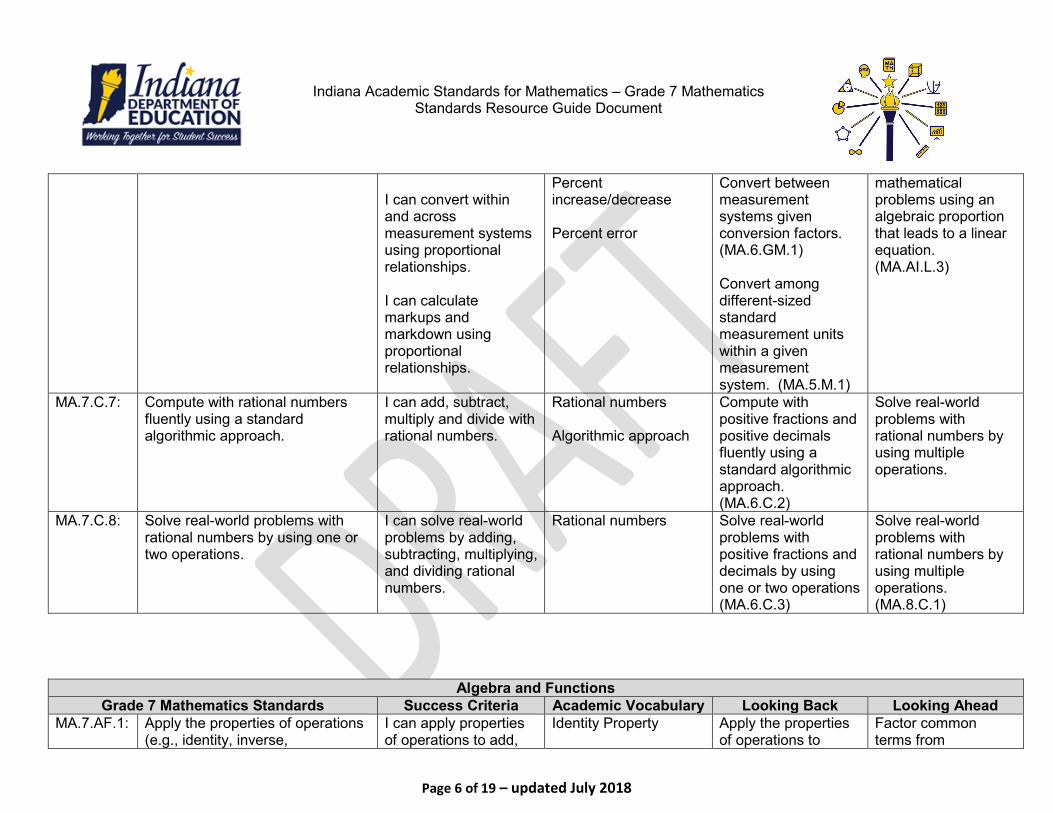
MA.7.C.6: Use proportional relationships to solve ratio and percent problems with multiple operations, such as the following: simple interest, tax, markups, markdowns, gratuities, commissions, fees, conversions within and across measurement systems, percent increase and decrease, and percent error.
I can apply proportional reasoning to solve multistep ratio and percent problems. I can calculate the percent increase or decrease and percent error in a given context.
Proportional Relationship Ratio Simple interest Measurement system
Solve real-world problems with positive fractions and decimals by using one or two operations. (MA.6.C.3)
Solve real-world problems with rational numbers by using multiple operations. (MA.8.C.1) Represent real-world and other
Indiana Academic Standards for Mathematics – Grade 7 Mathematics Standards Resource Guide Document
Page 6 of 19 – updated July 2018
I can convert within and across measurement systems using proportional relationships. I can calculate markups and markdown using proportional relationships.
Percent increase/decrease Percent error
Convert between measurement systems given conversion factors. (MA.6.GM.1) Convert among different-sized standard measurement units within a given measurement system. (MA.5.M.1)
mathematical problems using an algebraic proportion that leads to a linear equation. (MA.AI.L.3)
MA.7.C.7: Compute with rational numbers fluently using a standard algorithmic approach.
I can add, subtract, multiply and divide with rational numbers.
Rational numbers Algorithmic approach
Compute with positive fractions and positive decimals fluently using a standard algorithmic approach. (MA.6.C.2)
Solve real-world problems with rational numbers by using multiple operations.
MA.7.C.8: Solve real-world problems with rational numbers by using one or two operations.
I can solve real-world problems by adding, subtracting, multiplying, and dividing rational numbers.
Rational numbers Solve real-world problems with positive fractions and decimals by using one or two operations (MA.6.C.3)
Solve real-world problems with rational numbers by using multiple operations. (MA.8.C.1)
Algebra and Functions Grade 7 Mathematics Standards Success Criteria Academic Vocabulary Looking Back Looking Ahead
MA.7.AF.1: Apply the properties of operations (e.g., identity, inverse,
I can apply properties of operations to add,
Identity Property
Apply the properties of operations to
Factor common terms from
Indiana Academic Standards for Mathematics – Grade 7 Mathematics Standards Resource Guide Document
Page 7 of 19 – updated July 2018
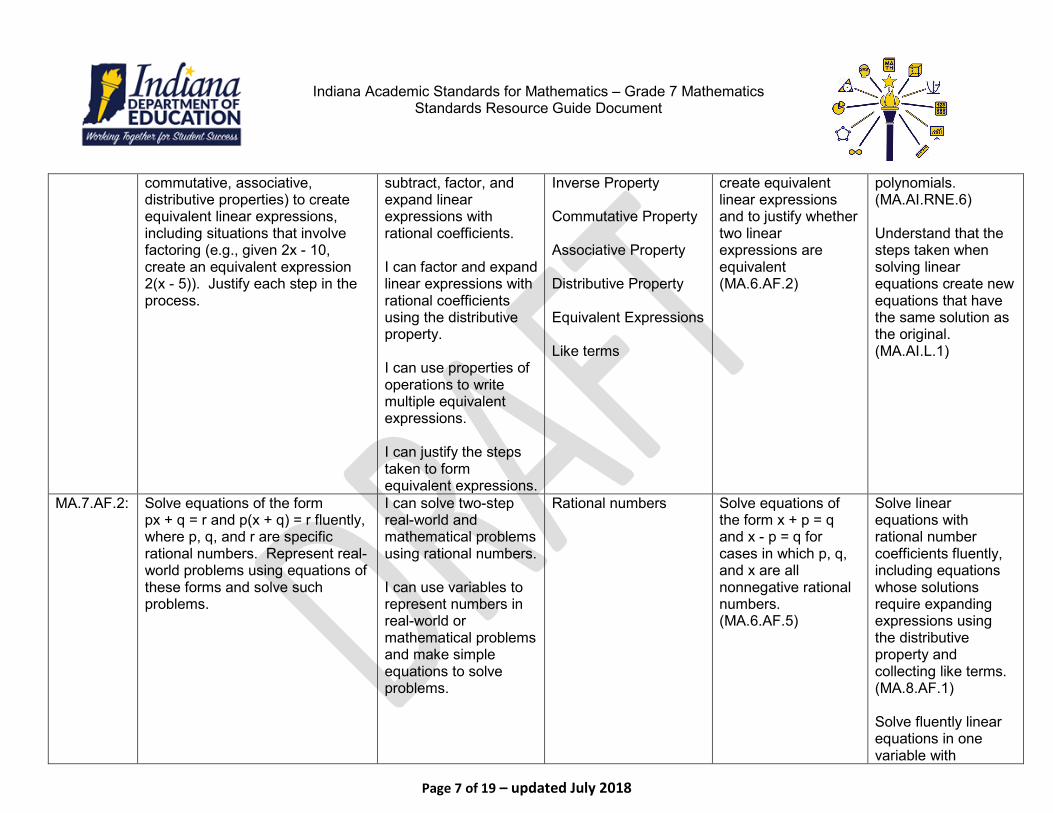
commutative, associative, distributive properties) to create equivalent linear expressions, including situations that involve factoring (e.g., given 2x - 10, create an equivalent expression 2(x - 5)). Justify each step in the process.
subtract, factor, and expand linear expressions with rational coefficients. I can factor and expand linear expressions with rational coefficients using the distributive property. I can use properties of operations to write multiple equivalent expressions. I can justify the steps taken to form equivalent expressions.
Inverse Property Commutative Property Associative Property Distributive Property Equivalent Expressions Like terms
create equivalent linear expressions and to justify whether two linear expressions are equivalent (MA.6.AF.2)
polynomials. (MA.AI.RNE.6) Understand that the steps taken when solving linear equations create new equations that have the same solution as the original. (MA.AI.L.1)
MA.7.AF.2: Solve equations of the form px + q = r and p(x + q) = r fluently, where p, q, and r are specific rational numbers. Represent real-world problems using equations of these forms and solve such problems.
I can solve two-step real-world and mathematical problems using rational numbers. I can use variables to represent numbers in real-world or mathematical problems and make simple equations to solve problems.
Rational numbers Solve equations of the form x + p = q and x - p = q for cases in which p, q, and x are all nonnegative rational numbers. (MA.6.AF.5)
Solve linear equations with rational number coefficients fluently, including equations whose solutions require expanding expressions using the distributive property and collecting like terms. (MA.8.AF.1) Solve fluently linear equations in one variable with
Indiana Academic Standards for Mathematics – Grade 7 Mathematics Standards Resource Guide Document
Page 8 of 19 – updated July 2018
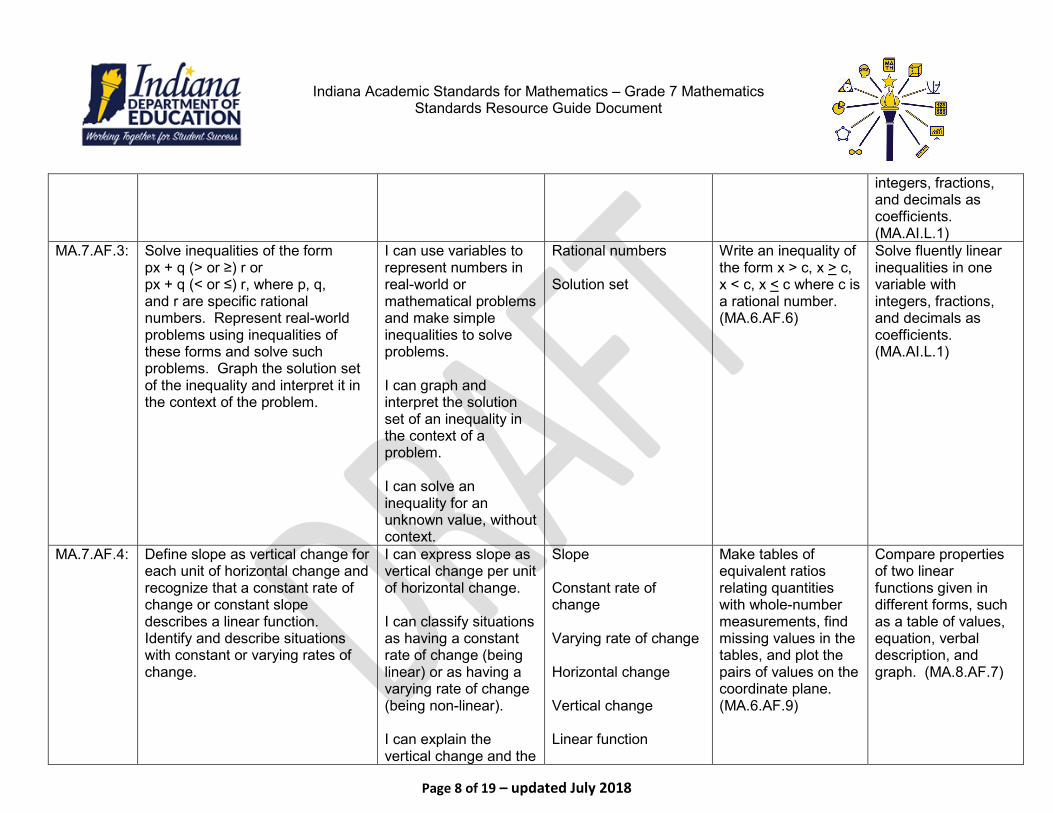
integers, fractions, and decimals as coefficients. (MA.AI.L.1)
MA.7.AF.3: Solve inequalities of the form px + q (> or ≥) r or px + q (< or ≤) r, where p, q, and r are specific rational numbers. Represent real-world problems using inequalities of these forms and solve such problems. Graph the solution set of the inequality and interpret it in the context of the problem.
I can use variables to represent numbers in real-world or mathematical problems and make simple inequalities to solve problems. I can graph and interpret the solution set of an inequality in the context of a problem. I can solve an inequality for an unknown value, without context.
Rational numbers Solution set
Write an inequality of the form x > c, x > c, x < c, x < c where c is a rational number. (MA.6.AF.6)
Solve fluently linear inequalities in one variable with integers, fractions, and decimals as coefficients. (MA.AI.L.1)
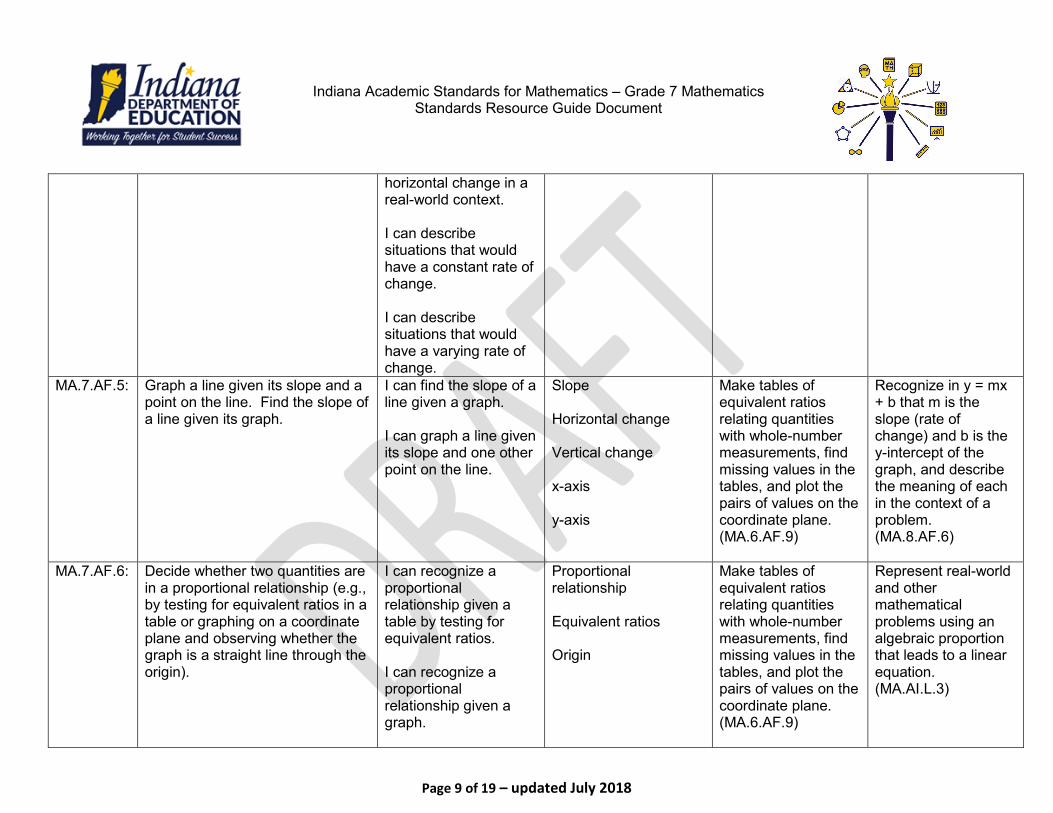
MA.7.AF.4: Define slope as vertical change for each unit of horizontal change and recognize that a constant rate of change or constant slope describes a linear function. Identify and describe situations with constant or varying rates of change.
I can express slope as vertical change per unit of horizontal change. I can classify situations as having a constant rate of change (being linear) or as having a varying rate of change (being non-linear). I can explain the vertical change and the
Slope Constant rate of change Varying rate of change Horizontal change Vertical change Linear function
Make tables of equivalent ratios relating quantities with whole-number measurements, find missing values in the tables, and plot the pairs of values on the coordinate plane. (MA.6.AF.9)
Compare properties of two linear functions given in different forms, such as a table of values, equation, verbal description, and graph. (MA.8.AF.7)
Indiana Academic Standards for Mathematics – Grade 7 Mathematics Standards Resource Guide Document
Page 9 of 19 – updated July 2018
horizontal change in a real-world context. I can describe situations that would have a constant rate of change. I can describe situations that would have a varying rate of change.
MA.7.AF.5: Graph a line given its slope and a point on the line. Find the slope of a line given its graph.
I can find the slope of a line given a graph. I can graph a line given its slope and one other point on the line.
Slope Horizontal change Vertical change x-axis y-axis
Make tables of equivalent ratios relating quantities with whole-number measurements, find missing values in the tables, and plot the pairs of values on the coordinate plane. (MA.6.AF.9)
Recognize in y = mx + b that m is the slope (rate of change) and b is the y-intercept of the graph, and describe the meaning of each in the context of a problem. (MA.8.AF.6)
MA.7.AF.6: Decide whether two quantities are in a proportional relationship (e.g., by testing for equivalent ratios in a table or graphing on a coordinate plane and observing whether the graph is a straight line through the origin).
I can recognize a proportional relationship given a table by testing for equivalent ratios. I can recognize a proportional relationship given a graph.
Proportional relationship Equivalent ratios Origin
Make tables of equivalent ratios relating quantities with whole-number measurements, find missing values in the tables, and plot the pairs of values on the coordinate plane. (MA.6.AF.9)
Represent real-world and other mathematical problems using an algebraic proportion that leads to a linear equation. (MA.AI.L.3)
Indiana Academic Standards for Mathematics – Grade 7 Mathematics Standards Resource Guide Document
Page 10 of 19 – updated July 2018
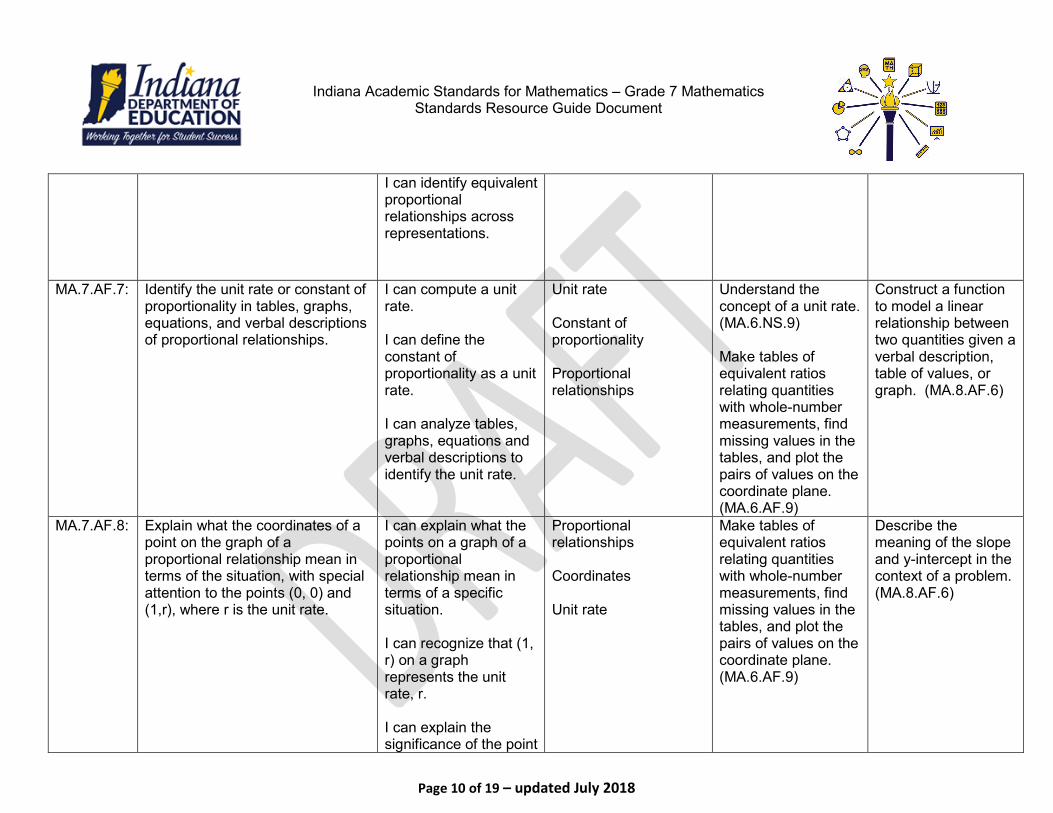
I can identify equivalent proportional relationships across representations.
MA.7.AF.7: Identify the unit rate or constant of proportionality in tables, graphs, equations, and verbal descriptions of proportional relationships.
I can compute a unit rate. I can define the constant of proportionality as a unit rate. I can analyze tables, graphs, equations and verbal descriptions to identify the unit rate.
Unit rate Constant of proportionality Proportional relationships
Understand the concept of a unit rate. (MA.6.NS.9) Make tables of equivalent ratios relating quantities with whole-number measurements, find missing values in the tables, and plot the pairs of values on the coordinate plane. (MA.6.AF.9)
Construct a function to model a linear relationship between two quantities given a verbal description, table of values, or graph. (MA.8.AF.6)
MA.7.AF.8: Explain what the coordinates of a point on the graph of a proportional relationship mean in terms of the situation, with special attention to the points (0, 0) and (1,r), where r is the unit rate.
I can explain what the points on a graph of a proportional relationship mean in terms of a specific situation. I can recognize that (1, r) on a graph represents the unit rate, r. I can explain the significance of the point
Proportional relationships Coordinates Unit rate
Make tables of equivalent ratios relating quantities with whole-number measurements, find missing values in the tables, and plot the pairs of values on the coordinate plane. (MA.6.AF.9)
Describe the meaning of the slope and y-intercept in the context of a problem. (MA.8.AF.6)
Indiana Academic Standards for Mathematics – Grade 7 Mathematics Standards Resource Guide Document
Page 11 of 19 – updated July 2018
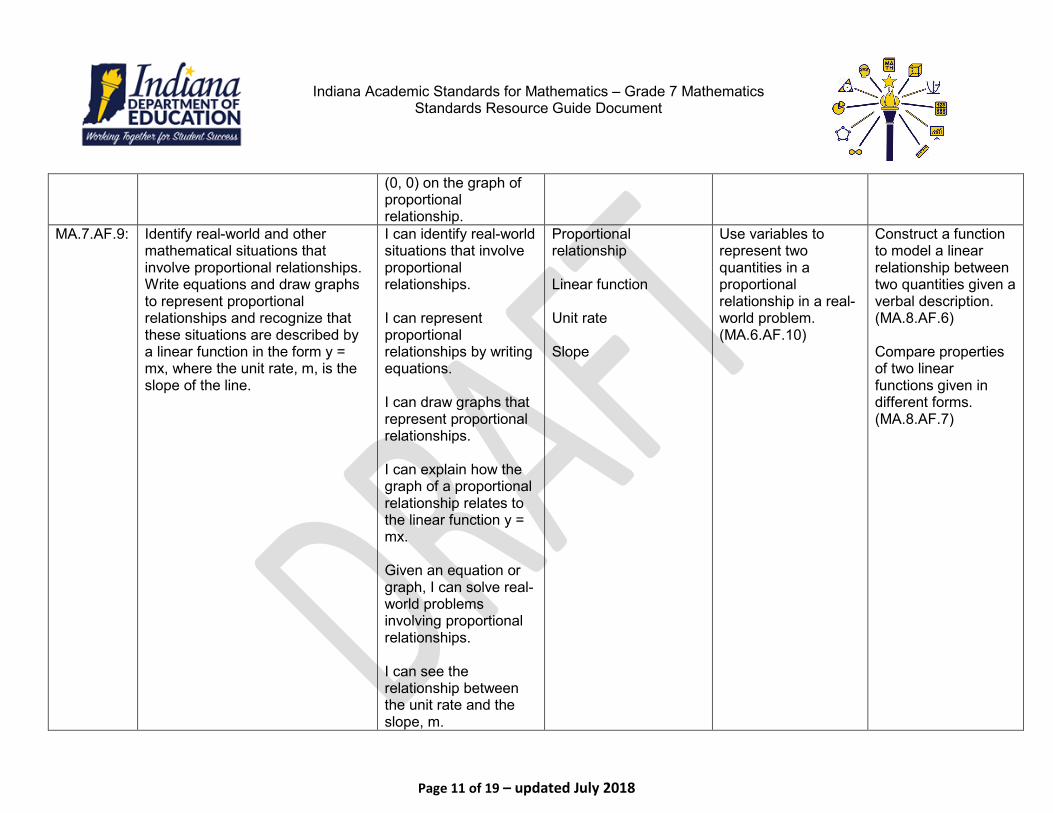
(0, 0) on the graph of proportional relationship.
MA.7.AF.9: Identify real-world and other mathematical situations that involve proportional relationships. Write equations and draw graphs to represent proportional relationships and recognize that these situations are described by a linear function in the form y = mx, where the unit rate, m, is the slope of the line.
I can identify real-world situations that involve proportional relationships. I can represent proportional relationships by writing equations. I can draw graphs that represent proportional relationships. I can explain how the graph of a proportional relationship relates to the linear function y = mx. Given an equation or graph, I can solve real-world problems involving proportional relationships. I can see the relationship between the unit rate and the slope, m.
Proportional relationship Linear function Unit rate Slope
Use variables to represent two quantities in a proportional relationship in a real-world problem. (MA.6.AF.10)
Construct a function to model a linear relationship between two quantities given a verbal description. (MA.8.AF.6) Compare properties of two linear functions given in different forms. (MA.8.AF.7)
Indiana Academic Standards for Mathematics – Grade 7 Mathematics Standards Resource Guide Document
Page 12 of 19 – updated July 2018
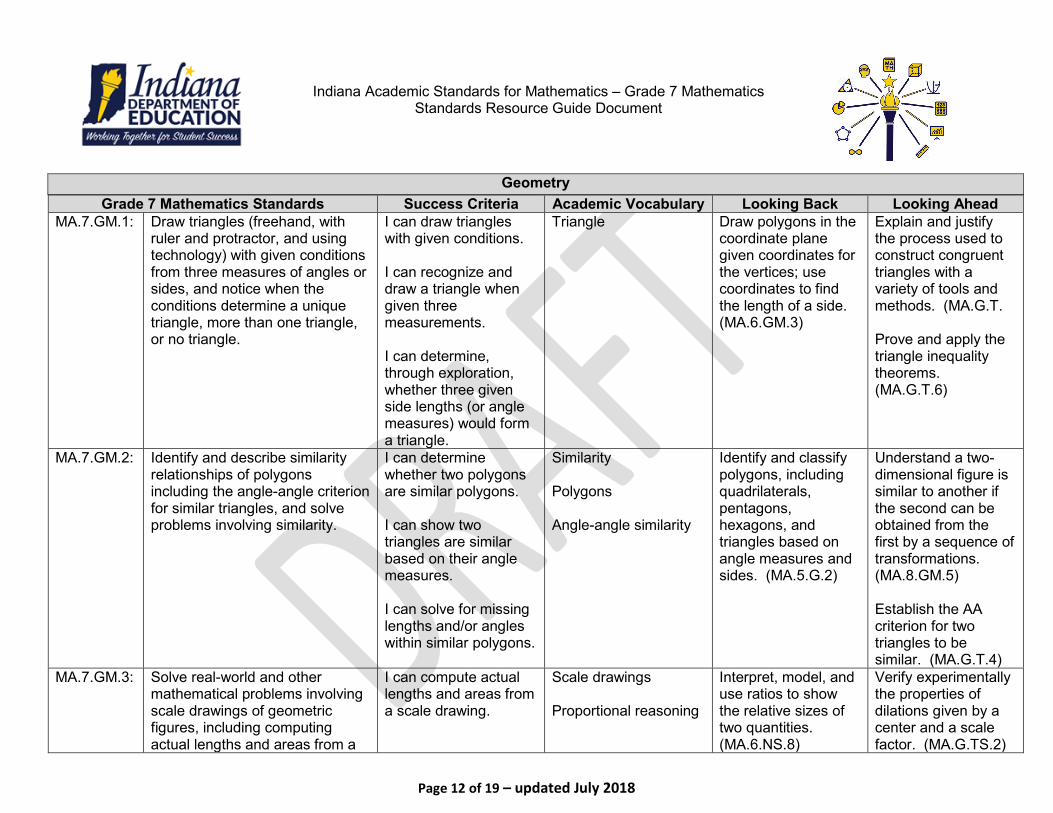
Geometry Grade 7 Mathematics Standards Success Criteria Academic Vocabulary Looking Back Looking Ahead
MA.7.GM.1: Draw triangles (freehand, with ruler and protractor, and using technology) with given conditions from three measures of angles or sides, and notice when the conditions determine a unique triangle, more than one triangle, or no triangle.
I can draw triangles with given conditions. I can recognize and draw a triangle when given three measurements. I can determine, through exploration, whether three given side lengths (or angle measures) would form a triangle.
Triangle Draw polygons in the coordinate plane given coordinates for the vertices; use coordinates to find the length of a side. (MA.6.GM.3)
Explain and justify the process used to construct congruent triangles with a variety of tools and methods. (MA.G.T. Prove and apply the triangle inequality theorems. (MA.G.T.6)
MA.7.GM.2: Identify and describe similarity relationships of polygons including the angle-angle criterion for similar triangles, and solve problems involving similarity.
I can determine whether two polygons are similar polygons. I can show two triangles are similar based on their angle measures. I can solve for missing lengths and/or angles within similar polygons.
Similarity Polygons Angle-angle similarity
Identify and classify polygons, including quadrilaterals, pentagons, hexagons, and triangles based on angle measures and sides. (MA.5.G.2)
Understand a two-dimensional figure is similar to another if the second can be obtained from the first by a sequence of transformations. (MA.8.GM.5) Establish the AA criterion for two triangles to be similar. (MA.G.T.4)
MA.7.GM.3: Solve real-world and other mathematical problems involving scale drawings of geometric figures, including computing actual lengths and areas from a
I can compute actual lengths and areas from a scale drawing.
Scale drawings Proportional reasoning
Interpret, model, and use ratios to show the relative sizes of two quantities. (MA.6.NS.8)
Verify experimentally the properties of dilations given by a center and a scale factor. (MA.G.TS.2)
Indiana Academic Standards for Mathematics – Grade 7 Mathematics Standards Resource Guide Document
Page 13 of 19 – updated July 2018
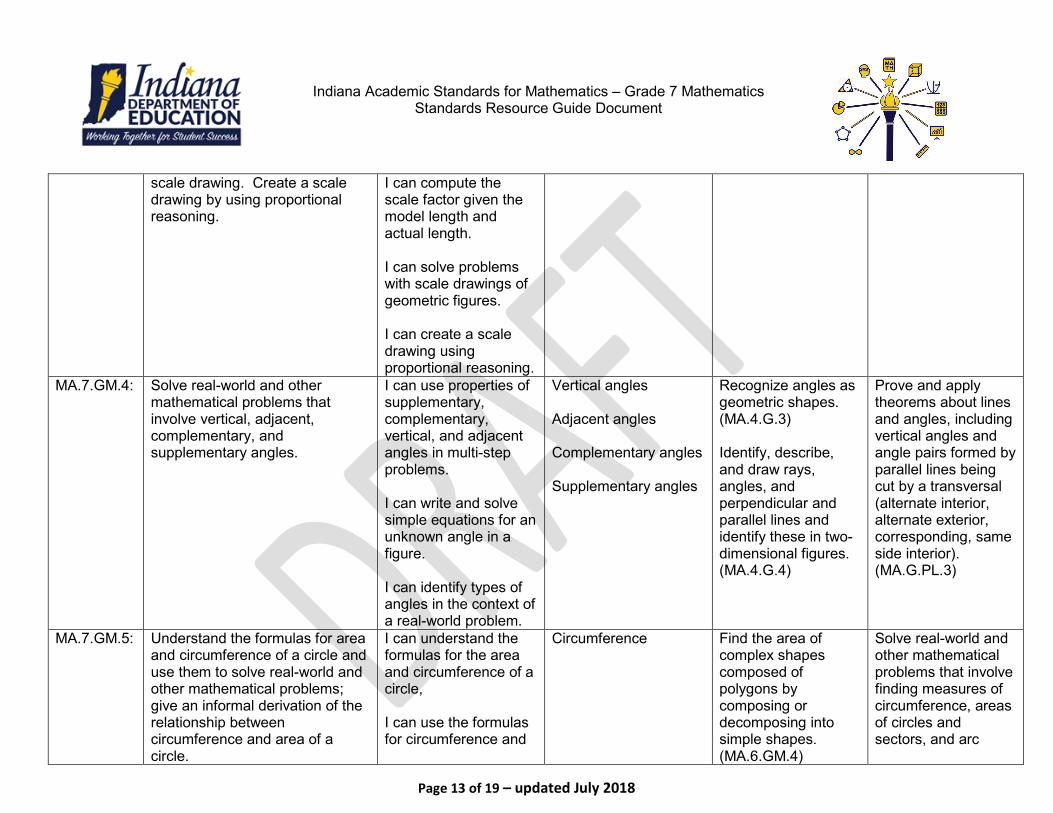
scale drawing. Create a scale drawing by using proportional reasoning.
I can compute the scale factor given the model length and actual length. I can solve problems with scale drawings of geometric figures. I can create a scale drawing using proportional reasoning.
MA.7.GM.4: Solve real-world and other mathematical problems that involve vertical, adjacent, complementary, and supplementary angles.
I can use properties of supplementary, complementary, vertical, and adjacent angles in multi-step problems. I can write and solve simple equations for an unknown angle in a figure. I can identify types of angles in the context of a real-world problem.
Vertical angles Adjacent angles Complementary angles Supplementary angles
Recognize angles as geometric shapes. (MA.4.G.3) Identify, describe, and draw rays, angles, and perpendicular and parallel lines and identify these in two-dimensional figures. (MA.4.G.4)
Prove and apply theorems about lines and angles, including vertical angles and angle pairs formed by parallel lines being cut by a transversal (alternate interior, alternate exterior, corresponding, same side interior). (MA.G.PL.3)
MA.7.GM.5: Understand the formulas for area and circumference of a circle and use them to solve real-world and other mathematical problems; give an informal derivation of the relationship between circumference and area of a circle.
I can understand the formulas for the area and circumference of a circle, I can use the formulas for circumference and
Circumference Find the area of complex shapes composed of polygons by composing or decomposing into simple shapes. (MA.6.GM.4)
Solve real-world and other mathematical problems that involve finding measures of circumference, areas of circles and sectors, and arc
Indiana Academic Standards for Mathematics – Grade 7 Mathematics Standards Resource Guide Document
Page 14 of 19 – updated July 2018
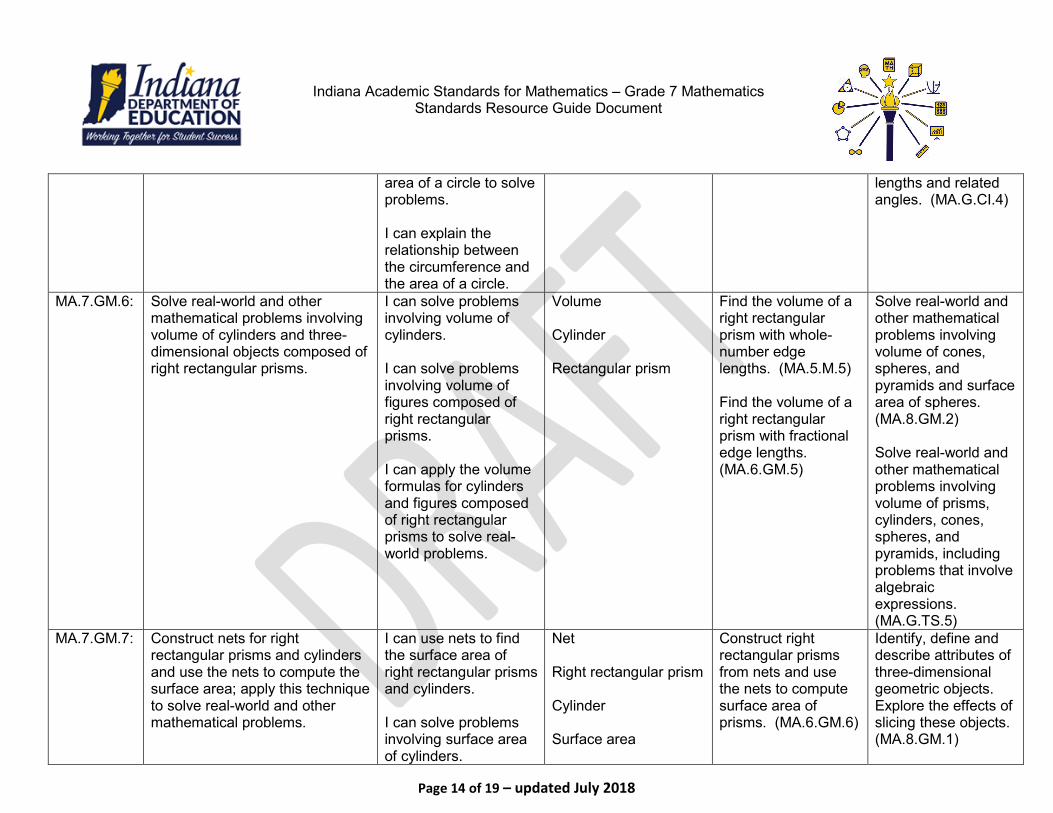
area of a circle to solve problems. I can explain the relationship between the circumference and the area of a circle.
lengths and related angles. (MA.G.CI.4)
MA.7.GM.6: Solve real-world and other mathematical problems involving volume of cylinders and three-dimensional objects composed of right rectangular prisms.
I can solve problems involving volume of cylinders. I can solve problems involving volume of figures composed of right rectangular prisms. I can apply the volume formulas for cylinders and figures composed of right rectangular prisms to solve real-world problems.
Volume Cylinder Rectangular prism
Find the volume of a right rectangular prism with whole-number edge lengths. (MA.5.M.5) Find the volume of a right rectangular prism with fractional edge lengths. (MA.6.GM.5)
Solve real-world and other mathematical problems involving volume of cones, spheres, and pyramids and surface area of spheres. (MA.8.GM.2) Solve real-world and other mathematical problems involving volume of prisms, cylinders, cones, spheres, and pyramids, including problems that involve algebraic expressions. (MA.G.TS.5)
MA.7.GM.7: Construct nets for right rectangular prisms and cylinders and use the nets to compute the surface area; apply this technique to solve real-world and other mathematical problems.
I can use nets to find the surface area of right rectangular prisms and cylinders. I can solve problems involving surface area of cylinders.
Net Right rectangular prism Cylinder Surface area
Construct right rectangular prisms from nets and use the nets to compute surface area of prisms. (MA.6.GM.6)
Identify, define and describe attributes of three-dimensional geometric objects. Explore the effects of slicing these objects. (MA.8.GM.1)
Indiana Academic Standards for Mathematics – Grade 7 Mathematics Standards Resource Guide Document
Page 15 of 19 – updated July 2018
I can solve problems involving surface area of right rectangular prisms.
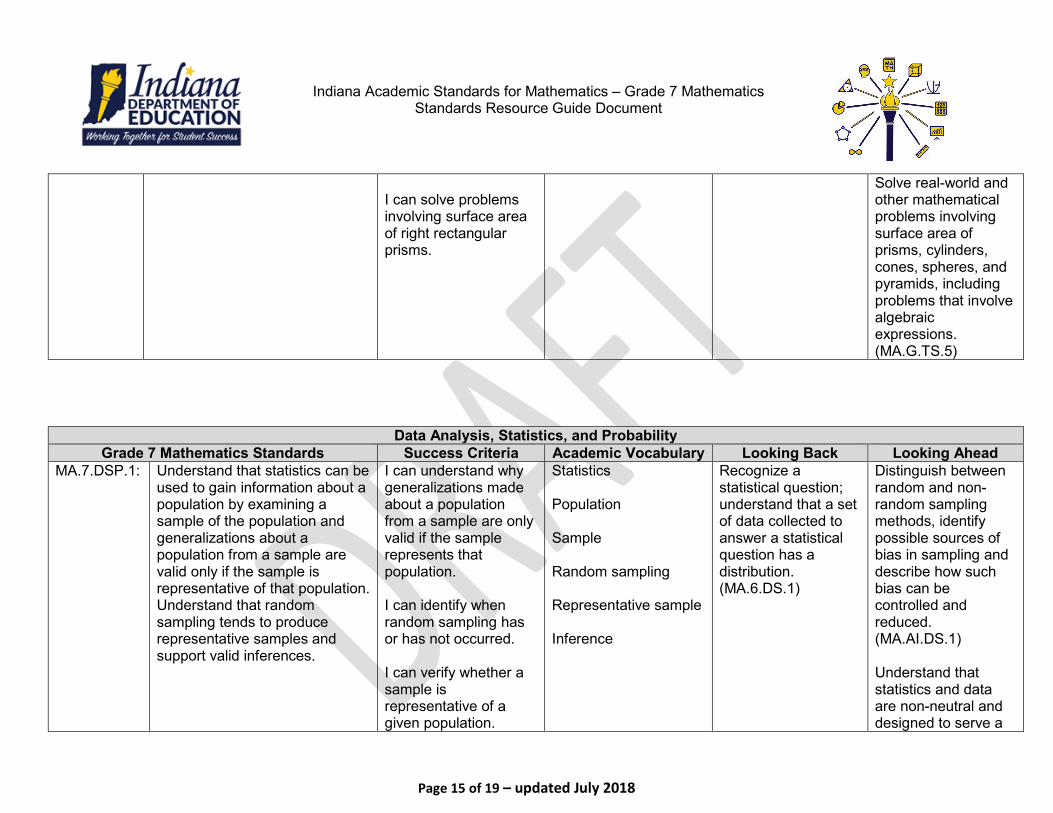
Solve real-world and other mathematical problems involving surface area of prisms, cylinders, cones, spheres, and pyramids, including problems that involve algebraic expressions. (MA.G.TS.5)
Data Analysis, Statistics, and Probability Grade 7 Mathematics Standards Success Criteria Academic Vocabulary Looking Back Looking Ahead
MA.7.DSP.1: Understand that statistics can be used to gain information about a population by examining a sample of the population and generalizations about a population from a sample are valid only if the sample is representative of that population. Understand that random sampling tends to produce representative samples and support valid inferences.
I can understand why generalizations made about a population from a sample are only valid if the sample represents that population. I can identify when random sampling has or has not occurred. I can verify whether a sample is representative of a given population.
Statistics Population Sample Random sampling Representative sample Inference
Recognize a statistical question; understand that a set of data collected to answer a statistical question has a distribution. (MA.6.DS.1)
Distinguish between random and non-random sampling methods, identify possible sources of bias in sampling and describe how such bias can be controlled and reduced. (MA.AI.DS.1) Understand that statistics and data are non-neutral and designed to serve a
Indiana Academic Standards for Mathematics – Grade 7 Mathematics Standards Resource Guide Document
Page 16 of 19 – updated July 2018
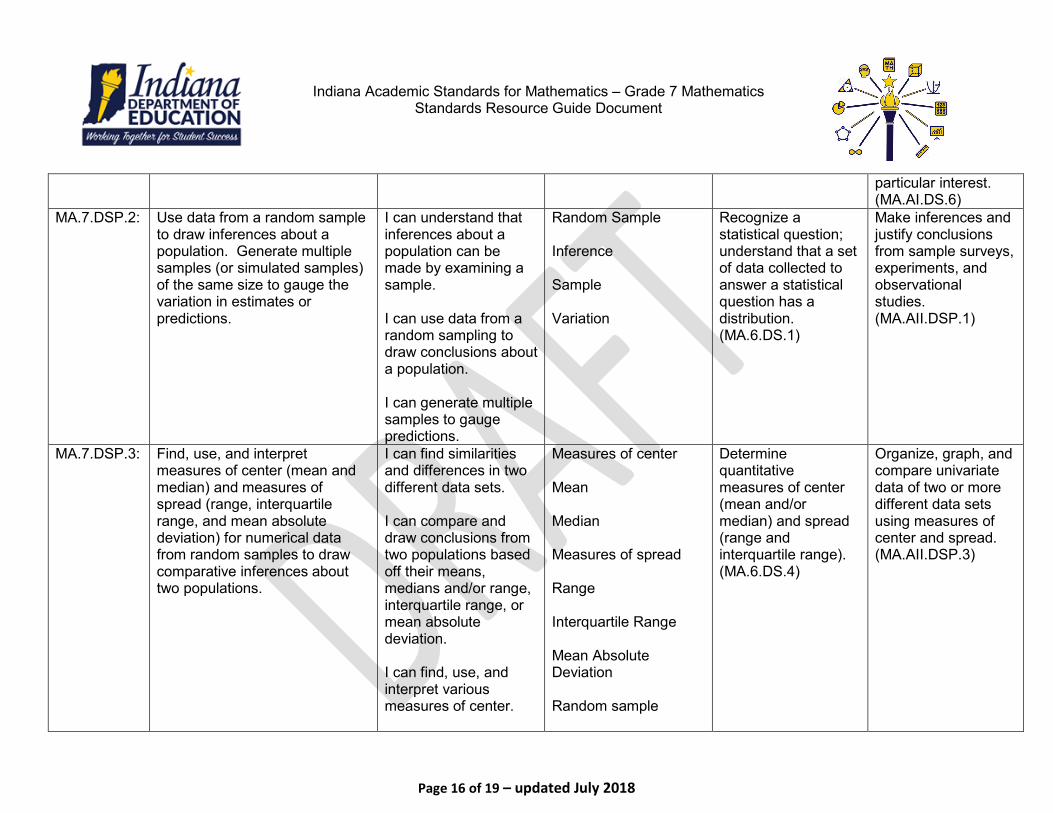
particular interest. (MA.AI.DS.6)
MA.7.DSP.2: Use data from a random sample to draw inferences about a population. Generate multiple samples (or simulated samples) of the same size to gauge the variation in estimates or predictions.
I can understand that inferences about a population can be made by examining a sample. I can use data from a random sampling to draw conclusions about a population. I can generate multiple samples to gauge predictions.
Random Sample Inference Sample Variation
Recognize a statistical question; understand that a set of data collected to answer a statistical question has a distribution. (MA.6.DS.1)
Make inferences and justify conclusions from sample surveys, experiments, and observational studies. (MA.AII.DSP.1)
MA.7.DSP.3: Find, use, and interpret measures of center (mean and median) and measures of spread (range, interquartile range, and mean absolute deviation) for numerical data from random samples to draw comparative inferences about two populations.
I can find similarities and differences in two different data sets. I can compare and draw conclusions from two populations based off their means, medians and/or range, interquartile range, or mean absolute deviation. I can find, use, and interpret various measures of center.
Measures of center Mean Median Measures of spread Range Interquartile Range Mean Absolute Deviation Random sample
Determine quantitative measures of center (mean and/or median) and spread (range and interquartile range). (MA.6.DS.4)
Organize, graph, and compare univariate data of two or more different data sets using measures of center and spread. (MA.AII.DSP.3)
Indiana Academic Standards for Mathematics – Grade 7 Mathematics Standards Resource Guide Document
Page 17 of 19 – updated July 2018
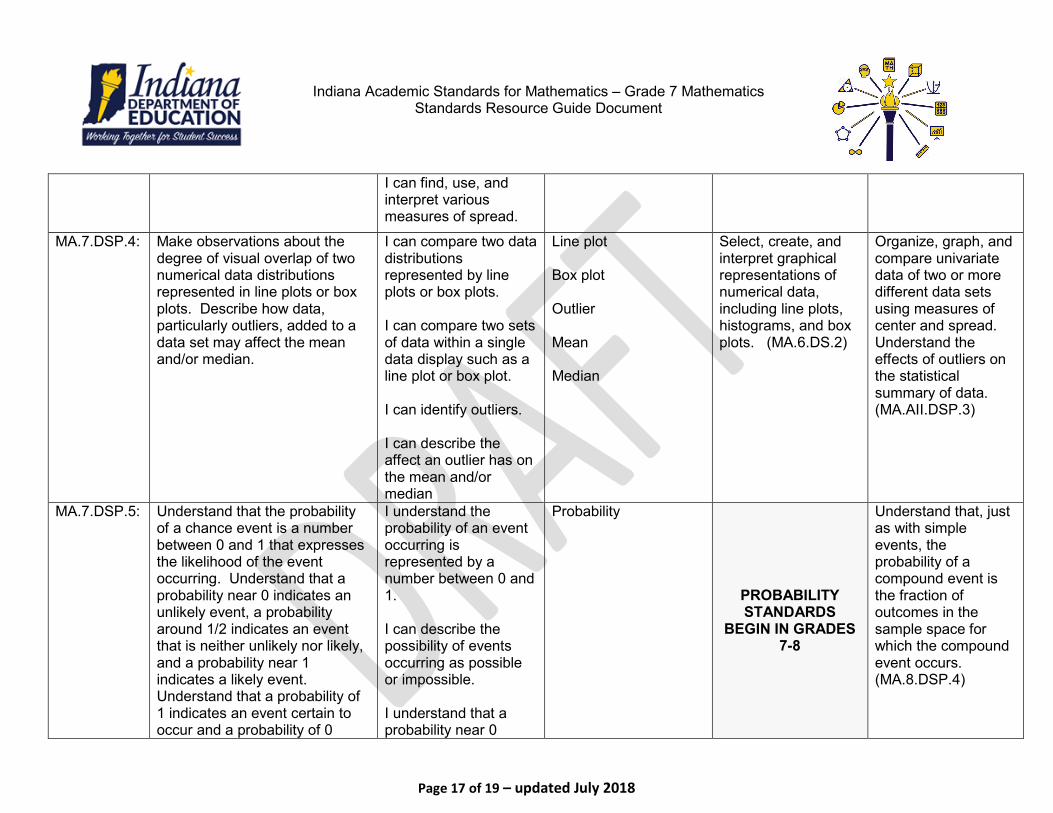
I can find, use, and interpret various measures of spread.
MA.7.DSP.4: Make observations about the degree of visual overlap of two numerical data distributions represented in line plots or box plots. Describe how data, particularly outliers, added to a data set may affect the mean and/or median.
I can compare two data distributions represented by line plots or box plots. I can compare two sets of data within a single data display such as a line plot or box plot. I can identify outliers. I can describe the affect an outlier has on the mean and/or median
Line plot Box plot Outlier Mean Median
Select, create, and interpret graphical representations of numerical data, including line plots, histograms, and box plots. (MA.6.DS.2)
Organize, graph, and compare univariate data of two or more different data sets using measures of center and spread. Understand the effects of outliers on the statistical summary of data. (MA.AII.DSP.3)
MA.7.DSP.5: Understand that the probability of a chance event is a number between 0 and 1 that expresses the likelihood of the event occurring. Understand that a probability near 0 indicates an unlikely event, a probability around 1/2 indicates an event that is neither unlikely nor likely, and a probability near 1 indicates a likely event. Understand that a probability of 1 indicates an event certain to occur and a probability of 0
I understand the probability of an event occurring is represented by a number between 0 and 1. I can describe the possibility of events occurring as possible or impossible. I understand that a probability near 0
Probability
PROBABILITY STANDARDS
BEGIN IN GRADES 7-8
Understand that, just as with simple events, the probability of a compound event is the fraction of outcomes in the sample space for which the compound event occurs. (MA.8.DSP.4)
Indiana Academic Standards for Mathematics – Grade 7 Mathematics Standards Resource Guide Document
Page 18 of 19 – updated July 2018
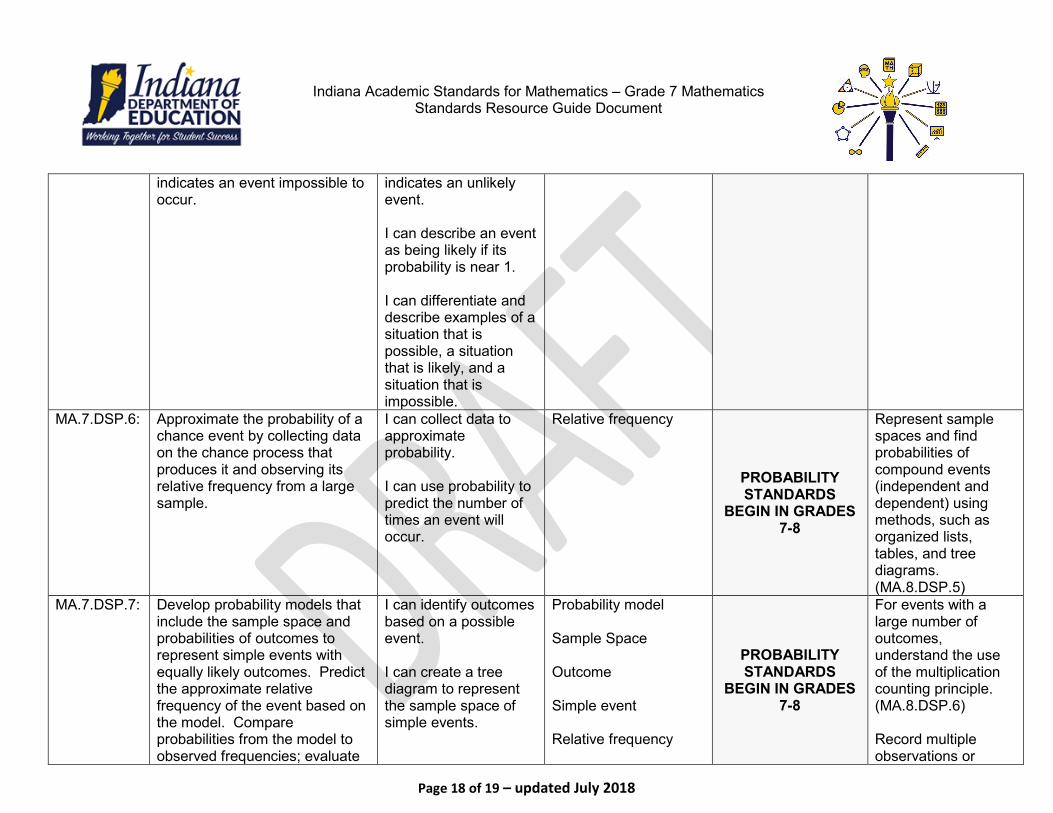
indicates an event impossible to occur.
indicates an unlikely event. I can describe an event as being likely if its probability is near 1. I can differentiate and describe examples of a situation that is possible, a situation that is likely, and a situation that is impossible.
MA.7.DSP.6: Approximate the probability of a chance event by collecting data on the chance process that produces it and observing its relative frequency from a large sample.
I can collect data to approximate probability. I can use probability to predict the number of times an event will occur.
Relative frequency
PROBABILITY STANDARDS
BEGIN IN GRADES 7-8
Represent sample spaces and find probabilities of compound events (independent and dependent) using methods, such as organized lists, tables, and tree diagrams. (MA.8.DSP.5)
MA.7.DSP.7: Develop probability models that include the sample space and probabilities of outcomes to represent simple events with equally likely outcomes. Predict the approximate relative frequency of the event based on the model. Compare probabilities from the model to observed frequencies; evaluate
I can identify outcomes based on a possible event. I can create a tree diagram to represent the sample space of simple events.
Probability model Sample Space Outcome Simple event Relative frequency
PROBABILITY STANDARDS
BEGIN IN GRADES 7-8
For events with a large number of outcomes, understand the use of the multiplication counting principle. (MA.8.DSP.6) Record multiple observations or
Indiana Academic Standards for Mathematics – Grade 7 Mathematics Standards Resource Guide Document
Page 19 of 19 – updated July 2018
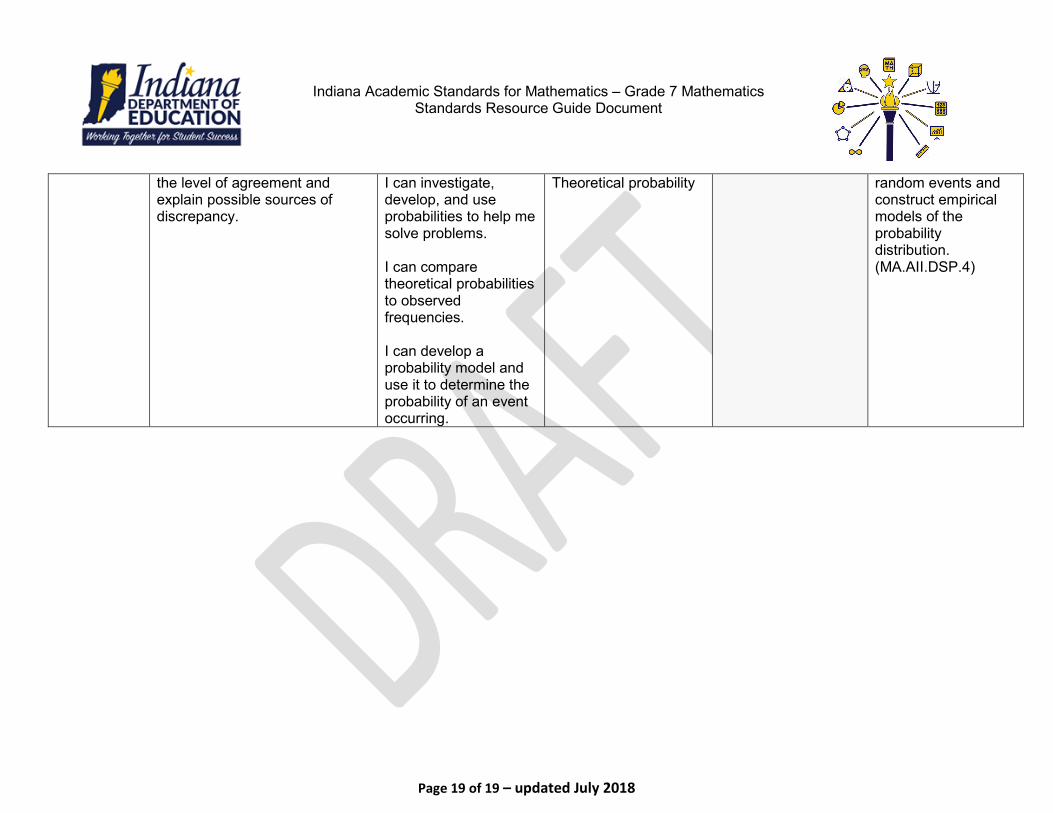
the level of agreement and explain possible sources of discrepancy.
I can investigate, develop, and use probabilities to help me solve problems. I can compare theoretical probabilities to observed frequencies. I can develop a probability model and use it to determine the probability of an event occurring.
Theoretical probability
random events and construct empirical models of the probability distribution. (MA.AII.DSP.4)