Grade 2-Math Game (review) 2nd nine weeks.ppt
42
Finish Start Fractions Estimating Addition Basic Addition Estimating Subtraction Basic Subtraction Graphs Modified by: Carol Schreiber, ITRT, Richmond City Schools [email protected]
-
Upload
shaliny-linnie -
Category
Documents
-
view
7 -
download
1
Transcript of Grade 2-Math Game (review) 2nd nine weeks.ppt

Finish
Start
Fractions
EstimatingAddition
Basic Addition
EstimatingSubtraction
BasicSubtraction
Graphs
Modified by: Carol Schreiber, ITRT, Richmond City [email protected]

Finish
Start
Fractions
EstimatingAddition
BasicAddition
EstimatingSubtraction
BasicSubtraction
Graphs

This game will take you through all the math you can handle. Click on the first box. Read through the information on the screen, and click on the
FRACTION diamond. Be careful, though. If you choose the wrong answer, you’ll be taken back to
the initial screen, and you’ll have to start over!
HAVE FUN!Click here to go back
and get started.

Look at the figure below. What fraction of the figure is shaded?
14
34
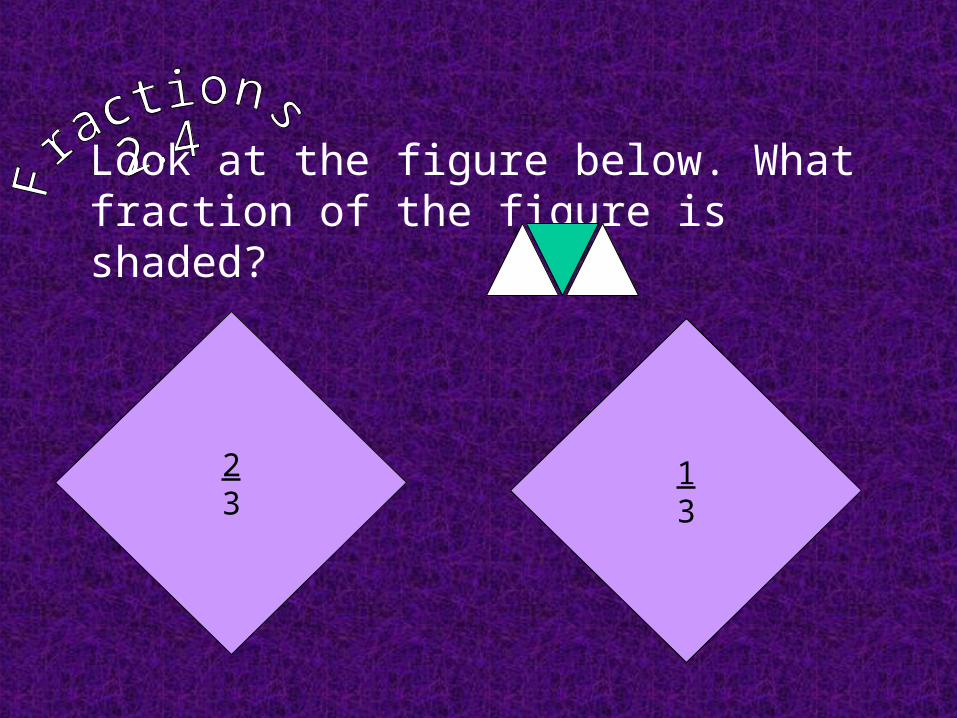
Look at the figure below. What fraction of the figure is shaded?
23
13

Look at the figure below. What fraction of the figure is shaded?
78
18

Which figure shows ¼ ?

Which figure show equal parts?

Go to EstimatingAddition

Estimate the sum.
60 50
57
34+23

Estimate the sum.
70
73
80
19+54

Estimate the sum.
70
80
60
37+29

Estimate the sum.
60
50
40
45+12

Estimate the sum.
30
20
36
23+13

Go toBasic
Addition.

56 + 15 =
71 107

78
+ 8
86 76

42 + 27 =
69 124

47 82
63 + 19 =

60
63
53
67
36
+ 27

Go toEstimation Subtraction.

67 – 23 =
47 40 30
50

89 – 21 =
20 70 60

34 – 17 =
20 10 17

54 – 32 =
30 20 10

78 – 23 =
40 60 50

91 – 63 =
40 30

Go toBasic
Subtraction.

89 – 23 =
6665A B

67- 19
52A
62B
48C

56 – 18 =
42A
74B
38C
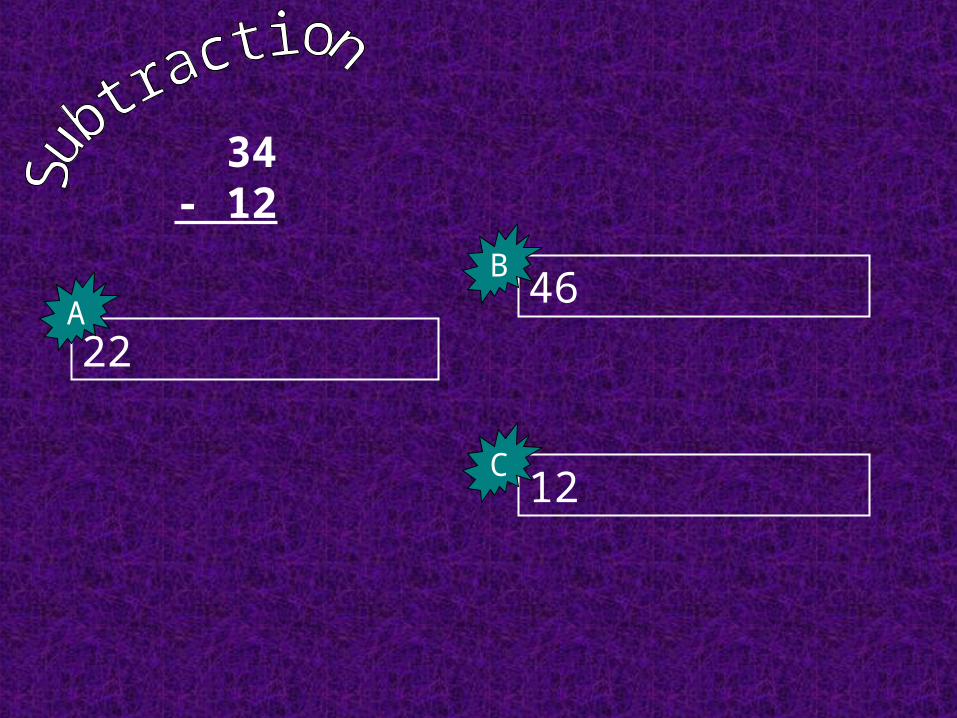
34 - 12
22A
46B
12C

89 – 23 =
66A
34B
56C

21 – 9 =
2
30
18
8
28
12
A
F
E
D
C
B

Go to After theGraphs.

Whose class at the most apples if each apple represents 5?
Jones Tonk Smith
Smith
Jones
Rally
Tonk= 5

How many more apples did Smith’s class eat than Jones’ class if each apple represents 5?
10 51
Smith
Jones
Rally
Tonk= 5

How many apples did Tonk and Smith eat all together if each apple represents 2?
5 10 25
Smith
Jones
Rally
Tonk= 2

12 24 60
Each can in the graph represents 2. How many cans did all of the 4th grade recycle?
Cans Recycled
= 2
Teacher 1
Teacher 2
Teacher 3

How many cans did teacher 1 and teacher 3 recycle in all?
12 30 6
Teacher 1
Teacher 2
Teacher 3
Cans Recycled
= 5

Finish

Now you are ready for …
If you use what you have learned here, you should have a better chance of ...