Gradation of the Severity of Sepsis - Aalborg...
62
Aalborg Universitet Gradation of the Severity of Sepsis Learning in a Causal Probabilistic Network Ward, Logan Morgan DOI (link to publication from Publisher): 10.5278/VBN.PHD.MED.00064 Publication date: 2016 Document Version Publisher's PDF, also known as Version of record Link to publication from Aalborg University Citation for published version (APA): Ward, L. M. (2016). Gradation of the Severity of Sepsis: Learning in a Causal Probabilistic Network. Aalborg Universitetsforlag. Ph.d.-serien for Det Sundhedsvidenskabelige Fakultet, Aalborg Universitet https://doi.org/10.5278/VBN.PHD.MED.00064 General rights Copyright and moral rights for the publications made accessible in the public portal are retained by the authors and/or other copyright owners and it is a condition of accessing publications that users recognise and abide by the legal requirements associated with these rights. ? Users may download and print one copy of any publication from the public portal for the purpose of private study or research. ? You may not further distribute the material or use it for any profit-making activity or commercial gain ? You may freely distribute the URL identifying the publication in the public portal ? Take down policy If you believe that this document breaches copyright please contact us at [email protected] providing details, and we will remove access to the work immediately and investigate your claim. Downloaded from vbn.aau.dk on: June 13, 2019
Transcript of Gradation of the Severity of Sepsis - Aalborg...

Aalborg Universitet
Gradation of the Severity of Sepsis
Learning in a Causal Probabilistic Network
Ward, Logan Morgan
DOI (link to publication from Publisher):10.5278/VBN.PHD.MED.00064
Publication date:2016
Document VersionPublisher's PDF, also known as Version of record
Link to publication from Aalborg University
Citation for published version (APA):Ward, L. M. (2016). Gradation of the Severity of Sepsis: Learning in a Causal Probabilistic Network. AalborgUniversitetsforlag. Ph.d.-serien for Det Sundhedsvidenskabelige Fakultet, Aalborg Universitethttps://doi.org/10.5278/VBN.PHD.MED.00064
General rightsCopyright and moral rights for the publications made accessible in the public portal are retained by the authors and/or other copyright ownersand it is a condition of accessing publications that users recognise and abide by the legal requirements associated with these rights.
? Users may download and print one copy of any publication from the public portal for the purpose of private study or research. ? You may not further distribute the material or use it for any profit-making activity or commercial gain ? You may freely distribute the URL identifying the publication in the public portal ?
Take down policyIf you believe that this document breaches copyright please contact us at [email protected] providing details, and we will remove access tothe work immediately and investigate your claim.
Downloaded from vbn.aau.dk on: June 13, 2019


GRADATION OF THE SEVERITY OF SEPSIS
LEARNING IN A CAUSAL PROBABILISTIC NETWORK
BYLOGAN WARD
DISSERTATION SUBMITTED 2016


GRADATION OF THE SEVERITY OF
SEPSIS
LEARNING IN A CAUSAL PROBABILISTIC NETWORK
by
Logan Ward
Dissertation submitted 2016

Thesis submitted: June 28, 2016
PhD supervisor: Professor Steen Andreassen,
Aalborg University
PhD committee: Professor Yuval Shahar, Ben-Gurion University of the Negev
Associate Professor Vittorio Sambri,
University of Bologna
Professor Johannes Struijk, Aalborg
University
PhD Series: Faculty of Medicine, Aalborg University
ISSN (online) – 2246-1302ISBN (online) - 978-87-7112-767-6
Published by:
Aalborg University Press
Skjernvej 4A, 2nd floor
DK – 9220 Aalborg Ø
Phone: +45 99407140
forlag.aau.dk
© Copyright: Logan Morgan Ward
Printed in Denmark by Rosendahls, 2016

I
CV
Personal Information
Logan Morgan Ward
Born December 20, 1988, Lower Hutt, New Zealand.
Academic Profile and Research Experience
Logan received his BE (1st Class Honours) in Mechanical Engineering from
University of Canterbury, New Zealand in 2010. Following a brief tenure as a
research engineer at Industrial Research Limited (a New Zealand Crown Research
Institute), he moved to Denmark to pursue his M.Sc. in Biomedical Engineering and
Informatics, with the degree awarded by Aalborg University in 2012. He began his
PhD studies at Aalborg University’s Department of Health Science and Technology
in September 2012. During the PhD study, Logan had contributions accepted at five
international conferences, with the results of his research producing four papers (two
published, one invited and under review, one submitted) and a patent application.


III
ENGLISH SUMMARY
Sepsis is a severe response to infection, characterised by systemic inflammation
leading to tissue damage and organ dysfunction. In septic patients, early, appropriate
antibiotic treatment is vital, more so in patients with severe sepsis.
The aim of this PhD project was to further develop an existing causal probabilistic
network (CPN) model of sepsis through learning: both manually through evidence-
based adjustments to the model and automatically through machine learning from
patient databases. The model forms part of a larger CPN used by the decision support
system Treat, which provides advice for optimal antibiotic treatment.
The results of the project were described in four papers. Paper I described the manual
learning process where continuous distributions were introduced for infection
variables. Paper I showed that manual learning is an effective, albeit limited, method
of constructing a CPN. On a small validation dataset, the manually learned CPN
presented a non-significant improvement in prediction of patients with bacteraemia
compared to the previous model. Papers II and III described the automatic learning
process wherein the model was tuned to function as a standalone predictor of 30-day
mortality. The tuned model was significantly better than both the previous model and
other scoring systems described in the literature. Paper IV presented an application
of the standalone model tuned to predict bacteraemia. It showed that risk-based
stratification of patients suspected of sepsis could be used to improve the cost-
effectiveness of rapid diagnostics, e.g. polymerase chain reaction, which would
otherwise be too expensive to use for all patients.
The resulting models for the prediction of bacteraemia and 30-day mortality can be
used as standalone systems or reintegrated with the Treat decision support system.
As a standalone model, the output can be considered as an intelligent biomarker for
sepsis, tuned from real patient data. Future work involves the development of a more
complete picture of the inflammatory response, including the time-course, which
could enable earlier detection of infection or treatment revision in patients for whom
infections are not microbiologically documented.


V
DANSK RESUME
Sepsis er kroppens respons til alvorlig infektion, kendetegnet ved systemiske
inflammation som fører til vævsbeskadigelse og organ dysfunktion. I septiske
patienter er tidlig, dækkende antibiotika behandling afgørende, desto mere i patienter
med svær sepsis.
Formålet af dette PhD projekt var at videreudvikle en existerende kausalt
probabilistisk netværk (engelsk: Causal Probabilistic Network, eller CPN) model for
sepsis igennem læring: både manual læring igennem evidens-baserede justeringer af
modellen og automatisk læring igennem maskin-læring fra patientdatabaser.
Modellen er en del af et større CPN inkluderet i beslutningsstøttesystemet Treat, som
giver råd om optimal antibiotika behandling.
Projektets resultater blev beskrevet i fire artikler. Artikel I beskrev den manuelle
læringsproces, hvor kontinuerte fordelinger blev introduceret for infektionsvariabler.
For et mindre valideringsdatasæt, viste CPN’et baseret på manuel læring ikke
signifikant forbedring i forudsigelse af patienter med bakteræmi sammenlignet med
den tidligere model. Artikel II og III beskrev den automatiske læringsproces, hvori
modellen blev tunet til at fungere som en enestående prædiktor af 30-dages mortalitet.
Den tunede model var signifikant bedre end både den forrige model og andre
scoringsystemer beskrevet i literaturen. Artikel IV viste en anvendelse af den
selvstændige model tunet til at forudsige bakteræmi. Den viste at risiko-baseret
stratificering af patienter mistænkt for sepsis kunne bruges til at øge cost-
effectiveness af hurtig diagnostiske metoder, f.eks polymerase chain reaction, som
ville ellers være for dyr til at bruge på alle patienter.
De resulterende modeller for forudsigelse af bakteræmi og 30-dages mortalitet kan
bruges som selvstændige systemer eller kan integreres med beslutningsstøttesystemet
Treat. Anvendt som selvstændigt system, kan outputtet betragtes som en intelligent
biomarkør for sepsis, tunet fra rigtige patientdata. Fremtidigt arbejde involverer
udvikling af et mere komplet billede af den inflammatorikse respons, inklusiv
tidsforløbet, som kunne give mulighed for tidligere detektion af infektion eller
revidering af behandling af patienter, hvis infektioner ikke er mikrobiologisk
dokumenteret.


VII
ACKNOWLEDGEMENTS
I have learned a lot during my time as a PhD student at Aalborg University, and the
experience has certainly helped me grow both professionally and personally. A new
language, a new culture and limitless opportunity to travel was all part and parcel.
The academic- and life-lessons learned stand me in good stead for whatever comes
next.
First, I would like to thank my PhD supervisor, Steen Andreassen, for his ongoing
support and optimism, and continuing belief that a breakthrough was just around the
corner.
I would like to thank Professors Mical Paul and Leonard Leibovici from Tel Aviv
University, Israel for their insights as co-authors, and for provision of the data which
made the PhD project possible.
Thank you to everyone at Treat Systems for their help with accessing data and the
models provided.
I would like to express my gratitude to my colleagues at AAU, in particular those at
MMDS. Thank you for all the support, good cheer and company.
Thank you to all those who “forced” me to speak Danish – through making my life
difficult you have made it so much easier.
Thank you to all my friends and family for their support and always believing in me.
Last but certainly not least I would like to thank Vladina, for keeping me on track
and focused on the end goal, and more importantly, keeping me sane.


IX
TABLE OF CONTENTS
Chapter 1. Introduction .......................................................................................... 11
Chapter 2. Background .......................................................................................... 17
2.1. CPN Modelling ............................................................................................. 17
2.2. Learning in CPNs .......................................................................................... 20
2.2.1. Manual Learning .................................................................................... 20
2.2.2. Machine Learning .................................................................................. 20
2.3. The Treat Model of Infection ........................................................................ 21
2.4. Sepsis: The Modeller’s Perspective .............................................................. 23
2.4.1. What Happens to a Patient During Sepsis .............................................. 23
2.4.2. Describing the Patient’s Condition......................................................... 26
Chapter 3. Manual Learning: Development of Continuous Distributions ......... 29
Chapter 4. Automatic Learning: Model Tuning to Improve Predictive
Performance ............................................................................................................ 33
Chapter 5. Applications of SepsisFinder ............................................................... 41
Chapter 6. Discussion ............................................................................................. 47
6.1. Main Findings ............................................................................................... 47
6.2. Future Work .................................................................................................. 49
Literature list ........................................................................................................... 51

GRADATION OF THE SEVERITY OF SEPSIS
X
LIST OF PAPERS
This thesis is based on a collection of papers, which will be referred to in the text by
their corresponding roman numerals:
Paper I: Ward, L., Mogensen, M.L., Paul, M., Leibovici, L and Andreassen,
S. (2014), A Bayesian Approach to Model-Development: Design of
Continuous Distributions for Infection Variables. 19th World Congress of the
International Federation of Automatic Control (IFAC) 24-29 August, 2014,
Cape Town, South Africa
Paper II: Ward, L., and Andreassen, S. (2015), A Bayesian Approach to
Model-Development: Automatic Learning for Tuning Predictive
Performance. 9th IFAC Symposium on Biological and Medical Systems, 31
August – 2 September, 2015, Berlin, Germany.
Paper III: Ward, L., Paul, M., Andreassen, S. Automatic Learning of
Mortality in a CPN model of the Systemic Inflammatory Response
Syndrome. (invited, under review: Mathematical Biosciences (Special
Issue))
Paper IV: Ward, L., Leibovici, L., Paul, M., and Andreassen, S. Risk-
assessment can improve cost-effectiveness of PCR testing of bacteremia
(Submitted)

11
CHAPTER 1. INTRODUCTION
Sepsis is a severe manifestation of a systemic infection and is associated with high
mortality rates: ranging from 15-60% (Angus et al. 2001, Martin et al. 2003, Vincent
et al. 2006). Early treatment with appropriate antimicrobials is vital: failure to initiate
early appropriate antimicrobial therapy increases mortality with an odds ratio of
approximately 2 (Paul et al. 2010). The decision support system Treat provides
advice on empirical antimicrobial therapy (before a pathogen is identified) and can
significantly increase the fraction of patients receiving appropriate antimicrobial
therapy (Kristensen et al. 1999, Paul et al. 2006b, Leibovici, Paul & Andreassen
2010, Kofoed et al. 2009), however there are additional clinical decisions during the
course of an infection that are not addressed by Treat. In chronological order from
the view of an infectious episode, these are: 1) early detection of the onset of
infection; 2) risk assessment to determine the diagnostic and treatment strategy; and
3) revision of therapy a few days after the initiation of therapy. This project focuses
on the risk assessment of patients suspected of infection.
Risk assessment of patients suspected of infection serves two purposes: to determine
the diagnostic strategy and to determine the aggressiveness of empirical therapy. In
each case, severity of illness is a driving factor. The current standard for sepsis
diagnosis is blood culture, which typically takes 2-4 days. In comparison, new rapid
molecular methods such as polymerase chain reaction (PCR) direct from blood are
much faster, identifying a pathogen in 6-12 hours (Liesenfeld et al. 2014,
Mwaigwisya, Assiri & O'Grady 2015). Molecular methods are however much more
expensive, and it is not currently feasible to order these tests for all patients suspected
of infection. A similar prioritisation exists when considering antimicrobial treatment:
although broad-spectrum antimicrobials may be able to eradicate most pathogens,
they have more undesirable side effects, have led to an increase in C. difficile
infections and widespread increase in resistance to antimicrobials (Vernaz et al. 2009,
Bartlett 2006, Laxminarayan et al. 2013). In each case, a mathematical risk
assessment allows for the balancing of costs and benefits.
Diagnosis and assessment of sepsis severity: SIRS
Traditionally, the relationship between infection and sepsis is understood to be as
depicted in Figure 1.1, where SIRS is the Systemic Inflammatory Response
Syndrome and bacteraemia refers to an infection in the blood-stream. SIRS is a non-
specific state of inflammation, defined at a 1992 consensus conference of the Society
of Critical Care Medicine and American College of Chest Physicians (Bone et al.
1992).

GRADATION OF THE SEVERITY OF SEPSIS
12
A patient has SIRS if they meet two or more of the following criteria:
Temperature >38°C or <36°C
White blood cell (WBC/leukocyte) count <4000 or >12000 cells/cm3
Heart rate > 90 bpm (tachycardia)
Respiratory rate > 20 breaths per minute
Sepsis is SIRS caused by an infection and non-infectious SIRS (NSIRS) refers to any
other aetiology such as trauma/surgery, burns or pancreatitis. Within SIRS and sepsis,
patients are also graded by severity, for example: severe sepsis is sepsis complicated
by organ dysfunction, and septic shock is severe sepsis with systolic blood pressure
less than 90 mmHg, refractory to fluid resuscitation.
Figure 1.1: The relationship between infection, sepsis and SIRS. Other blood-borne infections refer to all of those not caused by bacteria. Diagram adapted from (Bone et al. 1992)
The idea of SIRS is still part of the most commonly used definition of sepsis, however
it has been criticised by leading sepsis researchers – it is unspecific and overall not
very useful (Vincent 1997). In reality, almost all patients with an infection have some
degree of sepsis: they all have some degree of systemic involvement from the
immune system. Figure 1.2 proposes an alternate view where patients with an
infection instead fall into strata based the severity of their sepsis. The state of “no
sepsis” refers to those with minor infection, for example an infected cut on a finger.
The proposed states of sepsis severity are somewhat analogous to sepsis, severe
sepsis and septic shock; the new names allow some departure from the literature
definitions.
The continuous severity spectrum described in Figure 1.2 is that used in the Treat
decision support system. At its core, Treat is a stochastic model of the interaction of

CHAPTER 1. INTRODUCTION
13
Figure 1.2: An alternative view: almost all patients with an infection have some degree of sepsis and can be stratified by severity
bacteria, antimicrobials and the patient’s inflammatory response. This interaction is
modelled in a Causal Probabilistic Network (CPN). The part of the model which deals
with the inflammatory response is known as the Sepsis CPN. The Sepsis CPN is the
main contributor in evaluating the severity of illness. The Sepsis CPN’s performance
as a diagnostic or prognostic indicator can be evaluated by assessing its ability to
predict clinical outcomes such as positive blood culture (bacteraemia) and 30-day
mortality.
Several other methods for scoring sepsis or (general) illness severity are described in
the literature. The majority of clinical scores are based on logistic regression models.
These clinical scores tend to focus on information available at the bedside. Scores
used for sepsis patients include the modified rapid emergency medicine score
(mREMS) (Olsson, Terént & Lind 2004, Howell et al. 2007), the mortality in the
emergency department sepsis (MEDS) score (Shapiro et al. 2003), and the sequential
organ-failure assessment (SOFA) (Vincent et al. 1996).
Aim of the PhD study
The PhD study centres on the development of a family of models for the gradation of
the severity of sepsis. The starting point for the project is Treat’s Sepsis CPN, with
the goal of updating the Sepsis CPN and improving its performance in predicting
bacteraemia and 30-day mortality. The approach taken to solve the problem follows

GRADATION OF THE SEVERITY OF SEPSIS
14
a Bayesian philosophy: a stepwise updating of a priori understanding based on the
knowledge available. In this case domain knowledge is acquired from the literature,
opinions of clinical experts and from patient databases.
Figure 1.3 presents an overview of the PhD project in three stages. Chapter 2 presents
the background, including CPN technology and an overview of sepsis and its
manifestations, Chapters 3 and 4 present the manual and automatic learning stages of
model development, respectively, and Chapter 5 presents an application of the
learned SepsisFinder model: selection of high-risk patients for rapid diagnostic
testing. Chapter 6 then contains a discussion of key points and main findings of the
thesis, and suggestions for future work.
Figure 1.3: PhD Project Framework
The initial phase of the PhD project focused on building knowledge and
understanding of how sepsis develops and the typical markers, signs and symptoms
seen in patients. Literature concerned with the construction and performance of the
Treat CPN was also investigated. The Treat CPN serves as an example of a CPN
model that was constructed largely manually, that is, without applying machine
learning techniques. A search was also conducted into learning from data in medicine
and the machine learning methods available, notably expectation maximisation (EM)
learning. This research was important in building the domain knowledge required to
successfully construct a CPN and forms the background material presented in
Chapter 2.
The next phase of the project focused on model development, shown in the dashed
box in Figure 1.3. Stepwise improvement of the model via learning was conducted in

CHAPTER 1. INTRODUCTION
15
two stages: first by manual learning (Chapter 3) and then subsequently by automatic
learning (Chapter 4).
Chapter 3 summarises the work carried out in the manual learning stage: a set of
continuous distributions for infection variables that improve Treat’s prediction of
bacteraemia. The result of the manual learning was the Continuous (C-) Sepsis CPN.
This method of constructing CPNs was proven to be robust, and was the method used
in constructing the Treat CPN. This Chapter is based on Paper I.
Chapter 4 describes the automatic learning process and the results of tuning two
CPNs: one to predict 30-day mortality and one to predict bacteraemia in patients
suspected of sepsis. Applying machine learning gives the potential to use the
knowledge contained in patient databases, something that has not formally been done
in the Treat model. The result represents a significant improvement over the model
described in Paper I. This Chapter is based on Papers II and III which described two
Learned Sepsis CPNs, the L-Sepsis CPN (Paper II) and the LA-Sepsis CPN (Paper
III) that were tuned to predict 30-day mortality. Chapter 4 also describes the
SepsisFinder model, which was tuned to predict bacteraemia using a similar learning
strategy.
The third and final phase of the project is concerned with the application of the tuned
SepsisFinder model, and is described in Chapter 5. The SepsisFinder model is used
for risk-assessment, where the predicted probability of bacteraemia can be used to
define a group of high-risk patients for whom rapid diagnostic testing may be cost-
effective. Paper IV describes the use of SepsisFinder in assessing the cost-
effectiveness of one rapid diagnostic technique, PCR, in the emergency department.
This application was also described as part of a patent application (Application
number: PA 2015 00514) which centred on the idea that one parameter (sepsis
severity) can be used for many purposes, including but not limited to the prediction
of bacteraemia and 30-day mortality.
The main findings and scientific contribution of the thesis are discussed in Chapter
6. Suggestions for future work are also addressed, including the re-integration of the
Sepsis CPN within Treat, and the use of Sepsisfinder to describe the time-course of
infection. A full description of the time-course of infection would provide an
opportunity to address two of the remaining clinical problems not addressed by Treat:
early detection of the onset of infection and revision of therapy.


17
CHAPTER 2. BACKGROUND
This chapter provides the medical and technical background for the PhD project.
The type of mathematical model used in Sepsisfinder, a Causal Probabilistic Network
(CPN) is introduced. The basic principles of CPNs including how they are
constructed and used are explained. The medical problem-area, sepsis, is also
discussed from the modeller’s perspective, using the Treat CPN as an example. This
chapter represents the knowledge input to the modelling stage of the PhD project,
seen as the highlighted portion of Figure 2.1.
Figure 2.1 PhD project framework. This chapter describes the background (highlighted)
2.1. CPN MODELLING
CPNs, also referred to as Bayesian networks are a type of stochastic model. A CPN
can be represented graphically by a set of nodes, linked together by arrows as shown
in Figure 2.2. The arrows represent causal relationships between variables.
Numerically these arrows can be thought of as conditional probability tables. The
task of constructing a CPN consists of specifying the graphical structure and filling
out the associated conditional probability tables. Once constructed, the CPN updates
the probability distributions according to the axioms of probability theory based on
the entered evidence. CPNs are ideal for creating diagnostic models: inferences can
be made about unobservable variables based on available evidence, and when
accompanied by decision theory and utility functions they can also provide advice on
treatment selection.

GRADATION OF THE SEVERITY OF SEPSIS
18
Figure 2.2: Simple CPN model with one cause (Flu) and one effect (Fever). Two tables are shown: the top table specifies the a priori likelihood of Flu, and the bottom table is the conditional probability table for fever given flu. Adapted from (Andreassen 2000).
Figure 2.2 contains all the information required for probabilistic reasoning. For
example, it is possible to calculate the probability for Fever, P(Fever), as the sum of
the joint probabilities of Fever given Flu as in Equation 2.1:
P(Fever)=P(Fever|Flu=yes)P(Flu=yes)+P(Fever|Flu=no)P(Flu=no) (2.1)
Using Equation 2.1 we can calculate that P(Fever=yes) = 0.90*0.05 + 0.02*0.95 =
0.064 and P(Fever=no) = 0.10*0.05 + 0.98*0.95 = 0.936. Causal reasoning is simple
in this case as these probabilities are specified and can be read directly from the
conditional probability table. The ability to provide diagnostic reasoning, inferring
the likelihood of a cause based on the observation of an effect is perhaps less
apparent. Bayes’ Theorem provides the foundation for this type of reasoning; it
relates the conditional probability of event A given another event B to the conditional
probability of B given A. In this case A and B are Flu (the cause) and Fever (the
effect), as in Figure 2.2, and Bayes’ Theorem can be written as:
P(Flu|Fever)=P(Flu)P(Fever|Flu)
P(Fever) (2.2)
Equation 2.2 is vital to understanding how inference works in CPNs. In this simple
two variable case, we know the conditional probability P(Fever|Flu) and the a priori
probability of flu, P(Flu), and then observing Fever=yes, we can solve Bayes’
equation to infer the probability of Flu=yes, as in Equation 2.3. The factor
P(Fever|Flu)/P(Fever) in Equation 2.2 can be seen as the effect of the evidence: the
factor which the prior probability of Flu (P(Flu)) is multiplied by to give the posterior
probability.
P(Flu=yes|Fever=yes)=P(Flu=yes)P(Fever=yes|Flu=yes)
P(Fever=yes)=
0.05*0.90
0.064=0.703 (2.3)

CHAPTER 2. BACKGROUND
19
The example shown in Figure 2.3 is another simple CPN, this time with two causes:
flu and throat infection, and two symptoms: fever and sore throat. Fever and sore
throat can each be caused by flu and/or throat infection, as indicated by the arrows.
The conditional probability tables are filled out when constructing the CPN,
specifying the joint probabilities for sore throat and fever respectively, given flu and
throat infection: P(Fever| Flu, Throat infection) and P(Sore throat | Flu, Throat
infection) (Figure 2.3, panel A). In this case, observing Fever=no and Sore
throat=yes allows us to infer that a throat infection is much more likely than the flu
(Figure 2.3, panel B).
Figure 2.3: Construction and use of a simple CPN. During construction (panel A), the structure and probability tables are specified using a top-down approach, following the flow of causality. During use (panel B), when the effects are observed, diagnostic reasoning can be applied, using the evidence to make inferences about the likely cause. Adapted from (Andreassen 2000).
The example in Figure 2.3 is simple enough that the inferred probabilities could be
calculated by hand. However, inference quickly becomes complicated as more nodes
and dependencies are added. For more complex CPNs, software solutions become
necessary. All CPNs used in this thesis were constructed using the commercial
software package Hugin (Hugin Expert A/S, Aalborg, Denmark), which was also
used to perform inference.

GRADATION OF THE SEVERITY OF SEPSIS
20
2.2. LEARNING IN CPNS
The construction of a CPN provides a unique opportunity for the fusion of data and
knowledge. Importantly, this knowledge may come from any one (or more) of a
number of sources: in the medical domain these could be patient databases, expert
opinion and reports in the scientific literature. Before beginning construction of a
model, it is important to understand the problem area: for the infectious process this
would include the pathogenesis and pathophysiology and what can be observed in a
patients, for example blood gases, haematology, vital signs etc. The model variables
and structure are then identified based on the knowledge acquired: this can be done
manually or automatically, the latter referring to the use of machine learning
techniques. During the construction of the CPN, the conditional probabilities may
themselves be considered stochastic variables; a priori distributions may be assigned,
and the result of learning is the set of a posteriori distributions.
2.2.1. MANUAL LEARNING
In the context of this thesis, manual learning refers to the specification of CPN
structure and conditional probability tables without applying machine learning
techniques. Manual learning therefore refers to all other forms of knowledge
acquisition; review and meta-analysis of the scientific literature, uni- or multivariate
analysis of patient data, or the transformation of expert opinion into explicit
conditional probabilities. Manual learning can be an effective method for
constructing CPNs: the Treat CPN, described in section 2.3 was constructed in this
way. Manual learning was also applied in the construction of the models described
in this thesis. The specific learning strategy used in described in Chapter 3 which is
based on Paper I.
2.2.2. MACHINE LEARNING
Machine learning from patient data can be used instead of or as a supplement to the
manual learning process used to construct a CPN. Traditionally, machine learning is
used to form classification models where cases must be assigned to one of two or
more groups based on a set of parameters (measurements/observations) which may
be continuous or categorical variables or regression models (prediction). If the
classification of each case is used as an input at the learning stage, the process is
termed “supervised” learning, whereas if the classification is not used as an input,
learning is “unsupervised”.
A range of machine learning algorithms exist, each with certain advantages and
disadvantages dependent on the type of problem. For this thesis, the discussion will
be limited to Expectation Maximisation (EM) learning (Lauritzen 1995), a maximum
likelihood method. An algorithm for EM learning is available in the Hugin software.

CHAPTER 2. BACKGROUND
21
The learning process proceeds as follows. The CPN constructor specifies which
conditional probability tables should be learned: this may be any or all tables and/or
parts thereof. It is also possible to enforce zeros in conditional probability tables to
define impossibilities. Following the specification of what is to be learned, the EM
algorithm begins to iterate. The algorithm maximises the likelihood of all cases,
calculated as the product of the joint probability of the data for each case. In Hugin,
the algorithm terminates either when the specified maximum number of iterations is
reached or the tolerance for the difference in log-likelihood between two successive
iterations is reached.
If all of the nodes in a CPN are observed, and these observations are recorded in the
case data for learning, the learning process degenerates to counting and becomes
trivial. However, this is not the case for the sepsis model. The sepsis CPN contains
several latent (unobservable) variables which is an added difficulty where learning is
concerned. This is coupled with the fact that medical/clinical databases are typically
plagued by missing data; not every patient receives the same tests.
2.3. THE TREAT MODEL OF INFECTION
The Treat CPN was constructed via a semi-formal approach, using the literature,
expert opinion and patient data to specify the conditional probability tables. The
success of this technique has been demonstrated empirically through the success of
Treat (Kristensen et al. 1999, Paul et al. 2006b, Leibovici, Paul & Andreassen 2010,
Kofoed et al. 2009). The Treat CPN, shown in Figure 2.5, is very large, containing
approximately 6000 nodes. Within the CPN, eleven sites of infection are modelled,
each with local symptoms and findings and a set of relevant pathogens. One small
section of Treat describes the inflammatory response: the Sepsis CPN, highlighted in
Figure 2.5. Treat is specifically designed to account for geographical, demographical
and other hospital-specific differences in pathogen prevalence and resistance to
antimicrobials; it is calibrated to each specific hospital as part of the installation
process.
Treat’s advantage over clinicians is due to the ability of the CPN to hold knowledge
in the form of large arrays of conditional probability tables and to handle complex
probability calculus. The prescription of empirical antibiotic treatment involves a set
of decision points which the clinician must go through. First, the clinician must
decide whether the patient has an infection, and if so, where the infection is focused.
Based on the likely focus of infection, the clinician must then decide what the most
likely causative pathogen is. Given the most probable pathogen, which treatment
offers the best balance of coverage (dependent on local resistance patterns), potential
side-effects and cost? Empirical antimicrobial prescribing is not a trivial task, it
involves complex decision-making, and computerised decision support tools may be
able to improve the practice (Leibovici et al. 1999). The set of decisions made when

GRADATION OF THE SEVERITY OF SEPSIS
22
prescribing antimicrobials can be equated to the multiplication of large conditional
probability matrices, which is not a task that humans excel at.
Figure 2.5: The Treat CPN. The structure of the CPN is divided into 11 sites of infection, where the base units are pathogens. One small part of the network, the Sepsis CPN (highlighted), deals with the inflammatory response.
Treat has been described extensively in the literature, from the original concept
(Andreassen et al. 1999, Leibovici et al. 2000), through its development into a tool
suitable for research (Andreassen et al. 2005) to the results achieved through clinical
trials of the system (Paul et al. 2006b, Paul et al. 2006a, Paul et al. 2007, Leibovici
et al. 2007, Leibovici, Paul & Andreassen 2010). Treat was developed collaboratively
by researchers at Aalborg University (AAU) and Rabin Medical Centre, Israel as part

CHAPTER 2. BACKGROUND
23
of an EU funded project (EU 5th framework, Information Society Technologies,
contract no.: IST-9999-11459) The stochastic model of infection shown in Figure 2.5
is combined with decision theory to provide advice that seeks to maximize the
probability of effective treatment while minimizing both the direct cost of the
treatment as well as the ecological cost of furthering antimicrobial resistance and any
side effects that may occur.
In an observational trial run in three major European hospitals, Treat showed great
improvements versus clinician-only regimes, improving covering antibiotic
treatment from 57% to 70% (Paul et al. 2006b). Treat also showed improvements
when used in a cluster-randomized interventional trial with appropriate empirical
antibiotic treatment in 73% of cases in interventional wards compared with 64% in
control wards (Paul et al. 2006b). Long-term (6 month) survival was also higher in
interventional wards, and even higher in cases where Treat’s recommendations were
followed (Leibovici, Kariv & Paul 2013).
2.4. SEPSIS: THE MODELLER’S PERSPECTIVE
This section uses Treat’s Sepsis CPN to explain sepsis from a modelling point of
view, describing its construction. To build a causal model, it is necessary to
understand the pathogenesis and pathophysiology of sepsis, and how this can be
recognised in terms of measureable variables such as clinical chemistry, blood gases,
haematology, etc. Section 2.4.1 describes what happens to a patient during sepsis in
terms of the physiological changes typically seen in sepsis patients. The variables
used by the Sepsis CPN and their links to sepsis pathophysiology are also described.
Section 2.4.2 describes how CPN models can be used to describe a patient’s
condition, defining the conditional probability tables linking the model parameters
and patient condition. This step can also be thought of as the development of a
composite biomarker.
2.4.1. WHAT HAPPENS TO A PATIENT DURING SEPSIS
The response to an infection depends on the severity of the disease, as well as other
host-specific factors: comorbidities and immune-status modifiers
(immunosuppressant drugs etc.). The SIRS criteria are present in most patients as
they are part of the general response to infection. Increasing severity of sepsis is
generally associated with a greater degree of organ dysfunction and/or failure. Figure
2.7 describes some of physiological alterations seen in sepsis: all major organ systems
are involved. Inflammatory variables shown in the white box are common
manifestations of sepsis that are not linked to any organ damage specifically.

GRADATION OF THE SEVERITY OF SEPSIS
24
Figure 2.7: Physiological changes seen during sepsis according to the 2001 International Sepsis Definitions Conference (Levy et al. 2003). Sepsis patients may present with some or all of these.
Table 2.1: Treat infection variables and their relation to sepsis pathophysiology and sepsis severity. + designates higher values and - designates lower values of the variables.* designates significant predictor (p<0.05)
Infection Variable
(units) Change in the variable for given severity Predictive Ability (AUC)
Mild Moderate Severe Critical Bacteraemia 30-day
Mortality
Temperature (°C) -/+ ++ ++ ++ or -- 0.62* 0.48
Heart rate(beats/min) ++ ++ ++ ++ 0.59* 0.54*
Respiratory rate
(breaths/min) + ++ ++ +++ 0.52 0.63*
Leukocytes
(cells/mm3) + ++ ++ ++ or -- 0.53 0.56*
Creatinine (mg/dl) + + ++ +++ 0.61* 0.59*
Albumin (g/l) - -- --- ---- 0.63* 0.72*
CRP (mg/l) + +++ +++ ++++ 0.63* 0.45
Lactate (mmol/l) -/+ -/+ + ++ 0.67* 0.54
Mental-status -/+ - - --
Blood pressure
(mmHg) -/+ -/+ - --- 0.57* 0.57*

CHAPTER 2. BACKGROUND
25
Table 2.1 takes a detailed look at a selection of the variables noted in Figure 2.7:
those used in the Sepsis CPN, and their association with sepsis. The choice of
variables was based on availability of measurements/recorded data in available
patient databases as well as expert opinion regarding the variables involved in the
systemic response to infection. For each variable, + and – indicate that higher- or
lower values, respectively, are associated with given sepsis severities. The changes
in each variable given sepsis severity are based on those in the Treat Sepsis CPN.
The predictive ability is measured by the area under the ROC curve (AUC). An AUC
= 0.5 is indicative of no discrimination and AUC = 1 is perfect discrimination. To
compute the AUC, it was assumed that a higher value of the variable would predict
bacteraemia and 30-day mortality, with the exception of albumin and systolic blood
pressure, where the opposite was assumed. The dataset used consists of 3589 patient
cases collected during trials of Treat at Beilinson Hospital, Petah Tiqva, Israel,
between 2004 and 2011. The dataset is described further in Chapter 4.
After identifying candidate model variables, it is necessary to specify the model
structure. The simplest version of a CPN is the so-called “naive Bayes” model, where
all of the effects are directly linked to one cause, as shown in Figure 2.8. However,
“naive Bayes” requires that all of the variables are independent, which is not the case
for many of the sepsis variables. The original constructors of the Sepsis CPN got
around this problem by performing a factor analysis – a dimensional reduction
technique – to group the observable parameters beneath a set of statistically
constructed independent factors (Leibovici et al. 2000). The result was four
intermediate factors that described 80% of the variation in the data. The model
Figure 2.8 ”Naive Bayes” model of a disease
structure is shown in Figure 2.9.It was speculated that these factors may have physical
analogues – when the same method was used on a set of data including inflammatory
mediators, it was found that interleukin 6 (IL-6) had a loading of 0.91 on ‘fever
factor’ – fever factor could be renamed IL-6 and given real units, and tumour necrosis
factor alpha (TNF-α) had a loading of 0.50 on ‘shock factor’ – i.e. it is a major cause
of shock factor (Leibovici et al. 2000). The correlation with real physical parameters
provides further validation of the technique.

GRADATION OF THE SEVERITY OF SEPSIS
26
Figure 2.9: Structure of Treat’s sepsis CPN. Sepsis (red) causes changes in the set of observable parameters (green nodes) through four intermediate factors: ’Fever_factor’, ’Alb_factor’, ’Leuko_factor’ and ’Shock_factor’ (yellow nodes).
2.4.2. DESCRIBING THE PATIENT’S CONDITION
We want to express the severity of a patient’s sepsis on a scale from no sepsis to
critical sepsis. To do this, we need to make a mathematical description of how each
of the infection variables in the Sepsis CPN behave according to the severity of
sepsis. The construction of the CPN model takes therefore a top-down approach,
asking, for example: given that a patient has moderate sepsis, what is their
temperature? The temperature of the ‘patient’ is then expressed as a probability
distribution. This probability distribution may be continuous Gaussian distributions
or discrete distributions, the latter was used in the original Sepsis CPN.
Table 2.1 is constructed from a combination of literature knowledge and expert
opinion. Finding the numbers to complete the construction of the CPN can then be
seen as the conversion of Table 2.1 to a set of conditional probability tables. For
patients with no sepsis, it is assumed that they will fall within the normal range.
The construction of the sepsis CPN is completed by translating the knowledge
contained in Table 2.1 into conditional probability tables. In the original Treat sepsis
network, the factor nodes had three states: no, moderate and severe. Figure 2.10 uses
temperature as an example to show how these distributions look for each state of
sepsis. In addition to the no sepsis group, the former Treat sepsis CPN recognised
four severity groups for bacterial sepsis: mild, moderate, severe and critical. The
green bars and the numbers next to them reflect the probability of a patient having a
temperature in the specified range, given that they have the degree of sepsis
highlighted by the red bar. As expected from Table 2.1, there is little distinction
between the temperature distributions for moderate, severe and critical sepsis, but
they are all significantly different to the no sepsis group.

CHAPTER 2. BACKGROUND
27
Figure 2.10: Distribution of temperature (fever) for patients with, from left to right, no; moderate; severe; and critical sepsis. The red bars highlight the given severity of sepsis and the green bars represent the respective probability distributions across the temperature groups.
Once the specification of the conditional probability tables is complete, the CPN can
be compiled and used. An example of the CPN in use is shown in Figure 2.11. The
evidence entered into the model is given by the black text below the nodes. The
monitor windows show the inferred probabilities. It is possible to see that each of the
“factor nodes” can be activated differently; in this case “Leuko_factor” has more
severe evidence entered into its children, showing almost 50% probability of the state
“severe”, much higher than that observed for “Alb_factor” and “Fever_factor”. The
children of “Shock” are all set to no or normal, resulting in the probability of “Shock”
less than 0.001%. The combined evidence is used to infer that the patient most likely
has “moderate” sepsis.
Figure 2.11: The Treat sepsis CPN in use. Evidence entered is shown by the text beneath the nodes, and monitor windows are opened to show the inferred probabilities. Figure adapted from (Andreassen et al. 2005).


29
CHAPTER 3. MANUAL LEARNING:
DEVELOPMENT OF CONTINUOUS
DISTRIBUTIONS
This chapter is based on Paper I, entitled “A Bayesian Approach to Model
Development: Design of Continuous Distributions for Infection Variables”. This
paper described the process of updating the Treat Sepsis CPN, subsequently referred
to as the discrete sepsis or D-Sepsis CPN, to the continuous sepsis or C-Sepsis CPN.
This “manual learning” process represents the first stage of the PhD project’s model
development stage, highlighted in Figure 3.1.
Figure 3.1 Sepsis CPN development framework. Dark blue boxes represent the stages of model development for the Sepsis CPN, other boxes represent the inputs to each construction or learning phase. This chapter describes the highlighted section: the development of the C-Sepsis CPN from the D-Sepsis CPN.
The aim of constructing the C-Sepsis CPN was to improve the performance of Treat
and remove some of the undesirable behaviour associated with discrete nodes.
”Jumping” in the assessment of the patient state was one such behaviour: the
discretization of temperature meant that an increase from 38.6 °C to 38.7 °C could
result in a large jump in the assessed illness severity, while an increase from 38.5 °C
to 38.6 °C led to no change.
The distributions for each infection variable were learned manually via a semi-formal
process where the discrete variables in the D-Sepsis CPN were converted to
continuous variables and revised based mainly on expert opinions and the literature.
In the C-Sepsis CPN, each infection variable is described as a normal- or log-normal
distribution for five illness severities termed no, mild, moderate, severe and critical.
A literature search was conducted for each infection variable; some variables were
well reported in the literature as they have been researched as sepsis biomarkers while
others had little literature available. To describe the process of defining continuous

GRADATION OF THE SEVERITY OF SEPSIS
30
variables we looked at two examples, one for which much literature is available, CRP,
and one for which little is available, albumin.
For CRP, the literature search returned 1654 studies, of which 20 were relevant and
of sufficient quality to conduct a meta-analysis. The meta-analysis involved grouping
patients according to the severity of their illness, and the aetiology (infectious/non-
infectious). In all, nine classifications were used: 4 infectious; viral infection, sepsis,
severe sepsis and septic shock, and 5 non-infectious; healthy, no SIRS (patients who
may be ill but do not meet the SIRS criteria), SIRS, severe SIRS and non-septic
shock. A pooled, log-normal distribution was calculated for each of the nine
classifications, the result of which was the 9 distributions shown in Figure 3.2.
Figure 3.2 Log-normal distributions for 4 infectious (top panel) and 5 non-infectious (bottom panel) patient groups. Individual distributions are the result of meta-analysis of literature studies. Figure from Paper I (Ward et al. 2014).
The distributions described in Figure 3.2 were formed based on literature definitions
of sepsis and SIRS patients, and must therefore be mapped to the five illness
severities used in the C-Sepsis CPN. The C-Sepsis CPN distributions shown in Figure
3.3 were defined after input from experts, the details of how this was done are
described in Paper I.
A similar literature search was conducted for albumin, however none of the 244
resulting papers were suitable for defining explicit distributions for albumin stratified
by sepsis severity and/or aetiology. The impossibility of a meta-analysis meant that
sepsis/SIRS severity-based distributions for albumin must be designed in a different

CHAPTER 3. MANUAL LEARNING: DEVELOPMENT OF CONTINUOUS DISTRIBUTIONS
31
Figure 3.3 Transformation of the normal distributions from the meta-analysis (left) to the C-Sepsis distributions (right). Figure from Paper I (Ward et al. 2014).
way. The discrete distributions used in the D-Sepsis CPN were used along with data
from the Treat study (Paul et al. 2006b) to set the range to be covered by the set of
distributions. Literature was available to define a distribution for the ”no” severity;
the distribution was taken from a large study of albumin as a predictor of mortality
(Corti et al. 1994). Albumin is also a concentration-dependent predictor of poor
outcome (Vincent et al. 2003), with low albumin being correlated with high severity.
The distributions implemented in the C-Sepsis CPN are shown in Figure 3.4.
Figure 3.4 C-Sepsis distributions for Albumin. Figure from Paper I (Ward et al. 2014).

GRADATION OF THE SEVERITY OF SEPSIS
32
As a validation step, the predictive abilities of the D-Sepsis and C-Sepsis CPNs were
compared. The Treat CPN, in addition to providing treatment advice, can be used to
make a prediction of the probability of bacteraemia. The data used was collected from
263 patients suspected of infection in the acute ward at Hvidovre Hospital,
Copenhagen University Hospital, Denmark from November 2011 to May 2012. Of
the included patients, 19 (7.2%) had bacteraemia.
The predictive ability of each model (Treat with the D-Sepsis CPN, Treat with the C-
Sepsis CPN) was assessed using the area under the ROC curve (AUC): greater area
under the curve means better predictive ability. The AUC for the C-Sepsis CPN
model was 0.80 (95% Confidence interval (CI) 0.70-0.90) while the AUC for the D-
Sepsis CPN model was 0.73 (95% CI 0.62-0.85). The two curves are shown overlaid
in Figure 3.5. The difference between the two curves was not statistically significant
(p=0.3), however it suggests that the manual construction of continuous nodes in the
Treat sepsis CPN can improve the prediction of bacteraemia. This result provided
motivation for further testing using a larger database, and further development of the
model through the application of automatic learning methods to adjust the prior
probability distributions. In subsequent use of the C-Sepsis model, other issues were
noted such as extremely large odds ratios when approaching the upper- and/or lower
limits of the physiological range for some of the infection variables, notably CRP.
Figure 3.5 ROC curves for bacteraemia prediction for Treat with the D-Sepsis and C-Sepsis CPNs. Figure from Paper I (Ward et al. 2014).

33
CHAPTER 4. AUTOMATIC LEARNING:
MODEL TUNING TO IMPROVE
PREDICTIVE PERFORMANCE
Following the manual learning described in Chapter 3, the C-Sepsis CPN was
transformed into a Learned Sepsis CPN as described by the highlighted section of
the model-development framework in Figure 4.1. This chapter is based on Papers II
and III, which describe the steps taken to tune the C-Sepsis CPN to predict 30-day
mortality, with the results being the L-Sepsis CPN (Paper II) and the LA-Sepsis CPN
(Paper III). Using a similar learning strategy, the C-Sepsis CPN was also tuned to
predict bacteraemia, forming a standalone “SepsisFinder” model.
Figure 4.1 Sepsis CPN development framework. Dark blue boxes represent iterations of the Sepsis CPN, the other boxes represent the inputs to each construction or learning phase. This chapter describes the highlighted section: the development of the L-Sepsis CPN from the C-Sepsis CPN.
The C-Sepsis CPN removed the undesirable behaviours of the D-Sepsis CPN, such
as jumps in the assessment of the patient state in response to small changes in the
input variables. Validation using a small dataset (263 patients) showed a non-
significant improvement over the D-Sepsis CPN for the prediction of bacteraemia.
However, other undesirable behaviours were noticed, such as excessively large odds-
ratios in patients who presented with values of infection variables in ranges that
weren’t suitably covered by the continuous distributions. The aim of automatic
learning was to improve the predictive performance of the network.
The data material used for learning was taken from a set of patient data collected
during trials and/or studies of the Treat system (Andreassen et al. 2005, Paul et al.
2006b) at Beilinson Hospital, Rabin Medical Centre in the period from 2004-2011.
Patients were included in the studies based on suspicion of infection which included
those for whom blood was drawn for culture, those receiving antimicrobials not for

GRADATION OF THE SEVERITY OF SEPSIS
34
prophylaxis, those with SIRS and those with a clinically identified focus of infection
(Paul et al. 2006b). The data included information on infection variables such as the
patients’ vital parameters, clinical chemistry and blood gases, empirically prescribed
treatments, the results of blood and other cultures including in vitro susceptibility
testing, 30-day mortality, and a final clinical diagnosis. The diagnosis allowed
patients to be divided into infectious- and non-infectious groups: data were available
for 3589 patients, of whom 2855 had a confirmed infectious or non-infectious
diagnosis. The infectious diagnoses also allowed sub-groups to be defined for
different sites of infection, for example lower respiratory tract or urinary tract
infections. The remaining 734 patients had an unknown or uncertain final diagnosis.
The EM learning algorithm offered by Hugin was used to learn the LA-Sepsis CPN
(Section 2.2.2). The previous semi-formal “manual” learning process connected
continuous distributions to literature defined sepsis severities: sepsis, severe sepsis
and septic shock, which were then related to our own severity states: no, mild,
moderate, severe and critical. Automatic learning from data allows us to move a step
further away from the literature distributions and relate our sepsis severity states
directly to patient mortality. This represents an important step in the development of
the LA-Sepsis CPN.
Figure 4.2 The LA-Sepsis CPN structure, figure from Paper III. Nodes are represented by ovals, causal links by arrows. Causality is expressed through conditional probability tables. The nodes with double rings represent stochastic variables with continuous probability distributions. The remaining nodes have discrete probability distributions. NSIRS is the non-infectious systemic inflammatory response syndrome. Nodes not learned are shown in blue.
The structure of the LA-Sepsis CPN is shown in Figure 4.2 Three potential causes for
death are given: NSIRS, sepsis and background, where background represents all
other causes. NSIRS and sepsis are assumed to have the same mortality rates for a
given illness severity (Vincent et al. 2006, Dulhunty et al. 2008). Mortality rates are
loosely based on the pneumonia severity index (PSI) (Fine et al. 1997) in combination
with the sepsis literature, where the latter is used to define the mortality rates for

CHAPTER 4. AUTOMATIC LEARNING: MODEL TUNING TO IMPROVE PREDICTIVE PERFORMANCE
35
severe and critical sepsis. The mortality rates used are 0%, 1%, 8%, 45% and 75%
for no, mild, moderate, severe and critical, respectively.
Figure 4.3 An example of initial specified distributions (A) and learned composite distributions (B) for one of the variables in the sepsis CPN: albumin. Each of the distributions in Panel B is a linear combination of the distributions in Panel A. Figure from Paper II (Ward, Andreassen 2015).
Figure 4.3 shows the result of automatic learning for one of the infection variables:
albumin. A set of normal distributions, covering the physiological range observed in
the patient data, was generated for each variable. Panel A shows these distributions
for albumin. Through the EM learning process composite curves are learned for each
severity state by learning the tables for the “factor-mapping” nodes (yellow in Figure
4.2). The resulting curves, shown in Panel B, are linear combinations of the curves
in Panel A. As noted in Chapter 3, albumin is a concentration-dependent predictor of
outcome, which is confirmed here: the more severe states are associated with lower

GRADATION OF THE SEVERITY OF SEPSIS
36
albumin, although the differences between the mild/moderate and severe/critical
distributions are minimal.
Another feature introduced in the C-Sepsis CPN was the possibility to differentiate
between NSIRS and sepsis. During automatic learning, the links between the NSIRS
severities and the four sepsis factors are learned (Figure 4.2: yellow nodes). Each
factor can be considered a branch of the immune system, as suggested by the factors’
correlation with inflammatory mediators (Section 2.4.1). Each branch may be
activated differently according the aetiology of inflammation, i.e. infectious or non-
infectious. Panel A of Figure 4.4 shows the difference in temperature for sepsis =
moderate and NSIRS = moderate. Patients with the infectious aetiology (sepsis)
present with a higher fever than those without infection (NSIRS) for a given severity
of illness. For variables that do not differentiate between infection and no infection,
such as systolic blood pressure (Figure 4.4 Panel B), no such difference is seen.
Figure 4.4 Conditional probability distribution for temperature (panel A) and systolic blood pressure (panel B) for Sepsis and NISIRS patients with severity = moderate. Figure from Paper III.
The area under the ROC curve is used to assess the ability of each model to predict
30-day mortality. Figure 4.5 shows ROC curves for the C-Sepsis, L-Sepsis and LA-
Sepsis CPNs. The AUCs for the C-, L- and LA-Sepsis CPNs were 0.65, 0.74, and 0.79
respectively. Each improvement (C- to L-, L- to LA-) was also statistically significant
(p=10-8, p=0.0004 respectively). To guard against overfitting, cross-validation was
also carried out as part of the development of the L- and LA-Sepsis CPNs, this is
described in further detail in Papers II and III.

CHAPTER 4. AUTOMATIC LEARNING: MODEL TUNING TO IMPROVE PREDICTIVE PERFORMANCE
37
Figure 4.5 ROC curves for the prediction of 30-day mortality for the C-Sepsis, L-Sepsis and LA-Sepsis CPNs. Figure from Paper III.
In a clinical setting, patients may be graded by a clinical score such as SIRS or
mREMS (modified Rapid Emergency Medicine Score) (Olsson, Terént & Lind 2004,
Howell et al. 2007). Both SIRS and mREMS could be calculated for only 708 patients
(25% of all patients). The 30-day mortality for these patients was 9.9%. Another
score, the MEDS (Mortality in Emergency Department Sepsis) score (Shapiro et al.
2003), could not be calculated given the available patient data. Figure 4.6 shows ROC
curves for the prediction of 30-day mortality for the LA-Sepsis CPN, mREMS and
SIRS scores. The LA-Sepsis CPNs prediction of 30-day mortality outperforms the
SIRS and mREMS scores. The AUC of the LA-Sepsis CPN also compares well with
the reported performance of MEDS, where the AUC ranged from 0.75-0.88
(Carpenter et al. 2009). The low number of patients for whom the clinical scores
could be calculated underlines the advantage offered by CPNs with their ability to
handle missing data.
In addition to the discriminative ability assessed by the ROC curve, calibration is
assessed by the Hosmer-Lemeshow statistic. Figure 4.7 shows the calibration curve
for the LA-Sepsis CPN. Perfect calibration is seen on the curve as a straight y=x line,
i.e. predictions match the observations. A non-significant Hosmer-Lemeshow test
result (p>0.05) signifies that the model is well calibrated. The LA-Sepsis CPN is
therefore a well-calibrated model.

GRADATION OF THE SEVERITY OF SEPSIS
38
Figure 4.6 ROC curves for the prediction of 30-day mortality for the LA-Sepsis CPN, and the SIRS and mREMS scores.
Figure 4.7 Hosmer-Lemeshow calibration curve for the prediction of 30-day mortality using the LA-Sepsis CPN. Figure from Paper III.

CHAPTER 4. AUTOMATIC LEARNING: MODEL TUNING TO IMPROVE PREDICTIVE PERFORMANCE
39
Despite the model being well-calibrated overall, we noted some differences in
calibration when conducting a sub-group analysis. Figure 4.8 shows regression lines
for patients in the two most prevalent infection sites: lower respiratory tract (LRT)
infections and urinary tract infections (UTI). There were 697 LRT infections with
128 deaths and 486 UTIs with 41 deaths. The gradients of the regression lines in
Figure 4.8 show that for a given severity of the immune response, an LRT infection
is more likely to lead to death. This trend was visible for both the L-Sepsis and LA-
Sepsis CPNs.
Prior to the LA-Sepsis CPN, the Sepsis CPNs were limited to describing the
manifestations of sepsis and NSIRS. Risk factors are commonly included in clinical
scores such as MEDS. The inclusion of age as a risk-factor in the LA-Sepsis CPN
resulted in a significant improvement in the prediction of 30-day mortality compared
to the L-Sepsis CPN. Reintegration within Treat means including a range of other
risk factors, including but not limited to comorbidities and the site of infection. The
difference between UTI and LRT infections shown in Figure 4.8 suggest that
knowledge of the site of infection has the potential to further improve the predictive
performance.
Figure 4.8 Regression lines for the observed 30-day mortality vs. the LA-Sepsis CPN’s predicted 30-day mortality for all 2855 patients (black), 697 patients with a lower respiratory tract infection (red) and 486 patients with a urinary tract infection (green). Figure from Paper III.

GRADATION OF THE SEVERITY OF SEPSIS
40
Using a similar learning strategy, the C-Sepsis CPN was also tuned to predict
bacteraemia, with the result being the “SepsisFinder” model (unpublished). The same
2855 patient cohort was used for the validation of both the LA-Sepsis CPN and
Sepsisfinder. There were 309 patients (10.8%) with bacteraemia. Using SepsisFinder
as a standalone model (not integrated within Treat), the AUC for the prediction of
bacteraemia was 0.74 (95% CI 0.71-0.76). Figure 4.9 shows ROC curves for the 2885
patients from Beilinson Hospital, along with curves for the prediction of bacteraemia
in two cohorts of Danish patients: 263 patients including 19 (7.2%) with bacteraemia
from Hvidovre Hospital (HvH) and 199 patients including 11 (5.5%) with
bacteraemia from Sygehus Lillebælt (SLB). The AUC for SepsisFinder’s prediction
of bacteraemia was 0.74 (95% CI 0.63-0.85) for the HvH patients and 0.79 (95% CI
0.67-0.92) for the SLB patients. SepsisFinder’s stable performance across the three
cohorts suggests that it may not require calibration for local conditions; the response
to sepsis is demographically and geographically invariant.
Figure 4.9 ROC curves for the prediction of bacteraemia using the SepsisFinder model on three cohorts of patients: n=2885 patients from Beilinson Hospital, n=263 patients from Hvidovre Hospital (HvH) and n=199 patients from Sygehus Lillebælt (SLB).

41
CHAPTER 5. APPLICATIONS OF
SEPSISFINDER
This chapter is in part based on Paper IV, which describes one application of the
SepsisFinder model described in Chapter 4: identifying candidates for rapid-
diagnostic testing through risk-based stratification of patients suspected of infection.
This application represents the final stage of the PhD project, an overview of which
is shown in Figure 5.1.
Figure 5.1 PhD project framework. This chapter is associated with the highlighted section: Applications.
Chapter 3 and Chapter 4 described the construction of the C-Sepsis CPN and the L-
and LA-Sepsis CPNs and SepsisFinder, through the manual construction to automatic
learning to tune the CPN. Chapter 4 described tuning the model to predict 30-day
mortality, and the use of the same technique to tune the SepsisFinder model to predict
bacteraemia. The prediction of bacteraemia has significant commercial potential:
rapid diagnostic methods can identify the causative pathogen in sepsis patients much
faster than blood culture, however they are also much more expensive. Identifying a
group of “high-risk” patients where the probability of a positive test is higher has the
potential to increase the cost-effectiveness of these tests. In paper IV, PCR testing
was used as an example to illustrate this principle.

GRADATION OF THE SEVERITY OF SEPSIS
42
We assumed that the added value of a PCR test is defined for the incremental increase
in the number of patients receiving appropriate treatment, due to the identification of
pathogens via PCR. This value is realized as a reduction in mortality: the odds ratio
for 30-day mortality for patients receiving inappropriate empiric treatment against
those receiving appropriate treatment is approximately 1.60 (Paul et al. 2010). We
measure cost-effectiveness relative to standard clinical practice (blood culture alone),
with the costs being the total healthcare costs and the effect being the incremental
reduction in mortality. The cost-effectiveness is assessed by the incremental cost-
effectiveness ratio (ICER) in terms of euros (€) per life-year saved. The ICER is
defined in Equation 5.1. The difference in total healthcare costs, Δcost, is
approximated by the two largest contributors: PCR testing, where nPCR is the number
of tests conducted and costPCR = €300 (Lehmann et al. 2010, Alvarez et al. 2012) is
the cost per test, and the cost of hospitalisation, where nA,add is the additional number
of patients receiving appropriate treatment, ΔLOS is the difference in length of stay
(in days) for patients receiving appropriate and inappropriate treatment and costbed is
the cost of a bed-day. The incremental effectiveness is measured in terms of the
number of life-years saved, where nsurv is the incremental number of survivors and
LYsurv = 5.43 years (Lehmann et al. 2010) is the number of life-years saved per
survivor.
ICER=∆𝑐𝑜𝑠𝑡
∆LY=
𝑛𝑃𝐶𝑅𝑐𝑜𝑠𝑡𝑃𝐶𝑅−𝑛𝐴,𝑎𝑑𝑑∆𝐿𝑂𝑆𝑐𝑜𝑠𝑡𝑏𝑒𝑑
𝑛𝑠𝑢𝑟𝑣𝐿𝑌𝑠𝑢𝑟𝑣 (5.1)
The data material for the assessment was the 3589 patients described in Chapter 4.
Of these patients, 377 had true-positive bacteraemia. True-positive bacteraemia is
defined by positive blood culture of a pathogen determined to be clinically
significant. The significance of the pathogens found by blood culture was assessed
by Treat, Coagulase negative staphylococci, bacillus sp., corynebacteria sp.,
bacteroides sp. and anaerobic gram-positive rods were all considered non-significant
isolates.
The cost-effectiveness analysis used a combination of findings from the dataset along
with figures from the literature, with the two being compared where possible. In
Figure 5.2 the high-risk group was selected as those patients with model predicted
probability of bacteraemia, pBC+, greater than a given threshold PBC+ > 20%. The high-
risk group consisted of n = 700 patients and the fraction of these patients with positive
blood culture, fBC+, was 23.9%. The ICER for the high-risk group was €6,934 (95%
CI €3,669 - €12,484) per life-year and €24,056 (95% CI €15,936 – €38,959) per life-
year for the complementary low-risk group. Confidence intervals were calculated for
a 10,000 trial Monte-Carlo sensitivity analysis wherein all parameters in the cost-
effectiveness model were varied independently according to their underlying
statistical distributions.

CHAPTER 5. APPLICATIONS OF SEPSISFINDER
43
Figure 5.2 Figure from Paper IV. Calculation of the ICER - value is added for the incremental increase in the number of patients receiving appropriate treatment due to the pathogen being identified by PCR
The sensitivity to the model’s selection of a high-risk group was assessed by
repeating the cost-effectiveness analysis for a range of thresholds, PBC+, from 0% to
35% in steps of 2.5%. Table 5.1 presents the median ICER for the low- and high-risk
group for each threshold, PBC+. When the threshold was removed, the ICER was
€16,774 per life-year. The ICER in the high-risk group ranged down to €1,353 per
life-year for PBC+ = 32.5%, while the ICER in the low-risk group reached a maximum
of €534,355 per life-year when PBC+ = 2.5%.

GRADATION OF THE SEVERITY OF SEPSIS
44
Table 5.1: ICERs for complementary low- and high-risk groups for thresholds, PBC+, ranging from 0% to 35% in steps of 2.5%
Threshold,
PBC+ (%)
nlow-risk
(%)
ICERlow-risk
(€/life-year)
nhigh-risk
(%)
ICERhigh-risk
(€/life-year)
0 0 (0.0) - 3589 (100.0) 16774
2.5 736 (20.5) 534355 2853 (79.5) 12606
5.0 1237 (34.5) 158789 2352 (65.5) 10423
7.5 1734 (48.3) 71570 1855 (51.7) 8906
10.0 2081 (58.0) 42017 1508 (42.0) 8553
12.5 2349 (65.5) 32920 1239 (34.5) 7177
15.0 2546 (70.9) 29870 1043 (29.1) 7735
17.5 2723 (75.9) 27768 866 (24.1) 6775
20.0 2889 (80.5) 24056 700 (19.5) 6934
22.5 3074 (85.7) 21367 515 (14.3) 7090
25.0 3309 (92.2) 20845 280 (7.8) 4281
27.5 3471 (96.7) 18815 118 (3.3) 2653
30.0 3541 (98.7) 17528 48 (1.3) 2353
32.5 3582 (99.8) 16924 7 (0.2) 1353
35.0 3589 (100.0) 16774 0 (0.0) -
Figure 5.3 presents the results of the Monte-Carlo analyses for the full range of PBC+.
Panel A shows the results for the high-risk group, and Panel B the results for the
complementary low-risk group. A threshold of PBC+ = 0% meant that all patients were
assigned to the high-risk group and a threshold of PBC+ = 35% meant that all patients
were assigned to the low-risk group. The threshold for cost-effectiveness defined by
the National Institute for Clinical Excellence (NICE) (Appleby, Devlin & Parkin
2007) is £20,000 to £30,000 (about €35,000, shown as a dashed line in both panels).
When looking at the high-risk group alone, cost-effectiveness is demonstrated
(according to NICE) even when the threshold is removed: the ICER for all patients
is €16,774 per life-year which is significantly lower than the cost-effectiveness
threshold of €35,000 per life year. However, this result does not tell the full story. By
removing the threshold we are including a large number of low-risk patients for
testing. We may instead choose our high-risk group by removing those patients for
whom PCR testing is not cost-effective. At a threshold of PBC+ = 10.0%, the patients
(58.0% of all patients) below this threshold have an ICER = €42,017 per life-year
saved. For these patients, PCR testing is not cost-effective. If the high-risk group is
taken as all patients above this threshold, the ICER is €8,553 per life-year.
In addition to the ICER, hospitals must also consider other practical factors when
choosing to run a test. The absolute cost is important along with the throughput of
the laboratories running the test: it may be simply impractical to run PCR tests on

CHAPTER 5. APPLICATIONS OF SEPSISFINDER
45
every patient suspected of infection. So although we have found that it is not cost-
effective to run PCR for patients below a threshold of PBC+ = 10.0%, this threshold
does not necessarily define the choice of “high-risk” patients for whom testing should
be done. If the number of patients being tested is limited by laboratory throughput,
the threshold for “high-risk” will be set higher. Raising the threshold further will have
the dual effect of reducing the number of tests and increasing the incremental benefit
of each test, seen as the ICER falling with increasing threshold.
Figure 5.3 Figure from Paper IV. Boxplot for the Monte-Carlo analysis repeated at cut-offs of PBC+ = 0% to 35% in steps of 2.5%. Panel A shows the results for the high-risk group and Panel B for the low-risk group.
Risk-based stratification can be used to improve the cost-effectiveness of PCR by
removing patients for whom PCR testing is not cost-effective. PCR in an inpatient
population also provides an opportunity to increase appropriate treatment rates in the
highest-risk patients before they are transferred to the ICU, perhaps even preventing
ICU admissions.


47
CHAPTER 6. DISCUSSION
This chapter discusses the significance of the work completed during the PhD project
and offers suggestions for the direction of future work.
6.1. MAIN FINDINGS
Manual learning: Design of continuous distributions for infection variables
Starting with the D-Sepsis CPN that was part of Treat, the first goal of the PhD project
was to introduce continuous distributions for infection variables, forming the C-
Sepsis CPN. This was done manually, combining expert opinion with knowledge
gleaned from the literature, a method that has been proven successful several times
in CPN construction. The C-Sepsis CPN was validated by comparing the predictive
ability of the C-Sepsis and D-Sepsis CPNs with the remainder of the Treat model
being identical. The C-Sepsis CPN had an AUC of 0.80 for the prediction of
bacteraemia and the AUC for the D-Sepsis CPN was 0.73. The C-Sepsis CPN
represented a sizable improvement in predictive performance, although the small data
material meant that the result was not statistically significant. In addition to the
improvement in predictive performance, the introduction of continuous variables
solved the problem of “jumping” seen in the D-Sepsis CPN, where the discretization
of variables meant that, for example, a change in temperature of 0.1°C could result
in a large jump in the assessed illness severity.
Automatic learning: Tuning via automatic learning to improve predictive
performance
Despite its success, manual learning is limited in what can reasonably be achieved.
The availability of data in the literature was sub-optimal for the majority of
parameters. Additionally, the manual construction involved what was effectively
single-variable analysis. Automatic learning provided a structured way to further
improve the model, tuning it to predict clinical outcomes; either diagnostic (presence
of bacteraemia) or prognostic (30-day mortality).
To facilitate machine learning, the C-Sepsis CPN was clipped out of the Treat model,
and tuned as a standalone entity. The C-Sepsis CPN also allows for discrimination
between infectious and non-infectious inflammation: sepsis and NSIRS. The learning
strategy allowed the model to learn the different effects of sepsis and NSIRS on
individual branches of the inflammatory response.
The L-/LA-Sepsis CPNs resulting from automatic learning were validated by testing
their predictive ability for 30-day mortality. The learned CPNs substantially

GRADATION OF THE SEVERITY OF SEPSIS
48
outperformed both SIRS and the mREMS score: the AUC for 30-day mortality was
0.81, 0.67 and 0.54 for the LA-Sepsis CPN, the mREMS score and SIRS, respectively.
The comparison with clinical scores also highlighted one of the advantages of CPN
models – their ability to handle missing data. For the patient group studied, SIRS and
mREMS scores could be calculated for approximately 50% and 25% of the patients,
respectively. Other scores such as SOFA or MEDS could not be calculated for these
patients.
The performance of the LA-Sepsis CPN as a standalone model for mortality
prediction also motivated the tuning of another version of the Sepsis CPN to predict
bacteraemia – SepsisFinder. SepsisFinder’s performance in the prediction of
bacteraemia was stable across patients from both Denmark and Israel, suggesting that
the Sepsis CPNs may not require calibration for local conditions, that is, the sepsis
response is temporally, demographically and geographically invariant. This is
empirical evidence for one of the tenets used in the construction of Treat: that some
parts of the model require calibration, while other parts, including the Sepsis CPN,
do not.
The SepsisFinder and LA-Sepsis CPNs represent a significant step forward from
Treat’s original D-Sepsis CPN. Both models (considered as standalone entities) have
greater predictive performance than the Treat model for bacteraemia- and 30-day
mortality prediction, while using significantly fewer variables. Another advantage of
the SepsisFinder and LA-Sepsis CPNs is the ability to continually adjust and improve
the models as more data becomes available.
Applications: Risk-based stratification of patients to improve cost-effectiveness
of rapid diagnostics
It was assumed that SepsisFinder, a “lightweight” model tuned to predict
bacteraemia, could be used to stratify patients into risk-groups, as has previously been
done using Treat (Paul et al. 2006a). The SepsisFinder model uses up to 12 routinely
collected variables as opposed to over 100 used by Treat. The AUC for the prediction
of bacteraemia using the SepsisFinder model was 0.75, an improvement on the AUC
of 0.70 reported for Treat on a similar cohort (Paul et al. 2006a).
One of the opportunities for utilising such risk assessment is in tailoring the
diagnostic workup of patients suspected of sepsis. Expensive diagnostics can be made
cost-effective by limiting them to patients where 1) they will most likely be able to
influence treatment and 2) the influence on the treatment will give most benefit.
SepsisFinder can improve the cost-effectiveness of expensive rapid diagnostics by
identifying patients for whom testing would not be cost-effective. In a cohort of 3589
patients, SepsisFinder was able to select 58% of patients for whom PCR testing
would not be cost-effective (ICER = €42000 per life-year).
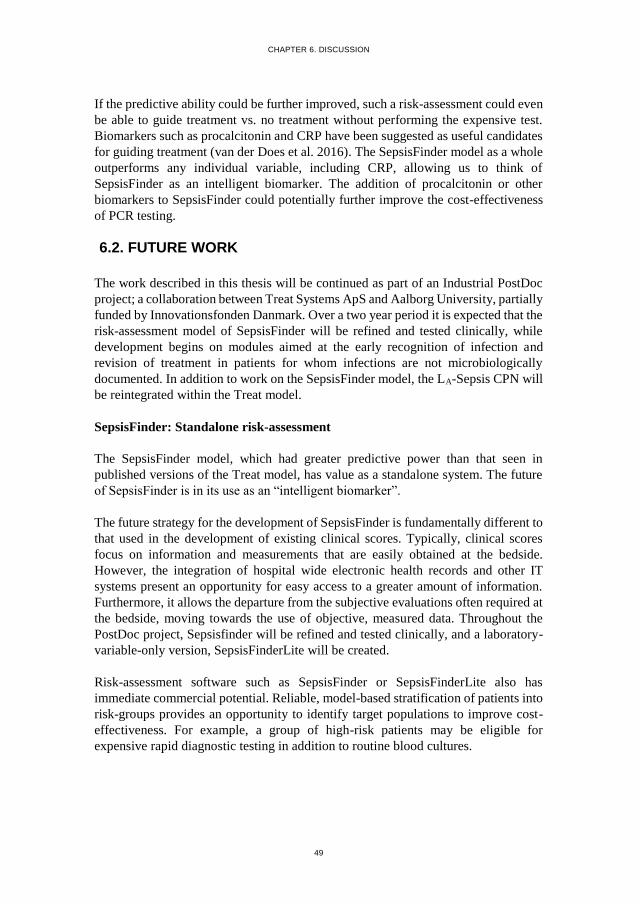
CHAPTER 6. DISCUSSION
49
If the predictive ability could be further improved, such a risk-assessment could even
be able to guide treatment vs. no treatment without performing the expensive test.
Biomarkers such as procalcitonin and CRP have been suggested as useful candidates
for guiding treatment (van der Does et al. 2016). The SepsisFinder model as a whole
outperforms any individual variable, including CRP, allowing us to think of
SepsisFinder as an intelligent biomarker. The addition of procalcitonin or other
biomarkers to SepsisFinder could potentially further improve the cost-effectiveness
of PCR testing.
6.2. FUTURE WORK
The work described in this thesis will be continued as part of an Industrial PostDoc
project; a collaboration between Treat Systems ApS and Aalborg University, partially
funded by Innovationsfonden Danmark. Over a two year period it is expected that the
risk-assessment model of SepsisFinder will be refined and tested clinically, while
development begins on modules aimed at the early recognition of infection and
revision of treatment in patients for whom infections are not microbiologically
documented. In addition to work on the SepsisFinder model, the LA-Sepsis CPN will
be reintegrated within the Treat model.
SepsisFinder: Standalone risk-assessment
The SepsisFinder model, which had greater predictive power than that seen in
published versions of the Treat model, has value as a standalone system. The future
of SepsisFinder is in its use as an “intelligent biomarker”.
The future strategy for the development of SepsisFinder is fundamentally different to
that used in the development of existing clinical scores. Typically, clinical scores
focus on information and measurements that are easily obtained at the bedside.
However, the integration of hospital wide electronic health records and other IT
systems present an opportunity for easy access to a greater amount of information.
Furthermore, it allows the departure from the subjective evaluations often required at
the bedside, moving towards the use of objective, measured data. Throughout the
PostDoc project, Sepsisfinder will be refined and tested clinically, and a laboratory-
variable-only version, SepsisFinderLite will be created.
Risk-assessment software such as SepsisFinder or SepsisFinderLite also has
immediate commercial potential. Reliable, model-based stratification of patients into
risk-groups provides an opportunity to identify target populations to improve cost-
effectiveness. For example, a group of high-risk patients may be eligible for
expensive rapid diagnostic testing in addition to routine blood cultures.

GRADATION OF THE SEVERITY OF SEPSIS
50
Early-Warning and Treatment revision
The models described in this dissertation may also be extended to create a more
complete picture of the response to sepsis by adding a temporal dimension.
The entire time-course of the infection should be considered: until now, point
estimates of the risk of bacteraemia/30-day mortality have been made at the time
when a patients is clinically recognised as having an infection. This use is valuable
in and of itself as an initial triage tool/risk-stratification and impacts decisions on
patient workup/treatment. However, this intelligent biomarker may also be useful
at other time points.
One such use could be as an in-hospital monitoring tool for the early detection of
hospital-acquired infections. The impact of such technology would be significant,
since time is critical in sepsis patients. Early identification of infection has the
potential to reduce the time to diagnosis and appropriate, live-saving treatment.
An intelligent tool for assessing the clinical success or failure of antibiotic treatment
is also needed; the causative pathogen (and hence the susceptibility to antibiotics) is
found in less than half of all patients with an infection. For these patients, there is no
objective measure of whether the treatment is appropriate and it is difficult to justify
treatment escalation or de-escalation. It is hoped that a SepsisFinder module can
provide support for the decision to revise treatment.
Re-integration within Treat
The original goal of tuning the Sepsis CPN was to improve the overall performance
of Treat’s decision support. The improvements seen in the predictive performance of
the standalone versions of the Sepsis CPN provide reason to believe that re-
integration will give an improvement in performance. Additionally, Treat includes
information on the site of infection, which is related to mortality (Chapter 4).
Therefore, it is expected this can further improve performance. However, the re-
integration is not a trivial cut and paste task. Re-integration will involve some degree
of automatic learning in the full Treat CPN. To our knowledge, there is no existing
descriptions of learning in such large CPNs, and computational problems are bound
to arise.
Treat Steward, the software package which includes the Treat CPN, is a fully
integrated system that combines antimicrobial stewardship with advanced decision
support. The purpose of antimicrobial stewardship is to promote the rational use of
antimicrobials, preserving their effectiveness as the prevalence of resistant microbes
increases. It is hoped that the improvements made to Treat Steward’s decision support
through the re-integration of the LA-Sepsis CPN will help in the fight against
antimicrobial resistance.

51
LITERATURE LIST
Alvarez, J., Mar, J., Varela-Ledo, E., Garea, M., Matinez-Lamas, L., Rodriguez, J. &
Regueiro, B. 2012, "Cost analysis of real-time polymerase chain reaction
microbiological diagnosis in patients with septic shock", Anaesthesia and
Intensive Care, vol. 40, no. 6, pp. 958-963.
Andreassen, S. 2000, Medical Decision Support Systems based on Causal
Probabilistic Networks, Aalborg University, 2000.
Andreassen, S., Leibovici, L., Paul, M., Nielsen, A.D., Zalounina, A., Kristensen,
L.E., Falborg, K., Kristensen, B., Frank, U. & Schønheyder, H.C. 2005, "A
probabilistic network for fusion of data and knowledge in clinical
microbiology" in Probabilistic Modeling in Bioinformatics and Medical
Informatics Springer, , pp. 451-472.
Andreassen, S., Riekehr, C., Kristensen, B., Schønheyder, H.C. & Leibovici, L. 1999,
"Using probabilistic and decision–theoretic methods in treatment and prognosis
modeling", Artificial Intelligence in Medicine, vol. 15, no. 2, pp. 121-134.
Angus, D.C., Linde-Zwirble, W.T., Lidicker, J., Clermont, G., Carcillo, J. & Pinsky,
M.R. 2001, "Epidemiology of severe sepsis in the United States: analysis of
incidence, outcome, and associated costs of care", Critical Care Medicine, vol.
29, no. 7, pp. 1303-1310.
Appleby, J., Devlin, N. & Parkin, D. 2007, "NICE's cost effectiveness threshold",
BMJ (Clinical research ed.), vol. 335, no. 7616, pp. 358-359.
Bartlett, J.G. 2006, "Narrative review: the new epidemic of Clostridium difficile–
associated enteric disease", Annals of Internal Medicine, vol. 145, no. 10, pp.
758-764.
Bone, R.C., Balk, R.A., Cerra, F.B., Dellinger, R.P., Fein, A.M., Knaus, W.A.,
Schein, R. & Sibbald, W.J. 1992, "Definitions for sepsis and organ failure and
guidelines for the use of innovative therapies in sepsis. The ACCP/SCCM
Consensus Conference Committee. American College of Chest
Physicians/Society of Critical Care Medicine.", CHEST Journal, vol. 101, no.
6, pp. 1644-1655.
Carpenter, C.R., Keim, S.M., Upadhye, S., Nguyen, H.B. & Best Evidence in
Emergency Medicine Investigator Group 2009, "Risk stratification of the
potentially septic patient in the emergency department: the Mortality in the

GRADATION OF THE SEVERITY OF SEPSIS
52
Emergency Department Sepsis (MEDS) score", The Journal of emergency
medicine, vol. 37, no. 3, pp. 319-327.
Corti, M., Guralnik, J.M., Salive, M.E. & Sorkin, J.D. 1994, "Serum albumin level
and physical disability as predictors of mortality in older persons", JAMA: the
journal of the American Medical Association, vol. 272, no. 13, pp. 1036-1042.
Dulhunty, J.M., Lipman, J., Finfer, S. & Sepsis Study Investigators for the ANZICS
Clinical Trials Group 2008, "Does severe non-infectious SIRS differ from
severe sepsis?", Intensive care medicine, vol. 34, no. 9, pp. 1654-1661.
Fine, M.J., Auble, T.E., Yealy, D.M., Hanusa, B.H., Weissfeld, L.A., Singer, D.E.,
Coley, C.M., Marrie, T.J. & Kapoor, W.N. 1997, "A prediction rule to identify
low-risk patients with community-acquired pneumonia", New England Journal
of Medicine, vol. 336, no. 4, pp. 243-250.
Howell, M.D., Donnino, M.W., Talmor, D., Clardy, P., Ngo, L. & Shapiro, N.I. 2007,
"Performance of severity of illness scoring systems in emergency department
patients with infection", Academic Emergency Medicine, vol. 14, no. 8, pp. 709-
714.
Kofoed, K., Zalounina, A., Andersen, O., Lisby, G., Paul, M., Leibovici, L. &
Andreassen, S. 2009, "Performance of the TREAT decision support system in
an environment with a low prevalence of resistant pathogens", The Journal of
antimicrobial chemotherapy, vol. 63, no. 2, pp. 400-404.
Kristensen, B., Andreassen, S., Leibovici, L., Riekehr, C., Kjaer, A.G. &
Schonheyder, H.C. 1999, "Empirical treatment of bacteraemic urinary tract
infection. Evaluation of a decision support system", Danish medical bulletin,
vol. 46, no. 4, pp. 349-353.
Lauritzen, S.L. 1995, "The EM algorithm for graphical association models with
missing data", Computational Statistics & Data Analysis, vol. 19, no. 2, pp.
191-201.
Laxminarayan, R., Duse, A., Wattal, C., Zaidi, A.K., Wertheim, H.F., Sumpradit, N.,
Vlieghe, E., Hara, G.L., Gould, I.M. & Goossens, H. 2013, "Antibiotic
resistance—the need for global solutions", The Lancet infectious diseases, vol.
13, no. 12, pp. 1057-1098.
Lehmann, L.E., Herpichboehm, B., Kost, G.J., Kollef, M.H. & Stüber, F. 2010, "Cost
and mortality prediction using polymerase chain reaction pathogen detection in
sepsis: evidence from three observational trials", Crit Care, vol. 14, no. 5, pp.
R186.
LITERATURE LIST
53
Leibovici, L., Fishman, M., Schonheyder, H.C., Riekehr, C., Kristensen, B., Shraga,
I. & Andreassen, S. 2000, "A causal probabilistic network for optimal treatment
of bacterial infections", Knowledge and Data Engineering, IEEE Transactions
on, vol. 12, no. 4, pp. 517-528.
Leibovici, L., Paul, M., Nielsen, A.D., Tacconelli, E. & Andreassen, S. 2007, "The
TREAT project: decision support and prediction using causal probabilistic
networks", International journal of antimicrobial agents, vol. 30, pp. 93-102.
Leibovici, L., Shraga, I., Andreassen, S. & Pauker, S.G. 1999, "How do you choose
antibiotic treatment?/Commentaries", British medical journal, vol. 318, no.
7198, pp. 1614.
Leibovici, L., Kariv, G. & Paul, M. 2013, "Long-term survival in patients included
in a randomized controlled trial of TREAT, a decision support system for
antibiotic treatment", The Journal of antimicrobial chemotherapy, vol. 68, no.
11, pp. 2664-2666.
Leibovici, L., Paul, M. & Andreassen, S. 2010, "Balancing the benefits and costs of
antibiotic drugs: the TREAT model", Clinical Microbiology and Infection, vol.
16, no. 12, pp. 1736-1739.
Levy, M.M., Fink, M.P., Marshall, J.C., Abraham, E., Angus, D., Cook, D., Cohen,
J., Opal, S.M., Vincent, J. & Ramsay, G. 2003, "2001 sccm/esicm/accp/ats/sis
international sepsis definitions conference", Intensive care medicine, vol. 29,
no. 4, pp. 530-538.
Liesenfeld, O., Lehman, L., Hunfeld, K. & Kost, G. 2014, "Molecular diagnosis of
sepsis: new aspects and recent developments", European Journal of
Microbiology and Immunology, vol. 4, no. 1, pp. 1-25.
Martin, G.S., Mannino, D.M., Eaton, S. & Moss, M. 2003, "The epidemiology of
sepsis in the United States from 1979 through 2000", New England Journal of
Medicine, vol. 348, no. 16, pp. 1546-1554.
Mwaigwisya, S., Assiri, R.A.M. & O'Grady, J. 2015, "Emerging commercial
molecular tests for the diagnosis of bloodstream infection", Expert review of
molecular diagnostics, , no. 0, pp. 1-12.
Olsson, T., Terént, A. & Lind, L. 2004, "Rapid Emergency Medicine Score: a new
prognostic tool for in‐hospital mortality in nonsurgical emergency department
patients", Journal of internal medicine, vol. 255, no. 5, pp. 579-587.

GRADATION OF THE SEVERITY OF SEPSIS
54
Paul, M., Shani, V., Muchtar, E., Kariv, G., Robenshtok, E. & Leibovici, L. 2010,
"Systematic review and meta-analysis of the efficacy of appropriate empiric
antibiotic therapy for sepsis", Antimicrobial Agents and Chemotherapy, vol. 54,
no. 11, pp. 4851-4863.
Paul, M., Andreassen, S., Nielsen, A.D., Tacconelli, E., Almanasreh, N., Fraser, A.,
Yahav, D., Ram, R., Leibovici, L. & TREAT Study Group 2006a, "Prediction
of Bacteremia Using TREAT, a Computerized Decision-Support System",
Clinical Infectious Diseases, vol. 42, no. 9, pp. 1274-1282.
Paul, M., Andreassen, S., Tacconelli, E., Nielsen, A.D., Almanasreh, N., Frank, U.,
Cauda, R., Leibovici, L. & on behalf of the TREAT Study Group 2006b,
"Improving empirical antibiotic treatment using TREAT, a computerized
decision support system: cluster randomized trial", Journal of Antimicrobial
Chemotherapy, vol. 58, no. 6, pp. 1238-1245.
Paul, M., Nielsen, A.D., Goldberg, E., Andreassen, S., Tacconelli, E., Almanasreh,
N., Frank, U., Cauda, R. & Leibovici, L. 2007, "Prediction of specific
pathogens in patients with sepsis: evaluation of TREAT, a computerized
decision support system", Journal of Antimicrobial Chemotherapy, vol. 59, no.
6, pp. 1204-1207.
Shapiro, N.I., Wolfe, R.E., Moore, R.B., Smith, E., Burdick, E. & Bates, D.W. 2003,
"Mortality in Emergency Department Sepsis (MEDS) score: a prospectively
derived and validated clinical prediction rule", Critical Care Medicine, vol. 31,
no. 3, pp. 670-675.
van der Does, Y., Limper, M., Schuit, S.C., Poley, M.J., van Rosmalen, J., Ramakers,
C., Patka, P., van Gorp, E.C. & Rood, P.P. 2016, "Higher diagnostic accuracy
and cost-effectiveness using procalcitonin in the treatment of emergency
medicine patients with fever (The HiTEMP study): a multicenter randomized
study", BMC Emergency Medicine, vol. 16, no. 1, pp. 1.
Vernaz, N., Hill, K., Leggeat, S., Nathwani, D., Philips, G., Bonnabry, P. & Davey,
P. 2009, "Temporal effects of antibiotic use and Clostridium difficile
infections", The Journal of antimicrobial chemotherapy, vol. 63, no. 6, pp.
1272-1275.
Vincent, J. 1997, "Dear SIRS, I'm sorry to say that I don't like you", Critical Care
Medicine, vol. 25, no. 2, pp. 372-374.
Vincent, J., Dubois, M., Navickis, R.J. & Wilkes, M.M. 2003, "Hypoalbuminemia in
acute illness: Is there a rationale for intervention?: A meta-analysis of cohort
studies and controlled trials", Annals of Surgery, vol. 237, no. 3, pp. 319.

LITERATURE LIST
55
Vincent, J., Sakr, Y., Sprung, C.L., Ranieri, V.M., Reinhart, K., Gerlach, H., Moreno,
R., Carlet, J., Le Gall, J. & Payen, D. 2006, "Sepsis in European intensive care
units: Results of the SOAP study*", Critical Care Medicine, vol. 34, no. 2, pp.
344-353.
Vincent, J., Moreno, R., Takala, J., Willatts, S., De Mendonça, A., Bruining, H.,
Reinhart, C., Suter, P. & Thijs, L. 1996, "The SOFA (Sepsis-related Organ
Failure Assessment) score to describe organ dysfunction/failure", Intensive
care medicine, vol. 22, no. 7, pp. 707-710.
Ward, L. & Andreassen, S. 2015, "A Bayesian Approach to Model Development:
Automatic Learning for Tuning Predictive Performance", 9th IFAC Symposium
on Biological and Medical Systems.
Ward, L., Mogensen, M.L., Paul, M., Leibovici, L. & Andreassen, S. 2014, "A
Bayesian approach to model-development: design of continuous distributions
for infection variables", World Congress The International Federation of
Automatic Control, IFAC, pp. 5653.

ISSN (online) – 2246-1302ISBN (online) - 978-87-7112-767-6