GPS Strain & Earthquakes Unit 3: Finding location and ... · Unit 3: Finding location and velocity...
7
Questions or comments please contact education AT unavco.org or Vince_Cronin AT Baylor.edu Page 1 Version December 5, 2017 GPS Strain & Earthquakes Unit 3: Finding location and velocity data for PBO GPS stations Original activity by Vince Cronin (Baylor University). Revisions by Beth Pratt-Sitaula (UNAVCO). Analyzing the velocities recorded at different GPS stations can give significant insights into plate tectonic motion, earthquake hazards, volcanic hazards, groundwater removal, and more. GPS data can be acquired from a variety of different research groups around the world, but some the most accessible and easy to use GPS data comes from the EarthScope Plate Boundary Observatory (PBO), which is managed by UNAVCO. The data are available online for free at https://www.unavco.org/instrumentation/networks/status/pbo/gps. In this exercise you will learn one method for downloading GPS station location and velocity data. Worked Example: Finding PBO GPS data in the Oregon Coast Ranges Finding station locations in latitude-longitude coordinates We will search for data generated by one of the PBO’s permanent GPS stations above the Cascadia subduction zone in northwest Oregon. If we do not know which station we want to learn about, we can go to the interactive PBO map and zoom-in on our area of interest (https://www.unavco.org/instrumentation/networks/status/pbo/gps). We find several green marker dots along the coastline. Clicking on any of the dots will provide some initial information. The dot we chose (Figure 1) is associated with station P395 (Rose_LodgeOR2006) located west of Salem in northwest Oregon. Clicking on the dot gives us a box that provides the name and location of the site, as well as a clickable link to more information at https://www.unavco.org/instrumentation/networks/status/pbo/overview/P395 Figure 1. Interactive Plate Boundary Observatory station viewer – zoomed to the area around station P395 in northwest Oregon (west of Salem). Inset window provides some data and a clickable link for more data about site P395. From https://www.unavco.org/instrumentation/networks/status/pbo/gps.
Transcript of GPS Strain & Earthquakes Unit 3: Finding location and ... · Unit 3: Finding location and velocity...
Questions or comments please contact education AT unavco.org or Vince_Cronin AT Baylor.edu Page 1 Version December 5, 2017
GPS Strain & Earthquakes Unit 3: Finding location and velocity data for PBO GPS stations Original activity by Vince Cronin (Baylor University). Revisions by Beth Pratt-Sitaula (UNAVCO).
Analyzing the velocities recorded at different GPS stations can give significant insights into plate tectonic motion, earthquake hazards, volcanic hazards, groundwater removal, and more.
GPS data can be acquired from a variety of different research groups around the world, but some the most accessible and easy to use GPS data comes from the EarthScope Plate Boundary Observatory (PBO), which is managed by UNAVCO. The data are available online for free at https://www.unavco.org/instrumentation/networks/status/pbo/gps. In this exercise you will learn one method for downloading GPS station location and velocity data.
Worked Example: Finding PBO GPS data in the Oregon Coast Ranges Finding station locations in latitude-longitude coordinates
We will search for data generated by one of the PBO’s permanent GPS stations above the Cascadia subduction zone in northwest Oregon. If we do not know which station we want to learn about, we can go to the interactive PBO map and zoom-in on our area of interest (https://www.unavco.org/instrumentation/networks/status/pbo/gps). We find several green marker dots along the coastline. Clicking on any of the dots will provide some initial information. The dot we chose (Figure 1) is associated with station P395 (Rose_LodgeOR2006) located west of Salem in northwest Oregon. Clicking on the dot gives us a box that provides the name and location of the site, as well as a clickable link to more information at https://www.unavco.org/instrumentation/networks/status/pbo/overview/P395
Figure 1. Interactive Plate Boundary Observatory station viewer – zoomed to the area around station P395 in northwest Oregon (west of Salem). Inset window provides some data and a clickable link for more data about site P395. From https://www.unavco.org/instrumentation/networks/status/pbo/gps.
Unit 3: Finding location and velocity data for PBO GPS stations
Questions or comments please contact education AT unavco.org or Vince_Cronin AT Baylor.edu Page 2 Version December 5, 2017
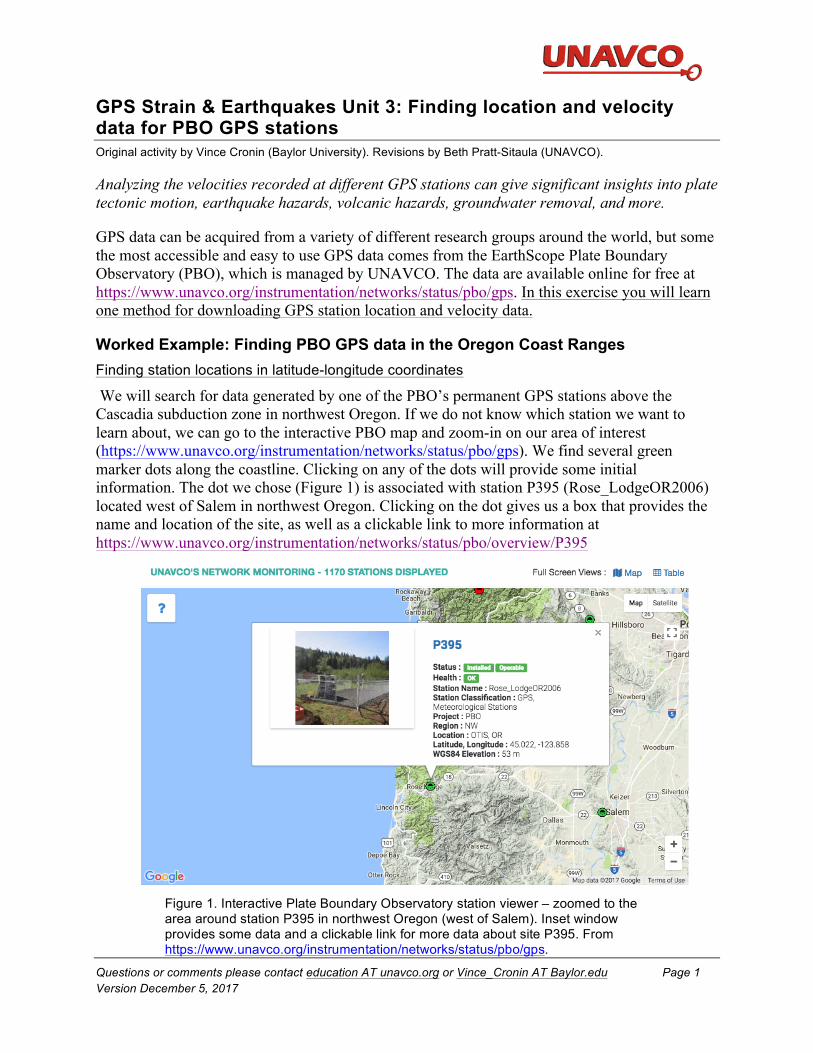
The overview page provides us with some information that we will need, and even some resources we might not need (such as a picture of the station) but is nice to have (Figure 2).
Near the bottom on the left side of the P395 overview page is a box titled “GPS Monument Coordinates.” The station location is listed on the line that begins “lat/log/elev (d/d/m).” The first number is the site latitude with positive values indicating north latitude (geographic coordinate system in the WGS84 datum). The second number is the longitude, with negative indicating west longitude. The third number is the elevation in meters relative to the WGS84 ellipsoid – that is, it is not the elevation relative to mean sea level, as might be indicated on a USGS topographic map. On September 16, 2015, those data for site P404 were
Latitude 45.02228° (positive is north latitude) Longitude -123.85753° (negative is west longitude) Elevation of 53 meters above the WGS84 datum
Carefully record* the latitude and longitude, with all of the decimal places. The sign of the longitude is important. These data will be part of the input for the strain calculator that we will use later in this process. Finding station velocities
Now we need to acquire the velocity data for the site. Returning to the overview page for site P395, mid-way along the left side of the page there is a box labeled “Station Position” with three graphs. Clicking on the box causes the window to expand. The three plots show the change in position as a function of time – that is, they are time-series plots. The upper plot shows change in a north or south direction, the middle plot shows motion in an east or west direction, and the lowest plot shows motion in the up or down direction. These changes are measured relative to a reference frame that is computed relative to a set of GPS sites established in the stable interior of North America (called NAM08 for “North America 2008). Read more about references frames at http://www.unavco.org/software/visualization/GPS-Velocity-Viewer/GPS-Velocity-Viewer-frames.html
*Recording sheets are at the end of this document.
Figure 2. Plate Boundary Observatory Station P395 just northeast of Lincoln City, Oregon. From https://www.unavco.org/instrumentation/networks/status/pbo/photos/P395
Unit 3: Finding location and velocity data for PBO GPS stations
Questions or comments please contact education AT unavco.org or Vince_Cronin AT Baylor.edu Page 3 Version December 5, 2017
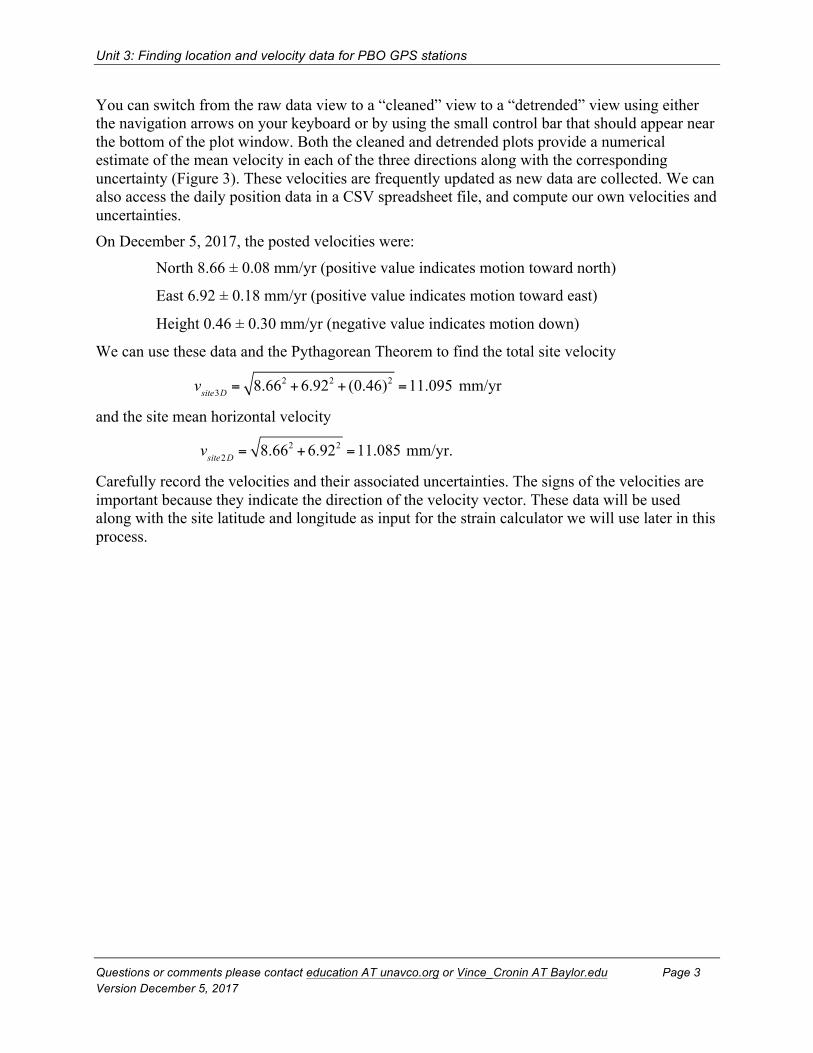
You can switch from the raw data view to a “cleaned” view to a “detrended” view using either the navigation arrows on your keyboard or by using the small control bar that should appear near the bottom of the plot window. Both the cleaned and detrended plots provide a numerical estimate of the mean velocity in each of the three directions along with the corresponding uncertainty (Figure 3). These velocities are frequently updated as new data are collected. We can also access the daily position data in a CSV spreadsheet file, and compute our own velocities and uncertainties. On December 5, 2017, the posted velocities were:
North 8.66 ± 0.08 mm/yr (positive value indicates motion toward north)
East 6.92 ± 0.18 mm/yr (positive value indicates motion toward east)
Height 0.46 ± 0.30 mm/yr (negative value indicates motion down)
We can use these data and the Pythagorean Theorem to find the total site velocity
vsite3D = 8.662 +6.922 + (0.46)2 =11.095 mm/yr
and the site mean horizontal velocity
vsite2D = 8.662 +6.922 =11.085 mm/yr.
Carefully record the velocities and their associated uncertainties. The signs of the velocities are important because they indicate the direction of the velocity vector. These data will be used along with the site latitude and longitude as input for the strain calculator we will use later in this process.

Unit 3: Finding location and velocity data for PBO GPS stations
Questions or comments please contact education AT unavco.org or Vince_Cronin AT Baylor.edu Page 4 Version December 5, 2017
Figure 3. Static plot of cleaned and detrended time-series plots with interpreted velocities relative to the stable North American reference frame (NAM08) from PBO GPS station P395. Accessed 5 December 2017 via https://www.unavco.org/instrumentation/networks/status/pbo/overview/P395.

Unit 3: Finding location and velocity data for PBO GPS stations
Questions or comments please contact education AT unavco.org or Vince_Cronin AT Baylor.edu Page 5 Version December 5, 2017
Resources • Information about the EarthScope Plate Boundary Observatory is available online via
https://www.unavco.org/instrumentation/networks/status/pbo • Information about the reference frames can be found at
http://www.unavco.org/software/visualization/GPS-Velocity-Viewer/GPS-Velocity-Viewer-frames.html
• Information about UNAVCO is available online via http://www.unavco.org/ • The full public data holdings of UNAVCO are available via their "Data Archive Interface
Version 2" at https://www.unavco.org/data/gps-gnss/data-access-methods/dai2/app/dai2.html#.
Finding Location and velocity data for PBO GPS stations
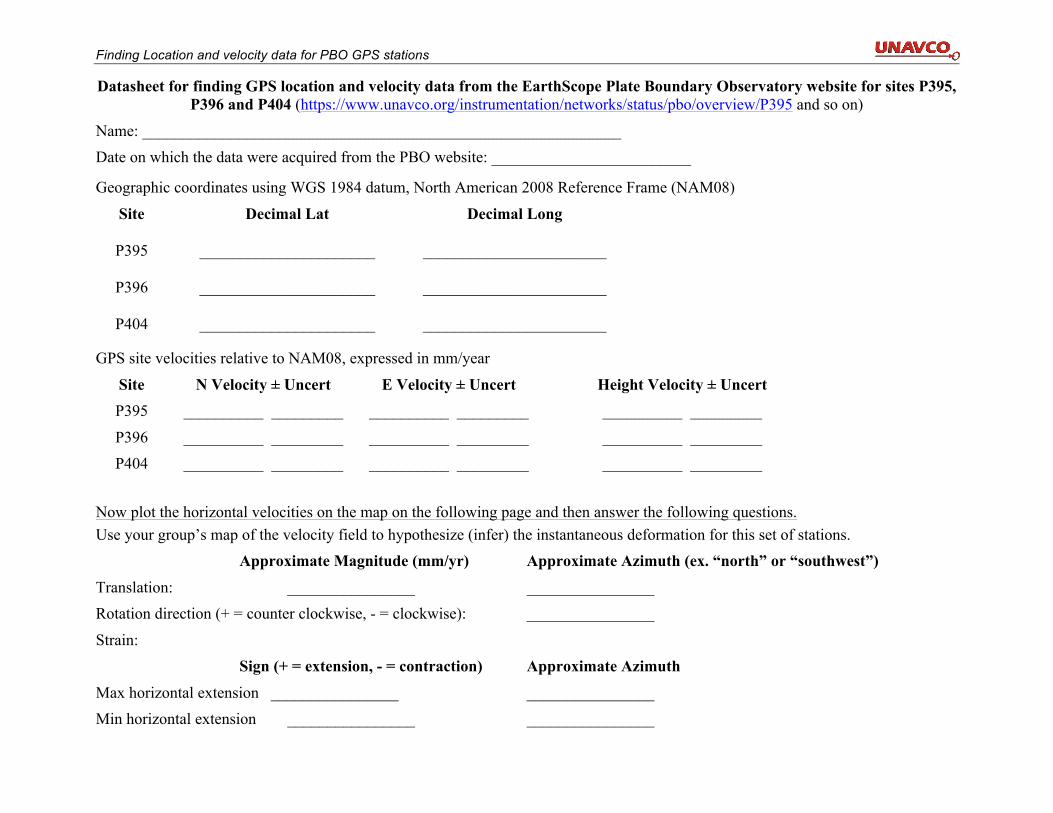
Datasheet for finding GPS location and velocity data from the EarthScope Plate Boundary Observatory website for sites P395, P396 and P404 (https://www.unavco.org/instrumentation/networks/status/pbo/overview/P395 and so on)
Name: ____________________________________________________________ Date on which the data were acquired from the PBO website: _________________________
Geographic coordinates using WGS 1984 datum, North American 2008 Reference Frame (NAM08)
Site Decimal Lat Decimal Long P395 ______________________ _______________________ P396 ______________________ _______________________ P404 ______________________ _______________________
GPS site velocities relative to NAM08, expressed in mm/year
Site N Velocity ± Uncert E Velocity ± Uncert Height Velocity ± Uncert P395 __________ _________ __________ _________ __________ _________
P396 __________ _________ __________ _________ __________ _________ P404 __________ _________ __________ _________ __________ _________ Now plot the horizontal velocities on the map on the following page and then answer the following questions. Use your group’s map of the velocity field to hypothesize (infer) the instantaneous deformation for this set of stations. Approximate Magnitude (mm/yr) Approximate Azimuth (ex. “north” or “southwest”)
Translation: ________________ ________________ Rotation direction (+ = counter clockwise, - = clockwise): ________________
Strain: Sign (+ = extension, - = contraction) Approximate Azimuth
Max horizontal extension ________________ ________________ Min horizontal extension ________________ ________________
Unit 3: Finding location and velocity data for PBO GPS stations
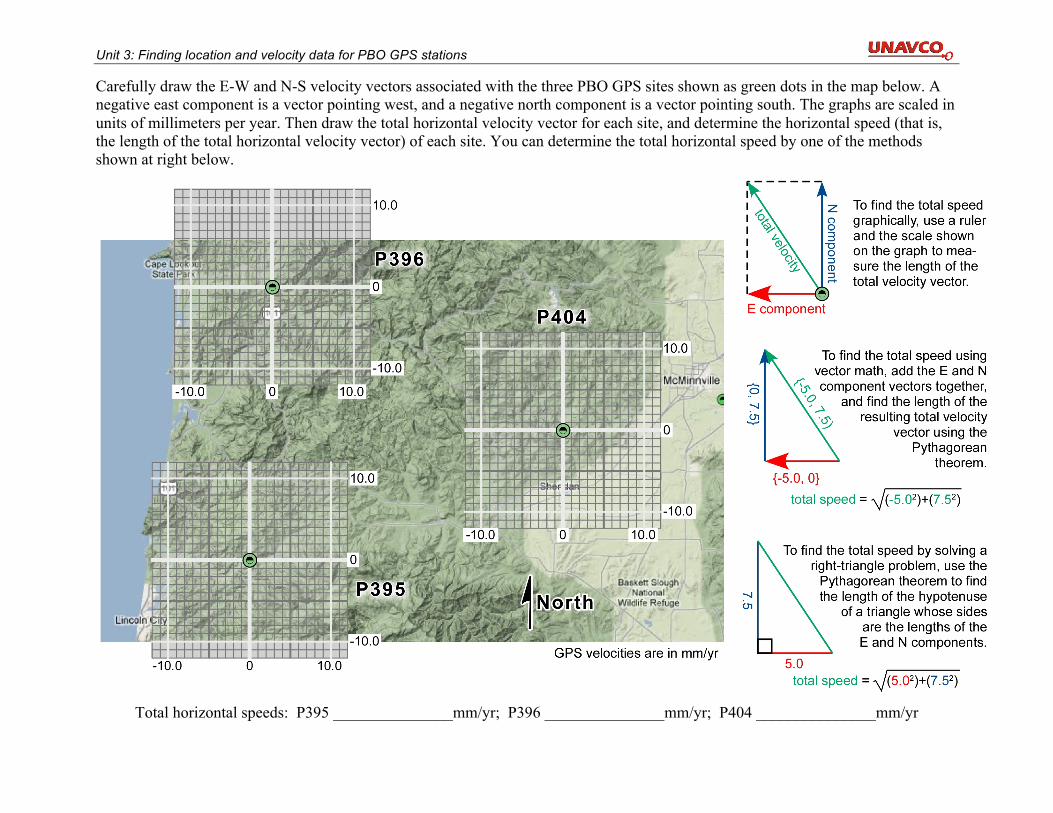
Carefully draw the E-W and N-S velocity vectors associated with the three PBO GPS sites shown as green dots in the map below. A negative east component is a vector pointing west, and a negative north component is a vector pointing south. The graphs are scaled in units of millimeters per year. Then draw the total horizontal velocity vector for each site, and determine the horizontal speed (that is, the length of the total horizontal velocity vector) of each site. You can determine the total horizontal speed by one of the methods shown at right below.
Total horizontal speeds: P395 _______________mm/yr; P396 _______________mm/yr; P404 _______________mm/yr
![Finding Velocity and Position from Acceleration - Sharifsharif.edu/~hfarhadi/section 4-2.pdf · Finding Velocity and Position from Acceleration ... ~ x2/3, [0, 1] 3. f(x) ... Assumethatl](https://static.fdocuments.net/doc/165x107/5ab980b67f8b9ac1058df696/finding-velocity-and-position-from-acceleration-hfarhadisection-4-2pdffinding.jpg)