Gpro investor presentation november 2017
34
-
Upload
investorsgopro -
Category
Investor Relations
-
view
10.109 -
download
0
Transcript of Gpro investor presentation november 2017

SAFE HARBOR STATEMENT
This presentation may contain projections or other forward-looking statements within the meaning of Section 27A of the Securities Act of 1933, as amended, and Section21E of the Securities Exchange Act of 1934, as amended. Forward-looking statements in this presentation include, but are not limited to, expectations regarding ourbusiness outlook for the fourth quarter of 2017 and calendar year 2017. These statements involve risks and uncertainties, and actual events or results may differmaterially. Among the important factors that could cause actual results to differ materially from those in the forward-looking statements are the risk that our reduction inoperating expenses may impact our ability to meet our business objectives and achieve our revenue targets and may not result in the expected improvement in ourprofitability; the fact that our future growth depends in part on further penetrating our addressable market and growing internationally, and we may not be successful indoing so; any inability to successfully manage frequent product introductions (including our 2017 roadmap for new hardware and software products including the newFusion camera and major new software features) and transitions, including managing our sales channel and inventory and accurately forecasting future sales; our relianceon third party suppliers, some of which are sole source suppliers, to provide components for our products; our dependence on sales of our cameras, mounts andaccessories for substantially all of our revenue; the effect of a decrease in the sales or change in sales mix of these products; the effect of a decrease in sales during theholiday season; the fact that an economic downturn or economic uncertainty in our key U.S. and international markets may adversely affect consumer discretionaryspending and demand for our products; any inability to anticipate consumer preferences and successfully develop and market desirable products; the risks associated withthe entrance into the consumer drone market and the re-launch of our drone in February 2017; the effects of the highly competitive market in which we operate; the fact thatwe may not be able to achieve revenue growth or profitability in the future; risks related to inventory, purchase commitments and long-lived assets; the importance ofmaintaining the value and reputation of our brand; and other factors detailed in the Risk Factors section of our Annual Report on Form 10-K for the year ended December31, 2016, which is on file with the Securities and Exchange Commission and as supplemented by Item 1A Risk Factors in our Quarterly Report on Form 10-Q for thequarter ended June 30, 2017. Additional information will also be set forth in our Quarterly Report on Form 10-Q for the quarter ended September 30, 2017, which is on filewith the Securities and Exchange Commission (the “SEC”) and may be obtained for free by visiting EDGAR on the SEC web site at www.sec.gov.
These forward-looking statements speak only as of the date hereof or as of the date otherwise stated herein. GoPro disclaims any obligation to update these forward-looking statements.
In addition to U.S. GAAP financials, this presentation includes certain non-GAAP financial measures, including non-GAAP gross margin, operating expenses, operatingincome (loss), net income (loss), earnings (loss) per share and adjusted EBITDA. These non-GAAP measures are in addition to, not a substitute for or superior to,measures of financial performance prepared in accordance with U.S. GAAP. The non-GAAP financial measures used by GoPro may differ from the non-GAAP financialmeasures used by other companies. A reconciliation of these measures to the most directly comparable U.S. GAAP measure is included in the Appendix to these slides.
The trademarks included herein are the property of the owners thereof and are used for reference purposes only. Such use should not be construed as an endorsement ofthe products or services of GoPro.
GOPRO AT A GLANCE
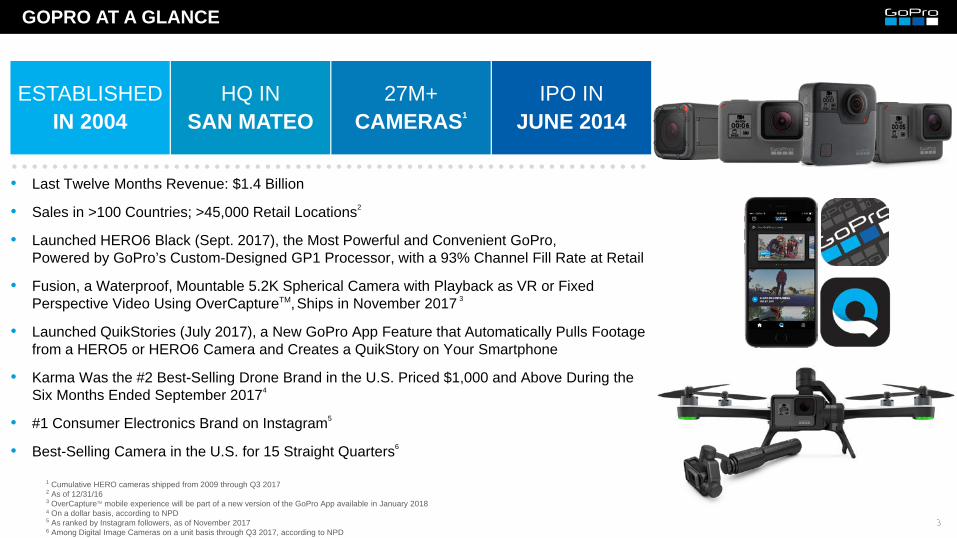
1 Cumulative HERO cameras shipped from 2009 through Q3 20172 As of 12/31/163 OverCaptureTM mobile experience will be part of a new version of the GoPro App available in January 20184 On a dollar basis, according to NPD5 As ranked by Instagram followers, as of November 20176 Among Digital Image Cameras on a unit basis through Q3 2017, according to NPD
ESTABLISHEDIN 2004
• • • • • • • • • • • • • • • • • • • • • • • • • • • • • • • • • • • • • • • • • • • • • • • • • • • • • • • • • • • • • • •
HQ INSAN MATEO
27M+CAMERAS1
IPO INJUNE 2014
• Last Twelve Months Revenue: $1.4 Billion
• Sales in >100 Countries; >45,000 Retail Locations2
• Launched HERO6 Black (Sept. 2017), the Most Powerful and Convenient GoPro, Powered by GoPro’s Custom-Designed GP1 Processor, with a 93% Channel Fill Rate at Retail
• Fusion, a Waterproof, Mountable 5.2K Spherical Camera with Playback as VR or Fixed Perspective Video Using OverCaptureTM,Ships in November 2017 3
• Launched QuikStories (July 2017), a New GoPro App Feature that Automatically Pulls Footage from a HERO5 or HERO6 Camera and Creates a QuikStory on Your Smartphone
• Karma Was the #2 Best-Selling Drone Brand in the U.S. Priced $1,000 and Above During the Six Months Ended September 20174
• #1 Consumer Electronics Brand on Instagram5
• Best-Selling Camera in the U.S. for 15 Straight Quarters6
Q3 2017 PRODUCT ANNOUNCEMENT
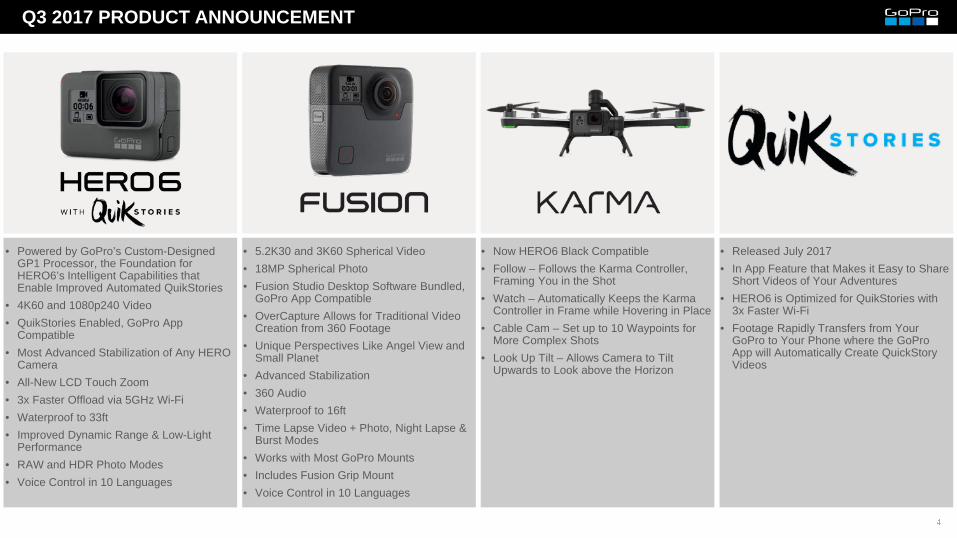
• Powered by GoPro’s Custom-Designed GP1 Processor, the Foundation for HERO6’s Intelligent Capabilities that Enable Improved Automated QuikStories
• 4K60 and 1080p240 Video• QuikStories Enabled, GoPro App
Compatible• Most Advanced Stabilization of Any HERO
Camera• All-New LCD Touch Zoom• 3x Faster Offload via 5GHz Wi-Fi• Waterproof to 33ft• Improved Dynamic Range & Low-Light
Performance• RAW and HDR Photo Modes• Voice Control in 10 Languages
• 5.2K30 and 3K60 Spherical Video• 18MP Spherical Photo • Fusion Studio Desktop Software Bundled,
GoPro App Compatible• OverCapture Allows for Traditional Video
Creation from 360 Footage• Unique Perspectives Like Angel View and
Small Planet• Advanced Stabilization• 360 Audio• Waterproof to 16ft• Time Lapse Video + Photo, Night Lapse &
Burst Modes• Works with Most GoPro Mounts• Includes Fusion Grip Mount• Voice Control in 10 Languages
• Now HERO6 Black Compatible• Follow – Follows the Karma Controller,
Framing You in the Shot• Watch – Automatically Keeps the Karma
Controller in Frame while Hovering in Place• Cable Cam – Set up to 10 Waypoints for
More Complex Shots• Look Up Tilt – Allows Camera to Tilt
Upwards to Look above the Horizon
• Released July 2017• In App Feature that Makes it Easy to Share
Short Videos of Your Adventures• HERO6 is Optimized for QuikStories with
3x Faster Wi-Fi• Footage Rapidly Transfers from Your
GoPro to Your Phone where the GoPro App will Automatically Create QuickStory Videos

5
WE ENABLE IMMERSIVE AND ENGAGING SHARING

GOPRO MODEL: A VIRTUOUS CYCLE
VIRALAWARENESS + ADOPTION
SHAREDEXPERIENCES

ABOUT US
what we make
Versatile Storytelling Solutions
what we do
Enable Immersive Sharing
WHAT WE DOWHAT WE MAKE

THRIVING GLOBAL BRAND AND COMMUNITY
35MMViews of GoPro content in the first 9 months of 2017
~27% YoY Growth~45% CAGR ~25% YoY Growth
SUBSCRIBERS1
2013 2017
~1MM
~5MM
2015
~3MM
22yearsGoPro tagged content uploaded to YouTube in 20162
~85% YoY Growth3
FOLLOWERS1
~275% CAGR ~30% YoY Growth
2013 2017
~14MM
2015
~6MM
~70K
LIKES1
~15% CAGR ~5% YoY Growth
2013 2017
~6MM
~11MM
2015
~9MM
INCREASING FOLLOWERS ENGAGED
550MM
1 Social media numbers are as of Q3 of each respective year2 Content with GoPro in the title, description or keyword in 20163 Median organic views per video in the first 9 months of 2017

2017 PRIORITIES
Drive profitability through improved efficiency, lower costs and execution
Make the smartphone central to the GoPro experience
Market the improved GoPro experience to our extended community
Grow our business internationally
Expand the GoPro product line for advanced users
1
2
3
4
5


INDUSTRY LEADING HARDWARE
MSRP: $299.99 MSRP: $399.99 MSRP: $499.99

INDUSTRY LEADING HARDWARE
1 US MSRP2 Camera sold separately
HERO6 Bundle1: $1,199.99MSRP1,2: $799.99
MSRP: $699.99
AERIAL. HANDHELD. MOUNTABLE.MORE THAN A DRONE.
360-DEGREE SPHERICAL CAPTURE.

EXPANDING USE CASESKE
Y PR
OD
UC
TS
DRONE & STABILIZATION
MSR
P
MOUNTS ACCESSORIES
• Karma Drone• Karma Grip• Karma Accessories
Drone1: $799.99 – $1,199.99Grip: $299.99Accessories: $19.99 – $99.99
• Shorty• 3-Way• Jaws Flex Clamp
$14.99 – $169.99
• Chesty• Helmet Strap Mount• Seeker Backpack
• Smart Remote• Remo: Voice Activated Remote• Dual Battery Charger
$19.99 – $79.99
1 US MSRP

TECHNOLOGY INNOVATOR
ROBOTICS + NEW CAMERA TYPES VR + OVERCAPTURE APPS
Mobile & Cloud Automated Storytelling
Next Gen Capture Leads To Next Gen Storytelling
Enabling New Use Cases, Appealing To New Customers
SEAMLESS ECOSYSTEM
Improved Capture & Storytelling
TECHNOLOGY FOUNDATION
GP1 CUSTOM PROCESSOR
MACHINE LEARNING
ADVANCED IMAGE SCIENCE COMPUTER VISION
AERIAL VIRTUAL REALITY
MOBILE DEVELOPMENT ROBOTICS AUTOMATED STORYTELLING
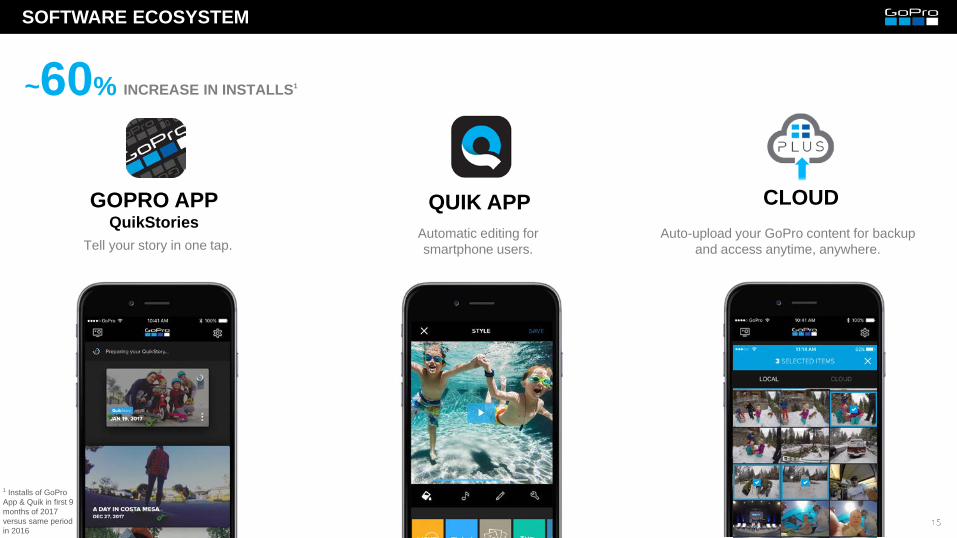
SOFTWARE ECOSYSTEM
CLOUDQUIK APPGOPRO APPQuikStories
INCREASE IN INSTALLS1~60%
1 Installs of GoPro App & Quik in first 9 months of 2017 versus same period in 2016
Automatic editing for smartphone users.
Auto-upload your GoPro content for backup and access anytime, anywhere.Tell your story in one tap.


MARKETING
SOCIAL PRINT ADSGLOBAL
RESORTSCHANNEL
MARKETINGGLOBAL
TRADESHOWS OUTDOORATHLETES & SOCIAL
INFLUENCERSTOP TIER EVENTS

STRONG GLOBAL NETWORK OF RETAIL DISTRIBUTION
1 As of 12/31/162 According to GfK
BIG BOX RETAIL
MID MARKET RETAIL
SPECIALTY RETAIL ONLINE • 3Q17 revenue was up 26% YoY in EMEA
• 3Q17 revenue was up 153% YoY in APAC
• 3Q17 camera unit sell-thru was up 99% YoY in Japan2
• 3Q17 camera unit sell-thru was up 25% YoY in China2
GLOBAL FOOTPRINT>45,000 RETAIL LOCATIONS; >100 COUNTRIES1

GLOBAL POINT OF PURCHASE
As of 12/31/16
~29KPOINT OF PURCHASE
DISPLAYS GLOBALLY


REVENUE & UNITS SHIPPED
$986
$1,394
$1,620
$1,185
$241$330
2013 2014 2015 2016 3Q16 3Q17
REVENUE$ in millions
3.8
5.2
6.6
4.8
1.02 1.14
2013 2014 2015 2016 3Q16 3Q17
CAMERA UNITS SHIPPEDUnits in millions
Annual Quarterly Annual Quarterly
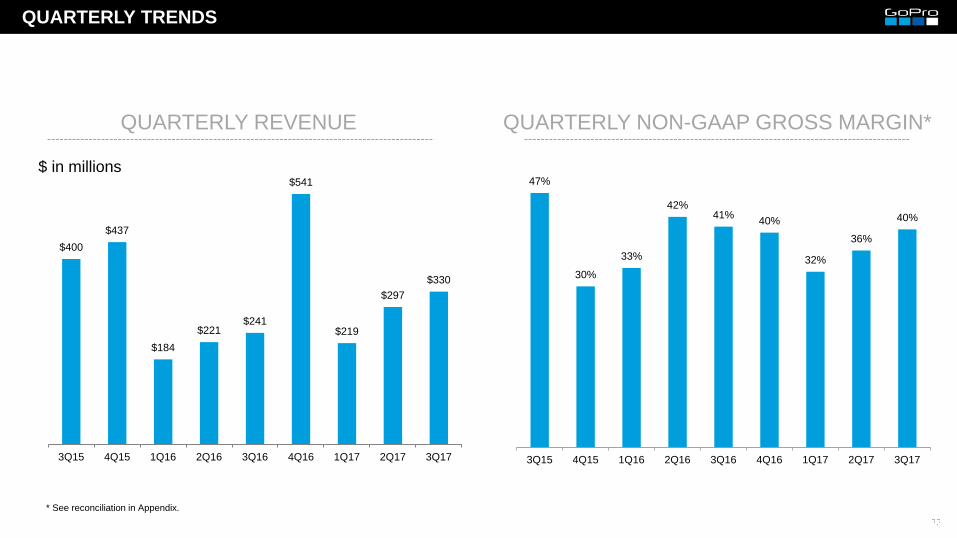
QUARTERLY TRENDS
47%
30%
33%
42%41% 40%
32%
36%
40%
3Q15 4Q15 1Q16 2Q16 3Q16 4Q16 1Q17 2Q17 3Q17
QUARTERLY REVENUE QUARTERLY NON-GAAP GROSS MARGIN*
$400$437
$184$221
$241
$541
$219
$297$330
3Q15 4Q15 1Q16 2Q16 3Q16 4Q16 1Q17 2Q17 3Q17
$ in millions
* See reconciliation in Appendix.
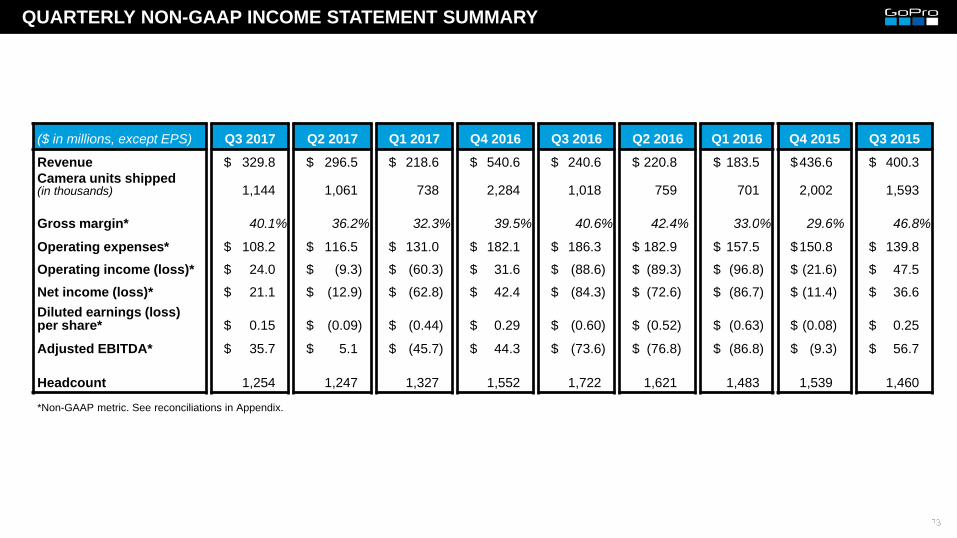
QUARTERLY NON-GAAP INCOME STATEMENT SUMMARY
($ in millions, except EPS) Q3 2017 Q2 2017 Q1 2017 Q4 2016 Q3 2016 Q2 2016 Q1 2016 Q4 2015 Q3 2015Revenue $ 329.8 $ 296.5 $ 218.6 $ 540.6 $ 240.6 $ 220.8 $ 183.5 $436.6 $ 400.3Camera units shipped(in thousands) 1,144 1,061 738 2,284 1,018 759 701 2,002 1,593
Gross margin* 40.1% 36.2% 32.3% 39.5% 40.6% 42.4% 33.0% 29.6% 46.8%
Operating expenses* $ 108.2 $ 116.5 $ 131.0 $ 182.1 $ 186.3 $ 182.9 $ 157.5 $150.8 $ 139.8Operating income (loss)* $ 24.0 $ (9.3) $ (60.3) $ 31.6 $ (88.6) $ (89.3) $ (96.8) $ (21.6) $ 47.5Net income (loss)* $ 21.1 $ (12.9) $ (62.8) $ 42.4 $ (84.3) $ (72.6) $ (86.7) $ (11.4) $ 36.6Diluted earnings (loss) per share* $ 0.15 $ (0.09) $ (0.44) $ 0.29 $ (0.60) $ (0.52) $ (0.63) $ (0.08) $ 0.25
Adjusted EBITDA* $ 35.7 $ 5.1 $ (45.7) $ 44.3 $ (73.6) $ (76.8) $ (86.8) $ (9.3) $ 56.7
Headcount 1,254 1,247 1,327 1,552 1,722 1,621 1,483 1,539 1,460
*Non-GAAP metric. See reconciliations in Appendix.

SELECTED BALANCE SHEET METRICS
($ in millions) Q3 2017 Q2 2017 Q1 2017 Q4 2016 Q3 2016 Q2 2016 Q1 2016 Q4 2015 Q3 2015
Cash, cash equivalents andmarketable securities $ 196.6 $ 149.8 $ 74.9 $ 218.0 $ 224.9 $ 279.2 $ 388.7 $ 474.1 $ 513.1
Days sales outstanding 27 29 23 27 35 27 23 30 27
Inventory $ 177.2 $ 126.7 $ 207.7 $ 167.2 $ 145.2 $ 89.9 $ 139.7 $ 188.2 $ 289.5
Annualized inventory turns 5.2.x 4.5x 3.2x 8.4x 4.9x 4.4x 3.0x 5.1x 3.4x
Inventory days 81 60 126 46 92 64 102 55 122

LONG-TERM MODEL
2014 2015 2016 Long-TermModel
GROSS MARGIN %* 45.1% 41.7% 39.3% 39-41%
OPERATING EXPENSES %* 26.5% 33.0% 59.8% 24-26%
OPERATING MARGIN %* 18.6% 8.7% (20.5)% 13-17%
ADJUSTED EBITDA %* 21.0% 11.0% (16.3)% 17-21%
• • • • • • • • • • • • • • • • • • • • • • • • • • • • • • • • • • • • • • • • • • • • • • • • • • • • • • • • • • • • • • • • • • • •
* Non-GAAP metric. See reconciliation in Appendix.

2017 PROGRESS AND GUIDANCE
Q3 2017Actual
Q4 2017 Guidance1
FY2017 Guidance1
• Revenue: $470 million +/- $10 million
• Gross margin: 41.5% +/- 50bps
• Opex: $130 million +/- $1 million
• GAAP EPS: between $0.25 and $0.35
• Non-GAAP EPS: between $0.37 and $0.47
• 37% revenue growth Y/Y
• ASP up 3% Q/Q and 22% Y/Y
• Unit sell-thru up 2% Y/Y2
• Gross margin: 40%
• Opex down $78 million Y/Y
• Adjusted EBITDA: $36 million (up $109 million Y/Y)
• GAAP and non-GAAP profitable
• Revenue of $1.315 billion +/- $10 million
• Opex <$490 million, a >$200 million reduction from 2016
• Non-GAAP EPS: between $(0.02) and $0.08
Source: GoPro Q3 2017 Earnings Release and Call held on 11/1/17Note: References are to non-GAAP financial figures unless otherwise specified; refer to Appendix for applicable reconciliations with GAAP figures1 As of 11/1/172 According to NPD and GfK data


APPENDIX: GAAP TO NON-GAAP RECONCILIATIONS
To supplement our unaudited selected financial data presented on a basis consistent with GAAP, we disclose certain non-GAAP financial measures, including non-GAAP gross margin, operating expenses, operating income (loss), net income (loss), earnings (loss) per share and adjusted EBITDA. These non-GAAP measures are not in accordance with, nor serve as an alternative for GAAP. We believe that these non-GAAP measures have limitations in that they do not reflect all of the amounts associated with our GAAP results of operations. These non-GAAP measures should only be viewed in conjunction with corresponding GAAP measures.
In calculating non-GAAP financial measures, we exclude certain items to facilitate a review of the comparability of our core operating performance on a period-to-period basis. The excluded items represent stock-based compensation and other charges that we do not consider to be directly related to core operating performance. We use non-GAAP measures to evaluate the core operating performance of our business, for comparison with forecasts and strategic plans and for calculating return on investment. In addition, management’s incentive compensation is determined using non-GAAP measures. Since we find these measures to be useful, we believe that investors benefit from seeing results reviewed by management in addition to seeing GAAP results. We believe that these non-GAAP measures, when read in conjunction with our GAAP financials, provide useful information to investors by facilitating:
• the comparability of our on-going operating results over the periods presented;
• the ability to identify trends in our underlying business; and
• the comparison of our operating results against analyst financial models and operating results of other public companies that supplement their GAAP results with non-GAAP financial measures.
APPENDIX: GAAP TO NON-GAAP RECONCILIATIONS
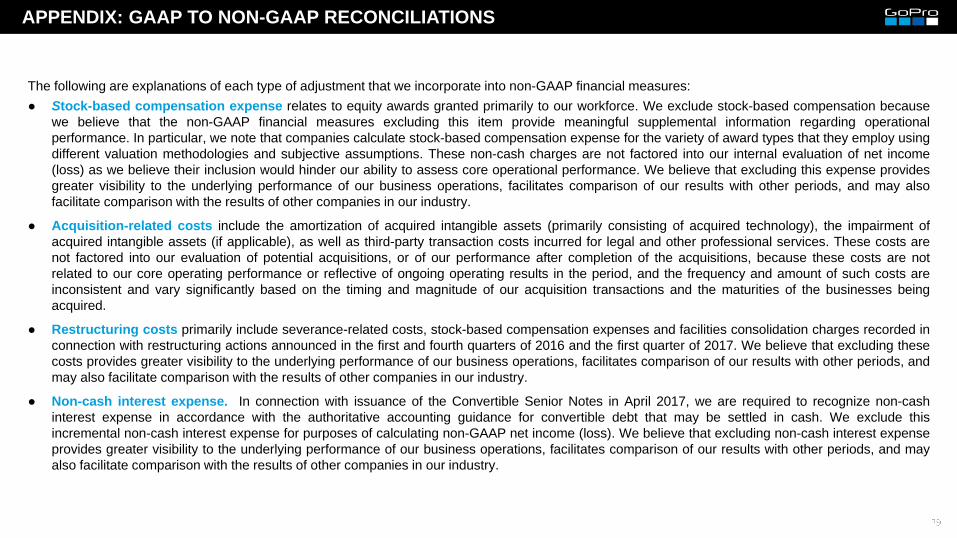
The following are explanations of each type of adjustment that we incorporate into non-GAAP financial measures:● Stock-based compensation expense relates to equity awards granted primarily to our workforce. We exclude stock-based compensation because
we believe that the non-GAAP financial measures excluding this item provide meaningful supplemental information regarding operationalperformance. In particular, we note that companies calculate stock-based compensation expense for the variety of award types that they employ usingdifferent valuation methodologies and subjective assumptions. These non-cash charges are not factored into our internal evaluation of net income(loss) as we believe their inclusion would hinder our ability to assess core operational performance. We believe that excluding this expense providesgreater visibility to the underlying performance of our business operations, facilitates comparison of our results with other periods, and may alsofacilitate comparison with the results of other companies in our industry.
● Acquisition-related costs include the amortization of acquired intangible assets (primarily consisting of acquired technology), the impairment ofacquired intangible assets (if applicable), as well as third-party transaction costs incurred for legal and other professional services. These costs arenot factored into our evaluation of potential acquisitions, or of our performance after completion of the acquisitions, because these costs are notrelated to our core operating performance or reflective of ongoing operating results in the period, and the frequency and amount of such costs areinconsistent and vary significantly based on the timing and magnitude of our acquisition transactions and the maturities of the businesses beingacquired.
● Restructuring costs primarily include severance-related costs, stock-based compensation expenses and facilities consolidation charges recorded inconnection with restructuring actions announced in the first and fourth quarters of 2016 and the first quarter of 2017. We believe that excluding thesecosts provides greater visibility to the underlying performance of our business operations, facilitates comparison of our results with other periods, andmay also facilitate comparison with the results of other companies in our industry.
● Non-cash interest expense. In connection with issuance of the Convertible Senior Notes in April 2017, we are required to recognize non-cashinterest expense in accordance with the authoritative accounting guidance for convertible debt that may be settled in cash. We exclude thisincremental non-cash interest expense for purposes of calculating non-GAAP net income (loss). We believe that excluding non-cash interest expenseprovides greater visibility to the underlying performance of our business operations, facilitates comparison of our results with other periods, and mayalso facilitate comparison with the results of other companies in our industry.
APPENDIX: GAAP TO NON-GAAP RECONCILIATIONS
● Income tax adjustments. Beginning in the first quarter of 2017, we implemented a cash-based non-GAAP tax expense approach (based uponexpected annual cash payments for income taxes) for evaluating operating performance as well as for planning and forecasting purposes. This non-GAAP tax approach eliminates the effects of period specific items, which can vary in size and frequency and does not necessarily reflect our long-termoperations. Historically, we computed a non-GAAP tax rate based on non-GAAP pre-tax income on a quarterly basis, which considered the incometax effects of the adjustments above.
● Adjusted EBITDA excludes the amortization of point-of-purchase (POP) display assets because it is a non-cash charge, and is similar to thedepreciation of property and equipment and amortization of acquired intangible assets.

APPENDIX: GAAP TO NON-GAAP RECONCILIATIONS
(in thousands, except per share data) Q3 2017 Q2 2017 Q1 2017 Q4 2016 Q3 2016 Q2 2016 Q1 2016 Q4 2015 Q3 2015
GAAP net income (loss) $ 14,661 $ (30,536) $ (111,150) $ (115,709) $ (104,068) $ (91,767) $ (107,459) $ (34,451) $ 18,799Stock-based compensation:
Cost of revenue 445 415 495 421 426 412 357 449 410Operating expenses 11,430 10,820 12,630 17,505 18,040 16,992 15,374 17,671 17,460
Total stock-based compensation 11,875 11,235 13,125 17,926 18,466 17,404 15,731 18,120 17,870
Acquisition-related costs:Cost of revenue 1,195 1,195 1,235 1,093 222 222 222 222 222Operating expenses 946 947 1,113 2,607 8,351 2,453 2,176 1,323 1,743
Total acquisition-related costs 2,141 2,142 2,348 3,700 8,573 2,675 2,398 1,545 1,965
Restructuring costs:Cost of revenue 40 25 393 133 — — 364 — —Operating expenses 1,937 2,331 12,062 36,448 — — 6,144 — —
Total restructuring costs 1,977 2,356 12,455 36,581 — — 6,508 — —
Non-cash interest expense 1,836 1,530 — — — — — — —
Income tax adjustments (11,341) 359 20,439 99,869 (7,250) (907) (3,918) 3,390 (2,008)Non-GAAP net income (loss) $ 21,149 $ (12,914) $ (62,783) $ 42,367 $ (84,279) $ (72,595) $ (86,740) $ (11,396) $ 36,626
Weighted-average dilutive shares* 140,288 136,288 142,899 146,261 140,124 138,942 137,543 137,086 146,055
Non-GAAP diluted net income (loss) per share $ 0.15 $ (0.09) $ (0.44) $ 0.29 $ (0.60) $ (0.52) $ (0.63) $ (0.08) $ 0.25
* For all periods presented, weighted-average dilutive shares utilized for computing Non-GAAP net income (loss) per share was equal to GAAP with the exception of Q4 2016. Shares of 146.3 million in Q4 2016 included 5.2 million potentially dilutive common shares that would have been anti-dilutive for computing GAAP net loss per share.

APPENDIX: GAAP TO NON-GAAP RECONCILIATIONS
($ in thousands) Q3 2017 Q2 2017 Q1 2017 Q4 2016 Q3 2016 Q2 2016 Q1 2016 Q4 2015 Q3 2015
GAAP gross margin 39.6% 35.6% 31.4% 39.2% 40.3% 42.1% 32.5% 29.4% 46.6%Stock-based compensation 0.1 0.1 0.2 0.1 0.2 0.2 0.2 0.1 0.1Acquisition-related costs 0.4 0.4 0.6 0.2 0.1 0.1 0.1 0.1 0.1Restructuring costs — 0.1 0.1 — — — 0.2 — —Non-GAAP gross margin 40.1% 36.2% 32.3% 39.5% 40.6% 42.4% 33.0% 29.6% 46.8%
GAAP operating expenses $ 122,497 $ 130,615 $ 156,781 $ 238,703 $ 212,658 $ 202,379 $ 181,149 $ 169,805 $ 158,994Stock-based compensation (11,430) (10,820) (12,630) (17,505) (18,040) (16,992) (15,374) (17,671) (17,460)Acquisition-related costs (946) (947) (1,113) (2,607) (8,351) (2,453) (2,176) (1,323) (1,743)Restructuring costs (1,937) (2,331) (12,062) (36,448) — — (6,144) — —Non-GAAP operating expenses $ 108,184 $ 116,517 $ 130,976 $ 182,143 $ 186,267 $ 182,934 $ 157,455 $ 150,811 $ 139,791
GAAP operating income (loss) $ 8,049 $ (24,983) $ (88,215) $ (26,568) $ (115,589) $ (109,377) $ (121,435) $ (41,294) $ 27,636Stock-based compensation 11,875 11,235 13,125 17,926 18,466 17,404 15,731 18,120 17,870Acquisition-related costs 2,141 2,142 2,348 3,700 8,573 2,675 2,398 1,545 1,965Restructuring costs 1,977 2,356 12,455 36,581 — — 6,508 — —Non-GAAP operating income (loss) $ 24,042 $ (9,250) $ (60,287) $ 31,639 $ (88,550) $ (89,298) $ (96,798) $ (21,629) $ 47,471
APPENDIX: GAAP TO NON-GAAP RECONCILIATIONS
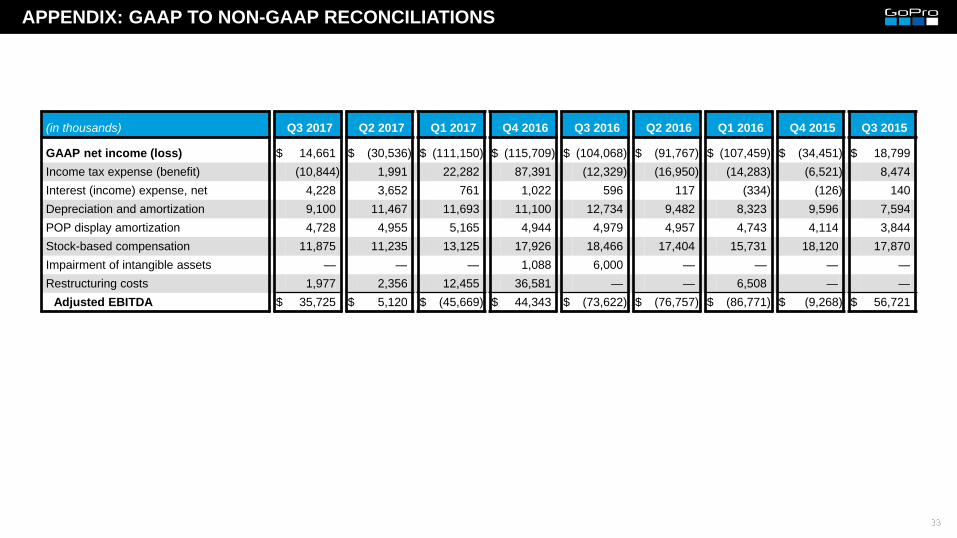
(in thousands) Q3 2017 Q2 2017 Q1 2017 Q4 2016 Q3 2016 Q2 2016 Q1 2016 Q4 2015 Q3 2015
GAAP net income (loss) $ 14,661 $ (30,536) $ (111,150) $ (115,709) $ (104,068) $ (91,767) $ (107,459) $ (34,451) $ 18,799Income tax expense (benefit) (10,844) 1,991 22,282 87,391 (12,329) (16,950) (14,283) (6,521) 8,474Interest (income) expense, net 4,228 3,652 761 1,022 596 117 (334) (126) 140Depreciation and amortization 9,100 11,467 11,693 11,100 12,734 9,482 8,323 9,596 7,594POP display amortization 4,728 4,955 5,165 4,944 4,979 4,957 4,743 4,114 3,844Stock-based compensation 11,875 11,235 13,125 17,926 18,466 17,404 15,731 18,120 17,870Impairment of intangible assets — — — 1,088 6,000 — — — —Restructuring costs 1,977 2,356 12,455 36,581 — — 6,508 — —
Adjusted EBITDA $ 35,725 $ 5,120 $ (45,669) $ 44,343 $ (73,622) $ (76,757) $ (86,771) $ (9,268) $ 56,721