GOVERNMENT OF TRIPURA - agtripura.gov.in · @ Revenue surplus of the Government of Tripura...
21
GOVERNMENT OF TRIPURA SENIOR DEPUTY ACCOUNTANT GENERAL (ACCOUNTS AND ENTITLEMENT) TRIPURA, AGARTALA ACCOUNTS AT A GLANCE 2007-2008
Transcript of GOVERNMENT OF TRIPURA - agtripura.gov.in · @ Revenue surplus of the Government of Tripura...

GOVERNMENT OF TRIPURA
SENIOR DEPUTY ACCOUNTANT GENERAL (ACCOUNTS AND ENTITLEMENT)
TRIPURA, AGARTALA
ACCOUNTS AT A GLANCE 2007-2008

GOVERNMENT OF TRIPURA
ACCOUNTS AT A GLANCE 2007-2008
SENIOR DEPUTY ACCOUNTANT GENERAL (ACCOUNTS AND ENTITLEMENT)
TRIPURA, AGARTALA

PREFACE
This is the tenth issue of our annual publication “Accounts At A Glance”. The Annual Accounts of the State Government are prepared and examined
under the direction of the Comptroller and Auditor General of India (C&AG) in
accordance with the requirements of the Comptroller and Auditor General’s
(Duties, Powers and Conditions of Service) Act, 1971 for being laid before the
Legislature of the State. The Annual Accounts consist of (a) Finance Accounts
and (b) Appropriation Accounts. The Finance Accounts are summary statements
of accounts under the Consolidated Fund, Contingency Fund and the Public
Account. The Appropriation Accounts record the Grant-wise expenditures against
provisions approved by the State Legislature and offer explanations for variations
between the actual expenditure and the funds provided. The office of the Senior
Deputy Accountant General (Accounts and Entitlement) prepares the State
Finance Accounts and the Appropriation Accounts.
The ‘Accounts At A Glance’ provides a broad overview of Governmental
activities, as reflected in the Finance Accounts and the Appropriation Accounts.
The information is presented through brief explanations, statements and graphs.
We look forward to suggestions to help us in improving the publication.
(E. M. PATTON) ACCOUNTANT GENERAL (AUDIT) PLACE : AGARTALA. DATE : 09.12.2008
ii

iii
TABLE OF CONTENTS
Page(s) 1. Preface iii
2. CCHHAAPPTTEERR-- II
Overview 1
Finance Accounts 2
Appropriation Accounts 2
33.. CCHHAAPPTTEERR-- IIII
Highlights of Accounts 3
Receipts and Disbursements 4-6
Trend of Expenditure 7
Debt and Liabilities 8
Investments and Returns 8
Loans and Advances by the State Government 8
Appropriation Accounts 9-10
Submission of Accounts by Treasuries 10
4. CCHHAAPPTTEERR-- IIIIII
Trends in Government Revenue and Expenditure 11-14
Liabilities 14-15
State Provident Fund 15
Guarantees 16
Ways and Means Advances 16
General Cash Balances 17

CHAPTER I
OVERVIEW
The monthly accounts of the State Government are compiled and consolidated from the accounts submitted by the District Treasuries, Public Works and Forest Divisions, etc. Besides, the Finance Accounts and the Appropriation Accounts are prepared annually in accordance with the requirements of the Comptroller and Auditor General’s (Duties, Powers and Conditions of Service) Act, 1971.
The accounts of Government are kept in the following three parts : Part I Consolidated Fund Part II Contingency Fund Part III Public Account
There are two main divisions under the Consolidated Fund :
The Revenue division (Revenue Account) deals with the proceeds of taxation and other receipts and the expenditure met therefrom, the net result of which represents the revenue surplus or deficit for the year.
In the Capital division, the section ‘Receipt Heads (Capital Account)’ deals with receipts of capital nature. The section ‘Expenditure Heads (Capital Account)’ deals with expenditure met usually from borrowed funds with the object of increasing assets of material and permanent character. It also includes receipts of capital nature intended to be applied as set-off to capital expenditure. The section ‘Public Debt, Loans and Advances, etc.’ comprises loans raised and their repayments by Government such as ‘Internal Debt’ and ‘Loans and Advances’ made (and their recoveries) by Government.
In the Contingency Fund, the transaction connected with Contingency Fund, established under Article 267 of the Constitution of India, are recorded.
In the Public Account, the transactions relating to ‘Debt’ (other than those included in Part I), ‘Deposits’, ‘Advances’, ‘Remittances’ and ‘Suspense’ are recorded. Annual Accounts of the Government of Tripura for the year 2007-2008 were presented to the State Legislature on 25.11.2008.
1

Finance Accounts
The Finance Accounts present the accounts of receipts and disbursements of the Government for the year, together with the financial results disclosed by the revenue and capital accounts, and the accounts of the public debts and of the liabilities and assets.
In 2007-08, the total receipts amounted to Rs. 3717.62 crore comprising Rs. 3662.15# crore revenue receipts (Rs. 1021.32* crore Tax revenue, Rs. 79.22# crore Non-Tax Revenue and Rs.2561.61 crore Grants- in- Aid and Contributions) and Rs. 55.47 crore capital receipts. Total disbursements during the year amounted to Rs. 3717.62 crore comprising Rs. 2793.64 crore (75.15%) on revenue account and Rs. 923.98 crore (24.85%) on capital account including loans and advances disbursed. Appropriation Accounts
The Appropriation Accounts bring out the expenditure of the State Government against amounts voted and charged by the State Legislature and supplement the Finance Accounts. These comprise accounts of 2 Grants (charged), 11 Grants (both charged and voted) and 43 Grants (voted).
Appropriation Accounts 2007-08 show disbursements of Rs. 4015.26 crore against the aggregate budget provision of Rs. 5191.01 crore, resulting in savings of Rs. 1175.75 crore. The major savings occurred under the following :
(i) 281.24 crore (23.92%) under Finance Department (ii) 219.96 crore (18.71%) under Tribal Welfare Department (iii) 118.46 crore (10.08%) under Planning & Co-ordination Department (iv) 104.95 crore (8.93%) under Welfare of SC Department (v) 81.73 crore (6.95%) under Education (School) Department (vi) 56.78 crore (4.83%) under Public Works (R & B) Department (vii) 38.78 crore (3.30%) under Home (Police) Department (viii) 38.64 crore (3.28%) under Health Department (ix) 32.13 crore (2.73%) under Rural Development Department. (x) 22.59 crore (1.92%) under Public Works (W. R) Department
Recoveries in reduction of expenditure amounted to Rs.180.72 crore reflecting a
decrease of Rs.9.28 crore vis-à-vis budget estimates of Rs.190.00 crore. * Includes Rs.650.62 crore as State’s share of Union Taxes/Duties. # Non-Tax revenue of the Government of Tripura is understated by Rs. 36.19 crore (the amount of interest on 91 days Treasury Bills) and that it could not be incorporated due to late receipt of information from the RBI.
2

CHAPTER II HIGHLIGHTS OF ACCOUNTS
(Rupees in crore) Sl. No.
B.E. 2007-2008
Actual Percentage of Actuals to
B.E.
Percentage of Actuals to
GSDP# 1. Tax Revenue 1032.45 1021.32 98.92 11.98 2. Non-Tax Revenue 111.41 ^79.22 71.11 0.93 3. Grants-in-aid &
Contributions 2478.59 2561.61 103.35 30.06
4. Revenue Receipts (1+2+3)
3622.45 ^3662.15 101.10 42.97
5. Recovery of Loans & Advances
3.00 3.27 109.00 0.04
6. Other Receipts 0 0 0 0 7. Borrowings & Other
Liabilities* 536.12 52.20 9.74 0.61
8. Capital Receipts (5+6+7)
539.12 55.47 10.29 0.65
9. Total Receipts (4+8) 4161.57 3717.62 89.33 43.63 10. Non-Plan Expenditure
(NPE)(11 + 13) 2418.64 2293.45 94.82 26.91
11. NPE on Revenue Account
2326.60 2217.25 95.30 26.02
12. NPE on Interest Payments out of 11
389.28 395.76 101.66 4.64
13. NPE on Capital Account 92.01 76.20 82.82 0.89 14. Plan Expenditure (PE) 1742.93 1424.17 81.71 16.71 15. PE on Revenue Account 631.78 576.39 91.23 6.76 16. PE on Capital Account 1111.15 847.78 76.30 9.95 17. Total Expenditure
(10+14) 4161.57 3717.62 89.33 43.63
18. Revenue Expenditure (11+15)
2958.38 2793.64 94.43 32.78
19. Capital Expenditure (13+16)
**1203.16 ***923.98 76.80 10.84
20. Revenue Surplus (4-18 )
664.07 @ 868.51 130.79 10.19
21. Fiscal Surplus /Deficit (4+5+6-17)
(-) 536.12 (&) (-) 52.20 9.74 0.61
# Based on information furnished by the State Government. Since the previous Reports used projected G.S.D.P some of the aggregates, ratios and conclusions in this Accounts at a Glance may not agree with those in the previous Accounts at a Glance. * Borrowings and Other Liabilities include net of the Public Debt excluding temporary loans (net under Minor Head 107-Loans from SBI & other Banks below Major Head 6003) plus net of Contingency Fund plus net of Public Account plus net of opening and closing Cash Balance. ** Consists of Capital Expenditure (Rs.1200.81 crore) and Loans and Advances (Rs.2.35 crore). *** Consists of Capital Expenditure (Rs.923.68 crore) and Loans and Advances disbursed (Rs.0.30 crore). ^ Non-Tax revenue of the Government of Tripura is understated by Rs. 36.19 crore (the amount of interest on 91 days Treasury Bills) and that it could not be incorporated due to late receipt of information from the RBI. @ Revenue surplus of the Government of Tripura understated by Rs. 36.19 crore (the amount of interest on 91 days Treasury Bills) and that it could not be incorporated due to late receipt of information from the RBI. (&) Fiscal deficit of the Government of Tripura overstated by Rs. 36.19 crore (the amount of interest on 91 days Treasury Bills) and that it could not be incorporated due to late receipt of information from the RBI.
3

Receipts and Disbursements
Total receipts during the year were Rs.3717.62 crore, against which total disbursement were Rs.3717.62 crore. The following table summarises the Accounts for 2007-08:
(Rupees in crore) Total Receipts 3717.62 Total Disbursements 3717.62 Revenue Receipts 3662.15 Revenue Disbursements 2793.64 Capital Receipts 55.47 Capital Disbursements 923.98 RECEIPTS
TOTAL RECEIPTS
99%
1%
Revenue Receipts Capital Receipts
TOTAL DISBURSEMENTS
25%
75%
Revenue Disbursements Capital Disbursements
Revenue Receipts
Gross Tax Revenue of Rs. 1021.32 crore and Non-Tax Revenue of Rs. 79.22 crore formed 11.98 per cent and 0.93 per cent respectively of the GSDP. Major contributor to the revenue (Rs. 2561.61 crore) was Grants-in-Aid from Central Government.
Non-tax receipts during the year were lower than the budget estimates by Rs. 32.19 crore.
Shares of various tax, non-tax revenue and grants-in-aid and contributions to total revenue receipts are given below:
Revenue Receipts and Grants in Aid and Contributions (Rupees in crore)
Components Actuals Percentage to total Revenue Receipts
A. Tax Revenue 1021.32 27.89 Taxes on Income and Expenditure* 368.98 10.07 Taxes on Property and Capital Transactions @ 18.20 0.50 Taxes on Commodities and Services # 634.14 17.32 B. Non-tax Revenue 79.22 2.16 Fiscal Services** … … Interest Receipts, Dividends and Profits 23.00 0.63 General Services 25.70 0.70 Social Services 6.91 0.19 Economic Services 23.60 0.64 C. Grants-in-aid and Contributions 2561.61 69.95 TOTAL-REVENUE RECEIPTS 3662.15 100.00 _____________________________________________________________________ * Includes net share of Taxes on Income and Expenditure received from Union Govt. Rs. 345.12 crore. ** The figure is ignored due to rounding. @ Includes State’s share of Taxes on wealth received from Union Govt. Rs. 0.23 crore. # Includes State’s share of Union Taxes received from Union Govt. Rs. 305.27 crore.
4

The Pie Chart below shows the share of Tax Revenue, Non-Tax Revenue and Grants-in-Aid and Contributions to total Revenue Receipts:
TOTAL REVENUE RECEIPTS
70%
2% 28%
Tax Revenue
Non-tax Revenue
Grants-in-aid andContributions
Capital Receipts
Compared to the budget estimate of Rs.536.12 crore, the actual receipts were Rs. 52.20 crore resulting in an overall decrease of Rs.483.92 crore. This was mainly under Borrowings and Other Liabilities.
DISBURSEMENTS Revenue Disbursements
Revenue Disbursement fell short of the budget estimates by Rs. 164.74 crore (Rs. 55.39 crore under plan and Rs. 109.35 crore under non-plan). Capital Disbursements
Capital Disbursements fell short of budget estimates by Rs. 279.18 crore (Rs. 263.37 crore under plan and Rs.15.81 crore under non-plan).
Plan Disbursements
During the year, Plan Disbursements amounted to Rs. 1424.17 crore (Rs 576.39 crore under Revenue and Rs. 847.78 crore under Capital). Non-Plan Disbursements
Non-plan Disbursements during 2007-08 were Rs.2293.45 crore (Rs. 2217.25 crore under Revenue and Rs. 76.20 crore under Capital including loan disbursed).
Plan and Non-Plan Disbursements
38%
62%
Non-PlanPlan
5

Distribution of expenditure among various sectors is given below:
SECTORAL DISTRIBUTION OF EXPENDITURE AND ITS PERCENTAGE TO TOTAL REVENUE EXPENDITURE
(Rupees in crore) Components Amount
Percentage to Total
Revenue Expenditure A. Fiscal Services 19.92 0.71
i) Collection of Taxes on Income and Expenditure 0.17 0.01 ii) Collection of Taxes on Property and Capital transactions
13.66 0.49
iii) Collection of Taxes on Commodities and Services 5.08 0.18 iv) Other Fiscal Services 1.01 0.03 B. Organs of State 47.53 1.70 C. Interest Payments and Servicing of debt 435.76 15.60 D. Administrative Services 494.14 17.68 E. Pensions and Miscellaneous General Services 315.30 11.29 F. Social Services 943.00 33.76 G. Economic Services 473.82 16.96 H. Grants-in-aid and Contributions 64.17 2.30 TOTAL EXPENDITURE (REVENUE ACCOUNT) 2793.64 100
COMPOSITION OF REVENUE EXPENDITURE
16%
18%
11%33%
17%
2%1%
2%
Fiscal Services Organs of StateInterest Payments and Servicing of debt Administrative ServicesPensions and M iscellaneous General Services Social ServicesEconomic Services Grants-in-aid and Contributions
6

TREND OF EXPENDITURE Trend of expenditure in some important sectors during 2003-04 to 2007-08 was as follows :
EXPENDITURE IN SELECTED SECTORS COMPARED TO BUDGET AND REVISED ESTIMATES
(Rupees in crore) Sector 2003-
2004 % to BE
% to RE
2004- 2005
% to BE
% to RE
2005- 2006
% to BE
% to RE
2006- 2007
% to BE
% to RE
2007- 2008
% to BE
% to RE
A. Social Services
i) Education, Sports, Art and Culture
480.09 94.13 95.62 503.01 96.50 99.20 463.06 84.61 86.00 498.62 85.40 93.90 523.07 89.15 96.90
ii) Health & Family Welfare
86.43 95.33 93.30 93.19 96.48 95.26 98.35 88.06 91.50 112.36 94.05 92.65 117.96 85.39 80.59
B. Economic Services
i) Agriculture and Allied Activities
129.46 95.81 94.78 129.01 92.88 97.96 154.23 102.23 94.26 176.95 94.26 90.58 217.15 95.80 96.85
ii) Rural Development
65.54 87.51 99.54 72.09 96.24 96.49 74.17 95.15 85.76 86.16 94.41 92.85 91.06 98.44 89.55
iii) Irrigation & Flood Control
21.33 87.92 93.35 11.42 47.72 47.96 24.29 94.40 95.93 20.08 74.93 72.89 16.78 54.50 71.31
iv) Transport 26.91 234 193.60 17.36 183.70 181.40 58.33 141.41 145.10 74.05 128.47 114.50 79.64 109.67 96.37 v) General Economic Services
7.49 86.09 90.46 8.41 97.68 93.65 11.67 101.04 88.54 12.69 78.14 90.71 15.60 87.83 93.64
E xp en d itu re in S e lected S ecto r u n d er S o cia l S erv ices
0
100
200
300
400
500
600
200 3 -20 04 2004 -2005 2 005 -2 006 2006 -200 7 2007 -2008
(Rup
ees
in C
rore
)
E d u ca tio n
H e a lth
Exp e n d itu r e in Se le cte d Se cto r s u n d e r Eco n o m ic Se r vice s
0
50
100
150
200
250
2003-2004 2004-2005 2005-2006 2006-2007 2007-2008
A gric uture and A llied A c itiv ities
Rural Dev elopment
Trans portIr r igation & Flood Control
General Ec onomic Serv ic es
7

DEBTS AND LIABILITIES
Outstanding Public Debt at the end of 2007-08 was Rs. 3067.97 crore, comprising internal debt of Rs. 2542.27 crore and loans and advances from Central Government Rs. 525.70 crore. The other liabilities under Public Account at the end of 2007-08 amounted to Rs. 1667.34 crore.
The State also acts as a banker and trustee in respect of deposits like small savings collections, provident funds and deposits. There was an overall increase of Rs 112.06 crore in respect of such liabilities during 2007-08.
Interest payments on debt and other liabilities totalling Rs. 395.76 crore constituted 14.17 percent of revenue expenditure. Interest payments on Public Debts were Rs. 286.44 crore (Other Internal debt Rs. 34.44 crore, loans and advances from Central Governments Rs. 45.00 crore and Rs. 207.00 crore on other liabilities). Expenditure on account of interest payments increased by Rs. 7.59 crore during 2007-08.
Against internal debt of Rs. 46.80 crore raised during the year 2007-08, Rs. 88.88 crore was utilised for discharge of debt obligations.
INVESTMENTS AND RETURNS
Total investments as share capital in non-financial Public Sector Undertakings (PSU) stood at Rs. 519.06 crore at the end of 2007-08. Dividends received during the year were Rs 0.27 crore. During 2007-08 investments in PSUs increased by Rs. 122.81 crore.
LOANS AND ADVANCES BY THE STATE GOVERNMENT
Total loans and advances made by the State Government at the end of 2007-08 amounted to Rs. 55.73 crore. During the year the principal amount of Rs. 3.27 crore was recovered. The information regarding arrears in interest at the end of 31st March 2008 was not received from the Government.
Financial assistance to local bodies and others
Assistance to local bodies and others during 2007-08 amounted to Rs.146.27 crore as compared to Rs.132.95 crore in 2003-04, showing 10.02 per cent increase. Zilla Parisadhs, Urban Local Bodies, Agartala and Panchayati Raj Institutions consumed the major portion of the total grant during the five years from 2003-04 to 2007-08.
Commitments on account of incomplete Capital Works
As on 31st March 2008, there were 212 incomplete projects costing Rs.25 lakh and above involving sanctioned amount of Rs. 413.08 crore, against which expenditure of Rs. 213.05 crore was incurred.
8
APPROPRIATION ACCOUNTS
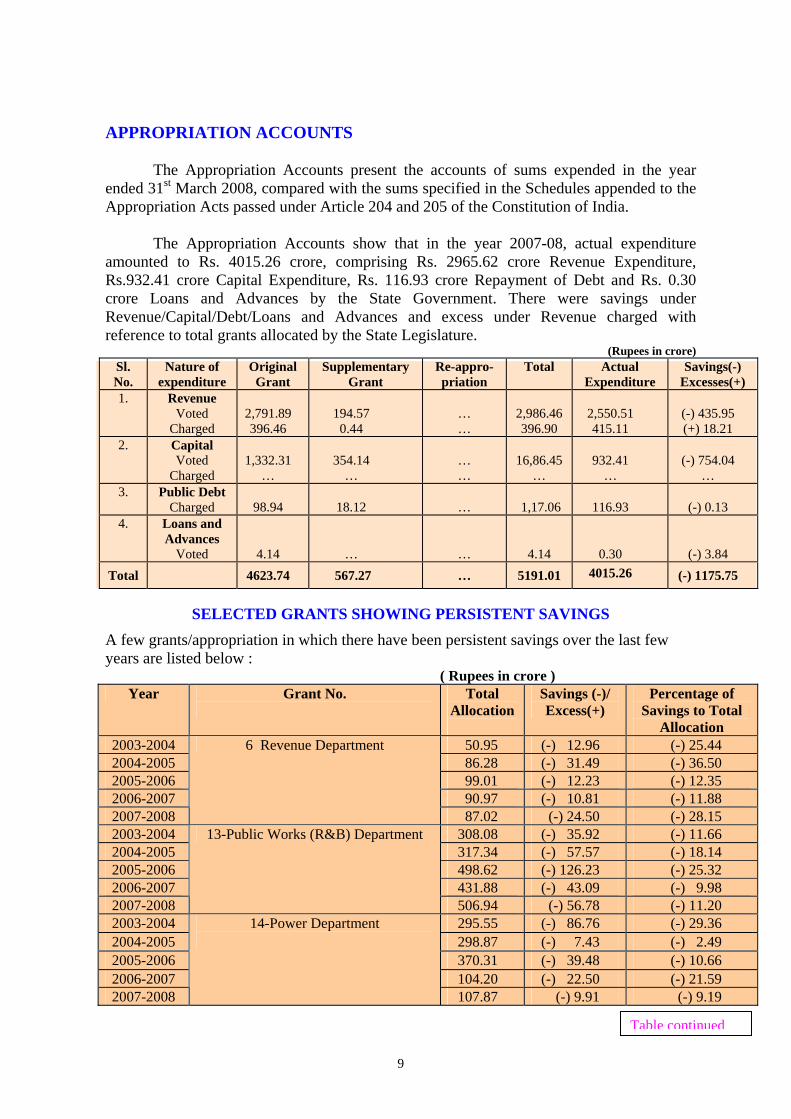
The Appropriation Accounts present the accounts of sums expended in the year ended 31st March 2008, compared with the sums specified in the Schedules appended to the Appropriation Acts passed under Article 204 and 205 of the Constitution of India.
The Appropriation Accounts show that in the year 2007-08, actual expenditure
amounted to Rs. 4015.26 crore, comprising Rs. 2965.62 crore Revenue Expenditure, Rs.932.41 crore Capital Expenditure, Rs. 116.93 crore Repayment of Debt and Rs. 0.30 crore Loans and Advances by the State Government. There were savings under Revenue/Capital/Debt/Loans and Advances and excess under Revenue charged with reference to total grants allocated by the State Legislature.
(Rupees in crore) Sl. No.
Nature of expenditure
Original Grant
Supplementary Grant
Re-appro-priation
Total Actual Expenditure
Savings(-) Excesses(+)
1. Revenue Voted
Charged 2,791.89 396.46
194.57 0.44
… …
2,986.46 396.90
2,550.51 415.11
(-) 435.95 (+) 18.21
2. Capital Voted
Charged 1,332.31
… 354.14
… … …
16,86.45 …
932.41 …
(-) 754.04 …
3. Public Debt Charged 98.94 18.12 … 1,17.06 116.93 (-) 0.13
4. Loans and Advances
Voted 4.14 … … 4.14 0.30 (-) 3.84 Total 4623.74 567.27 … 5191.01 4015.26 (-) 1175.75
SELECTED GRANTS SHOWING PERSISTENT SAVINGS
A few grants/appropriation in which there have been persistent savings over the last few years are listed below :
( Rupees in crore ) Year Grant No.
Total
Allocation
Savings (-)/ Excess(+)
Percentage of Savings to Total
Allocation 2003-2004 50.95 (-) 12.96 (-) 25.44 2004-2005 86.28 (-) 31.49 (-) 36.50 2005-2006 99.01 (-) 12.23 (-) 12.35 2006-2007 90.97 (-) 10.81 (-) 11.88 2007-2008
6 Revenue Department
87.02 (-) 24.50 (-) 28.15 2003-2004 308.08 (-) 35.92 (-) 11.66 2004-2005 317.34 (-) 57.57 (-) 18.14 2005-2006 498.62 (-) 126.23 (-) 25.32 2006-2007 431.88 (-) 43.09 (-) 9.98 2007-2008
13-Public Works (R&B) Department
506.94 (-) 56.78 (-) 11.20 2003-2004 295.55 (-) 86.76 (-) 29.36 2004-2005 298.87 (-) 7.43 (-) 2.49 2005-2006 370.31 (-) 39.48 (-) 10.66 2006-2007 104.20 (-) 22.50 (-) 21.59 2007-2008
14-Power Department
107.87 (-) 9.91 (-) 9.19 Table continued
9

Year Grant No.
Total Allocation (Rupees in
crore)
Savings (-)/ Excess (+)
Percentage of Savings to
Total Allocation
2003-2004 76.65 (-) 13.68 (-) 17.85 2004-2005 71.75 (-) 24.24 (-) 33.78 2005-2006 83.65 (-) 07.51 (-) 8.97 2006-2007 109.53 (-) 13.57 (-) 12.39 2007-2008
15-Public Works (W.R.) Department
104.26 (-) 22.59 (-) 21.67 2003-2004 199.62 (-) 39.73 (-) 19.90 2004-2005 254.78 (-) 72.37 (-) 28.40 2005-2006 371.87 (-) 115.53 (-) 31.07 2006-2007 508.11 (-) 170.98 (-) 33.65 2007-2008
19 Tribal Welfare Department
638.10 (-) 219.96 (-) 34.47 2003-2004 78.39 (-) 21.82 (-) 27.84 2004-2005 89.36 (-) 30.02 (-) 33.59 2005-2006 152.91 (-) 62.46 (-) 40.85 2006-2007 222.61 (-) 105.79 (-) 47.52 2007-2008
20 Welfare of Scheduled Castes Department
278.96 (-) 104.95 (-) 37.62 2003-2004 62.43 (-) 31.30 (-) 50.14 2004-2005 63.42 (-) 43.20 (-) 68.12 2005-2006 12.89 (-) 0.97 (-) 7.53 2006-2007 13.03 (-) 0.68 (-) 5.22 2007-2008
21 Food and Civil Supplies Department
15.19 (-) 0.88 (-) 5.79 2003-2004 105.26 (-) 101.03 (-) 95.98 2004-2005 45.24 (-) 31.80 (-) 70.29 2005-2006 58.23 (-) 43.26 (-) 74.29 2006-2007 63.33 (-) 47.52 (-) 75.04 2007-2008
34 Planning and Co-ordination Department
134.83 (-) 118.46 (-) 87.86
SUBMISSION OF ACCOUNTS BY TREASURIES
The monthly accounts are required to be submitted by the Treasury Officers to the Office of the Senior Deputy Accountant General (A&E) by 10th of the following month. Significant delays occurred in submission of monthly accounts by the following treasuries :
Sl.No. Name of Treasuries Month of A/C Due date Delay in days
1. Agartala Treasury No.I 4/2007 to 3/2008 10th of the following month 07to 73 2. Agartala Treasury No.II -do- -do- 18 to 49 3. Udaipur -do- -do- 04 to 37 4. Kailashahar -do- -do- 02 to 51 5. Dhalai -do- -do- 09 to 37
10

CHAPTER III
TRENDS IN GOVERNMENT REVENUE AND EXPENDITURE
Trends in Government Revenue Receipts and Expenditure from 2003-04 to 2007-08 are given below:
Revenue Receipts
(Rupees in crore)
Year Tax Revenue
(TR)
Non-Tax Revenue (NTR)
Grants-in-aid and
Contributions
Gross Revenue Receipts (GRR)
GSDP@ % of TR to GSDP
% of NTR to GSDP
% of GRR to GSDP
2003-2004 542.00 167.78 1457.88 2167.66 6135.70 8.83 2.73 35.33
2004-2005 622.75 176.85 1777.30 2576.90 6639.24 9.38 2.66 38.81
2005-2006 700.47 63.62 2260.03 3024.12 7296.61 9.60 0.87 41.45
2006-2007 857.33 94.97 2381.06 3333.36 7888.98 10.87 1.20 42.25
2007-2008 1021.32 * 79.22 # 2561.61 3662.15 # 8521.68 11.98 0.93 42.97
Tax Revenue Receipts, Non-Tax Revenue Receipts and Gross Revenue Receipts as a percentage of GSDP for the past five years is depicted graphically below:-
TREND OF REVENUE RECEIPTS
0
5
10
15
20
25
30
35
40
45
50
2003-2004 2004-2005 2005-2006 2006-2007 2007-2008
% o
f Rev
enue
Rec
eipt
s to
GSD
P % of GRR to GSDP
% of TR to GSDP
% of NTR to GSDP
@ Based on information furnished by the State Government. Since the previous Reports used projected G.S.D.P some of the aggregates, ratios and conclusions in this Accounts at a Glance may not agree with those in the previous Accounts at a Glance. * Includes Rs.650.62 crore as State’s share of Union Taxes/Duties.
# Non-Tax revenue of the Government of Tripura is understated by Rs. 36.19 crore (the amount of interest on 91 days Treasury Bills) and that it could not be incorporated due to late receipt of information from the RBI.
11

Revenue and Capital Expenditure
(Rupees in crore)
Percentage increase over the previous year (2003-04 to
2007-08)
Year Revenue Expendi-ture (RE) (Actuals)
Capital Expendi-ture (CE) (Actuals)
Total Expenditure (TE)
GSDP#
Revenue Expenditure (RE)
Total Expenditure (TE)
GSDP
% of RE to GSDP
% of CE to GSDP
% of TE to GSDP
2003-2004 2062.93 449.81 2512.74 6135.70 5.21 4.18 5.64 33.62 7.33 40.95
2004-2005 2182.63 638.55 2821.18 6639.24 5.80 12.28 8.21 32.87 9.62 42.49
2005-2006 2391.79 746.29 3138.08 7296.61 9.58 11.23 9.90 32.78 10.23 43.01
2006-2007 2482.56 723.13 3205.69 7888.98 3.80 2.15 8.12 31.47 9.17 40.64
2007-2008 2793.64 923.98 3717.62 8521.68 12.53 15.97 8.02 32.78 10.84 43.63
Government Revenue Expenditure as a percentage of GSDP for the past five years is
depicted graphically below :-
TREND OF EXPENDITURE
05
101520253035404550
2003-2004 2004-2005 2005-2006 2006-2007 2007-2008% o
f Gov
ernm
ent E
xpen
ditu
re to
GSD
P
% of TE to GSDP
% of RE to GSDP
% of CE to GSDP
# Based on information furnished by the State Government. Since the previous Reports used projected G.S.D.P some of the aggregates, ratios and conclusions in this Accounts at a Glance may not agree with those in the previous Accounts at a Glance.
12
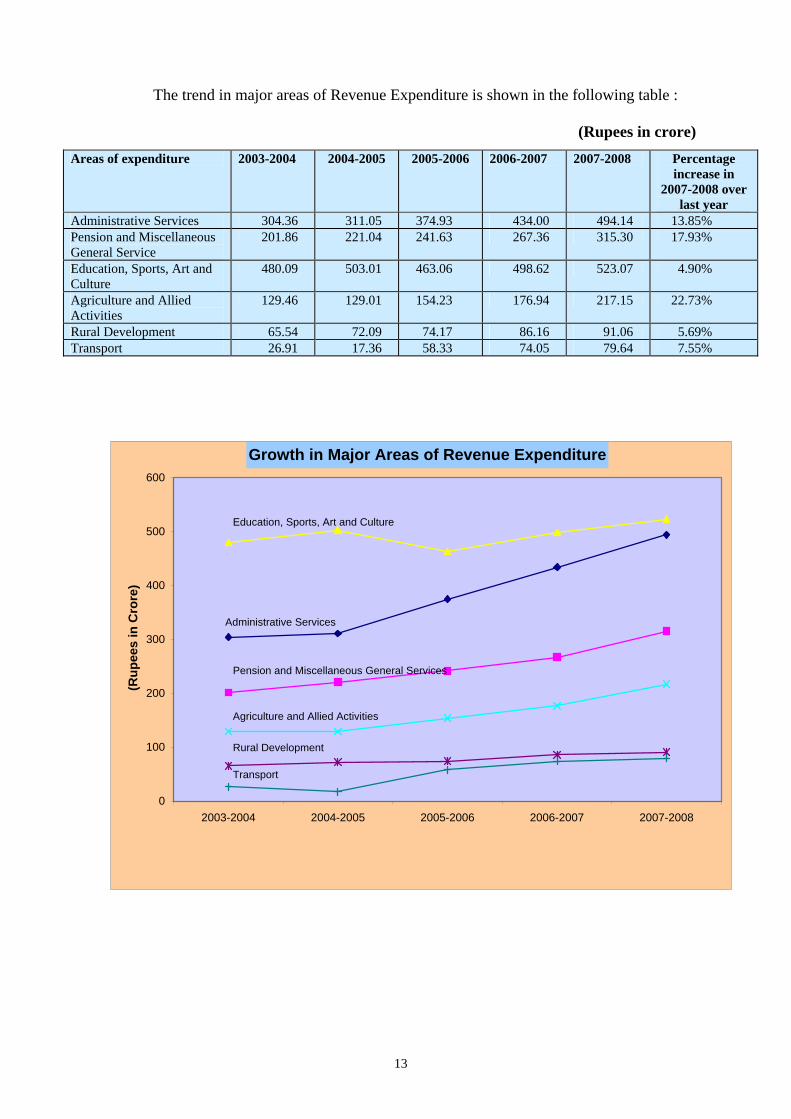
The trend in major areas of Revenue Expenditure is shown in the following table :
(Rupees in crore)
Areas of expenditure 2003-2004 2004-2005 2005-2006 2006-2007 2007-2008 Percentage increase in
2007-2008 over last year
Administrative Services 304.36 311.05 374.93 434.00 494.14 13.85% Pension and Miscellaneous General Service
201.86 221.04 241.63 267.36 315.30 17.93%
Education, Sports, Art and Culture
480.09 503.01 463.06 498.62 523.07 4.90%
Agriculture and Allied Activities
129.46 129.01 154.23 176.94 217.15 22.73%
Rural Development 65.54 72.09 74.17 86.16 91.06 5.69% Transport 26.91 17.36 58.33 74.05 79.64 7.55%
Growth in Major Areas of Revenue Expenditure
0
100
200
300
400
500
600
2003-2004 2004-2005 2005-2006 2006-2007 2007-2008
(Rup
ees
in C
rore
)
Education, Sports, Art and Culture
Administrative Services
Pension and Miscellaneous General Services
Agriculture and Allied Activities
Rural Development
Transport
13

Government Account
The total expenditure (Revenue and Capital) for the year is netted against total
receipts (Revenue and non-debt Capital receipts) and the surplus/deficit is transferred to a
separate ledger called “Government Account”. In addition, the net effects of Prior Period
Adjustments, Miscellaneous Government Accounts, etc. are also transferred to the ledger
“Government Accounts”, which represents the cumulative surplus/deficit of the operations
of the Government.
The details of the ledger “Government Account” for the past five years are given below :
(Rupees in crore)
Year Revenue Heads
Capital Heads
Other Heads
(*)
Deficit(-)/ surplus (+) for
the year
Cumula- tive deficit at the end of the year
Receipts Disburs- ements
Deficit(-)/ surplus(+)
Recei- pts
Disbur- sements
Deficit(-)/ surplus(+)
Deficit(-) surplus(+)
2003-04 2167.66 2062.93 (+) 104.73 ... 449.81 (-) 449.81 ... (-) 345.08 (-) 3419.67
2004-05 2576.90 2182.63 (+) 394.27 … 638.55 (-) 638.55 … (-) 244.28 (-)3663.95
2005-06 3024.12 2391.79 (+) 632.33 113.96 746.29 (-) 632.33 .... NIL (-) 3663.95
2006-07 3333.36 2482.56 (+) 850.80 134.71 723.13 (-) 588.42 … (+)262.38 (-) 3401.57
2007-08 3662.15** 2793.64 (+) 868.51# 55.47 923.98(&) (-) 868.51 … Nil (-) 3401.57
LIABILITIES Liabilities of the State Government increased by Rs.1173.65crore from Rs 3561.66 crore in
2003-04 to Rs. 4735.31 crore during 2007-08. The Public debt comprising internal debt of
the State Government and loans and advances from the Central Government increased by
Rs. 1241.72 crore, from Rs. 1826.25 crore in 2003-04 to Rs. 3067.97 crore at the end of the
2007-08. Article 293 of the Constitution of India empowers the State Government to borrow
on the security of the Consolidated Fund of the State within such limits, as may be fixed by
the State Legislature. Details of the Public Debt and total liabilities of the State Government
are as follows :
_______________________________________________________________________
* Miscellaneous Government Accounts. ** Non-Tax revenue of the Government of Tripura is under stated by Rs. 36.19 crore (the amount of interest on 91 days Treasury Bills) and that it could not be incorporated due to late receipt of information from the RBI. # Revenue surplus of the Government of Tripura understated by Rs. 36.19 crore (the amount of interest on 91 days Treasury Bills) and that it could not be incorporated due to late receipt of information from the RBI. (&) Expenditure on Capital Account consists of Capital Expenditure (Rs.923.68 crore) and Loans and Advances disbursed (Rs.0.30crore) for actual figure.
14

(Rupees in crore)
Year Internal Debt
Loans and Advances
from Central Govt.
Total Public Debt
Small Savings
Provi-dent
Funds & other
Accounts
Other Oblig- ations
Total Liabi- lities*
GSDP# % of total
liability to GSDP
2003-2004 1213.99 612.26 1826.25 577.95 1067.35 90.11 3561.66 6135.70 58.05
2004-2005 1441.90 592.49 2034.39 774.00 1231.26 122.18 4161.83 6639.24 62.69
2005-2006 1443.67 572.36 2016.03 969.22 1301.96 119.42 4406.63 7296.61 60.39
2006-2007 2563.97 550.46 3114.43 NIL 1372.27 139.38 4626.08 7888.98 58.64
2007-2008 2542.27 525.70 3067.97 - 1429.45 237.89 4735.31 8521.68 55.57
Growth of Public Debt and Total Liabilities
0500
100015002000250030003500400045005000
2003-2004 2004-2005 2005-2006 2006-2007 2007-2008
(Rup
ees
in C
rore
) Liabilities
Public Debt
STATE PROVIDENT FUND
The details of transactions from the State Provident Fund are shown in the following table:
(Rupees in crore)
Year Opening Balance
Receipts Payments Net Accretion
for the year
Closing Balance
Interest charged on
balance of P.F. 2003-2004 959.44 366.48 258.56 107.92 1067.36 79.88
2004-2005 1067.35 440.65 276.74 163.91 1231.26 87.00
2005-2006 1231.26 371.94 301.23 70.71 1301.96 99.15
2006-2007 1301.96 376.39 318.19 58.20 1360.17 103.79
2007-2008 1360.17 396.19 336.98 59.21 1419.38 109.32
__________________________________________________________________________ * Small savings, Provident Funds, Non-interest bearing obligations such as deposits of Local Funds, Civil Deposits,
other Earmarked funds , etc. # Based on information furnished by the State Government. Since the previous Reports used projected G.S.D.P some of
the aggregates, ratios and conclusions in this Accounts at a Glance may not agree with those in the previous Accounts at a Glance.
15

GUARANTEES
The position of guarantees by the State Government for the loans and capital raised
by Statutory Corporations, Government companies, Corporations, Co-operative Societies,
etc. is given below:
(Rupees in crore)
Amount outstanding At the end of the year Amount Guaranteed (Principal only)
Principal Interest
2003-2004 64.83 41.40 1.95
2004-2005 66.10 40.18 4.71
2005-2006 65.37 40.41 6.57
2006-2007 67.96 37.51 3.38
2007-2008 74.66 32.75 2.89
WAYS AND MEANS ADVANCES
The State Government is required to maintain with the Reserve Bank of India a
minimum cash balance of Rs.10.00 lakh on all days. In case of failure to do so, the Reserve
Bank provides Ways and Means Advances (WMA) and Overdraft facility to help the State
Government tide over the liquidity problem. The details of WMA and overdraft facility
availed of by the State Government over the last 5 years are given below :
2003-2004 2004-2005 2005-2006 2006-2007 2007-2008
i) Number of days on which minimum balance was maintained a) Without obtaining any advance
342
333
365
365
365
b) By obtaining Ways and Means Advance
24
32
NIL
NIL
NIL
ii) Number of days on which overdraft was taken
NIL
NIL
NIL
NIL
NIL
16
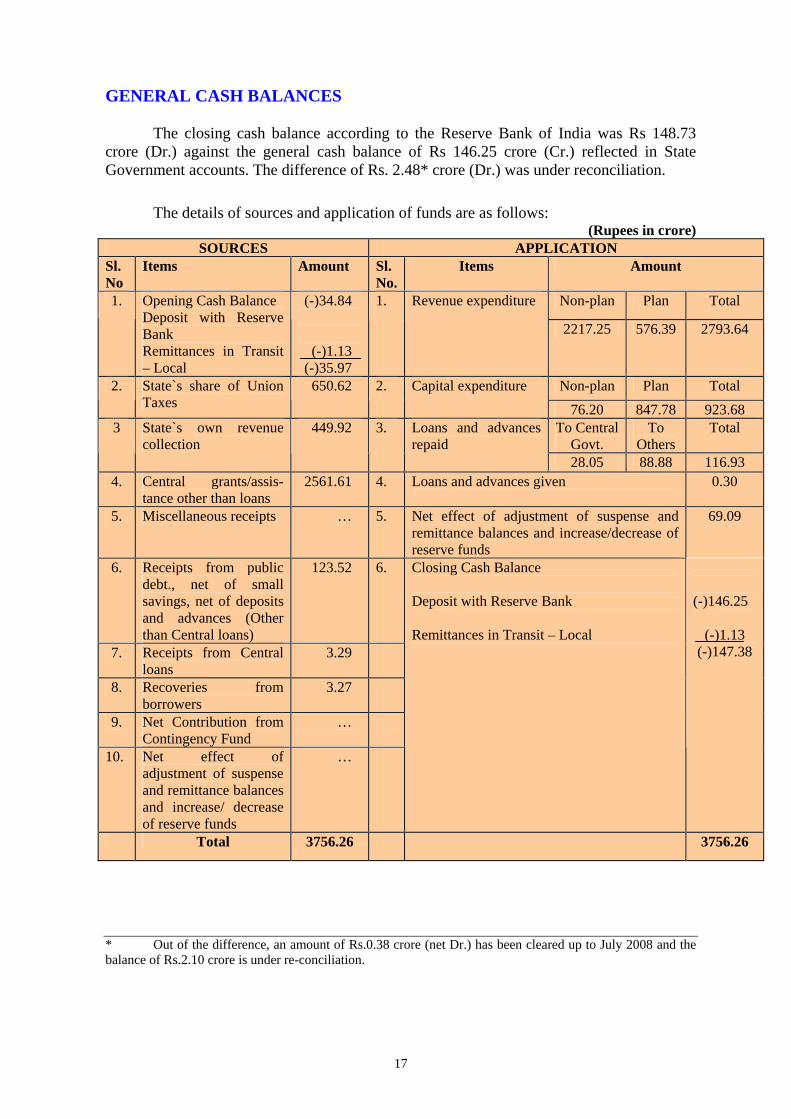
GENERAL CASH BALANCES
The closing cash balance according to the Reserve Bank of India was Rs 148.73 crore (Dr.) against the general cash balance of Rs 146.25 crore (Cr.) reflected in State Government accounts. The difference of Rs. 2.48* crore (Dr.) was under reconciliation.
The details of sources and application of funds are as follows: (Rupees in crore)
SOURCES APPLICATION Sl.No
Items Amount Sl.No.
Items Amount
Non-plan Plan Total 1. Opening Cash Balance Deposit with Reserve Bank Remittances in Transit – Local
(-)34.84
(-)1.13 (-)35.97
1. Revenue expenditure
2217.25 576.39 2793.64
Non-plan Plan Total 2. State`s share of Union Taxes
650.62 2. Capital expenditure 76.20 847.78 923.68
To Central Govt.
To Others
Total 3 State`s own revenue collection
449.92 3. Loans and advances repaid
28.05 88.88 116.93 4. Central grants/assis-
tance other than loans 2561.61 4. Loans and advances given
0.30
5. Miscellaneous receipts … 5. Net effect of adjustment of suspense and remittance balances and increase/decrease of reserve funds
69.09
6. Receipts from public debt., net of small savings, net of deposits and advances (Other than Central loans)
123.52 6.
7. Receipts from Central loans
3.29
8. Recoveries from borrowers
3.27
9. Net Contribution from Contingency Fund
…
10. Net effect of adjustment of suspense and remittance balances and increase/ decrease of reserve funds
…
Closing Cash Balance Deposit with Reserve Bank Remittances in Transit – Local
(-)146.25
(-)1.13 (-)147.38
Total 3756.26 3756.26
* Out of the difference, an amount of Rs.0.38 crore (net Dr.) has been cleared up to July 2008 and the balance of Rs.2.10 crore is under re-conciliation.
17
![]rli'4,:J · 2019-12-17 · i\, Tripura Forest Development & Plantation Corporation Limited (A Government of Tripura Und€rtaking) Registered Office: Abhoynaga r: Agarta la, Tripura](https://static.fdocuments.net/doc/165x107/5e627552f52ec33aa75f2214/rli4j-2019-12-17-i-tripura-forest-development-plantation-corporation.jpg)