GOVERNMENT OF KARNATAKA ACCOUNTS RECKONER 2002-2011.pdf · ACCOUNTS RECKONER ... V Tax Revenue,...
104
GOVERNMENT OF KARNATAKA ACCOUNTS RECKONER FOR 2002‐2011 FINANCE DEPARTMENT Computer Cell June 2011
Transcript of GOVERNMENT OF KARNATAKA ACCOUNTS RECKONER 2002-2011.pdf · ACCOUNTS RECKONER ... V Tax Revenue,...

GOVERNMENT OF KARNATAKA
ACCOUNTS RECKONER FOR
2002‐2011
FINANCE DEPARTMENT
Computer Cell June 2011

Statement No. Details Page No.I Budget at a Glance 01II Summarised Financial Position of Government of Karnataka as on 31st March 02‐03III Sources & Applications of Funds 04IV Summary of State Transactions 05‐06V Tax Revenue, Non‐Tax Revenue, Public Debt & Consolidated Fund for the State 07‐08VI Revenue Receipts, Revenue Expenditure & Revenue Surplus/Deficit 09VII Arrears of Revenue 10VIII Analysis of Consolidated Fund 11‐26IX Object Head‐wise Revenue Expenditure 27‐42X Major Head‐wise Plan/Non‐Plan Expenditure 43‐60XI Summary of Appropriation Accounts & Control over Expenditure 61XII Progressive Capital Expenditure in the form of Equity & Capital Assistance at the end of 31st March 62‐67XIII State Resources for Plan Expenditure 68XIV Sectoral Outlays on State Plan Schemes 69‐73XV Outlay on Centrally Sponsored Schemes 74‐75XVI Outlay on Central Plan Schemes 76‐79XVII Major Head‐wise Expenditure under State Plan Schemes 80‐84XVIII Major Head‐wise Expenditure under Centrally Sponsored Schemes 85‐86XIX Major Head‐wise Expenditure under Central Plan Schemes 87XX Public Debt & Liabilities as on 31st March 88XXI Contingent Liabilities for Guarantees given by the Government 89XXII Loans & Advances by the State Government 90XXIII Outstanding Loans as on 31st March 91‐94XXIV Group‐wise details of Sanctioned Strength 95‐96XXV Expenditure on Salaries 97‐98XXVI No. of Pensioners & Expenditure thereon 99XXVII Ways & Means Advances and Overdraft 100XXVIII Misappropriations, Defalcations etc. 101XXIX Developmental and Non‐Developmental Expenditure 102
CONTENTS

STATEMENT ‐ IBUDGET AT A GLANCE (` in crores)
Sl.No Item 2002-03 2003-04 2004-05 2005-06 2006-07 2007-08 2008-09 2009-10 2010-11 RE
2011-12 BE
Opening Balance -3.33 70.55 12.90 22.57 52.16 231.88 89.90 -358.45 -107.68 88.47A REVENUE ACCOUNT
I. RECEIPTS State Taxes 10444.06 12570.13 16072.06 18631.30 23300.75 25986.65 27645.55 30578.60 38048.67 43817.10 Share of Central Taxes 2781.85 3244.81 3878.70 4213.67 5374.61 6779.34 7153.88 7359.98 9310.09 10418.99 Grants from Central Govt. 1665.18 1986.57 2146.56 3632.37 4813.17 5027.49 5332.26 7883.32 6906.34 8402.38 Non Tax Revenue 1277.67 2958.38 4472.34 3874.71 4098.41 3357.66 3158.99 3333.80 3519.48 3674.79TOTAL (A-I) 16168.76 20759.89 26569.66 30352.05 37586.94 41151.14 43290.68 49155.70 57784.58 66313.26II. EXPENDITURE Social Services 6326.25 6965.04 7722.75 8898.79 10936.71 13123.67 15872.99 19118.86 23034.13 24878.75 Economic Services 4802.41 4651.70 6510.52 7947.32 10440.24 11453.31 11136.64 13181.71 15856.38 17299.35 General Services 7112.12 9039.13 9900.24 10035.82 10419.42 10871.78 12275.57 12762.34 14613.58 18512.88 GIA & Contribution 573.71 628.85 798.34 1158.96 1639.06 1926.00 2374.09 2474.01 2685.14 4343.36TOTAL (A-II) 18814.49 21284.72 24931.85 28040.89 33435.43 37374.76 41659.29 47536.92 56189.23 65034.34Revenue Acc. Surplus/Deficit -2645.73 -524.83 1637.81 2311.16 4151.51 3776.38 1631.39 1618.78 1595.35 1278.92
B CAPITAL ACCOUNTI. RECEIPTS: Loans from Govt. of India 1544.22 1957.00 1555.75 668.65 654.46 806.00 596.16 680.85 1538.72 1738.80 Open Market Loans (net) 1509.71 2602.85 2116.14 165.50 -232.54 287.48 6583.41 4953.83 1028.18 8199.75 Loans from LIC, RBI, GIC, NABARD & NCD 300.11 1019.38 268.74 252.87 298.72 334.29 465.39 648.59 605.00 765.00 Loans from NSSF 1977.84 2733.05 4386.26 4327.25 2592.76 388.27 113.73 661.47 3000.00 2000.00 Recoveries of Loans & Advances 928.00 64.29 46.85 123.55 59.97 52.07 56.65 555.36 159.50 61.72 Public Account (net) etc. 1610.52 -62.89 -871.52 -1175.19 3084.75 4148.30 1471.94 5440.48 7215.36 1884.75 Contingency Fund (Net) 7.89 -40.52 1.61 38.91 -13.28 13.28 -2.10 2.10 0.00 0.00TOTAL (B-I) 7878.29 8273.16 7503.83 4401.54 6444.84 6029.69 9285.18 12942.68 13546.76 14650.02II. DISBURSEMENTS: Capital Outlay (net) 2936.00 3029.39 4673.68 5821.93 8542.57 8403.16 9689.15 12066.89 11817.42 11754.44 Repayment of Central Loans 1409.19 3161.01 3407.59 417.50 737.03 448.56 461.43 470.46 534.93 590.51 Repayment of Loans to LIC, 185.91 604.37 439.27 144.09 779.81 339.57 483.00 791.75 956.25 1221.35 RBI, GIC, & NCDC etc. Disbursement of Loans & Advances 627.57 1011.20 611.42 299.60 357.23 756.74 731.34 981.58 1637.36 2067.88TOTAL (B-II) 5158.67 7805.97 9131.96 6683.12 10416.64 9948.03 11364.92 14310.68 14945.96 15634.18
B Capital Account Surplus/Deficit 2719.62 467.19 -1628.13 -2281.58 -3971.80 -3918.34 -2079.74 -1368.00 -1399.20 -984.16C Overall Surplus/Deficit for the year 73.89 -57.64 9.68 29.58 179.71 -141.96 -448.35 250.78 196.15 294.76D Closing Balance 70.55 12.90 22.57 52.16 231.88 89.90 -358.45 -107.67 88.47 383.23
1
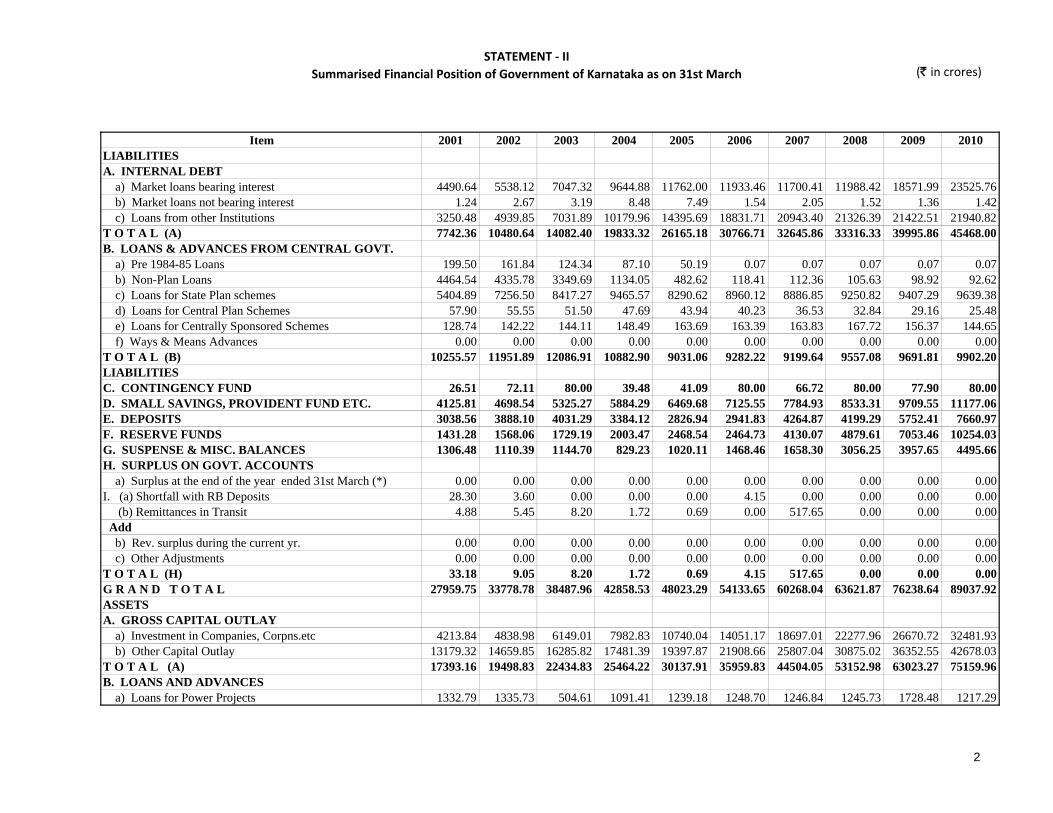
STATEMENT ‐ IISummarised Financial Position of Government of Karnataka as on 31st March (` in crores)
Item 2001 2002 2003 2004 2005 2006 2007 2008 2009 2010LIABILITIESA. INTERNAL DEBT a) Market loans bearing interest 4490.64 5538.12 7047.32 9644.88 11762.00 11933.46 11700.41 11988.42 18571.99 23525.76 b) Market loans not bearing interest 1.24 2.67 3.19 8.48 7.49 1.54 2.05 1.52 1.36 1.42 c) Loans from other Institutions 3250.48 4939.85 7031.89 10179.96 14395.69 18831.71 20943.40 21326.39 21422.51 21940.82T O T A L (A) 7742.36 10480.64 14082.40 19833.32 26165.18 30766.71 32645.86 33316.33 39995.86 45468.00B. LOANS & ADVANCES FROM CENTRAL GOVT. a) Pre 1984-85 Loans 199.50 161.84 124.34 87.10 50.19 0.07 0.07 0.07 0.07 0.07 b) Non-Plan Loans 4464.54 4335.78 3349.69 1134.05 482.62 118.41 112.36 105.63 98.92 92.62 c) Loans for State Plan schemes 5404.89 7256.50 8417.27 9465.57 8290.62 8960.12 8886.85 9250.82 9407.29 9639.38 d) Loans for Central Plan Schemes 57.90 55.55 51.50 47.69 43.94 40.23 36.53 32.84 29.16 25.48 e) Loans for Centrally Sponsored Schemes 128.74 142.22 144.11 148.49 163.69 163.39 163.83 167.72 156.37 144.65 f) Ways & Means Advances 0.00 0.00 0.00 0.00 0.00 0.00 0.00 0.00 0.00 0.00T O T A L (B) 10255.57 11951.89 12086.91 10882.90 9031.06 9282.22 9199.64 9557.08 9691.81 9902.20LIABILITIESC. CONTINGENCY FUND 26.51 72.11 80.00 39.48 41.09 80.00 66.72 80.00 77.90 80.00D. SMALL SAVINGS, PROVIDENT FUND ETC. 4125.81 4698.54 5325.27 5884.29 6469.68 7125.55 7784.93 8533.31 9709.55 11177.06E. DEPOSITS 3038.56 3888.10 4031.29 3384.12 2826.94 2941.83 4264.87 4199.29 5752.41 7660.97F. RESERVE FUNDS 1431.28 1568.06 1729.19 2003.47 2468.54 2464.73 4130.07 4879.61 7053.46 10254.03G. SUSPENSE & MISC. BALANCES 1306.48 1110.39 1144.70 829.23 1020.11 1468.46 1658.30 3056.25 3957.65 4495.66H. SURPLUS ON GOVT. ACCOUNTS a) Surplus at the end of the year ended 31st March (*) 0.00 0.00 0.00 0.00 0.00 0.00 0.00 0.00 0.00 0.00I. (a) Shortfall with RB Deposits 28.30 3.60 0.00 0.00 0.00 4.15 0.00 0.00 0.00 0.00 (b) Remittances in Transit 4.88 5.45 8.20 1.72 0.69 0.00 517.65 0.00 0.00 0.00 Add b) Rev. surplus during the current yr. 0.00 0.00 0.00 0.00 0.00 0.00 0.00 0.00 0.00 0.00 c) Other Adjustments 0.00 0.00 0.00 0.00 0.00 0.00 0.00 0.00 0.00 0.00T O T A L (H) 33.18 9.05 8.20 1.72 0.69 4.15 517.65 0.00 0.00 0.00G R A N D T O T A L 27959.75 33778.78 38487.96 42858.53 48023.29 54133.65 60268.04 63621.87 76238.64 89037.92ASSETSA. GROSS CAPITAL OUTLAY a) Investment in Companies, Corpns.etc 4213.84 4838.98 6149.01 7982.83 10740.04 14051.17 18697.01 22277.96 26670.72 32481.93 b) Other Capital Outlay 13179.32 14659.85 16285.82 17481.39 19397.87 21908.66 25807.04 30875.02 36352.55 42678.03T O T A L (A) 17393.16 19498.83 22434.83 25464.22 30137.91 35959.83 44504.05 53152.98 63023.27 75159.96B. LOANS AND ADVANCES a) Loans for Power Projects 1332.79 1335.73 504.61 1091.41 1239.18 1248.70 1246.84 1245.73 1728.48 1217.29
2

STATEMENT ‐ IISummarised Financial Position of Government of Karnataka as on 31st March (` in crores)
Item 2001 2002 2003 2004 2005 2006 2007 2008 2009 2010 b) Other Development loans 2726.85 3170.90 3661.51 4015.13 4408.26 4644.09 4986.02 5699.46 5891.28 6827.14 c) Loans to Govt. servants & 17.05 49.83 89.91 96.41 122.33 50.78 7.96 0.31 0.43 1.99 Miscellaneous loansT O T A L (B) 4076.69 4556.46 4256.03 5202.95 5769.77 5943.57 6240.82 6945.50 7620.19 8046.42C. OTHER ADVANCES 13.66 15.80 8.81 9.62 14.25 20.43 15.45 12.30 10.95 10.17D. REMITTANCE BALANCES 0.00 36.75 29.93 144.24 35.51 0.00 0.00 310.91 362.56 399.03E. CASH a) Cash in Treasuries & Local remittances 2.42 5.71 3.76 1.40 0.85 1.18 0.00 0.00 0.00 0.00 b) Deposits with RBI 0.00 0.00 74.99 13.22 22.40 50.90 231.87 89.89 -358.46 -107.69 c) Departmental Cash balances including 3.52 5.11 3.06 5.04 5.28 5.16 5.92 5.91 6.08 10.77 Permanent advances d) Cash balance investment 964.67 941.28 387.62 296.11 2029.83 4204.34 5523.77 3480.49 7519.31 8889.98 e) Remittances in Transit 0.00 0.00 0.00 0.00 0.00 0.08 0.01 0.01 0.01 0.01 f) Investments from Earmarked Funds 22.45 21.65 21.43 21.43 21.43 344.98 343.20 343.15 652.91 980.44Total E 993.06 973.75 490.86 337.20 2079.79 4606.64 6104.77 3919.45 7819.85 9773.51F. DEFICIT ON GOVERNMENT ACCOUNTSi) Deficit at the end of the year ended 31st March 3620.95 5483.21 8697.16 11267.50 11700.30 9988.31 7601.54 3402.95 -719.27 -2598.18Addii) Rev. Deficit during the current year 1862.23 3284.45 2645.74 524.83 -1640.06 -2311.16 -4151.51 -3776.37 -1631.38 -1618.78iii) Other Adjustments 0.00 -70.47 -75.40 -92.03 -74.18 -73.97 -47.08 -100.07 -66.39 -64.42iv) Capital Receipts 0.00 0.00 0.00 0.00 0.00 0.00 0.00 -245.78 -181.14 -69.79T O T A L F 5483.18 8697.19 11267.50 11700.30 9986.06 7603.18 3402.95 -719.27 -2598.18 -4351.17G R A N D T O T A L 27959.75 33778.78 38487.96 42858.53 48023.29 54133.65 60268.04 63621.87 76238.64 89037.92
(*) Under the Government System of Accounting,the revenue surplus or deficit is closed annually by Govt. account with the result that cumulative postion of such surplus or deficit is not ascertainmenable. The balancing figure of Rs. 1017.64 Crores as on 31 st March 1983 was, therefore, trated as cumulative surplus for drawing up the first statement of financial postion for 1983-84 which took the place of a Balance Sheet.
3

STATEMENT ‐ IIISources & Application of Funds for the Years 2002‐03 to 2011‐12 (` in crores)
Item 2002-03 2003-04 2004-05 2005-06 2006-07 2007-08 2008-09 2009-10 2010-11 RE
2011-12 BE
SOURCES1. Revenue Receipts 16168.75 20759.88 26569.66 30352.05 37586.94 41151.14 43290.68 49155.70 57784.58 66313.272. Recoveries from Loans & Advances 928.00 64.29 46.85 123.55 59.97 52.07 56.65 555.36 159.50 61.723. Increase in Public Debt. 3736.79 4546.90 4480.03 4852.69 1796.57 1027.91 6814.26 5682.53 4680.72 10891.694. Contingency Fund 7.89 0.00 40.52 38.91 0.00 13.28 0.00 2.10 5.00 5.005. Net Receipt from Public Account (i) Increase in Small Savings, PF etc. 626.65 559.01 585.38 655.87 659.38 748.38 1176.24 1467.51 1550.35 1585.00 (ii) Increase in Res.Funds 161.35 274.28 465.06 149.75 1190.03 749.58 1864.09 2873.04 0.00 -993.88 (iii) Increase/decrease in Suspense Misc. 665.43 -133.91 -1468.89 -1652.07 -1083.28 3541.31 -3071.20 -772.94 5665.00 1293.63 (iv) Effect on Remittance Balances 6.82 -114.31 108.73 39.66 513.51 -828.56 -51.65 -36.48 0.00 0.00 (v) Decrease/Increase in Deposits & Adv 150.18 -647.98 -561.81 -368.39 1805.12 -62.42 1554.46 1909.34 0.00 0.00 Net Receipts from Public Account 1610.43 -62.91 -871.53 -1175.18 3084.76 4148.29 1471.94 5440.47 7215.35 1884.756. Misc. Capital Receipts 0.00 0.00 0.00 0.00 0.00 245.78 181.14 69.79 170.00 2000.00Total 22451.86 25308.16 30265.53 34192.02 42528.24 46638.47 51814.67 60905.95 70015.15 81156.43APPLICATION1. Revenue Expenditure 18814.50 21284.71 24931.85 28040.90 33435.43 37374.77 41659.29 47536.92 56189.23 65034.332. Lending for Development & 627.57 1011.20 611.42 299.60 357.23 756.74 731.34 981.58 1637.36 2067.88 Other Purposes3. Capital Expenditure 2936.00 3029.39 4673.68 5821.93 8542.57 8648.94 9870.29 12136.68 11987.42 13754.444. Contingency Fund 0.00 40.52 38.91 0.00 13.28 0.00 2.10 0.00 5.00 5.005. Decrease/Increase in Cash Balance (CB-OB) 73.79 -57.66 9.67 29.59 179.73 -141.98 -448.35 250.77 196.14 294.78
Total 22451.86 25308.16 30265.53 34192.02 42528.24 46638.47 51814.67 60905.95 70015.15 81156.43
4

STATEMENT ‐ IVSummary of State Transactions (` in Lakhs)
Receipts Expenditure Receipts Expenditure Receipts Expenditure Receipts Expenditure Receipts ExpenditureRevenue Receipts 1616875.45 2075988.45 2656965.76 3035205.10 3758694.08Revenue Expenditure 1881449.76 2128471.27 2493185.12 2804089.77 3343542.66Capital Receipts 0.00 0.00 0.00 0.00 0.00Capital ReceiptsCapital Expenditure outside Revenue Account 293599.84 302939.21 467368.24 582192.76 854257.22 Public Debt 952602.97 578924.44 1386996.66 932306.26 997222.06 549219.06 566354.78 81085.71 354593.90 174937.11Loans & Advances 92800.21 62757.45 6428.70 101120.43 4684.99 61142.42 12355.14 29960.00 5997.44 35722.71Inter State SettlementPART I CONSOLIDATED FUND 2662278.63 2816731.49 3469413.81 3464837.17 3658872.81 3570914.84 3613915.02 3497328.24 4119285.42 4408459.70 PART II CONTINGENCY FUND 788.98 0.00 0.00 4052.12 4052.12 3891.18 3891.18 0.00 0.00 1327.77
PUBLIC ACCOUNTI. SMALL SAVINGS, PF ETC. a) Small Savings 42.71 32.89 47.97 46.70 0.00 0.00 0.00 0.00 0.00 0.00 b) Provident Fund 74550.09 43900.56 74364.41 46640.54 81036.63 50626.33 85361.96 50679.07 91640.61 56689.65 c) Other Accounts 65303.34 33288.37 67760.88 39583.49 71084.58 42935.67 79663.22 48761.10 83163.34 52174.38 d) Other Savings Schemes 0.00 0.00 0.00 0.00 27.30 47.94 29.65 27.43 3.06 5.45Total I - Small Savings, PF etc. 139896.14 77221.82 142173.26 86270.73 152148.51 93609.94 165054.83 99467.60 174807.01 108869.48J. RESERVE FUNDS a) Reserve Fund bearing int. 7.68 4.20 7.41 0.00 6.50 9.11 5.51 14.42 4.21 5.60 b) Reserve Funds not bearing Interest 33853.13 17721.45 39557.88 12137.47 57048.84 10481.89 130730.68 115747.42 165808.80 46804.64Total J - Reserve Funds 33860.81 17725.65 39565.29 12137.47 57055.34 10491.00 130736.19 115761.84 165813.01 46810.24K. DEPOSITS & ADVANCES a) Deposits bearing int. 181464.14 221180.43 236292.93 257619.43 18268.87 19239.76 9780.89 887.79 40452.83 36174.16 b) Deposits not bearing interest 1152490.73 1098455.05 1224639.73 1268029.41 1695382.83 1750130.25 1575062.74 1620177.25 1862513.31 1686778.01 c) Advances 8870.73 8172.35 7704.34 7785.72 7476.79 7939.08 7765.64 8383.81 4330.03 3832.28Total K - Deposits & Accounts 1342825.60 1327807.83 1468637.00 1533434.56 1721128.49 1777309.09 1592609.27 1629448.85 1907296.17 1726784.45L. SUSPENSE & MISCELLANEOUSa) Suspense -8635.61 -10548.26 55301.24 47488.48 86751.67 90433.82 -55880.29 -52785.40 5205.79 10662.45b) Other Accounts 3781874.60 3724784.89 1755079.38 1785486.34 3332063.44 3482695.00 7459545.36 7629054.96 11280252.45 11387830.49c) Accounts with Govt. of Foreign Countries 0.00 -0.41 0.08 0.09 0.00 -0.33 0.00 -0.31 0.00 1.02d) Reserve Bank Depositse) Ledger Balance Adjustment Ac 0.00 0.00 0.00 0.00 7392.55 0.00 7398.32 0.00 4707.75 0.00f) Miscellaneous 7542.33 2.51 9203.54 0.22 26.16 0.15 0.00 0.92 -0.02 -0.15Total L - Suspense & Misc. 3780781.32 3714238.73 1819584.24 1832975.13 3426233.82 3573128.64 7411063.39 7576270.17 11290165.97 11398493.81M. REMITTANCES a) Money Orders & Other Remittances 210369.53 209328.44 269915.70 281199.96 263331.28 252200.21 276715.50 272890.10 379114.74 328324.58 b) Inter Government Adjustments 409.12 767.85 153.96 301.03 -43.40 214.81 -51.44 -191.56 -49.76 -610.11Total M - Remittances 210778.65 210096.29 270069.66 281500.99 263287.88 252415.02 276664.06 272698.54 379064.98 327714.47PART III - PUBLIC ACCOUNT 5508142.52 5347090.32 3740029.45 3746318.88 5619854.04 5706953.69 9576127.74 9693647.00 13917147.14 13608672.45Total Receipts/Disbursements 8171210.13 8163821.81 7209443.26 7215208.17 9282778.97 9281759.71 13193933.94 13190975.24 18036432.56 18018459.92Cash Balance (AFS Closing Balance) -333.42 7054.90 7054.89 1289.99 1289.99 2256.90 2256.89 5215.59 5215.59 23188.23GRAND Total Receipts/Disbursements 8170876.71 8170876.71 7216498.15 7216498.16 9284068.96 9284016.61 13196190.83 13196190.83 18041648.15 18041648.15
Head of Account 2006-072002-03 2003-04 2004-05 2005-06
5

STATEMENT ‐ IVSummary of State Transactions (` in Lakhs)
Revenue ReceiptsRevenue ExpenditureCapital ReceiptsCapital ReceiptsCapital Expenditure outside Revenue Account Public DebtLoans & AdvancesInter State SettlementPART I CONSOLIDATED FUND PART II CONTINGENCY FUND
PUBLIC ACCOUNTI. SMALL SAVINGS, PF ETC. a) Small Savings b) Provident Fund c) Other Accounts d) Other Savings SchemesTotal I - Small Savings, PF etc.J. RESERVE FUNDS a) Reserve Fund bearing int. b) Reserve Funds not bearing InterestTotal J - Reserve FundsK. DEPOSITS & ADVANCES a) Deposits bearing int. b) Deposits not bearing interest c) AdvancesTotal K - Deposits & AccountsL. SUSPENSE & MISCELLANEOUSa) Suspenseb) Other Accountsc) Accounts with Govt. of Foreign Countriesd) Reserve Bank Depositse) Ledger Balance Adjustment Acf) MiscellaneousTotal L - Suspense & Misc.M. REMITTANCES a) Money Orders & Other Remittances b) Inter Government AdjustmentsTotal M - RemittancesPART III - PUBLIC ACCOUNTTotal Receipts/DisbursementsCash Balance (AFS Closing Balance)GRAND Total Receipts/Disbursements
Head of AccountReceipts Expenditure Receipts Expenditure Receipts Expenditure Receipts Expenditure Receipts Expenditure4115113.58 4329067.72 4915569.95 5778458.11 6631326.76
3737477.02 4165929.34 4753691.58 5618923.47 6503432.9124578.04 18114.12 6979.13 17000.00 200000.00
864893.80 987028.72 1213668.32 1198742.40 1375444.11235668.46 132877.19 859215.54 177789.56 799085.97 230832.86 714372.00 246300.00 1535380.00 446211.00
5207.15 75674.36 5664.78 73134.36 55536.09 98158.43 15950.10 163735.83 6172.12 206787.68
4380567.23 4810922.37 5212062.16 5403881.98 5777171.14 6296351.19 6525780.21 7227701.70 8372878.88 8531875.701327.77 0.00 0.00 209.80 209.80 0.00 500.00 500.00 500.00 500.00
103205.13 62718.72 121427.44 57518.73 141816.47 45206.00 180266.94 101800.00 165500.00 66500.0096163.17 61812.23 111499.65 57783.62 117298.05 67157.75 148073.76 71505.23 138000.00 78500.00
0.65 0.17 0.22 0.55 0.00 0.07 0.00 0.00 0.00 0.00199368.95 124531.12 232927.31 115302.90 259114.52 112363.82 328340.70 173305.23 303500.00 145000.00
3.07 7.23 3.70 4.63 1.93 0.00 0.00 0.00 0.00 0.00103412.37 28449.94 262868.64 76459.77 511799.92 224497.12 108852.51 108852.11 127099.17 226487.12103415.44 28457.17 262872.34 76464.40 511801.85 224497.12 108852.51 108852.11 127099.17 226487.12
12690.93 22774.49 5661.88 1700.28 3605.74 10925.54 55271.59 55292.71 57700.00 57700.001976818.91 1973293.16 1866247.43 1714896.73 2215174.93 2016999.04 696546.31 696525.19 1733100.00 1733100.00
318.95 3.36 135.29 1.16 77.95 0.00 0.00 0.00 150.00 150.001989828.79 1996071.01 1872044.60 1716598.17 2218858.62 2027924.58 751817.90 751817.90 1790950.00 1790950.00
22316.93 19904.14 14758.37 15412.05 20375.38 21376.70 34463.46 34463.46 16100.00 16000.0010166020.86 9824310.20 11012877.07 11325982.23 20451693.63 20534427.70 1220384.00 653884.00 4004000.00 4004000.00
0.00 -0.92 0.00 -0.23 0.00 0.04 0.00 0.00 0.00 0.00
10008.20 0.00 6639.06 0.00 6441.24 0.00 0.00 0.00 0.00 0.000.00 1.41 0.00 0.23 0.00 0.01 0.00 0.00 129263.00 0.00
10198345.99 9844214.83 11034274.50 11341394.28 20478510.25 20555804.45 1254847.46 688347.46 4149363.00 4020000.00
251990.25 333340.93 117978.82 123798.22 125056.66 128410.46 270505.66 270505.66 130000.00 130000.00-43.58 1461.27 2.24 -652.30 47.68 341.61 0.00 0.00 0.00 0.00
251946.67 334802.20 117981.06 123145.92 125104.34 128752.07 270505.66 270505.66 130000.00 130000.0012742905.84 12328076.33 13520099.81 13372905.67 23593389.58 23049342.04 2714364.23 1992828.36 6500912.17 6312437.1217124800.84 17138998.70 18732161.97 18776997.45 29370770.52 29345693.23 9240644.44 9221030.06 14874291.05 14844812.82
23188.23 8990.37 8990.37 -35845.11 -35845.11 -10767.82 -10767.82 8846.56 8846.56 38324.7417147989.07 17147989.07 18741152.34 18741152.34 29334925.41 29334925.41 9229876.62 9229876.62 14883137.61 14883137.56
2010-11 RE 2011-12 BE2009-10 2007-08 2008-09
6

STATEMENT ‐ VTax Revenue, Non‐Tax Revenue, Public Debt & Consolidated Fund of the State (` in Lakhs)
Item 2002-03 2003-04 2004-05 2005-06 2006-07 2007-08 2008-09 2009-10 2010-11 RE 2011-12 BEA. Tax RevenueState's Own Tax Revenue1. Commercial Taxes0022 Taxes on Agricultural Income 132.18 129.35 217.54 162.44 136.84 303.72 928.27 869.59 1000.00 1000.000028 Other Taxes on Income and Expenditure 18020.42 24529.12 27793.53 33025.33 39258.39 45136.94 53878.98 52721.04 55000.00 61000.000040 Taxes on Sales, Trade etc. 547354.45 664895.76 870007.21 986953.85 1176172.40 1389399.20 1462273.01 1583266.97 2054000.00 2417000.000042 Taxes on Goods & Passengers 51653.16 67346.20 79171.61 104144.86 114719.96 83733.50 108501.69 129113.41 144000.00 151000.000045 Other Taxes and Duties on Commodities & Services 101 Entertainment Tax 4581.53 6163.18 24753.23 8806.48 5612.16 35289.81 15775.00 11613.50 11000.00 13000.00 102 Betting Tax 1342.90 1369.62 228.81 1938.23 16077.04 138.34 4140.46 5118.68 7000.00 7500.00 105 Luxury Tax 8239.04 8889.10 3547.06 13367.56 19406.98 1161.01 19031.49 13329.71 19000.00 19500.00 Total - Commercial Taxes 631323.68 773322.33 1005718.99 1148398.75 1371383.77 1555162.52 1664528.90 1796032.90 2291000.00 2670000.002. 0039 State Excise 209418.49 233396.47 280552.87 339679.24 449547.93 476657.16 574956.77 694632.09 812500.00 911500.003. 0041 Taxes on Vehicles 67569.95 80006.32 98299.00 110544.87 137449.73 165013.37 168116.22 196160.25 225000.00 263000.004. 0030 Stamps and Registrations 111534.50 135569.31 175983.62 221219.65 320580.16 340883.16 292671.58 262757.19 350035.00 403000.005. 0029 Land Revenue 5960.81 6783.65 11776.42 11650.11 10876.20 14531.45 25564.87 12787.68 14331.89 19003.206. 0043 Taxes and Duties on Electricity 17213.53 27291.88 33902.04 27708.79 38856.86 44949.54 37059.41 67869.18 60800.01 68947.217. 0045 Other Taxes and Duties 949.78 642.88 998.86 3953.86 1408.43 1478.84 1668.05 27620.96 51200.00 46260.00 States Own Tax Revenue 1043970.74 1257012.84 1607231.80 1863155.27 2330103.08 2598676.04 2764565.80 3057860.25 3804866.90 4381710.412. Tax Devolution From Centre0020 Corporation Tax 60535.00 88031.00 110388.00 116333.00 167734.00 215152.00 234584.00 302892.00 377784.00 434452.000021 Income Tax Other than Corpn.Tax 46640.00 52454.00 71064.00 82006.00 101857.00 144407.00 147296.00 168723.00 182985.00 193183.000028-901 Other Taxes on Income 435.00 0.00 -26.00 -25.00 -28.00 -11.00 -10.99 0.00 0.00 0.000032 Taxes on Wealth 97.00 77.00 242.00 229.00 211.00 239.00 225.00 685.00 825.00 948.000037 Customs 63865.00 69233.00 77894.00 82142.00 104823.00 128139.00 136755.00 103007.00 156399.00 168359.000038 Union Excise Duty 98214.00 101210.00 107888.00 109619.00 111307.00 122325.00 119265.00 82973.00 119238.00 137124.000044 Service Tax 7366.00 12228.00 20603.00 31072.00 51563.00 67698.00 77285.00 77719.00 93779.00 107834.000045-901 Other Taxes & Duties 1468.00 1248.00 -209.00 -34.00 -34.00 -26.00 -21.99 -1.00 -1.00 -1.00Total Tax Devolution From Centre 278620.00 324481.00 387844.00 421342.00 537433.00 677923.00 715377.02 735998.00 931009.00 1041899.00 A. Tax Revenue 1322590.74 1581493.84 1995075.80 2284497.27 2867536.08 3276599.04 3479942.82 3793858.25 4735875.90 5423609.41
7

STATEMENT ‐ VTax Revenue, Non‐Tax Revenue, Public Debt & Consolidated Fund of the State (` in Lakhs)
Item 2002-03 2003-04 2004-05 2005-06 2006-07 2007-08 2008-09 2009-10 2010-11 RE 2011-12 BEB. Non-Tax Revenue1. Interest Receipt 0049 Interest Receipts 3435.82 11133.80 14478.98 28299.94 37619.43 37524.26 33716.58 38386.21 53592.73 19839.48 0050 Dividends and Profits 1493.23 1690.05 1666.09 1687.68 1948.01 2339.99 4013.82 2948.45 4415.19 4702.18 Total 1 4929.05 12823.85 16145.07 29987.62 39567.44 39864.25 37730.40 41334.66 58007.92 24541.662. Other Non- Tax RevenueGeneral Services 34926.31 178381.18 209811.50 203021.29 212680.70 67909.88 67581.57 84587.12 48055.47 42234.62Social Services 18613.81 12326.28 14713.24 12913.37 14756.89 18139.29 18570.68 23860.08 29242.68 37526.24Economic Services 69297.99 92306.33 206563.88 141548.68 142836.30 209852.40 192016.65 183597.90 216642.39 263176.93 Total B. Non-Tax Revenue 127767.16 295837.64 447233.69 387470.96 409841.33 335765.82 315899.30 333379.76 351948.46 367479.45C. Grants -in - Aid and Contributions 1601 Grants -in -Aid from Central Govt.Non-Plan Grants 42054.57 52985.46 31748.92 173574.05 222436.56 153092.60 169359.11 342967.74 217065.80 208224.00Grants for State Plan Schemes 57016.83 79557.70 103603.10 91527.67 128430.00 191625.10 202037.25 297278.16 292009.63 351982.00Grants for Central Plan Schemes 4524.15 4194.66 4601.46 3692.10 4287.96 7115.91 9459.73 6109.51 29925.02 39752.58Grants for Centrally Sponsored Schemes 62922.00 61919.15 74702.79 94443.05 126162.15 150915.11 152369.51 141976.53 151633.30 240279.32 Total 166517.55 198656.97 214656.27 363236.87 481316.67 502748.72 533225.60 788331.94 690633.75 840237.90 1603 States Share of Union Excise Duties Total. C 166517.55 198656.97 214656.27 363236.87 481316.67 502748.72 533225.60 788331.94 690633.75 840237.90 Total Revenue Receipts 1616875.45 2075988.45 2656965.76 3035205.10 3758694.08 4115113.58 4329067.72 4915569.95 5778458.11 6631326.76D. Capital Receipts 0.00 0.00 0.00 0.00 0.00 24578.04 18114.12 6979.13 17000.00 200000.00E. Public Debt 6003 Internal Debt 798181.33 1191296.68 841647.03 499489.38 289148.40 155068.39 799599.23 731000.52 560500.00 1361500.00Market Loans 161056.54 277889.92 229868.21 41477.61 0.00 74999.08 741687.20 599994.81 200000.00 950000.00Negotiated Loans 30011.35 101938.21 26873.82 25286.77 29872.40 33429.31 46539.03 64858.71 60500.00 76500.00Small Savings Loans 197784.00 273305.00 438626.00 432725.00 259276.00 38827.00 11373.00 66147.00 300000.00 200000.00Ways and Means Advances from RBI 409329.44 538163.55 146279.00 0.00 0.00 7813.00 0.00 0.00 0.00 135000.00 6004 Loans and Advances from Central Govt. 154421.64 195699.98 155575.03 66865.40 65445.50 80600.07 59616.31 68085.45 153872.00 173880.00Non Plan Loans 3765.53 198.03 54.56 -35756.36 64.35 0.00 0.00 3.75 200.00 200.00State Plan Loans 149725.41 144290.27 153144.97 106612.00 64338.30 79130.69 59616.31 68081.70 153622.00 173680.00Central Plan Loans 0.00 0.00 0.00 0.00 0.00 0.00 0.00 0.00 0.00 0.00C.S.S. Loans 930.70 1211.68 2375.50 940.52 1042.85 1469.38 0.00 0.00 50.00 0.00Ways and Means Advances 0.00 50000.00 0.00 0.00 0.00 0.00 0.00 0.00 0.00 0.00Pre 1984-85 Loans 0.00 0.00 0.00 -4930.76 0.00 0.00 0.00 0.00 0.00 0.00rounding off error Total E. Public Debt 952602.97 1386996.66 997222.06 566354.78 354593.90 235668.46 859215.54 799085.97 714372.00 1535380.00F. Loans and Advances 92800.21 6428.70 4684.99 12355.14 5997.44 5207.15 5664.78 55536.09 15950.10 6172.12G. Inter State Settlement 0.00 0.00 0.00 0.00 0.00 0.00 0.00 0.00 0.00 0.00H. Transfer to Contingency Fund 0.00 0.00 0.00 0.00 0.00 0.00 0.00 0.00 0.00 0.00 TOTAL I. Consolidated Fund 2662278.63 3469413.81 3658872.81 3613915.02 4119285.42 4380567.23 5212062.16 5777171.14 6525780.21 8372878.88
8

STATEMENT ‐ VIRevenue Receipts, Revenue Expenditure, Surplus/Deficit (` in crores)
Item 2002-03 2003-04 2004-05 2005-06 2006-07 2007-08 2008-09 2009-10 2010-11 RE 2011-12 BEI. Revenue raised by the Government
A.TAX REVENUE (OWN TAX REVENUE)1 Taxes on Sales, Trades, etc. 5473.54 6648.96 8700.07 9869.54 11761.72 13893.99 14622.73 15832.67 20540.00 24170.002 State Excise 2094.18 2333.96 2805.53 3396.79 4495.48 4766.57 5749.57 6946.32 8125.00 9115.003 Taxes on Vehicles 675.70 800.06 982.99 1105.45 1374.50 1650.13 1681.16 1961.60 2250.00 2630.004 Stamps & Registration Fees 1115.35 1355.69 1759.84 2212.20 3205.80 3408.83 2926.72 2627.57 3500.35 4030.005 Land Revenue 59.61 67.84 117.76 116.50 108.76 145.31 255.65 127.88 143.32 190.036 Taxes & Duties on Electricity 172.14 272.92 339.02 277.09 388.57 449.50 370.59 678.69 608.00 689.477 Taxes on Goods & Passengers 516.53 673.46 791.72 1041.45 1147.20 837.34 1085.02 1291.13 1440.00 1510.008 Other Taxes 332.66 417.23 575.39 612.54 819.00 835.09 954.22 1112.73 1442.00 1482.60
A. Tax Revenue 10439.71 12570.12 16072.32 18631.56 23301.03 25986.76 27645.66 30578.59 38048.67 43817.10B. NON-TAX REVENUE 1277.67 2958.38 4472.34 3874.71 4098.41 3357.66 3158.99 3333.80 3519.48 3674.79Total 11717.38 15528.50 20544.66 22506.27 27399.44 29344.42 30804.65 33912.39 41568.15 47491.89
II. Receipts from Govt. of India by way of Tax Devolution(a) Devolution from Centre 2786.20 3244.81 3878.44 4213.42 5374.33 6779.23 7153.77 7359.98 9310.09 10418.99Total II 2786.20 3244.81 3878.44 4213.42 5374.33 6779.23 7153.77 7359.98 9310.09 10418.99C. GRANTS-IN-AID (i) Non-Plan Grants 420.55 529.85 317.49 1735.74 2224.37 1530.93 1693.59 3429.68 2170.66 2082.24(ii) Grants for State Plan Schemes 570.17 795.58 1036.03 915.28 1284.30 1916.25 2020.37 2972.78 2920.10 3519.82(iii) Grants for Central and Centrally Sponored Schemes 674.46 661.14 793.04 981.35 1304.50 1580.31 1618.29 1480.86 1815.58 2800.32 Total Grants-in-Aid 1665.18 1986.57 2146.56 3632.37 4813.17 5027.49 5332.25 7883.32 6906.34 8402.38 Total Receipts from Government of India 4451.38 5231.38 6025.00 7845.79 10187.50 11806.72 12486.02 15243.30 16216.43 18821.37
III Total Receipts of the State Govt. (Rev.Acc) 16168.76 20759.88 26569.66 30352.06 37586.94 41151.14 43290.67 49155.69 57784.58 66313.26IV Percentage of revenue raised to Total Receipts 72.47 74.80 77.32 74.15 72.90 71.31 71.16 68.99 71.94 71.62V. Revenue Expenditure
a) Plan 3245.02 3552.72 5124.62 5068.68 7852.54 8312.82 10530.31 12302.68 15980.12 19596.48b) Non-Plan 15569.47 17731.99 19807.23 22972.22 25582.89 29061.95 31128.99 35234.24 40209.11 45437.85Total Revenue Expenditure 18814.49 21284.71 24931.85 28040.90 33435.43 37374.77 41659.30 47536.92 56189.23 65034.33
VI Revenue Deficit(-)/Surplus(+) -2645.73 -524.83 1637.81 2311.16 4151.51 3776.37 1631.37 1618.77 1595.35 1278.93VII % of deficit/surplus to Non-Plan Expenditure -16.99 -2.96 8.27 10.06 16.23 12.99 5.24 4.59 3.97 2.81VIII % increase in Rev Rec over the previous year 5.53 28.40 27.99 14.24 23.84 9.48 5.20 13.55 17.55 14.76IX Revenue deficit/surplus as a % of Rev Receipts -16.36 -2.53 6.16 7.61 11.05 9.18 3.77 3.29 2.76 1.93X % of growth of Non-Tax Rev over the previous year 16.85 131.54 51.18 -13.36 5.77 -18.07 -5.92 5.53 5.57 4.41XI % of Receipts from GoI to Rev Receipts 27.53 25.20 22.68 25.85 27.10 28.69 28.84 31.01 28.06 28.38XII % of growth of Tax Rev over previous year 5.95 20.41 27.86 15.92 25.06 11.53 6.38 10.61 24.43 15.16XIII % increase in Revenue Expr over previous year 1.12 13.13 17.14 12.47 19.24 11.78 11.46 14.11 18.20 15.74XIV % of Receipts from GoI to Rev Expr 23.66 24.58 24.17 27.98 30.47 31.59 29.97 32.07 28.86 28.94
9

STATEMENT ‐ VIIArrears of Revenue (` in crores)
Year Revenue Raised (Rs.in Crores) Arrears of Revenue (Rs.in Crores) Percentage of arrears to revenue raised
2000-01 10703.00 1894.00 182001-02 10947.00 2634.00 242002-03 11718.00 3390.00 292003-04 15528.51 3960.51 262004-05 20137.91 3844.85 192005-06 22506.26 3683.01 162006-07 27399.44 5025.99 182007-08 29344.42 6163.08 212008-09 30804.65 5937.79 192009-10 33912.40 4585.58 14
10
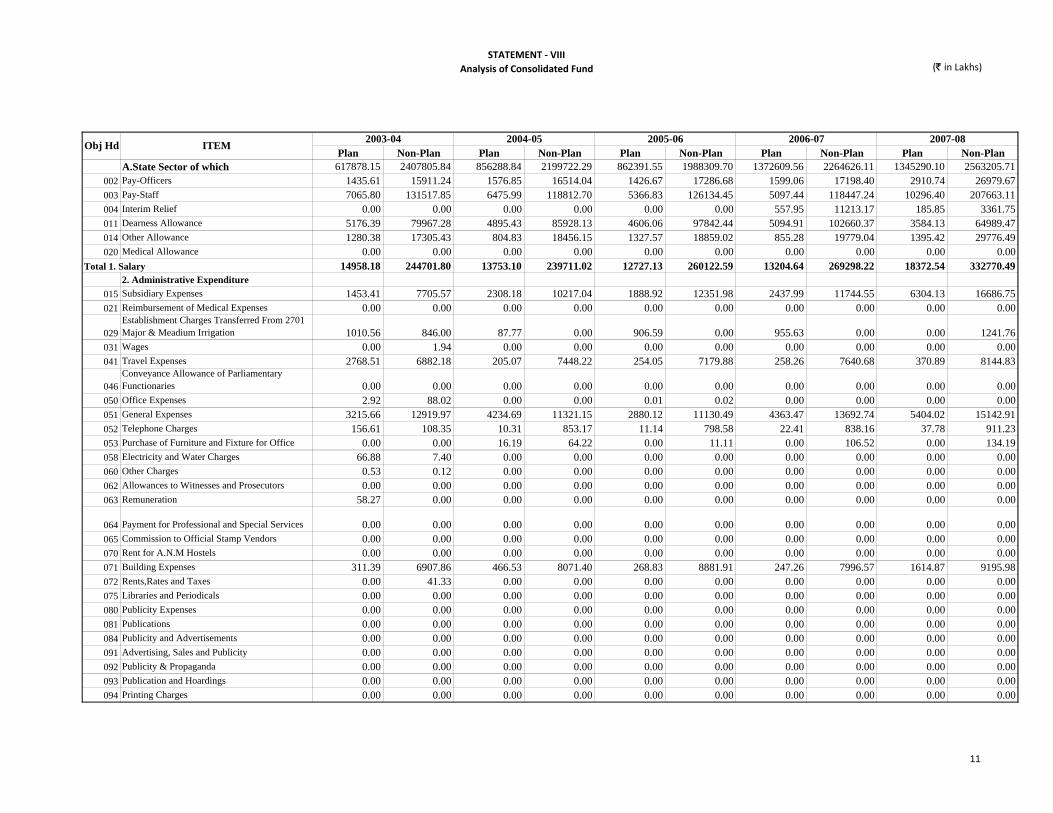
STATEMENT ‐ VIIIAnalysis of Consolidated Fund (` in Lakhs)
Plan Non-Plan Plan Non-Plan Plan Non-Plan Plan Non-Plan Plan Non-PlanA.State Sector of which 617878.15 2407805.84 856288.84 2199722.29 862391.55 1988309.70 1372609.56 2264626.11 1345290.10 2563205.71
002 Pay-Officers 1435.61 15911.24 1576.85 16514.04 1426.67 17286.68 1599.06 17198.40 2910.74 26979.67003 Pay-Staff 7065.80 131517.85 6475.99 118812.70 5366.83 126134.45 5097.44 118447.24 10296.40 207663.11004 Interim Relief 0.00 0.00 0.00 0.00 0.00 0.00 557.95 11213.17 185.85 3361.75011 Dearness Allowance 5176.39 79967.28 4895.43 85928.13 4606.06 97842.44 5094.91 102660.37 3584.13 64989.47014 Other Allowance 1280.38 17305.43 804.83 18456.15 1327.57 18859.02 855.28 19779.04 1395.42 29776.49020 Medical Allowance 0.00 0.00 0.00 0.00 0.00 0.00 0.00 0.00 0.00 0.00
14958.18 244701.80 13753.10 239711.02 12727.13 260122.59 13204.64 269298.22 18372.54 332770.492. Administrative Expenditure
015 Subsidiary Expenses 1453.41 7705.57 2308.18 10217.04 1888.92 12351.98 2437.99 11744.55 6304.13 16686.75021 Reimbursement of Medical Expenses 0.00 0.00 0.00 0.00 0.00 0.00 0.00 0.00 0.00 0.00
029Establishment Charges Transferred From 2701 Major & Meadium Irrigation 1010.56 846.00 87.77 0.00 906.59 0.00 955.63 0.00 0.00 1241.76
031 Wages 0.00 1.94 0.00 0.00 0.00 0.00 0.00 0.00 0.00 0.00041 Travel Expenses 2768.51 6882.18 205.07 7448.22 254.05 7179.88 258.26 7640.68 370.89 8144.83
046Conveyance Allowance of Parliamentary Functionaries 0.00 0.00 0.00 0.00 0.00 0.00 0.00 0.00 0.00 0.00
050 Office Expenses 2.92 88.02 0.00 0.00 0.01 0.02 0.00 0.00 0.00 0.00051 General Expenses 3215.66 12919.97 4234.69 11321.15 2880.12 11130.49 4363.47 13692.74 5404.02 15142.91052 Telephone Charges 156.61 108.35 10.31 853.17 11.14 798.58 22.41 838.16 37.78 911.23053 Purchase of Furniture and Fixture for Office 0.00 0.00 16.19 64.22 0.00 11.11 0.00 106.52 0.00 134.19058 Electricity and Water Charges 66.88 7.40 0.00 0.00 0.00 0.00 0.00 0.00 0.00 0.00060 Other Charges 0.53 0.12 0.00 0.00 0.00 0.00 0.00 0.00 0.00 0.00062 Allowances to Witnesses and Prosecutors 0.00 0.00 0.00 0.00 0.00 0.00 0.00 0.00 0.00 0.00063 Remuneration 58.27 0.00 0.00 0.00 0.00 0.00 0.00 0.00 0.00 0.00
064 Payment for Professional and Special Services 0.00 0.00 0.00 0.00 0.00 0.00 0.00 0.00 0.00 0.00065 Commission to Official Stamp Vendors 0.00 0.00 0.00 0.00 0.00 0.00 0.00 0.00 0.00 0.00070 Rent for A.N.M Hostels 0.00 0.00 0.00 0.00 0.00 0.00 0.00 0.00 0.00 0.00071 Building Expenses 311.39 6907.86 466.53 8071.40 268.83 8881.91 247.26 7996.57 1614.87 9195.98072 Rents,Rates and Taxes 0.00 41.33 0.00 0.00 0.00 0.00 0.00 0.00 0.00 0.00075 Libraries and Periodicals 0.00 0.00 0.00 0.00 0.00 0.00 0.00 0.00 0.00 0.00080 Publicity Expenses 0.00 0.00 0.00 0.00 0.00 0.00 0.00 0.00 0.00 0.00081 Publications 0.00 0.00 0.00 0.00 0.00 0.00 0.00 0.00 0.00 0.00084 Publicity and Advertisements 0.00 0.00 0.00 0.00 0.00 0.00 0.00 0.00 0.00 0.00091 Advertising, Sales and Publicity 0.00 0.00 0.00 0.00 0.00 0.00 0.00 0.00 0.00 0.00092 Publicity & Propaganda 0.00 0.00 0.00 0.00 0.00 0.00 0.00 0.00 0.00 0.00093 Publication and Hoardings 0.00 0.00 0.00 0.00 0.00 0.00 0.00 0.00 0.00 0.00094 Printing Charges 0.00 0.00 0.00 0.00 0.00 0.00 0.00 0.00 0.00 0.00
Obj Hd
Total 1. Salary
ITEM 2003-04 2004-05 2005-06 2006-07 2007-08
11

STATEMENT ‐ VIIIAnalysis of Consolidated Fund (` in Lakhs)
Plan Non-Plan Plan Non-Plan Plan Non-Plan Plan Non-Plan Plan Non-PlanObj Hd ITEM 2003-04 2004-05 2005-06 2006-07 2007-08
096 Purchase of Stationery - Govt. Press 0.00 0.00 0.00 0.00 0.00 0.00 0.00 0.00 0.00 0.00130 Tender Bulletin Expenses 0.00 0.00 0.00 0.00 0.00 0.00 0.00 0.00 0.00 0.00131 Secret Service Expenses 0.00 0.00 0.00 0.00 0.00 0.00 0.00 0.00 0.00 0.00136 Preliminary Expenses 0.00 0.00 0.00 0.00 0.00 0.00 0.00 0.00 0.00 0.00190 Motor Vehicles 0.00 0.00 0.00 0.00 0.00 0.00 0.00 0.00 0.00 0.00191 Fuel and Oil Expenses 0.00 26.35 0.00 0.00 0.00 0.00 0.00 0.00 0.00 0.00192 Repairs of Motor Vehicles 0.00 17.94 0.00 0.00 0.00 0.11 0.00 0.00 0.00 0.00193 Purchase of New Motor Vehicles 0.00 0.00 0.00 0.00 0.00 0.00 0.00 0.00 0.00 0.00195 Transport Expenses 272.09 6289.84 282.52 7282.57 540.35 8545.54 285.78 11567.95 446.17 10973.28299 Prize Money 0.00 128151.05 0.00 172885.94 0.00 165091.07 0.00 109257.63 0.00 362.14306 Cash and Incentive Awards 0.00 0.00 0.00 0.00 0.00 0.03 0.00 0.00 0.00 0.00310 Payment of Commission to Agents 0.00 12729.31 0.00 0.00 0.00 0.00 0.00 0.00 0.00 0.00384 Award 0.00 0.00 0.00 0.00 0.00 0.00 0.00 0.00 0.00 0.00
9316.83 182723.23 7611.26 218143.71 6750.01 213990.72 8570.80 162844.80 14177.86 62793.073. Others
001 Consolidated Salaries 0.00 673.20 0.00 603.58 0.00 722.30 0.00 925.47 0.00 746.23
028Establishment Charges - transferred from 2059 Public Works 0.00 0.00 0.00 0.00 0.00 0.00 0.00 0.00 0.00 0.00
030Establishment Charges Transferred From 2702-Minor Irrigation 124.76 0.00 1603.19 0.00 0.00 0.00 0.00 0.00 0.00 0.00
059 Other Expenses 89595.61 10822.97 123823.52 27856.73 88514.06 22666.23 162524.21 44434.73 210639.72 50885.47095 Text Books 0.00 0.00 0.00 0.00 0.00 0.00 0.00 0.00 0.00 0.00100 Financial Assistance/Relief 8185.53 95641.90 3754.32 111217.05 14840.36 183101.52 30274.82 222226.12 31120.37 233040.04101 Grants-in-Aid 45912.85 77808.12 79401.83 105658.55 74009.85 89414.40 89617.12 88759.92 101787.55 105283.96102 Special Grants 373.66 0.00 0.00 0.00 0.00 0.00 0.00 0.00 0.00 0.00103 Assistance in Kind 0.00 0.00 0.00 0.00 0.00 0.00 0.00 0.00 0.00 0.00104 Contributions 260.79 15905.29 880.60 10934.38 655.99 389.76 60957.14 26116.03 1321.16 45306.79105 Contributions to Provident Fund 0.00 23.46 0.00 0.00 0.00 0.00 0.00 0.00 0.00 0.00106 Subsidies 3004.34 195664.99 13318.12 258166.38 10208.36 361105.58 14399.13 421130.59 75734.80 466259.09108 Contributions to Band Fund 0.00 0.00 0.00 0.00 0.00 0.00 0.00 0.00 0.00 0.00109 Rebate 0.00 0.00 0.00 0.00 0.00 0.00 0.00 0.00 0.00 0.00110 Compensations 0.00 0.00 0.00 0.00 0.00 -0.14 0.00 0.00 0.00 0.00111 Scholorships and Stipends 0.00 0.00 0.00 0.00 0.00 0.00 0.00 0.00 0.00 0.00112 Stipends 0.00 0.00 0.00 0.00 0.00 0.00 0.00 0.00 0.00 0.00113 Scholarships 0.00 0.00 0.00 0.00 0.00 0.00 0.00 0.00 0.00 0.00114 Ration 0.00 0.00 0.00 0.00 0.00 0.00 0.00 0.00 0.00 0.00117 Scholarships & Incentives 1286.76 1628.99 1182.38 1799.03 464.99 1900.32 795.74 2460.10 2457.79 2566.40120 Hospitality Expenses 0.00 0.00 0.00 0.00 0.00 0.00 0.00 0.00 0.00 0.00
Total 2. Administrative Expenditure
12

STATEMENT ‐ VIIIAnalysis of Consolidated Fund (` in Lakhs)
Plan Non-Plan Plan Non-Plan Plan Non-Plan Plan Non-Plan Plan Non-PlanObj Hd ITEM 2003-04 2004-05 2005-06 2006-07 2007-08
121 Sumptuary Allowances 0.00 0.00 0.00 0.00 0.00 0.00 0.00 0.00 0.00 0.00122 Entertainment Allowances 0.00 0.00 0.00 0.00 0.00 0.00 0.00 0.00 0.00 0.00123 General Elections 0.00 0.00 0.00 0.00 0.00 0.00 0.00 0.00 0.00 0.00124 Bye Elections 0.00 0.00 0.00 0.00 0.00 0.00 0.00 0.00 0.00 0.00125 Modernisation 1126.16 10723.81 653.40 8313.42 1731.57 8482.45 1904.78 5855.49 3884.95 5777.01126 Terminal Leave Benefits 0.00 0.00 0.00 0.00 0.00 0.00 0.00 0.00 0.00 0.00127 Repayment of Internal Debt 0.00 0.00 0.00 0.00 0.00 0.00 0.00 0.00 0.00 0.00128 Repayment of Central Debt 0.00 0.45 0.00 0.00 0.00 0.00 0.00 0.00 0.00 0.00129 Assistance for Repayments 0.00 0.00 0.00 0.00 0.00 0.00 0.00 0.00 0.00 0.00132 Capital Expenses 4377.00 3714.63 21951.78 824.29 164908.42 1258.66 272367.92 1158.59 361112.47 1287.09133 Special Development Plan 0.00 0.00 0.00 0.00 0.00 0.00 0.00 0.00 25000.00 0.00137 Survey 0.00 0.00 0.00 0.00 0.00 0.00 0.00 0.00 0.00 0.00139 Major Works 32224.80 1918.06 69481.46 4449.30 81492.60 4893.60 62401.64 5211.30 93468.63 5036.61140 Minor Works 0.00 0.00 0.00 0.00 342.11 0.00 636.05 0.00 1363.45 0.00141 Works 0.00 0.00 0.00 0.00 0.00 0.00 0.00 0.00 0.00 0.00142 Buildings 0.00 17.35 0.00 0.00 0.00 0.00 0.00 0.00 0.00 0.00145 Acquisition of Land 0.00 0.00 0.00 0.00 0.00 0.00 0.00 0.00 0.00 0.00146 Infrastructure 0.00 0.00 0.00 0.00 0.00 0.00 0.00 0.00 0.00 0.00147 Land & Buildings 382.83 777.41 347.04 657.62 329.03 804.62 936.03 1253.40 792.97 585.56150 Repairs 7.40 2846.71 0.00 0.00 0.00 0.00 0.00 0.00 0.00 0.00151 Maintenance and Repairs 0.00 0.00 0.00 0.00 0.00 0.00 0.00 0.00 0.00 0.00152 Special Repairs 0.00 0.00 0.00 0.00 0.00 0.00 0.00 0.00 0.00 0.00154 Extensions & Improvements 0.00 0.00 0.00 0.00 0.00 0.00 0.00 0.00 0.00 0.00
155Construction of Wharfs, Jetties & Other Facilities 0.00 0.00 0.00 0.00 0.00 0.00 0.00 0.00 0.00 0.00
158 Navigational Aids 0.00 0.00 0.00 0.00 0.00 0.00 0.00 0.00 0.00 0.00160 Renewals 0.00 0.00 0.00 0.00 0.00 0.00 0.00 0.00 0.00 0.00161 Furnishings 0.00 0.00 0.00 0.00 0.00 0.00 0.00 0.00 0.00 0.00162 Purchase of Seed Cocoons 0.00 0.00 0.00 0.00 0.00 0.00 0.00 0.00 0.00 0.00165 Reservoir 5.74 0.00 0.00 0.00 0.00 0.00 0.00 0.00 0.00 0.00166 Dam & Appurtenant Works 2.57 23.38 0.00 0.00 0.00 0.00 0.00 0.00 0.00 0.00167 Canals & Branches - Normal 0.86 0.00 0.00 0.00 0.00 0.00 0.00 0.00 0.00 0.00169 Distributaries - Normal 0.00 0.00 0.00 0.00 0.00 0.00 0.00 0.00 0.00 0.00171 Water Courses 0.00 0.00 0.00 0.00 0.00 0.00 0.00 0.00 0.00 0.00172 Roads 43295.77 6752.31 89466.47 8772.33 112166.03 12662.61 162045.78 12722.87 112929.24 13905.75173 Bridges 136.34 0.00 65.08 0.00 10.89 0.00 0.00 0.00 0.00 0.00174 Land Drainages -0.03 -0.01 0.00 0.00 0.00 0.00 0.00 0.00 0.00 0.00177 Computer Software 0.00 0.00 0.00 0.00 0.00 0.00 0.00 0.00 0.00 0.00
13

STATEMENT ‐ VIIIAnalysis of Consolidated Fund (` in Lakhs)
Plan Non-Plan Plan Non-Plan Plan Non-Plan Plan Non-Plan Plan Non-PlanObj Hd ITEM 2003-04 2004-05 2005-06 2006-07 2007-08
180 Machinery and Equipment 643.52 626.23 781.41 1983.92 759.61 1324.38 1545.08 1581.42 2040.18 1450.98
181Machinery & Equipment - Transferred from 2059 Public Works 0.00 0.00 0.00 0.00 0.00 0.00 0.00 0.00 0.00 0.00
182 Repairs and Carriages 67.47 716.06 102.96 1036.05 199.27 1020.81 197.48 599.28 181.43 526.86
185Machinery & Equipments Transferred from 2702 Minor Irrigation 1256.36 0.00 155.15 0.00 0.00 0.00 0.00 0.00 0.00 0.00
200 Maintenance 1460.24 21748.51 2093.30 21907.81 1270.11 40805.18 2115.46 79719.80 2050.27 60580.19201 GIA for ZP211 Investment 151306.20 0.00 64659.40 4496.54 41575.82 0.00 128544.15 0.00 41721.91 0.00221 Materials and Supplies 2110.54 4754.43 9499.43 7062.04 89.42 6507.58 302.21 7480.28 4774.82 6304.37222 Drugs and Chemicals 237.85 7925.41 622.41 8545.39 610.29 9175.83 1969.28 10964.23 822.61 11932.79223 Chemicals and Glassware 0.00 0.00 0.00 0.00 0.00 0.00 0.00 0.00 0.00 0.00224 Raw Materials 0.00 0.00 0.00 0.00 0.00 0.00 0.00 0.00 0.00 0.00225 New Supplies 158.71 1.83 0.46 0.00 0.00 0.00 0.00 0.00 0.00 0.00
226Cost of Materials and Equipment supplied by GOI 0.00 0.00 0.00 0.00 1172.44 0.00 0.00 0.00 0.00 0.00
229 Equipments and Clothing 0.00 0.00 0.00 0.00 0.00 0.00 0.00 0.00 0.00 0.00230 Hospital Accessaries 0.65 774.20 24.36 830.84 7.81 623.38 41.96 841.20 87.25 1023.84231 Bedding and Clothing 0.00 0.00 0.00 0.00 0.00 0.00 0.00 0.00 0.00 0.00234 Diet Expenses 0.00 1445.53 18.46 668.92 27.22 1037.76 17.90 1068.60 16.33 1183.36235 X-Ray Films 0.00 0.00 0.00 0.00 0.00 0.00 0.00 0.00 0.00 0.00236 Equipment Charges 0.00 0.00 0.00 0.00 0.00 0.00 0.00 0.00 0.00 0.00237 Raw Material - Training Section 0.00 0.00 0.00 0.00 0.00 0.00 0.00 0.00 0.00 0.00240 Debt Servicing 38710.17 1302320.86 205371.06 928689.63 203129.64 457612.38 196438.22 611660.83 6434.90 727734.15241 Interest 0.00 1025.51 0.00 0.00 0.00 0.00 0.00 0.00 0.00 0.00243 Interest on Capital 0.00 109.90 0.00 75.37 0.00 71.50 0.00 70.49 0.00 93.89250 Pensionary Charges 0.17 328.38 0.25 113.39 0.24 135.23 0.23 80.23 0.20 85.73251 Pension & Retirement Benefits 1.10 197613.37 3.69 212410.59 0.14 240322.63 12347.64 268038.61 789.98 391411.22252 Commuted Value of Pensions 0.00 0.00 0.00 0.00 0.00 0.00 0.00 0.00 0.00 0.00253 Compassionate Allowances 0.00 0.00 0.00 0.00 0.00 0.00 0.00 0.00 0.00 0.00254 D.C.R.G 0.00 0.00 0.00 0.00 0.00 0.00 0.00 0.00 0.00 0.00261 Inter Account Transfers 27634.30 3390.10 49363.59 1542.81 -39210.68 64344.54 37321.93 11732.38 1165.01 36013.11271 Depreciation 0.00 7.41 0.00 5.08 0.00 5.50 0.00 4.22 0.00 3.08272 Transfer to Depreciation Reserve Fund 0.00 -13.58 0.00 0.00 0.00 0.00 0.00 0.00 0.00 0.00291 Suspense 0.00 14.70 0.00 0.00 0.00 0.00 0.00 0.00 0.00 0.00292 Stock Debits 0.00 1697.16 0.00 779.63 0.00 548.40 0.51 297.18 0.00 134.32293 M P W A Debits 0.00 847.53 4075.36 903.71 225.14 574.39 673.81 1384.07 170.46 417.83294 Stock Credits 0.00 -1721.46 0.00 -903.12 -0.32 -775.06 -0.43 -280.90 -0.32 -157.42295 M P W A Credits 0.00 -1006.55 0.00 -330.88 -6.00 -301.29 -258.47 -208.35 -703.90 -437.77
14

STATEMENT ‐ VIIIAnalysis of Consolidated Fund (` in Lakhs)
Plan Non-Plan Plan Non-Plan Plan Non-Plan Plan Non-Plan Plan Non-PlanObj Hd ITEM 2003-04 2004-05 2005-06 2006-07 2007-08
296 Stock -155.60 -66.29 -7.65 -0.73 -35.38 0.32 -64.69 -0.52 -58.09 -3.96297 Miscellaneous Works Advances 578.58 -246.58 -465.12 -49.45 491.21 -9.62 61.39 17.76 113.02 80.38298 Ex-Gratia 0.00 0.00 0.00 0.00 0.00 0.00 0.00 0.00 0.00 0.00301 Medical Charges 0.00 0.00 0.00 0.00 0.00 0.00 0.00 0.00 0.00 0.00302 Library Charges 0.00 0.00 0.00 0.00 0.00 0.00 0.00 0.00 0.00 0.00303 Remuneration to Shanbhogues and Patels 0.00 0.00 0.00 0.00 0.00 0.00 0.00 0.00 0.00 0.00304 Remuneration to Gramasahayakas 0.00 0.00 0.00 0.00 0.00 0.00 0.00 0.00 0.00 0.00307 Dieting and Moving charges 0.00 0.00 0.00 0.00 0.00 0.00 0.00 0.00 0.00 0.00308 Feed and Fodder 0.00 94.53 0.00 0.00 0.00 0.00 0.00 0.00 0.00 0.00309 Livestock and Fodder 0.00 0.00 0.00 0.00 0.00 0.00 0.00 0.00 0.00 0.00312 M.O. Commission for Pension Payments 0.00 0.00 0.00 0.00 0.00 0.00 0.00 0.00 0.00 0.00
313Equipments and Apparatus (including computers) 0.00 8.17 0.00 0.00 0.00 0.00 0.00 0.00 0.00 0.00
314 Laboratory Charges 0.00 0.00 0.00 0.00 0.00 0.00 0.00 0.00 0.00 0.00316 Rewards 0.07 0.00 0.00 0.00 0.00 0.00 0.00 0.00 0.00 0.00317 Training 2.74 0.00 0.00 0.00 0.00 0.00 0.00 0.00 0.00 0.00
318 Repairs and Miscellaneous (Training Section) 0.00 0.00 0.00 0.00 0.00 0.00 0.00 0.00 0.00 0.00
320 Repairs and Miscellaneous (Workshop Section) 0.00 0.00 0.00 0.00 0.00 0.00 0.00 0.00 0.00 0.00321 Labour (Workshop Section) 0.00 0.00 0.00 0.00 0.00 0.00 0.00 0.00 0.00 0.00323 Capitation Grant 0.00 0.00 0.00 0.00 0.00 0.00 0.00 0.00 0.00 0.00324 Honorarium 0.00 0.00 0.00 0.00 0.00 0.00 0.00 0.00 0.00 0.00326 Boarding Charges 0.00 0.00 0.00 0.00 0.00 0.00 0.00 0.00 0.00 0.00336 Animals 0.00 0.00 0.00 0.00 0.00 0.00 0.00 0.00 0.00 0.00338 Agricultural Inputs 0.00 0.00 0.00 0.00 0.00 0.00 0.00 0.00 0.00 0.00339 Programmes 0.00 0.00 0.00 0.00 0.00 0.00 0.00 0.00 0.00 0.00342 Purchase of Books 0.00 0.00 0.00 0.00 0.00 0.00 0.00 0.00 0.00 0.00346 Maintenance of Cattle 0.00 0.00 0.00 0.00 0.00 0.00 0.00 0.00 0.00 0.00347 Agricultural Implements 0.00 0.00 0.00 0.00 0.00 0.00 0.00 0.00 0.00 0.00349 Birds 0.00 0.00 0.00 0.00 0.00 0.00 0.00 0.00 0.00 0.00351 Uniform Charges 0.00 0.00 0.00 0.00 0.00 0.00 0.00 0.00 0.00 0.00352 Fee Compensation 0.00 0.00 0.00 0.00 0.00 0.00 0.00 0.00 0.00 0.00
353Bonus for Sandalwood Extracted from Private Holdings 0.00 0.00 0.00 0.00 0.00 0.00 0.00 0.00 0.00 0.00
354 Telephone Charges - Council of Ministers 0.00 0.00 0.00 0.00 0.00 0.00 0.00 0.00 0.00 0.00360 Legal Assistance 0.00 0.00 0.00 0.00 0.00 0.00 0.00 0.00 0.00 0.00
362Committees, Conferences, Seminars, Tribunals Etc., 0.00 2.37 0.00 0.00 0.00 0.00 0.00 0.00 0.00 0.00
15

STATEMENT ‐ VIIIAnalysis of Consolidated Fund (` in Lakhs)
Plan Non-Plan Plan Non-Plan Plan Non-Plan Plan Non-Plan Plan Non-PlanObj Hd ITEM 2003-04 2004-05 2005-06 2006-07 2007-08
363 Exhibitions 0.00 0.00 0.00 0.00 0.00 0.00 0.00 0.00 0.00 0.00364 Deduct - Recoveries -151.41 -124.92 -100.64 -16.26 -70.09 -1013.45 -35.08 -432.74 -1.53 -2293.35
365
Reimbursement of Charges on Account of Related Instructions, Shop Floor and Basic Training 0.00 0.00 0.00 0.00 0.00 0.00 0.00 0.00 0.00 0.00
368 Civil Works 0.00 0.00 0.00 0.00 0.00 0.00 0.00 0.00 0.00 0.00
369Deduct - Amount Transferred to Other Departments/Govts. etc 0.00 0.00 0.00 0.00 0.00 0.00 0.00 0.00 0.00 0.00
370 Cost of Security Force of Police 0.00 0.00 0.00 0.00 0.00 0.00 0.00 0.00 0.00 0.00
371Reimbursement of Sales Tax on Tickets Sold Outside the State 0.00 0.00 0.00 0.00 0.00 0.00 0.00 0.00 0.00 0.00
372 Feed 0.00 0.00 0.00 0.00 0.00 0.00 0.00 0.00 0.00 0.00373 Nutrition 0.00 0.00 0.00 0.00 0.00 0.00 0.00 0.00 0.00 0.00
378Deduct - Amount Transferred to 4701 Capital Outlay on Major & Medium Irrigation 0.00 0.00 0.00 0.00 0.00 0.00 0.00 0.00 0.00 0.00
381 Normal 530.91 0.00 206.01 0.00 374.35 0.00 0.00 0.00 0.00 0.00
383Honorarium to Doctors for Distinguished Services 0.00 0.00 0.00 0.00 0.00 0.00 0.00 0.00 0.00 0.00
385 Conservation 0.00 0.00 0.00 0.00 0.00 0.00 0.00 0.00 0.00 0.00386 Construction 18665.96 1684.80 12394.03 0.00 13656.95 0.00 37007.44 0.00 69715.12 0.00390 Sports & Games 0.71 0.00 0.00 0.00 0.00 0.00 0.00 0.00 0.00 0.00392 Purchase of Samples of Drugs for Testing 0.00 0.00 0.00 0.00 0.00 0.00 0.00 0.00 0.00 0.00393 Advances 28.43 124.29 11.06 664.35 3.75 226.01 3.75 184.54 7.50 29.21394 Loans 13858.66 11269.42 14440.32 12143.98 28030.25 4115.88 24088.67 427.26 52483.59 202.45395 Loans to PSUs & Local Bodies 75717.07 0.00 33367.17 0.00 6779.23 23.88 6431.84 4500.00 21828.29 300.00396 Construction 0.00 0.00 0.00 0.00 0.00 0.00 0.00 0.00 0.00 0.00422 Special Component Plan 13684.29 48.81 14207.68 0.00 15804.25 0.00 13997.62 0.00 36268.93 0.00423 Tribal Sub Plan 1596.70 3.42 3553.27 -0.10 4311.51 0.00 5988.35 0.00 15793.96 0.00424 Rural Water Supply Schemes 0.00 0.00 0.00 0.00 0.00 0.00 0.00 0.00 0.00 0.00426 Rural Sanitation 0.00 0.00 0.00 0.00 0.00 0.00 0.00 0.00 0.00 0.00427 Rehabilitation 0.00 0.00 0.00 0.00 0.00 0.00 0.00 0.00 0.00 0.00428 Insurance 0.00 0.00 0.00 0.00 0.00 0.00 0.00 0.00 0.00 0.00430 Cost of Stamps 0.00 0.00 0.00 0.00 0.00 0.24 0.00 0.00 0.00 0.00431 House Sites 0.00 0.00 0.00 0.00 0.00 0.00 0.00 0.00 0.00 0.00433 Examination Expenses 0.00 0.00 0.00 142.77 0.00 360.31 0.00 498.61 0.00 346.89434 Transporation Charges 0.00 0.00 0.00 0.00 0.00 0.00 0.00 0.00 0.00 0.00436 NABARD Works 7117.52 0.00 14608.90 0.00 14037.76 0.00 23237.51 0.00 35402.68 0.00442 Deduct - SCP Pooled Upfront 0.00 0.00 0.00 0.00 0.00 0.00 0.00 0.00 0.00 0.00
16

STATEMENT ‐ VIIIAnalysis of Consolidated Fund (` in Lakhs)
Plan Non-Plan Plan Non-Plan Plan Non-Plan Plan Non-Plan Plan Non-PlanObj Hd ITEM 2003-04 2004-05 2005-06 2006-07 2007-08
443 Deduct - TSP Pooled Upfront 0.00 0.00 0.00 0.00 0.00 0.00 0.00 0.00 0.00 0.00459 Capital Expenditure -91.43 0.00 -5.41 -87.38 0.00 0.00 0.00 0.00 0.00 0.00495 Loans to Co-operative Societies 33.25 0.00 14.38 0.00 1.00 0.00 0.00 0.00 0.00 0.00500 Lumpsum - State 8295.67 34.24 0.00 0.00 5.21 57.77 0.00 0.00 22.00 0.00
593603.14 1980380.81 834924.48 1741867.56 842914.41 1514196.39 1350834.12 1832483.09 1312739.70 2167642.15
B.District Sector of which 120135.06 319018.12 163095.72 351807.99 250710.17 395916.82 284333.56 486890.47 281014.26 621412.301.Salary
PO 1127.86 8154.05 902.21 8242.52 1032.58 8633.21 1353.24 9176.16 1235.28 19226.37PS 8905.07 147736.47 9556.81 150326.39 9876.69 158645.76 12482.37 162053.51 11364.01 350877.46IR 0.00 0.00 0.00 0.00 0.00 0.00 3412.00 17123.00 0.00 0.00DA 5819.09 90414.36 6484.60 98313.12 7913.97 117091.34 11069.00 136984.00 11339.37 59216.61OA 759.41 9700.14 1056.38 10869.19 841.26 12966.55 1933.36 16447.10 2294.52 34308.47MA 0.00 0.00 0.00 0.00 0.00 0.00 0.00 0.00 0.00 0.00
Total-1 16611.43 256005.02 18000.00 267751.22 19664.50 297336.86 30249.97 341783.77 26233.18 463628.91
201 GIA for ZP 60715.10 257.19 22911.24 13.81 0.00 15.09 0.00 10.09 0.00 13.72300 Lumpsum - ZP 16837.88 0.33 40746.33 302.76 19045.25 1634.11 18609.48 8705.18 28221.15 15389.29401 Bangalore (Urban) 1259.92 20287.22 3020.52 20018.82 6986.03 22629.59 8669.15 26629.02 9461.45 32471.83402 Bangalore (Rural) 1705.31 10835.11 4947.99 15804.97 9688.83 16213.92 10472.09 19610.70 10110.07 26509.18403 Chitradurga 4094.02 11479.55 4196.99 12671.74 8609.42 13988.25 10032.60 17343.37 8868.96 21347.87404 Kolar 1820.22 14012.42 5344.73 18339.41 11525.02 20958.23 13003.80 25522.52 13229.60 32747.11405 Shimoga 1364.88 13541.42 3276.59 13488.82 8659.55 14054.91 11286.87 16560.45 10750.35 22017.51406 Tumkur 2701.50 20234.47 4596.91 22172.89 12826.50 23923.36 14247.65 30218.85 14324.07 34288.16407 Mysore 1689.83 14276.91 3717.46 15776.12 10025.66 17628.60 12084.38 20875.97 12081.33 27130.17408 Chickmagalore 1305.19 9471.72 3106.24 13138.84 7660.41 12167.87 8424.31 13461.42 7646.02 16626.80409 Dakshina Kannada 1099.11 10335.73 2675.56 12015.59 6934.23 12090.67 8176.85 13881.79 7895.49 17792.31410 Hassan 1513.15 13973.92 3622.89 14850.76 8878.19 17006.90 10656.48 19435.75 10764.37 27207.27411 Kodagu 1156.71 3889.72 2120.74 3977.82 3805.49 5042.50 3937.14 7763.74 3749.25 7057.26412 Mandya 2099.62 12753.84 4887.54 12554.78 8268.49 17438.04 9443.37 18026.73 9321.89 21373.73413 Belgaum 3046.78 22025.98 6256.70 29289.73 17407.66 31850.69 19183.22 38477.78 18431.86 52786.22414 Bijapur 1359.05 12492.31 3205.44 11742.53 9081.11 15460.49 10139.09 18087.73 9928.86 22393.39415 Dharwar 992.68 8780.07 2798.23 10040.00 6064.02 10905.64 7144.03 12866.40 6089.82 16930.65416 Uttara Kannada 1249.91 12399.55 3434.39 12983.46 8630.56 14639.45 10030.25 17473.68 8918.50 22868.89417 Gulbarga 2525.79 20342.26 6109.01 19384.93 14090.97 25226.66 16587.23 32349.86 16126.99 44792.10418 Bellary 1476.17 10969.43 3769.31 11453.43 8907.31 12238.87 10262.28 15622.13 9083.15 19827.65419 Bidar 1150.31 11716.14 4182.81 11715.86 7669.15 13289.94 8089.16 18000.40 7794.78 20110.25
Total 3. Others
17

STATEMENT ‐ VIIIAnalysis of Consolidated Fund (` in Lakhs)
Plan Non-Plan Plan Non-Plan Plan Non-Plan Plan Non-Plan Plan Non-PlanObj Hd ITEM 2003-04 2004-05 2005-06 2006-07 2007-08
420 Raichur 1364.16 7060.12 3515.40 7762.62 8521.97 8749.23 9743.01 10973.07 8916.36 14393.38421 Yadgir 0.00 0.00 0.00 0.00 0.00 0.00 0.00 0.00 0.00 0.00422 SCP423 TSP451 Davanagere 1325.38 12435.74 4438.98 13259.74 8652.47 13931.98 10017.03 17339.89 9873.20 22317.57452 Ramanagara 0.00 0.00 0.00 0.00 0.00 0.00 0.00 0.00 0.00 0.00453 Chickkaballabur 0.00 0.00 0.00 0.00 0.00 0.00 0.00 0.00 0.00 0.00456 Chamarajanagar 1071.58 5776.88 3105.82 5751.43 5503.22 6682.04 6363.10 8931.53 5561.09 9804.39457 Udupi 742.38 8693.84 1981.03 7953.50 4771.40 9375.98 5428.91 11704.68 4634.89 13003.72461 Bagalkot 1553.60 8054.86 3311.31 10863.21 8500.87 11036.91 9539.41 13943.69 9102.02 17686.24462 Gadag 917.38 7021.09 2151.50 7156.96 5408.52 8512.28 6103.05 9813.28 5178.98 12447.16463 Haveri 934.72 9758.64 2471.13 10523.80 7611.39 11412.42 8549.36 14260.48 7828.61 18259.38466 Koppal 1062.73 6141.66 3192.93 6799.66 6976.48 7812.20 8110.26 9000.29 7121.15 11819.10
120135.06 319018.12 163095.72 351807.99 250710.17 395916.82 284333.56 486890.47 281014.26 621412.30Less Salary 16611.43 256005.02 18000.00 267751.22 19664.50 297336.86 30249.97 341783.77 26233.18 463628.91Total-2 103523.63 63013.10 145095.72 84056.77 231045.67 98579.96 254083.59 145106.70 254781.08 157783.39
Consolidated Fund (Total-A+Total B) 738013.21 2726823.96 1019384.56 2551530.28 1113101.72 2384226.52 1656943.12 2751516.58 1626304.36 3184618.01(P+NP) 4408459.70 4810922.373464837.17 3570914.84 3497328.24
18

STATEMENT ‐ VIIIAnalysis of Consolidated Fund (` in Lakhs)
A.State Sector of which002 Pay-Officers003 Pay-Staff004 Interim Relief011 Dearness Allowance014 Other Allowance020 Medical Allowance
2. Administrative Expenditure015 Subsidiary Expenses021 Reimbursement of Medical Expenses
029Establishment Charges Transferred From 2701 Major & Meadium Irrigation
031 Wages041 Travel Expenses
046Conveyance Allowance of Parliamentary Functionaries
050 Office Expenses051 General Expenses052 Telephone Charges053 Purchase of Furniture and Fixture for Office058 Electricity and Water Charges060 Other Charges062 Allowances to Witnesses and Prosecutors063 Remuneration
064 Payment for Professional and Special Services065 Commission to Official Stamp Vendors070 Rent for A.N.M Hostels071 Building Expenses072 Rents,Rates and Taxes075 Libraries and Periodicals080 Publicity Expenses081 Publications084 Publicity and Advertisements091 Advertising, Sales and Publicity092 Publicity & Propaganda093 Publication and Hoardings094 Printing Charges
Obj Hd
Total 1. Salary
ITEMPlan Non-Plan Plan Non-Plan Plan Non-Plan Plan Non-Plan
1664358.20 2659305.82 2083139.57 3075793.12 2415375.84 3526194.51 2975283.10 4061308.304838.94 32075.25 6109.25 34900.14 13152.93 58738.37 22226.41 74950.73
14438.02 240909.42 15775.29 234893.59 10954.79 212114.72 13434.13 219690.250.00 0.00 0.00 0.00 0.00 0.00 0.00 0.00
5271.91 70582.32 9409.18 102468.12 15010.89 150535.95 24440.77 205872.672083.33 38924.86 2413.21 33825.39 3476.17 74177.13 5012.50 145324.75
0.00 0.00 63.70 1159.26 78.47 1152.14 83.00 1291.6326632.20 382491.85 33770.63 407246.50 42673.25 496718.31 65196.81 647130.03
7928.46 11489.71 4721.08 23142.31 4410.68 19524.59 5754.33 20657.210.00 0.00 152.74 5966.28 407.84 4500.12 404.91 4453.00
1275.34 0.00 0.00 1447.70 0.00 0.00 0.00 0.000.00 0.00 0.00 0.00 0.00 0.00 0.00 0.00
415.97 8948.07 435.64 10796.85 688.50 11774.21 747.18 11531.12
0.00 0.00 0.00 0.00 0.00 0.00 0.00 0.000.00 0.00 0.00 0.00 0.00 0.00 0.00 0.00
7366.45 19176.07 9741.69 17809.72 18828.31 23729.85 23016.98 22584.3964.72 883.02 92.96 904.96 166.15 1403.83 172.72 1407.4822.24 215.47 28.07 294.07 79.55 369.71 154.00 368.05
0.00 0.00 0.00 0.00 0.00 0.00 0.00 0.000.00 0.00 0.00 0.00 0.00 0.00 0.00 0.000.00 0.00 0.00 0.00 0.00 0.00 0.00 0.000.00 0.00 0.00 0.00 0.00 0.00 0.00 0.00
0.00 0.00 0.00 0.00 0.00 0.00 0.00 0.000.00 0.00 0.00 0.00 0.00 0.00 0.00 0.000.00 0.00 0.00 0.00 0.00 0.00 0.00 0.00
1067.17 8784.69 579.25 8985.10 1506.91 10796.06 1162.76 10871.940.00 0.00 0.00 0.00 0.00 0.00 0.00 0.000.00 0.00 0.00 0.00 0.00 0.00 0.00 0.000.00 0.00 0.00 0.00 0.00 0.00 0.00 0.000.00 0.00 0.00 0.00 0.00 0.00 0.00 0.000.00 0.00 0.00 0.00 0.00 0.00 0.00 0.000.00 0.00 0.00 0.00 0.00 0.00 0.00 0.000.00 0.00 0.00 0.00 0.00 0.00 0.00 0.000.00 0.00 0.00 0.00 0.00 0.00 0.00 0.000.00 0.00 0.00 0.00 0.00 0.00 0.00 0.00
2011-12 BE2008-09 2009-10 2010-11 RE
19

STATEMENT ‐ VIIIAnalysis of Consolidated Fund (` in Lakhs)
Obj Hd ITEM
096 Purchase of Stationery - Govt. Press130 Tender Bulletin Expenses131 Secret Service Expenses136 Preliminary Expenses190 Motor Vehicles191 Fuel and Oil Expenses192 Repairs of Motor Vehicles193 Purchase of New Motor Vehicles195 Transport Expenses299 Prize Money306 Cash and Incentive Awards310 Payment of Commission to Agents384 Award
3. Others001 Consolidated Salaries
028Establishment Charges - transferred from 2059 Public Works
030Establishment Charges Transferred From 2702-Minor Irrigation
059 Other Expenses095 Text Books100 Financial Assistance/Relief101 Grants-in-Aid102 Special Grants103 Assistance in Kind104 Contributions105 Contributions to Provident Fund106 Subsidies108 Contributions to Band Fund109 Rebate110 Compensations111 Scholorships and Stipends112 Stipends113 Scholarships114 Ration117 Scholarships & Incentives120 Hospitality Expenses
Total 2. Administrative Expenditure
Plan Non-Plan Plan Non-Plan Plan Non-Plan Plan Non-Plan2011-12 BE2008-09 2009-10 2010-11 RE
0.00 0.00 0.00 0.00 0.00 0.00 0.00 0.000.00 0.00 0.00 0.00 0.00 0.00 0.00 0.000.00 0.00 0.00 0.00 0.00 0.00 0.00 0.000.00 0.00 0.00 0.00 0.00 0.00 0.00 0.000.00 0.00 0.00 0.00 0.00 0.00 0.00 0.000.00 0.00 0.00 0.00 0.00 0.00 0.00 0.000.00 0.00 0.00 0.00 0.00 0.00 0.00 0.000.00 0.00 0.00 0.00 0.00 0.00 0.00 0.00
644.36 14134.56 637.48 13099.70 868.43 15963.86 1151.39 15904.880.00 0.00 0.00 0.00 0.00 0.00 0.00 0.000.00 0.00 0.00 0.00 0.00 0.00 0.00 0.000.00 0.00 0.00 0.00 0.00 0.00 0.00 0.000.00 0.00 0.00 0.00 0.00 0.00 0.00 0.00
18784.71 63631.59 16388.91 82446.69 26956.37 88062.23 32564.27 87778.07
0.00 805.63 0.00 1721.00 33.77 1418.31 538.26 65146.24
0.00 0.00 0.00 0.00 0.00 0.00 0.00 0.00
0.00 0.00 0.00 0.00 0.00 0.00 0.00 0.00314482.92 24842.57 401636.69 30111.47 398825.03 117250.04 491000.05 135546.20
0.00 0.00 0.00 0.00 0.00 0.00 0.00 0.00104810.54 218124.15 100941.27 392679.24 124553.42 244629.29 45561.79 55431.72
70345.75 116384.37 75775.86 147732.49 125126.93 166836.84 187257.82 241800.720.00 0.00 0.00 0.00 13163.02 66131.00 2716.92 250.000.00 0.00 0.00 0.00 0.00 0.00 0.00 0.00
1294.95 185224.42 893.78 15296.82 865.00 215365.18 666.28 15495.530.00 0.00 0.00 0.00 0.00 0.00 0.00 0.00
46440.35 293474.73 42940.67 368873.60 57198.09 505394.90 79730.22 544509.940.00 0.00 0.00 0.00 67.98 0.00 0.00 0.000.00 0.00 0.00 0.00 0.00 0.00 0.00 0.000.00 0.00 0.00 0.00 0.00 0.00 0.00 0.000.00 0.00 0.00 0.00 0.00 0.00 0.00 0.000.00 0.00 0.00 0.00 0.00 0.00 0.00 0.000.00 0.00 0.00 0.00 0.00 0.00 0.00 0.000.00 0.00 0.00 0.00 0.00 0.00 0.00 0.00
2204.17 1991.33 4755.59 1874.58 10417.87 2687.78 9864.95 2582.410.00 0.00 0.00 0.00 0.00 0.00 0.00 0.00
20

STATEMENT ‐ VIIIAnalysis of Consolidated Fund (` in Lakhs)
Obj Hd ITEM
121 Sumptuary Allowances122 Entertainment Allowances123 General Elections124 Bye Elections125 Modernisation126 Terminal Leave Benefits127 Repayment of Internal Debt128 Repayment of Central Debt129 Assistance for Repayments132 Capital Expenses133 Special Development Plan137 Survey139 Major Works140 Minor Works141 Works142 Buildings145 Acquisition of Land146 Infrastructure147 Land & Buildings150 Repairs151 Maintenance and Repairs152 Special Repairs154 Extensions & Improvements
155Construction of Wharfs, Jetties & Other Facilities
158 Navigational Aids160 Renewals161 Furnishings162 Purchase of Seed Cocoons165 Reservoir166 Dam & Appurtenant Works167 Canals & Branches - Normal169 Distributaries - Normal171 Water Courses172 Roads173 Bridges174 Land Drainages177 Computer Software
Plan Non-Plan Plan Non-Plan Plan Non-Plan Plan Non-Plan2011-12 BE2008-09 2009-10 2010-11 RE
0.00 0.00 0.00 0.00 0.00 0.00 0.00 0.000.00 0.00 0.00 0.00 0.00 0.00 0.00 0.000.00 0.00 0.00 0.00 0.00 0.00 0.00 0.000.00 0.00 0.00 0.00 0.00 0.00 0.00 0.00
3144.75 8405.19 6684.69 9574.02 7029.08 15658.31 7347.75 22290.220.00 0.00 0.00 0.00 0.00 0.00 0.00 0.000.00 0.00 0.00 0.00 0.00 0.00 0.00 0.000.00 0.00 0.00 0.00 0.00 0.00 0.00 0.000.00 0.00 0.00 0.00 0.00 0.00 0.00 0.00
370378.53 1548.77 299680.02 1160.04 340879.84 2046.64 348117.40 1551.2428530.00 0.00 139928.42 0.00 159804.75 0.00 238263.56 0.00
0.00 0.00 0.00 0.00 0.00 0.00 0.00 0.00107158.92 4598.49 148177.24 5094.29 158237.57 9293.54 234180.80 14682.17
1777.00 0.00 396.39 0.00 450.00 0.00 450.00 0.000.00 0.00 0.00 0.00 0.00 0.00 0.00 0.000.00 0.00 0.00 0.00 0.00 0.00 0.00 0.000.00 0.00 0.00 0.00 0.00 0.00 0.00 0.000.00 0.00 0.00 0.00 0.00 0.00 0.00 0.00
821.25 1229.33 1151.12 1325.68 1129.50 1406.86 1944.50 1455.120.00 0.00 0.00 0.00 0.00 0.00 0.00 0.000.00 0.00 0.00 0.00 0.00 0.00 0.00 0.000.00 0.00 0.00 0.00 0.00 0.00 0.00 0.000.00 0.00 0.00 0.00 0.00 0.00 0.00 0.00
0.00 0.00 0.00 0.00 0.00 0.00 0.00 0.000.00 0.00 0.00 0.00 0.00 0.00 0.00 0.000.00 0.00 0.00 0.00 0.00 0.00 0.00 0.000.00 0.00 0.00 0.00 0.00 0.00 0.00 0.000.00 0.00 0.00 0.00 0.00 0.00 0.00 0.000.00 0.00 0.00 0.00 0.00 0.00 0.00 0.000.00 0.00 0.00 0.00 0.00 0.00 0.00 0.000.00 0.00 0.00 0.00 0.00 0.00 0.00 0.000.00 0.00 0.00 0.00 0.00 0.00 0.00 0.000.00 0.00 0.00 0.00 0.00 0.00 0.00 0.00
151596.37 0.00 138533.69 0.00 156041.22 10000.00 127037.69 10000.000.00 0.00 0.00 0.00 0.00 0.00 0.00 0.000.00 0.00 0.00 0.00 0.00 0.00 0.00 0.000.00 0.00 0.00 0.00 0.00 0.00 0.00 0.00
21

STATEMENT ‐ VIIIAnalysis of Consolidated Fund (` in Lakhs)
Obj Hd ITEM
180 Machinery and Equipment
181Machinery & Equipment - Transferred from 2059 Public Works
182 Repairs and Carriages
185Machinery & Equipments Transferred from 2702 Minor Irrigation
200 Maintenance201 GIA for ZP211 Investment221 Materials and Supplies222 Drugs and Chemicals223 Chemicals and Glassware224 Raw Materials225 New Supplies
226Cost of Materials and Equipment supplied by GOI
229 Equipments and Clothing230 Hospital Accessaries231 Bedding and Clothing234 Diet Expenses235 X-Ray Films236 Equipment Charges237 Raw Material - Training Section240 Debt Servicing241 Interest243 Interest on Capital250 Pensionary Charges251 Pension & Retirement Benefits252 Commuted Value of Pensions253 Compassionate Allowances254 D.C.R.G261 Inter Account Transfers271 Depreciation272 Transfer to Depreciation Reserve Fund291 Suspense292 Stock Debits293 M P W A Debits294 Stock Credits295 M P W A Credits
Plan Non-Plan Plan Non-Plan Plan Non-Plan Plan Non-Plan2011-12 BE2008-09 2009-10 2010-11 RE
1530.79 1633.20 1049.68 1399.10 5252.93 2350.34 4600.82 2410.91
0.00 0.00 0.00 0.00 0.00 0.00 0.00 0.00150.61 528.00 122.94 452.05 232.00 715.14 233.00 723.52
0.00 0.00 0.00 0.00 0.00 0.00 0.00 0.004970.68 58360.45 7759.91 54804.73 7713.48 62443.66 8306.02 102696.81
0.00 17.81 0.00 20.69 0.00 21.51167003.71 0.00 262369.19 0.00 267120.60 0.00 135508.47 0.00
6736.38 6750.59 2368.56 6355.89 4634.22 9179.74 2586.23 8847.65883.12 13103.10 1227.57 12368.41 1098.80 13277.50 2874.38 13775.28
0.00 0.00 0.00 0.00 0.00 0.00 0.00 0.000.00 0.00 0.00 0.00 0.00 0.00 0.00 0.001.00 0.00 0.00 0.00 18.00 0.00 18.00 0.00
0.00 0.00 0.00 0.00 0.00 0.00 0.00 0.000.00 0.00 0.00 0.00 0.00 0.00 0.00 0.00
18.17 778.59 49.57 910.00 81.21 887.65 94.50 910.260.00 0.00 0.00 0.00 0.00 0.00 0.00 0.00
13.97 1419.59 16.89 1677.63 32.00 2766.71 32.00 2877.520.00 0.00 0.00 0.00 0.00 0.00 0.00 0.000.00 0.00 0.00 0.00 0.00 0.00 0.00 0.000.00 0.00 0.00 0.00 0.00 0.00 0.00 0.00
5359.95 707664.13 4096.62 852001.28 3873.00 909512.78 3006.00 1264513.720.00 0.00 0.00 0.00 0.00 0.00 0.00 0.000.00 69.72 0.00 75.87 0.00 92.92 0.00 95.960.18 70.55 0.15 83.68 0.14 109.03 0.14 113.15
19863.47 477532.77 30462.09 402545.81 18984.00 512745.94 14295.02 637770.280.00 0.00 0.00 0.00 0.00 0.00 0.00 0.000.00 0.00 0.00 0.00 0.00 0.00 0.00 0.000.00 0.00 0.00 0.00 0.00 0.00 0.00 0.00
-31662.05 40736.08 -44112.56 271005.32 -244994.44 66561.75 -55540.00 58796.000.00 3.70 0.00 1.93 0.00 4.64 0.00 4.710.00 0.00 0.00 0.00 0.00 0.00 0.00 0.000.00 0.00 0.00 0.00 0.00 0.00 0.00 0.000.00 0.74 0.00 0.68 0.00 10473.43 0.00 10891.850.00 3.39 0.00 10.20 500.00 2623.66 500.00 2873.970.00 -148.62 0.00 -40.23 0.00 -10473.42 0.00 -11475.23
-461.74 -196.98 -28.82 -31.02 -500.00 -2623.87 -500.00 -2874.21
22

STATEMENT ‐ VIIIAnalysis of Consolidated Fund (` in Lakhs)
Obj Hd ITEM
296 Stock297 Miscellaneous Works Advances298 Ex-Gratia301 Medical Charges302 Library Charges303 Remuneration to Shanbhogues and Patels304 Remuneration to Gramasahayakas307 Dieting and Moving charges308 Feed and Fodder309 Livestock and Fodder312 M.O. Commission for Pension Payments
313Equipments and Apparatus (including computers)
314 Laboratory Charges316 Rewards317 Training
318 Repairs and Miscellaneous (Training Section)
320 Repairs and Miscellaneous (Workshop Section)321 Labour (Workshop Section)323 Capitation Grant324 Honorarium326 Boarding Charges336 Animals338 Agricultural Inputs339 Programmes342 Purchase of Books346 Maintenance of Cattle347 Agricultural Implements349 Birds351 Uniform Charges352 Fee Compensation
353Bonus for Sandalwood Extracted from Private Holdings
354 Telephone Charges - Council of Ministers360 Legal Assistance
362Committees, Conferences, Seminars, Tribunals Etc.,
Plan Non-Plan Plan Non-Plan Plan Non-Plan Plan Non-Plan2011-12 BE2008-09 2009-10 2010-11 RE
-0.93 -0.15 -2.45 -2.34 0.00 0.00 0.00 0.00-2.57 -1.46 1.80 -1.01 0.00 0.00 0.00 0.000.00 0.00 0.00 0.00 0.00 0.00 0.00 0.000.00 0.00 0.00 0.00 0.00 0.00 0.00 0.000.00 0.00 0.00 0.00 0.00 0.00 0.00 0.000.00 0.00 0.00 0.00 0.00 0.00 0.00 0.000.00 0.00 0.00 0.00 0.00 0.00 0.00 0.000.00 0.00 0.00 0.00 0.00 0.00 0.00 0.000.00 0.00 0.00 0.00 0.00 0.00 0.00 0.000.00 0.00 0.00 0.00 0.00 0.00 0.00 0.000.00 0.00 0.00 0.00 0.00 0.00 0.00 0.00
0.00 0.00 0.00 0.00 0.00 0.00 0.00 0.000.00 0.00 0.00 0.00 0.00 0.00 0.00 0.000.00 0.00 0.00 0.00 0.00 0.00 0.00 0.000.00 0.00 0.00 0.00 0.00 0.00 0.00 0.00
0.00 0.00 0.00 0.00 0.00 0.00 0.00 0.00
0.00 0.00 0.00 0.00 0.00 0.00 0.00 0.000.00 0.00 0.00 0.00 0.00 0.00 0.00 0.000.00 0.00 0.00 0.00 0.00 0.00 0.00 0.000.00 0.00 0.00 0.00 0.00 0.00 0.00 0.000.00 0.00 0.00 0.00 0.00 0.00 0.00 0.000.00 0.00 0.00 0.00 0.00 0.00 0.00 0.000.00 0.00 0.00 0.00 0.00 0.00 0.00 0.000.00 0.00 0.00 0.00 0.00 0.00 0.00 0.000.00 0.00 0.00 0.00 0.00 0.00 0.00 0.000.00 0.00 0.00 0.00 0.00 0.00 0.00 0.000.00 0.00 0.00 0.00 0.00 0.00 0.00 0.000.00 0.00 0.00 0.00 0.00 0.00 0.00 0.000.00 0.00 0.00 0.00 0.00 0.00 0.00 0.000.00 0.00 0.00 0.00 0.00 0.00 0.00 0.00
0.00 0.00 0.00 0.00 0.00 0.00 0.00 0.000.00 0.00 0.00 0.00 0.00 0.00 0.00 0.000.00 0.00 0.00 0.00 0.00 0.00 0.00 0.00
0.00 0.00 0.00 0.00 0.00 0.00 0.00 0.00
23

STATEMENT ‐ VIIIAnalysis of Consolidated Fund (` in Lakhs)
Obj Hd ITEM
363 Exhibitions364 Deduct - Recoveries
365
Reimbursement of Charges on Account of Related Instructions, Shop Floor and Basic Training
368 Civil Works
369Deduct - Amount Transferred to Other Departments/Govts. etc
370 Cost of Security Force of Police
371Reimbursement of Sales Tax on Tickets Sold Outside the State
372 Feed373 Nutrition
378Deduct - Amount Transferred to 4701 Capital Outlay on Major & Medium Irrigation
381 Normal
383Honorarium to Doctors for Distinguished Services
385 Conservation386 Construction390 Sports & Games392 Purchase of Samples of Drugs for Testing393 Advances394 Loans395 Loans to PSUs & Local Bodies396 Construction422 Special Component Plan423 Tribal Sub Plan424 Rural Water Supply Schemes426 Rural Sanitation427 Rehabilitation428 Insurance430 Cost of Stamps431 House Sites433 Examination Expenses434 Transporation Charges436 NABARD Works442 Deduct - SCP Pooled Upfront
Plan Non-Plan Plan Non-Plan Plan Non-Plan Plan Non-Plan2011-12 BE2008-09 2009-10 2010-11 RE
0.00 0.00 0.00 0.00 0.00 0.00 0.00 0.00-0.71 -3582.64 0.00 -138.76 -0.01 -0.01 -0.01 -0.01
0.00 0.00 0.00 0.00 0.00 0.00 0.00 0.000.00 0.00 0.00 0.00 0.00 0.00 0.00 0.00
0.00 0.00 0.00 0.00 0.00 0.00 0.00 0.000.00 0.00 0.00 0.00 0.00 0.00 0.00 0.00
0.00 0.00 0.00 0.00 0.00 0.00 0.00 0.000.00 0.00 0.00 0.00 0.00 0.00 0.00 0.000.00 0.00 0.00 0.00 0.00 0.00 0.00 0.00
0.00 0.00 0.00 0.00 0.00 0.00 0.00 0.000.00 0.00 0.00 0.00 0.00 0.00 0.00 0.00
0.00 0.00 0.00 0.00 0.00 0.00 0.00 0.000.00 0.00 0.00 0.00 0.00 0.00 0.00 0.00
79791.03 0.01 78856.99 250.01 80476.35 320.00 80888.43 520.000.00 0.00 0.00 0.00 0.00 0.00 0.00 0.000.00 0.00 0.00 0.00 0.00 0.00 0.00 0.003.75 256.04 3.79 508.08 200.00 807.00 200.00 582.00
12319.89 50519.75 28657.34 6008.00 116705.83 1100.00 65860.99 8500.008477.90 0.00 53581.22 0.00 82393.00 0.00 118832.67 0.00
0.00 0.00 0.00 0.00 0.00 0.00 0.00 0.0053318.27 0.00 138513.26 0.00 310336.28 0.00 439258.20 5354.8722928.16 0.00 49824.00 0.00 134909.14 0.00 180300.73 0.00
0.00 0.00 0.00 0.00 0.00 0.00 0.00 0.000.00 0.00 0.00 0.00 0.00 0.00 0.00 0.000.00 0.00 0.00 0.00 0.00 0.00 0.00 0.000.00 0.00 0.00 0.00 0.00 0.00 0.00 0.000.00 0.00 0.00 0.00 0.00 0.00 0.00 0.000.00 0.00 0.00 0.00 0.00 0.00 0.00 0.000.00 1052.85 0.00 393.58 0.00 800.00 0.00 832.000.00 0.00 0.00 0.00 0.00 0.00 0.00 0.00
64712.76 0.00 56666.86 0.00 80373.18 0.00 78691.44 0.000.00 0.00 0.00 0.00 -61720.00 0.00 -70000.00 0.00
24

STATEMENT ‐ VIIIAnalysis of Consolidated Fund (` in Lakhs)
Obj Hd ITEM
443 Deduct - TSP Pooled Upfront459 Capital Expenditure495 Loans to Co-operative Societies500 Lumpsum - State
B.District Sector of which1.Salary
POPSIRDAOAMA
Total-1
201 GIA for ZP300 Lumpsum - ZP401 Bangalore (Urban)402 Bangalore (Rural)403 Chitradurga404 Kolar405 Shimoga406 Tumkur407 Mysore408 Chickmagalore409 Dakshina Kannada410 Hassan411 Kodagu412 Mandya413 Belgaum414 Bijapur415 Dharwar416 Uttara Kannada417 Gulbarga418 Bellary419 Bidar
Total 3. Others
Plan Non-Plan Plan Non-Plan Plan Non-Plan Plan Non-Plan2011-12 BE2008-09 2009-10 2010-11 RE
0.00 0.00 0.00 0.00 -18280.00 -400.00 -30000.00 0.000.00 0.00 0.00 0.00 0.00 0.00 0.00 0.000.00 0.00 0.00 0.00 2483.44 0.00 0.00 0.000.00 0.00 0.00 0.00 0.00 0.00 0.00 0.00
1618941.29 2213182.38 2032980.03 2586099.93 2345746.22 2941413.97 2754725.02 3219504.03
324558.11 755659.85 350568.02 786850.48 442824.36 843306.99 489164.95 1006119.35
3016.80 21209.83 3662.06 20552.29 4199.03 23163.50 4520.08 23203.3226330.56 377155.51 31223.12 344263.88 33708.36 356275.00 36667.39 358083.71
0.00 0.00 0.00 0.00 0.00 0.00 0.00 0.008070.53 109550.47 13256.37 138630.14 18953.70 189719.25 28831.23 266900.923305.59 35213.99 3331.59 33701.97 5074.57 42165.38 5550.81 56288.86
0.00 0.00 0.00 0.00 162.52 1120.20 176.31 1646.2740723.48 543129.80 51473.14 537148.28 62098.18 612443.33 75745.82 706123.08
208.50 14.99 0.00 0.00 0.00 0.00 0.00 0.0037790.94 17524.38 31649.64 22695.18 40277.07 20000.00 99208.57 86650.00
9747.55 39374.32 10263.98 38020.18 12657.79 40491.99 12454.39 46077.485924.21 14638.14 6242.53 14672.83 7294.35 14975.43 6735.65 16872.87
10505.36 27327.10 11079.81 26439.45 13907.81 28595.08 12703.33 32361.707640.15 23196.31 8460.48 21298.13 10597.43 23990.22 9249.40 27543.47
11045.65 25228.90 13727.20 26165.59 16097.96 27976.48 13955.36 31460.8717703.72 40521.84 18265.17 42099.99 24115.33 46531.35 22669.10 50850.0811842.65 31592.13 13606.40 32040.92 17613.02 34449.04 16444.58 39884.96
8843.05 20502.85 9268.66 21132.27 11094.88 22661.05 11005.53 25734.308998.57 21235.66 9797.34 21546.36 11789.66 23343.76 10793.88 26227.63
10470.64 31629.44 12197.03 32982.81 14440.59 35570.37 13563.00 38420.924603.85 7882.31 4719.24 8306.41 5083.29 9156.06 4671.80 10663.45
10406.46 25558.36 11212.48 26556.53 13702.87 27700.12 12918.34 31260.8521082.10 63998.73 22843.36 67217.45 28532.60 74551.77 29010.53 84452.5010883.58 25340.40 13200.62 28300.06 17936.43 30002.28 16908.91 33774.97
6969.97 21967.82 8012.96 21749.32 9592.33 24426.62 9402.43 25997.8110053.54 28276.36 11012.46 33152.20 13845.86 31064.46 14124.74 35278.9918832.63 62695.83 20314.40 65104.62 20395.67 51122.17 19841.20 54588.5411108.66 25585.56 12601.80 22649.48 15826.08 27133.51 15451.24 31527.23
9086.07 27322.40 9596.21 29032.39 13326.57 31532.76 12504.77 34741.82
25

STATEMENT ‐ VIIIAnalysis of Consolidated Fund (` in Lakhs)
Obj Hd ITEM
420 Raichur421 Yadgir422 SCP423 TSP451 Davanagere452 Ramanagara453 Chickkaballabur456 Chamarajanagar457 Udupi461 Bagalkot462 Gadag463 Haveri466 Koppal
Less SalaryTotal-2
Consolidated Fund (Total-A+Total B)(P+NP)
Plan Non-Plan Plan Non-Plan Plan Non-Plan Plan Non-Plan2011-12 BE2008-09 2009-10 2010-11 RE
12110.28 17601.72 13558.37 18924.39 16861.03 20652.56 16509.27 22987.050.00 0.00 0.00 0.00 8841.01 20967.21 8943.36 18968.69
4750.001400.00
10490.48 26622.58 11417.97 26615.64 14632.44 28219.55 14247.26 34248.615974.78 15884.33 6822.90 17083.22 8844.32 16136.22 7952.02 18065.776930.84 16987.31 8277.82 20380.42 10802.08 19049.93 10555.81 21201.396588.04 12427.14 7865.41 12489.36 9530.38 13969.80 8792.08 15242.405401.31 14422.09 5369.89 14413.14 6488.43 18017.71 6336.28 20483.819582.79 21085.70 12525.00 24050.38 15204.10 23601.19 13936.33 26917.356094.74 14489.54 6996.19 15178.63 8825.10 16201.56 8375.41 18577.548694.45 21678.12 9826.07 22288.76 12445.37 24358.79 12068.99 26982.578942.55 13047.49 9836.63 14264.37 12222.51 16857.95 11681.39 18073.73
324558.11 755659.85 350568.02 786850.48 442824.36 843306.99 489164.95 1006119.3540723.48 543129.80 51473.14 537148.28 62098.18 612443.33 75745.82 706123.08
283834.63 212530.05 299094.88 249702.20 380726.18 230863.66 413419.13 299996.27
1988916.31 3414965.67 2433707.59 3862643.60 2858200.20 4369501.50 3464448.05 5067427.657227701.70 8531875.705403881.98 6296351.19
26

STATEMENT ‐ IXAnalysis of Revenue Expenditure (` in Lakhs)
Plan Non-Plan Plan Non-Plan Plan Non-Plan Plan Non-Plan Plan Non-PlanA.State Sector of which 235136.80 1454181.29 349366.60 1628914.81 256157.34 1901305.44 500920.22 2071398.41 550267.62 2284782.841.Salary
002 Pay-Officers 1352.97 15621.02 1516.43 16462.48 1381.19 17271.72 1551.78 17183.28 2825.56 26963.02003 Pay-Staff 6028.00 129618.63 5719.56 118488.96 4681.71 126056.27 4482.29 118374.09 9281.83 207542.64004 Interim Relief 0.00 0.00 0.00 0.00 0.00 0.00 496.37 11205.76 166.70 3359.53011 Dearness Allowance 4279.43 78740.12 4421.90 85715.61 4106.22 97780.62 4587.24 102592.26 3284.02 64951.76014 Other Allowance 1221.95 17172.92 761.54 18428.56 1276.49 18849.50 813.62 19772.63 1317.25 29762.56020 Medical Allowance 0.00 0.00 0.00 0.00 0.00 0.00 0.00 0.00 0.00 0.00
Total 12882.35 241152.69 12419.43 239095.61 11445.61 259958.11 11931.30 269128.02 16875.36 332579.512. Administrative Expenditure
015 Subsidiary Expenses 1453.41 7705.57 2308.18 10217.04 1888.92 12351.98 2437.99 11744.55 6104.13 16686.75021 Reimbursement of Medical Expenses 0.00 0.00 0.00 0.00 0.00 0.00 0.00 0.00 0.00 0.00031 Wages 0.00 1.94 0.00 0.00 0.00 0.00 0.00 0.00 0.00 0.00041 Travel Expenses 2734.77 6816.82 191.53 7445.87 243.21 7178.60 241.50 7639.24 358.12 8143.24
046Conveyance Allowance of Parliamentary Functionaries 0.00 0.00 0.00 0.00 0.00 0.00 0.00 0.00 0.00 0.00
050 Office Expenses 1.56 88.02 0.00 0.00 0.01 0.02 0.00 0.00 0.00 0.00051 General Expenses 3155.30 12875.95 4083.17 11319.76 2823.76 11128.87 3789.54 13691.14 5274.84 15141.37052 Telephone Charges 156.61 108.35 10.31 853.17 11.14 798.58 22.41 838.16 37.78 911.23053 Purchase of Furniture and Fixture for Office 0.00 0.00 16.19 64.22 0.00 11.11 0.00 106.52 0.00 134.19058 Electricity and Water Charges 66.88 7.40 0.00 0.00 0.00 0.00 0.00 0.00 0.00 0.00060 Other Charges 0.53 0.12 0.00 0.00 0.00 0.00 0.00 0.00 0.00 0.00062 Allowances to Witnesses and Prosecutors 0.00 0.00 0.00 0.00 0.00 0.00 0.00 0.00 0.00 0.00063 Remuneration 58.27 0.00 0.00 0.00 0.00 0.00 0.00 0.00 0.00 0.00
064 Payment for Professional and Special Services 0.00 0.00 0.00 0.00 0.00 0.00 0.00 0.00 0.00 0.00065 Commission to Official Stamp Vendors 0.00 0.00 0.00 0.00 0.00 0.00 0.00 0.00 0.00 0.00070 Rent for A.N.M Hostels 0.00 0.00 0.00 0.00 0.00 0.00 0.00 0.00 0.00 0.00071 Building Expenses 311.39 6905.22 466.49 8070.67 267.33 8880.85 245.71 7995.56 487.24 9194.89072 Rents,Rates and Taxes 0.00 41.33 0.00 0.00 0.00 0.00 0.00 0.00 0.00 0.00075 Libraries and Periodicals 0.00 0.00 0.00 0.00 0.00 0.00 0.00 0.00 0.00 0.00080 Publicity Expenses 0.00 0.00 0.00 0.00 0.00 0.00 0.00 0.00 0.00 0.00081 Publications 0.00 0.00 0.00 0.00 0.00 0.00 0.00 0.00 0.00 0.00084 Publicity and Advertisements 0.00 0.00 0.00 0.00 0.00 0.00 0.00 0.00 0.00 0.00091 Advertising, Sales and Publicity 0.00 0.00 0.00 0.00 0.00 0.00 0.00 0.00 0.00 0.00092 Publicity & Propaganda 0.00 0.00 0.00 0.00 0.00 0.00 0.00 0.00 0.00 0.00093 Publication and Hoardings 0.00 0.00 0.00 0.00 0.00 0.00 0.00 0.00 0.00 0.00
Obj Hd ITEM 2003-04 2004-05 2005-06 2006-07 2007-08
27

STATEMENT ‐ IXAnalysis of Revenue Expenditure (` in Lakhs)
Plan Non-Plan Plan Non-Plan Plan Non-Plan Plan Non-Plan Plan Non-PlanObj Hd ITEM 2003-04 2004-05 2005-06 2006-07 2007-08
094 Printing Charges 0.00 0.00 0.00 0.00 0.00 0.00 0.00 0.00 0.00 0.00096 Purchase of Stationery - Govt. Press 0.00 0.00 0.00 0.00 0.00 0.00 0.00 0.00 0.00 0.00130 Tender Bulletin Expenses 0.00 0.00 0.00 0.00 0.00 0.00 0.00 0.00 0.00 0.00131 Secret Service Expenses 0.00 0.00 0.00 0.00 0.00 0.00 0.00 0.00 0.00 0.00136 Preliminary Expenses 0.00 0.00 0.00 0.00 0.00 0.00 0.00 0.00 0.00 0.00190 Motor Vehicles 0.00 0.00 0.00 0.00 0.00 0.00 0.00 0.00 0.00 0.00191 Fuel and Oil Expenses 0.00 26.35 0.00 0.00 0.00 0.00 0.00 0.00 0.00 0.00192 Repairs of Motor Vehicles 0.00 17.94 0.00 0.00 0.00 0.11 0.00 0.00 0.00 0.00193 Purchase of New Motor Vehicles 0.00 0.00 0.00 0.00 0.00 0.00 0.00 0.00 0.00 0.00195 Transport Expenses 272.09 6289.84 282.52 7282.57 540.35 8545.54 285.78 11567.95 446.17 10973.28299 Prize Money 0.00 128151.05 0.00 172885.94 0.00 165091.07 0.00 109257.63 0.00 362.14306 Cash and Incentive Awards 0.00 0.00 0.00 0.00 0.00 0.03 0.00 0.00 0.00 0.00310 Payment of Commission to Agents 0.00 12729.31 0.00 0.00 0.00 0.00 0.00 0.00 0.00 0.00384 Award 0.00 0.00 0.00 0.00 0.00 0.00 0.00 0.00 0.00 0.00
Total 8210.81 181765.21 7358.39 218139.24 5774.72 213986.76 7022.93 162840.75 12708.28 61547.093.Others
001 Consolidated Salaries 0.00 673.20 0.00 603.58 0.00 722.30 0.00 925.47 0.00 746.23
028Establishment Charges - transferred from 2059 Public Works 0.00 0.00 0.00 0.00 0.00 0.00 0.00 0.00 0.00 0.00
059 Other Expenses 77846.67 10261.15 103276.57 27856.73 81589.41 22666.23 151471.41 44434.73 194781.16 50885.47095 Text Books 0.00 0.00 0.00 0.00 0.00 0.00 0.00 0.00 0.00 0.00100 Financial Assistance/Relief 7222.24 95624.19 3749.57 111124.46 5123.36 183005.35 23121.81 222113.87 17661.48 232957.82101 Grants-in-Aid 45912.85 77808.12 79401.83 105658.55 74009.85 89414.40 89617.12 88759.92 101787.55 105283.96102 Special Grants 373.66 0.00 0.00 0.00 0.00 0.00 0.00 0.00 0.00 0.00103 Assistance in Kind 0.00 0.00 0.00 0.00 0.00 0.00 0.00 0.00 0.00 0.00104 Contributions 260.79 15905.29 880.60 10934.38 655.99 389.76 60957.14 26116.03 1321.16 45306.79105 Contributions to Provident Fund 0.00 23.46 0.00 0.00 0.00 0.00 0.00 0.00 0.00 0.00106 Subsidies 3004.34 195664.99 13318.12 258166.38 10208.36 361105.58 14399.13 421130.59 75734.80 466259.09108 Contributions to Band Fund 0.00 0.00 0.00 0.00 0.00 0.00 0.00 0.00 0.00 0.00109 Rebate 0.00 0.00 0.00 0.00 0.00 0.00 0.00 0.00 0.00 0.00110 Compensations 0.00 0.00 0.00 0.00 0.00 0.00 0.00 0.00 0.00 0.00111 Scholorships and Stipends 0.00 0.00 0.00 0.00 0.00 0.00 0.00 0.00 0.00 0.00112 Stipends 0.00 0.00 0.00 0.00 0.00 0.00 0.00 0.00 0.00 0.00113 Scholarships 0.00 0.00 0.00 0.00 0.00 0.00 0.00 0.00 0.00 0.00114 Ration 0.00 0.00 0.00 0.00 0.00 0.00 0.00 0.00 0.00 0.00117 Scholarships & Incentives 1286.76 1628.99 1182.38 1799.03 464.99 1900.32 795.74 2460.10 2457.79 2566.40120 Hospitality Expenses 0.00 0.00 0.00 0.00 0.00 0.00 0.00 0.00 0.00 0.00
28

STATEMENT ‐ IXAnalysis of Revenue Expenditure (` in Lakhs)
Plan Non-Plan Plan Non-Plan Plan Non-Plan Plan Non-Plan Plan Non-PlanObj Hd ITEM 2003-04 2004-05 2005-06 2006-07 2007-08
121 Sumptuary Allowances 0.00 0.00 0.00 0.00 0.00 0.00 0.00 0.00 0.00 0.00122 Entertainment Allowances 0.00 0.00 0.00 0.00 0.00 0.00 0.00 0.00 0.00 0.00123 General Elections 0.00 0.00 0.00 0.00 0.00 0.00 0.00 0.00 0.00 0.00124 Bye Elections 0.00 0.00 0.00 0.00 0.00 0.00 0.00 0.00 0.00 0.00125 Modernisation 1126.16 10723.81 653.40 8313.42 1731.57 8482.45 1904.78 5855.49 3548.16 5777.01126 Terminal Leave Benefits 0.00 0.00 0.00 0.00 0.00 0.00 0.00 0.00 0.00 0.00129 Assistance for Repayments 0.00 0.00 0.00 0.00 0.00 0.00 0.00 0.00 0.00 0.00132 Capital Expenses 342.17 758.35 495.74 830.70 359.87 1249.77 441.40 1158.59 573.78 1287.09133 Special Development Plan 0.00 0.00 0.00 0.00 0.00 0.00 0.00 0.00 0.00 0.00137 Survey 0.00 0.00 0.00 0.00 0.00 0.00 0.00 0.00 0.00 0.00139 Major Works 16685.20 1895.31 22588.02 4422.13 20720.55 4693.35 23025.71 5132.20 29862.65 5036.61140 Minor Works 0.00 0.00 0.00 0.00 0.00 0.00 0.00 0.00 0.00 0.00141 Works 0.00 0.00 0.00 0.00 0.00 0.00 0.00 0.00 0.00 0.00142 Buildings 0.00 0.00 0.00 0.00 0.00 0.00 0.00 0.00 0.00 0.00145 Acquisition of Land 0.00 0.00 0.00 0.00 0.00 0.00 0.00 0.00 0.00 0.00146 Infrastructure 0.00 0.00 0.00 0.00 0.00 0.00 0.00 0.00 0.00 0.00147 Land & Buildings 293.01 694.46 249.63 657.62 212.95 804.62 637.21 1253.40 565.76 585.56150 Repairs 7.40 2846.71 0.00 0.00 0.00 0.00 0.00 0.00 0.00 0.00151 Maintenance and Repairs 0.00 0.00 0.00 0.00 0.00 0.00 0.00 0.00 0.00 0.00152 Special Repairs 0.00 0.00 0.00 0.00 0.00 0.00 0.00 0.00 0.00 0.00154 Extensions & Improvements 0.00 0.00 0.00 0.00 0.00 0.00 0.00 0.00 0.00 0.00160 Renewals 0.00 0.00 0.00 0.00 0.00 0.00 0.00 0.00 0.00 0.00161 Furnishings 0.00 0.00 0.00 0.00 0.00 0.00 0.00 0.00 0.00 0.00162 Purchase of Seed Cocoons 0.00 0.00 0.00 0.00 0.00 0.00 0.00 0.00 0.00 0.00172 Roads 66.15 69.22 26083.33 0.00 26998.67 0.00 35892.15 0.00 36807.82 0.00173 Bridges 130.89 0.00 65.08 0.00 10.89 0.00 0.00 0.00 0.00 0.00177 Computer Software 0.00 0.00 0.00 0.00 0.00 0.00 0.00 0.00 0.00 0.00180 Machinery and Equipment 189.55 626.23 252.13 1983.92 664.68 1324.38 1414.18 1581.42 1594.95 1450.98
181Machinery & Equipment - Transferred from 2059 Public Works 0.00 0.00 0.00 0.00 0.00 0.00 0.00 0.00 0.00 0.00
182 Repairs and Carriages 0.01 637.10 8.27 887.36 2.39 856.39 0.00 408.74 1.13 377.38200 Maintenance 816.68 21622.02 1397.16 21907.81 399.47 40805.18 966.27 79719.80 1594.73 60580.19201221 Materials and Supplies 2108.42 4750.18 9432.44 7062.04 80.30 6506.95 291.29 7480.28 4768.17 6302.72222 Drugs and Chemicals 237.85 7925.41 622.41 8545.39 610.29 9175.83 1969.28 10964.23 822.61 11932.79223 Chemicals and Glassware 0.00 0.00 0.00 0.00 0.00 0.00 0.00 0.00 0.00 0.00224 Raw Materials 0.00 0.00 0.00 0.00 0.00 0.00 0.00 0.00 0.00 0.00
29

STATEMENT ‐ IXAnalysis of Revenue Expenditure (` in Lakhs)
Plan Non-Plan Plan Non-Plan Plan Non-Plan Plan Non-Plan Plan Non-PlanObj Hd ITEM 2003-04 2004-05 2005-06 2006-07 2007-08
225 New Supplies 154.51 0.00 0.46 0.00 0.00 0.00 0.00 0.00 0.00 0.00
226Cost of Materials and Equipment supplied by GOI 0.00 0.00 0.00 0.00 1172.44 0.00 0.00 0.00 0.00 0.00
229 Equipments and Clothing 0.00 0.00 0.00 0.00 0.00 0.00 0.00 0.00 0.00 0.00230 Hospital Accessaries 0.65 774.20 24.36 830.84 7.81 623.38 41.96 841.20 87.25 1023.84231 Bedding and Clothing 0.00 0.00 0.00 0.00 0.00 0.00 0.00 0.00 0.00 0.00234 Diet Expenses 0.00 1445.53 18.46 668.92 27.22 1037.76 17.90 1068.60 16.33 1183.36235 X-Ray Films 0.00 0.00 0.00 0.00 0.00 0.00 0.00 0.00 0.00 0.00236 Equipment Charges 0.00 0.00 0.00 0.00 0.00 0.00 0.00 0.00 0.00 0.00237 Raw Material - Training Section 0.00 0.00 0.00 0.00 0.00 0.00 0.00 0.00 0.00 0.00240 Debt Servicing 0.00 370015.05 0.00 379470.57 0.00 376526.67 0.00 423676.72 0.00 450604.89241 Interest 0.00 1025.51 0.00 0.00 0.00 0.00 0.00 0.00 0.00 0.00243 Interest on Capital 0.00 109.90 0.00 75.37 0.00 71.50 0.00 70.49 0.00 93.89250 Pensionary Charges 0.00 160.16 0.00 105.28 0.00 125.28 0.00 70.52 0.00 78.68251 Pension & Retirement Benefits 1.10 197613.37 0.06 212410.59 0.14 240322.63 12347.64 268038.61 789.98 391411.22252 Commuted Value of Pensions 0.00 0.00 0.00 0.00 0.00 0.00 0.00 0.00 0.00 0.00253 Compassionate Allowances 0.00 0.00 0.00 0.00 0.00 0.00 0.00 0.00 0.00 0.00254 D.C.R.G 0.00 0.00 0.00 0.00 0.00 0.00 0.00 0.00 0.00 0.00261 Inter Account Transfers 25409.95 10033.38 47928.56 6818.81 -11675.26 75103.51 37282.93 24455.25 1147.50 48531.85271 Depreciation 0.00 7.41 0.00 5.08 0.00 5.50 0.00 4.22 0.00 3.08272 Transfer to Depreciation Reserve Fund 0.00 -13.58 0.00 0.00 0.00 0.00 0.00 0.00 0.00 0.00292 Stock Debits 0.00 1697.16 0.00 779.63 0.00 548.40 0.51 297.18 0.00 134.32293 M P W A Debits 0.00 847.53 0.00 903.71 0.00 574.39 0.00 1384.07 0.00 417.83294 Stock Credits 0.00 -1721.46 0.00 -903.12 -0.32 -775.06 -0.43 -280.90 -0.32 -157.42295 M P W A Credits 0.00 -1006.55 0.00 -330.88 0.00 -301.29 0.00 -208.35 0.00 -437.77296 Stock 0.00 -25.22 0.00 -1.74 0.00 -0.57 0.00 -2.53 0.00 4.01297 Miscellaneous Works Advances 110.45 -12.60 -216.89 -49.37 0.00 -10.30 0.00 21.09 0.00 81.48298 Ex-Gratia 0.00 0.00 0.00 0.00 0.00 0.00 0.00 0.00 0.00 0.00301 Medical Charges 0.00 0.00 0.00 0.00 0.00 0.00 0.00 0.00 0.00 0.00302 Library Charges 0.00 0.00 0.00 0.00 0.00 0.00 0.00 0.00 0.00 0.00303 Remuneration to Shanbhogues and Patels 0.00 0.00 0.00 0.00 0.00 0.00 0.00 0.00 0.00 0.00304 Remuneration to Gramasahayakas 0.00 0.00 0.00 0.00 0.00 0.00 0.00 0.00 0.00 0.00307 Dieting and Moving charges 0.00 0.00 0.00 0.00 0.00 0.00 0.00 0.00 0.00 0.00308 Feed and Fodder 0.00 94.53 0.00 0.00 0.00 0.00 0.00 0.00 0.00 0.00309 Livestock and Fodder 0.00 0.00 0.00 0.00 0.00 0.00 0.00 0.00 0.00 0.00312 M.O. Commission for Pension Payments 0.00 0.00 0.00 0.00 0.00 0.00 0.00 0.00 0.00 0.00
30

STATEMENT ‐ IXAnalysis of Revenue Expenditure (` in Lakhs)
Plan Non-Plan Plan Non-Plan Plan Non-Plan Plan Non-Plan Plan Non-PlanObj Hd ITEM 2003-04 2004-05 2005-06 2006-07 2007-08
313Equipments and Apparatus (including computers) 0.00 8.17 0.00 0.00 0.00 0.00 0.00 0.00 0.00 0.00
314 Laboratory Charges 0.00 0.00 0.00 0.00 0.00 0.00 0.00 0.00 0.00 0.00316 Rewards 0.07 0.00 0.00 0.00 0.00 0.00 0.00 0.00 0.00 0.00317 Training 2.74 0.00 0.00 0.00 0.00 0.00 0.00 0.00 0.00 0.00
318 Repairs and Miscellaneous (Training Section) 0.00 0.00 0.00 0.00 0.00 0.00 0.00 0.00 0.00 0.00
320 Repairs and Miscellaneous (Workshop Section) 0.00 0.00 0.00 0.00 0.00 0.00 0.00 0.00 0.00 0.00321 Labour (Workshop Section) 0.00 0.00 0.00 0.00 0.00 0.00 0.00 0.00 0.00 0.00323 Capitation Grant 0.00 0.00 0.00 0.00 0.00 0.00 0.00 0.00 0.00 0.00324 Honorarium 0.00 0.00 0.00 0.00 0.00 0.00 0.00 0.00 0.00 0.00326 Boarding Charges 0.00 0.00 0.00 0.00 0.00 0.00 0.00 0.00 0.00 0.00336 Animals 0.00 0.00 0.00 0.00 0.00 0.00 0.00 0.00 0.00 0.00338 Agricultural Inputs 0.00 0.00 0.00 0.00 0.00 0.00 0.00 0.00 0.00 0.00339 Programmes 0.00 0.00 0.00 0.00 0.00 0.00 0.00 0.00 0.00 0.00342 Purchase of Books 0.00 0.00 0.00 0.00 0.00 0.00 0.00 0.00 0.00 0.00346 Maintenance of Cattle 0.00 0.00 0.00 0.00 0.00 0.00 0.00 0.00 0.00 0.00347 Agricultural Implements 0.00 0.00 0.00 0.00 0.00 0.00 0.00 0.00 0.00 0.00349 Birds 0.00 0.00 0.00 0.00 0.00 0.00 0.00 0.00 0.00 0.00351 Uniform Charges 0.00 0.00 0.00 0.00 0.00 0.00 0.00 0.00 0.00 0.00352 Fee Compensation 0.00 0.00 0.00 0.00 0.00 0.00 0.00 0.00 0.00 0.00
353Bonus for Sandalwood Extracted from Private Holdings 0.00 0.00 0.00 0.00 0.00 0.00 0.00 0.00 0.00 0.00
354 Telephone Charges - Council of Ministers 0.00 0.00 0.00 0.00 0.00 0.00 0.00 0.00 0.00 0.00360 Legal Assistance 0.00 0.00 0.00 0.00 0.00 0.00 0.00 0.00 0.00 0.00
362Committees, Conferences, Seminars, Tribunals Etc., 0.00 2.37 0.00 0.00 0.00 0.00 0.00 0.00 0.00 0.00
363 Exhibitions 0.00 0.00 0.00 0.00 0.00 0.00 0.00 0.00 0.00 0.00364 Deduct - Recoveries -5.37 -16.13 0.00 0.00 0.00 -12.41 0.00 0.00 0.00 0.00
365
Reimbursement of Charges on Account of Related Instructions, Shop Floor and Basic Training 0.00 0.00 0.00 0.00 0.00 0.00 0.00 0.00 0.00 0.00
368 Civil Works 0.00 0.00 0.00 0.00 0.00 0.00 0.00 0.00 0.00 0.00
31

STATEMENT ‐ IXAnalysis of Revenue Expenditure (` in Lakhs)
Plan Non-Plan Plan Non-Plan Plan Non-Plan Plan Non-Plan Plan Non-PlanObj Hd ITEM 2003-04 2004-05 2005-06 2006-07 2007-08
369Deduct - Amount Transferred to Other Departments/Govts. etc 0.00 0.00 0.00 0.00 0.00 0.00 0.00 0.00 0.00 0.00
370 Cost of Security Force of Police 0.00 0.00 0.00 0.00 0.00 0.00 0.00 0.00 0.00 0.00
371Reimbursement of Sales Tax on Tickets Sold Outside the State 0.00 0.00 0.00 0.00 0.00 0.00 0.00 0.00 0.00 0.00
372 Feed 0.00 0.00 0.00 0.00 0.00 0.00 0.00 0.00 0.00 0.00373 Nutrition 0.00 0.00 0.00 0.00 0.00 0.00 0.00 0.00 0.00 0.00
378Deduct - Amount Transferred to 4701 Capital Outlay on Major & Medium Irrigation 0.00 0.00 0.00 0.00 0.00 0.00 0.00 0.00 0.00 0.00
383Honorarium to Doctors for Distinguished Services 0.00 0.00 0.00 0.00 0.00 0.00 0.00 0.00 0.00 0.00
385 Conservation 0.00 0.00 0.00 0.00 0.00 0.00 0.00 0.00 0.00 0.00386 Construction 4642.62 0.00 433.89 0.00 112.85 0.00 259.95 0.00 360.39 0.00390 Sports & Games 0.71 0.00 0.00 0.00 0.00 0.00 0.00 0.00 0.00 0.00392 Purchase of Samples of Drugs for Testing 0.00 0.00 0.00 0.00 0.00 0.00 0.00 0.00 0.00 0.00422 Special Component Plan 13602.09 48.81 14189.85 0.00 15795.65 0.00 13908.30 0.00 28888.99 0.00423 Tribal Sub Plan 1567.24 3.42 3553.35 0.00 4311.51 0.00 5943.79 0.00 13626.71 0.00424 Rural Water Supply Schemes 0.00 0.00 0.00 0.00 0.00 0.00 0.00 0.00 0.00 0.00427 Rehabilitation 0.00 0.00 0.00 0.00 0.00 0.00 0.00 0.00 0.00 0.00428 Insurance 0.00 0.00 0.00 0.00 0.00 0.00 0.00 0.00 0.00 0.00430 Cost of Stamps 0.00 0.00 0.00 0.00 0.00 0.24 0.00 0.00 0.00 0.00431 House Sites 0.00 0.00 0.00 0.00 0.00 0.00 0.00 0.00 0.00 0.00433 Examination Expenses 0.00 0.00 0.00 142.77 0.00 360.31 0.00 498.61 0.00 346.89434 Transporation Charges 0.00 0.00 0.00 0.00 0.00 0.00 0.00 0.00 0.00 0.00436 NABARD Works 2350.41 0.00 0.00 0.00 5336.17 0.00 5258.82 0.00 1861.45 0.00442 Deduct - SCP Pooled Upfront 0.00 0.00 0.00 0.00 0.00 0.00 0.00 0.00 0.00 0.00443 Deduct - TSP Pooled Upfront 0.00 0.00 0.00 0.00 0.00 0.00 0.00 0.00 0.00 0.00500 Lumpsum - State 8295.67 34.24 0.00 0.00 5.21 57.77 0.00 0.00 22.00 0.00
Total 214043.64 1031263.39 329588.78 1171679.96 238937.01 1427360.57 481965.99 1639429.64 520683.98 1890656.24B.District Sector of which 120135.06 319018.12 163095.72 351807.99 250710.17 395916.82 284333.56 486890.47 281014.26 621412.30
1.SalaryPO 1127.86 8154.05 902.21 8242.52 1032.58 8633.21 1353.24 9176.16 1235.28 19226.37PS 8905.07 147736.47 9556.81 150326.39 9876.69 158645.76 12482.37 162053.51 11364.01 350877.46IR 0.00 0.00 0.00 0.00 0.00 0.00 3412.00 17123.00 0.00 0.00DA 5819.09 90414.36 6484.60 98313.12 7913.97 117091.34 11069.00 136984.00 11339.37 59216.61OA 759.41 9700.14 1056.38 10869.19 841.26 12966.55 1933.36 16447.10 2294.52 34308.47MA 0.00 0.00 0.00 0.00 0.00 0.00 0.00 0.00 0.00 0.00
Total-1 16611.43 256005.02 18000.00 267751.22 19664.50 297336.86 30249.97 341783.77 26233.18 463628.91
32

STATEMENT ‐ IXAnalysis of Revenue Expenditure (` in Lakhs)
Plan Non-Plan Plan Non-Plan Plan Non-Plan Plan Non-Plan Plan Non-PlanObj Hd ITEM 2003-04 2004-05 2005-06 2006-07 2007-08
201 GIA for ZP 60715.10 257.19 22911.24 13.81 0.00 15.09 0.00 10.09 0.00 13.72300 Lumpsum - ZP 16837.88 0.33 40746.33 302.76 19045.25 1634.11 18609.48 8705.18 28221.15 15389.29401 Bangalore (Urban) 1259.92 20287.22 3020.52 20018.82 6986.03 22629.59 8669.15 26629.02 9461.45 32471.83402 Bangalore (Rural) 1705.31 10835.11 4947.99 15804.97 9688.83 16213.92 10472.09 19610.70 10110.07 26509.18403 Chitradurga 4094.02 11479.55 4196.99 12671.74 8609.42 13988.25 10032.60 17343.37 8868.96 21347.87404 Kolar 1820.22 14012.42 5344.73 18339.41 11525.02 20958.23 13003.80 25522.52 13229.60 32747.11405 Shimoga 1364.88 13541.42 3276.59 13488.82 8659.55 14054.91 11286.87 16560.45 10750.35 22017.51406 Tumkur 2701.50 20234.47 4596.91 22172.89 12826.50 23923.36 14247.65 30218.85 14324.07 34288.16407 Mysore 1689.83 14276.91 3717.46 15776.12 10025.66 17628.60 12084.38 20875.97 12081.33 27130.17408 Chickmagalore 1305.19 9471.72 3106.24 13138.84 7660.41 12167.87 8424.31 13461.42 7646.02 16626.80409 Dakshina Kannada 1099.11 10335.73 2675.56 12015.59 6934.23 12090.67 8176.85 13881.79 7895.49 17792.31410 Hassan 1513.15 13973.92 3622.89 14850.76 8878.19 17006.90 10656.48 19435.75 10764.37 27207.27411 Kodagu 1156.71 3889.72 2120.74 3977.82 3805.49 5042.50 3937.14 7763.74 3749.25 7057.26412 Mandya 2099.62 12753.84 4887.54 12554.78 8268.49 17438.04 9443.37 18026.73 9321.89 21373.73413 Belgaum 3046.78 22025.98 6256.70 29289.73 17407.66 31850.69 19183.22 38477.78 18431.86 52786.22414 Bijapur 1359.05 12492.31 3205.44 11742.53 9081.11 15460.49 10139.09 18087.73 9928.86 22393.39415 Dharwar 992.68 8780.07 2798.23 10040.00 6064.02 10905.64 7144.03 12866.40 6089.82 16930.65416 Uttara Kannada 1249.91 12399.55 3434.39 12983.46 8630.56 14639.45 10030.25 17473.68 8918.50 22868.89417 Gulbarga 2525.79 20342.26 6109.01 19384.93 14090.97 25226.66 16587.23 32349.86 16126.99 44792.10418 Bellary 1476.17 10969.43 3769.31 11453.43 8907.31 12238.87 10262.28 15622.13 9083.15 19827.65419 Bidar 1150.31 11716.14 4182.81 11715.86 7669.15 13289.94 8089.16 18000.40 7794.78 20110.25420 Raichur 1364.16 7060.12 3515.40 7762.62 8521.97 8749.23 9743.01 10973.07 8916.36 14393.38421 Yadgir 0.00 0.00 0.00 0.00 0.00 0.00 0.00 0.00 0.00 0.00422423451 Davanagere 1325.38 12435.74 4438.98 13259.74 8652.47 13931.98 10017.03 17339.89 9873.20 22317.57452 Ramanagara 0.00 0.00 0.00 0.00 0.00 0.00 0.00 0.00 0.00 0.00453 Chickkaballabur 0.00 0.00 0.00 0.00 0.00 0.00 0.00 0.00 0.00 0.00456 Chamarajanagar 1071.58 5776.88 3105.82 5751.43 5503.22 6682.04 6363.10 8931.53 5561.09 9804.39457 Udupi 742.38 8693.84 1981.03 7953.50 4771.40 9375.98 5428.91 11704.68 4634.89 13003.72461 Bagalkot 1553.60 8054.86 3311.31 10863.21 8500.87 11036.91 9539.41 13943.69 9102.02 17686.24462 Gadag 917.38 7021.09 2151.50 7156.96 5408.52 8512.28 6103.05 9813.28 5178.98 12447.16463 Haveri 934.72 9758.64 2471.13 10523.80 7611.39 11412.42 8549.36 14260.48 7828.61 18259.38466 Koppal 1062.73 6141.66 3192.93 6799.66 6976.48 7812.20 8110.26 9000.29 7121.15 11819.10
120135.06 319018.12 163095.72 351807.99 250710.17 395916.82 284333.56 486890.47 281014.26 621412.30Less Salary 16611.43 256005.02 18000.00 267751.22 19664.50 297336.86 30249.97 341783.77 26233.18 463628.91
33

STATEMENT ‐ IXAnalysis of Revenue Expenditure (` in Lakhs)
Plan Non-Plan Plan Non-Plan Plan Non-Plan Plan Non-Plan Plan Non-PlanObj Hd ITEM 2003-04 2004-05 2005-06 2006-07 2007-08
Total-2 103523.63 63013.10 145095.72 84056.77 231045.67 98579.96 254083.59 145106.70 254781.08 157783.39
Consolidated Fund (Total-A+Total B) 355271.86 1773199.41 512462.32 1980722.80 506867.51 2297222.26 785253.78 2558288.88 831281.88 2906195.14(P+NP) 2128471.27 2493185.12 2804089.77 3343542.66 3737477.02
34

STATEMENT ‐ IXAnalysis of Revenue Expenditure (` in Lakhs)
A.State Sector of which1.Salary
002 Pay-Officers003 Pay-Staff004 Interim Relief011 Dearness Allowance014 Other Allowance020 Medical Allowance
Total2. Administrative Expenditure
015 Subsidiary Expenses021 Reimbursement of Medical Expenses031 Wages041 Travel Expenses
046Conveyance Allowance of Parliamentary Functionaries
050 Office Expenses051 General Expenses052 Telephone Charges053 Purchase of Furniture and Fixture for Office058 Electricity and Water Charges060 Other Charges062 Allowances to Witnesses and Prosecutors063 Remuneration
064 Payment for Professional and Special Services065 Commission to Official Stamp Vendors070 Rent for A.N.M Hostels071 Building Expenses072 Rents,Rates and Taxes075 Libraries and Periodicals080 Publicity Expenses081 Publications084 Publicity and Advertisements091 Advertising, Sales and Publicity092 Publicity & Propaganda093 Publication and Hoardings
Obj Hd ITEM
Plan Non-Plan Plan Non-Plan Plan Non-Plan Plan Non-Plan728472.70 2357238.68 879700.05 2736573.03 1155187.69 3177604.43 1470482.93 3537665.68
4733.65 32042.27 6028.75 34857.07 12946.91 58689.00 22020.49 74900.8113338.10 240786.99 14944.38 234783.95 10246.23 212007.69 12741.85 219594.49
0.00 0.00 0.00 0.00 0.00 0.00 0.00 0.004988.51 70544.97 9075.22 102412.00 14552.55 150454.05 23812.05 205770.681987.62 38908.98 2340.06 33811.80 3393.79 74160.06 4889.60 145310.16
0.00 0.00 60.98 1158.79 74.80 1151.55 79.34 1291.0625047.88 382283.21 32449.39 407023.61 41214.28 496462.35 63543.33 646867.20
7928.46 11489.71 4721.08 23142.31 4410.68 19524.59 5754.33 20657.210.00 0.00 140.69 5965.23 396.50 4496.28 393.57 4450.000.00 0.00 0.00 0.00 0.00 0.00 0.00 0.00
394.03 8944.40 414.98 10795.20 674.89 11772.42 729.59 11529.25
0.00 0.00 0.00 0.00 0.00 0.00 0.00 0.000.00 0.00 0.00 0.00 0.00 0.00 0.00 0.00
7248.74 19174.55 9569.49 17807.90 18656.81 23727.60 22843.29 22582.0564.72 883.02 92.96 904.96 166.15 1403.83 172.72 1407.4822.24 215.47 28.07 294.07 79.55 369.71 154.00 368.05
0.00 0.00 0.00 0.00 0.00 0.00 0.00 0.000.00 0.00 0.00 0.00 0.00 0.00 0.00 0.000.00 0.00 0.00 0.00 0.00 0.00 0.00 0.000.00 0.00 0.00 0.00 0.00 0.00 0.00 0.00
0.00 0.00 0.00 0.00 0.00 0.00 0.00 0.000.00 0.00 0.00 0.00 0.00 0.00 0.00 0.000.00 0.00 0.00 0.00 0.00 0.00 0.00 0.00
524.81 8783.54 577.67 8983.81 1504.88 10794.48 1160.64 10870.300.00 0.00 0.00 0.00 0.00 0.00 0.00 0.000.00 0.00 0.00 0.00 0.00 0.00 0.00 0.000.00 0.00 0.00 0.00 0.00 0.00 0.00 0.000.00 0.00 0.00 0.00 0.00 0.00 0.00 0.000.00 0.00 0.00 0.00 0.00 0.00 0.00 0.000.00 0.00 0.00 0.00 0.00 0.00 0.00 0.000.00 0.00 0.00 0.00 0.00 0.00 0.00 0.000.00 0.00 0.00 0.00 0.00 0.00 0.00 0.00
2009-10 2010-11 RE 2011-12 BE2008-09
35

STATEMENT ‐ IXAnalysis of Revenue Expenditure (` in Lakhs)
Obj Hd ITEM
094 Printing Charges096 Purchase of Stationery - Govt. Press130 Tender Bulletin Expenses131 Secret Service Expenses136 Preliminary Expenses190 Motor Vehicles191 Fuel and Oil Expenses192 Repairs of Motor Vehicles193 Purchase of New Motor Vehicles195 Transport Expenses299 Prize Money306 Cash and Incentive Awards310 Payment of Commission to Agents384 Award
Total3.Others
001 Consolidated Salaries
028Establishment Charges - transferred from 2059 Public Works
059 Other Expenses095 Text Books100 Financial Assistance/Relief101 Grants-in-Aid102 Special Grants103 Assistance in Kind104 Contributions105 Contributions to Provident Fund106 Subsidies108 Contributions to Band Fund109 Rebate110 Compensations111 Scholorships and Stipends112 Stipends113 Scholarships114 Ration117 Scholarships & Incentives120 Hospitality Expenses
Plan Non-Plan Plan Non-Plan Plan Non-Plan Plan Non-Plan2009-10 2010-11 RE 2011-12 BE2008-09
0.00 0.00 0.00 0.00 0.00 0.00 0.00 0.000.00 0.00 0.00 0.00 0.00 0.00 0.00 0.000.00 0.00 0.00 0.00 0.00 0.00 0.00 0.000.00 0.00 0.00 0.00 0.00 0.00 0.00 0.000.00 0.00 0.00 0.00 0.00 0.00 0.00 0.000.00 0.00 0.00 0.00 0.00 0.00 0.00 0.000.00 0.00 0.00 0.00 0.00 0.00 0.00 0.000.00 0.00 0.00 0.00 0.00 0.00 0.00 0.000.00 0.00 0.00 0.00 0.00 0.00 0.00 0.00
644.36 14134.56 637.48 13099.70 868.43 15963.86 1151.39 15904.880.00 0.00 0.00 0.00 0.00 0.00 0.00 0.000.00 0.00 0.00 0.00 0.00 0.00 0.00 0.000.00 0.00 0.00 0.00 0.00 0.00 0.00 0.000.00 0.00 0.00 0.00 0.00 0.00 0.00 0.00
16827.36 63625.25 16182.42 80993.18 26757.89 88052.77 32359.53 87769.22
0.00 805.63 0.00 1721.00 33.77 1418.31 538.26 65146.24
0.00 0.00 0.00 0.00 0.00 0.00 0.00 0.00292393.05 24842.57 341963.35 30111.47 348635.42 117250.04 417173.80 135546.20
0.00 0.00 0.00 0.00 0.00 0.00 0.00 0.00102491.94 218096.15 100941.27 392585.49 124553.42 244504.49 45561.79 55300.68
70345.75 116384.37 75775.86 147732.49 125126.93 166836.84 187257.82 241800.720.00 0.00 0.00 0.00 13163.02 66131.00 2716.92 250.000.00 0.00 0.00 0.00 0.00 0.00 0.00 0.00
1294.95 185224.42 893.78 15296.82 865.00 215365.18 666.28 15495.530.00 0.00 0.00 0.00 0.00 0.00 0.00 0.00
46440.35 293474.73 42940.67 368873.60 55198.09 505394.90 79730.22 544509.940.00 0.00 0.00 0.00 0.00 0.00 0.00 0.000.00 0.00 0.00 0.00 0.00 0.00 0.00 0.000.00 0.00 0.00 0.00 0.00 0.00 0.00 0.000.00 0.00 0.00 0.00 0.00 0.00 0.00 0.000.00 0.00 0.00 0.00 0.00 0.00 0.00 0.000.00 0.00 0.00 0.00 0.00 0.00 0.00 0.000.00 0.00 0.00 0.00 0.00 0.00 0.00 0.00
2204.17 1991.33 4755.59 1874.58 10417.87 2687.78 9864.95 2582.410.00 0.00 0.00 0.00 0.00 0.00 0.00 0.00
36

STATEMENT ‐ IXAnalysis of Revenue Expenditure (` in Lakhs)
Obj Hd ITEM
121 Sumptuary Allowances122 Entertainment Allowances123 General Elections124 Bye Elections125 Modernisation126 Terminal Leave Benefits129 Assistance for Repayments132 Capital Expenses133 Special Development Plan137 Survey139 Major Works140 Minor Works141 Works142 Buildings145 Acquisition of Land146 Infrastructure147 Land & Buildings150 Repairs151 Maintenance and Repairs152 Special Repairs154 Extensions & Improvements160 Renewals161 Furnishings162 Purchase of Seed Cocoons172 Roads173 Bridges177 Computer Software180 Machinery and Equipment
181Machinery & Equipment - Transferred from 2059 Public Works
182 Repairs and Carriages200 Maintenance201221 Materials and Supplies222 Drugs and Chemicals223 Chemicals and Glassware224 Raw Materials
Plan Non-Plan Plan Non-Plan Plan Non-Plan Plan Non-Plan2009-10 2010-11 RE 2011-12 BE2008-09
0.00 0.00 0.00 0.00 0.00 0.00 0.00 0.000.00 0.00 0.00 0.00 0.00 0.00 0.00 0.000.00 0.00 0.00 0.00 0.00 0.00 0.00 0.000.00 0.00 0.00 0.00 0.00 0.00 0.00 0.00
3144.75 8405.19 6684.69 9574.02 6529.08 15658.31 6547.75 22290.220.00 0.00 0.00 0.00 0.00 0.00 0.00 0.000.00 0.00 0.00 0.00 0.00 0.00 0.00 0.00
482.76 1548.77 450.30 1160.04 2449.00 1546.64 1676.00 1551.240.00 0.00 23824.82 0.00 48471.00 0.00 71093.00 0.000.00 0.00 0.00 0.00 0.00 0.00 0.00 0.00
25373.91 4598.49 23099.74 5094.29 19651.09 9293.54 24144.19 14682.170.00 0.00 0.00 0.00 0.00 0.00 0.00 0.000.00 0.00 0.00 0.00 0.00 0.00 0.00 0.000.00 0.00 0.00 0.00 0.00 0.00 0.00 0.000.00 0.00 0.00 0.00 0.00 0.00 0.00 0.000.00 0.00 0.00 0.00 0.00 0.00 0.00 0.00
603.32 1229.33 850.25 1325.68 891.50 1406.86 1681.50 1455.120.00 0.00 0.00 0.00 0.00 0.00 0.00 0.000.00 0.00 0.00 0.00 0.00 0.00 0.00 0.000.00 0.00 0.00 0.00 0.00 0.00 0.00 0.000.00 0.00 0.00 0.00 0.00 0.00 0.00 0.000.00 0.00 0.00 0.00 0.00 0.00 0.00 0.000.00 0.00 0.00 0.00 0.00 0.00 0.00 0.000.00 0.00 0.00 0.00 0.00 0.00 0.00 0.00
40312.75 0.00 23010.26 0.00 35000.00 10000.00 7125.00 10000.000.00 0.00 0.00 0.00 0.00 0.00 0.00 0.000.00 0.00 0.00 0.00 0.00 0.00 0.00 0.00
1177.54 1633.20 717.81 1399.10 2862.93 2350.34 1473.82 2410.91
0.00 0.00 0.00 0.00 0.00 0.00 0.00 0.000.00 323.73 0.01 287.95 0.00 430.79 0.00 439.17
4281.82 58360.45 7125.92 54804.73 7223.90 62443.66 7904.21 102696.810.00 17.81 0.00 20.69 0.00 21.51
6728.54 6747.13 2365.78 6336.20 4627.21 9174.23 2579.22 8842.14883.12 13103.10 1227.57 12368.41 1098.80 13277.50 2874.38 13775.28
0.00 0.00 0.00 0.00 0.00 0.00 0.00 0.000.00 0.00 0.00 0.00 0.00 0.00 0.00 0.00
37

STATEMENT ‐ IXAnalysis of Revenue Expenditure (` in Lakhs)
Obj Hd ITEM
225 New Supplies
226Cost of Materials and Equipment supplied by GOI
229 Equipments and Clothing230 Hospital Accessaries231 Bedding and Clothing234 Diet Expenses235 X-Ray Films236 Equipment Charges237 Raw Material - Training Section240 Debt Servicing241 Interest243 Interest on Capital250 Pensionary Charges251 Pension & Retirement Benefits252 Commuted Value of Pensions253 Compassionate Allowances254 D.C.R.G261 Inter Account Transfers271 Depreciation272 Transfer to Depreciation Reserve Fund292 Stock Debits293 M P W A Debits294 Stock Credits295 M P W A Credits296 Stock297 Miscellaneous Works Advances298 Ex-Gratia301 Medical Charges302 Library Charges303 Remuneration to Shanbhogues and Patels304 Remuneration to Gramasahayakas307 Dieting and Moving charges308 Feed and Fodder309 Livestock and Fodder312 M.O. Commission for Pension Payments
Plan Non-Plan Plan Non-Plan Plan Non-Plan Plan Non-Plan2009-10 2010-11 RE 2011-12 BE2008-09
1.00 0.00 0.00 0.00 18.00 0.00 18.00 0.00
0.00 0.00 0.00 0.00 0.00 0.00 0.00 0.000.00 0.00 0.00 0.00 0.00 0.00 0.00 0.00
18.17 778.59 49.57 910.00 81.21 887.65 94.50 910.260.00 0.00 0.00 0.00 0.00 0.00 0.00 0.00
13.97 1419.59 16.89 1677.63 32.00 2766.71 32.00 2877.520.00 0.00 0.00 0.00 0.00 0.00 0.00 0.000.00 0.00 0.00 0.00 0.00 0.00 0.00 0.000.00 0.00 0.00 0.00 0.00 0.00 0.00 0.000.00 453248.59 0.00 521369.47 0.00 565373.48 718.00 757604.980.00 0.00 0.00 0.00 0.00 0.00 0.00 0.000.00 69.72 0.00 75.87 0.00 92.92 0.00 95.960.00 62.74 0.00 74.11 0.00 98.93 0.00 103.65
19863.47 477532.77 30462.09 402545.81 18984.00 512745.94 14295.02 637770.280.00 0.00 0.00 0.00 0.00 0.00 0.00 0.000.00 0.00 0.00 0.00 0.00 0.00 0.00 0.000.00 0.00 0.00 0.00 0.00 0.00 0.00 0.00
13610.65 40736.08 9700.89 271048.97 -11375.00 65528.14 2875.00 57721.060.00 3.70 0.00 1.93 0.00 4.64 0.00 4.710.00 0.00 0.00 0.00 0.00 0.00 0.00 0.000.00 0.74 0.00 0.68 0.00 10473.43 0.00 10891.850.00 3.39 0.00 10.20 0.00 2623.66 0.00 2873.970.00 -148.62 0.00 -40.23 0.00 -10473.42 0.00 -11475.230.00 -196.98 0.00 -31.02 0.00 -2623.87 0.00 -2874.210.00 -0.04 0.00 0.00 0.00 0.00 0.00 0.000.00 -1.50 0.00 -0.79 0.00 0.00 0.00 0.000.00 0.00 0.00 0.00 0.00 0.00 0.00 0.000.00 0.00 0.00 0.00 0.00 0.00 0.00 0.000.00 0.00 0.00 0.00 0.00 0.00 0.00 0.000.00 0.00 0.00 0.00 0.00 0.00 0.00 0.000.00 0.00 0.00 0.00 0.00 0.00 0.00 0.000.00 0.00 0.00 0.00 0.00 0.00 0.00 0.000.00 0.00 0.00 0.00 0.00 0.00 0.00 0.000.00 0.00 0.00 0.00 0.00 0.00 0.00 0.000.00 0.00 0.00 0.00 0.00 0.00 0.00 0.00
38

STATEMENT ‐ IXAnalysis of Revenue Expenditure (` in Lakhs)
Obj Hd ITEM
313Equipments and Apparatus (including computers)
314 Laboratory Charges316 Rewards317 Training
318 Repairs and Miscellaneous (Training Section)
320 Repairs and Miscellaneous (Workshop Section)321 Labour (Workshop Section)323 Capitation Grant324 Honorarium326 Boarding Charges336 Animals338 Agricultural Inputs339 Programmes342 Purchase of Books346 Maintenance of Cattle347 Agricultural Implements349 Birds351 Uniform Charges352 Fee Compensation
353Bonus for Sandalwood Extracted from Private Holdings
354 Telephone Charges - Council of Ministers360 Legal Assistance
362Committees, Conferences, Seminars, Tribunals Etc.,
363 Exhibitions364 Deduct - Recoveries
365
Reimbursement of Charges on Account of Related Instructions, Shop Floor and Basic Training
368 Civil Works
Plan Non-Plan Plan Non-Plan Plan Non-Plan Plan Non-Plan2009-10 2010-11 RE 2011-12 BE2008-09
0.00 0.00 0.00 0.00 0.00 0.00 0.00 0.000.00 0.00 0.00 0.00 0.00 0.00 0.00 0.000.00 0.00 0.00 0.00 0.00 0.00 0.00 0.000.00 0.00 0.00 0.00 0.00 0.00 0.00 0.00
0.00 0.00 0.00 0.00 0.00 0.00 0.00 0.00
0.00 0.00 0.00 0.00 0.00 0.00 0.00 0.000.00 0.00 0.00 0.00 0.00 0.00 0.00 0.000.00 0.00 0.00 0.00 0.00 0.00 0.00 0.000.00 0.00 0.00 0.00 0.00 0.00 0.00 0.000.00 0.00 0.00 0.00 0.00 0.00 0.00 0.000.00 0.00 0.00 0.00 0.00 0.00 0.00 0.000.00 0.00 0.00 0.00 0.00 0.00 0.00 0.000.00 0.00 0.00 0.00 0.00 0.00 0.00 0.000.00 0.00 0.00 0.00 0.00 0.00 0.00 0.000.00 0.00 0.00 0.00 0.00 0.00 0.00 0.000.00 0.00 0.00 0.00 0.00 0.00 0.00 0.000.00 0.00 0.00 0.00 0.00 0.00 0.00 0.000.00 0.00 0.00 0.00 0.00 0.00 0.00 0.000.00 0.00 0.00 0.00 0.00 0.00 0.00 0.00
0.00 0.00 0.00 0.00 0.00 0.00 0.00 0.000.00 0.00 0.00 0.00 0.00 0.00 0.00 0.000.00 0.00 0.00 0.00 0.00 0.00 0.00 0.00
0.00 0.00 0.00 0.00 0.00 0.00 0.00 0.000.00 0.00 0.00 0.00 0.00 0.00 0.00 0.000.00 0.00 0.00 0.00 0.00 0.00 0.00 0.00
0.00 0.00 0.00 0.00 0.00 0.00 0.00 0.000.00 0.00 0.00 0.00 0.00 0.00 0.00 0.00
39

STATEMENT ‐ IXAnalysis of Revenue Expenditure (` in Lakhs)
Obj Hd ITEM
369Deduct - Amount Transferred to Other Departments/Govts. etc
370 Cost of Security Force of Police
371Reimbursement of Sales Tax on Tickets Sold Outside the State
372 Feed373 Nutrition
378Deduct - Amount Transferred to 4701 Capital Outlay on Major & Medium Irrigation
383Honorarium to Doctors for Distinguished Services
385 Conservation386 Construction390 Sports & Games392 Purchase of Samples of Drugs for Testing422 Special Component Plan423 Tribal Sub Plan424 Rural Water Supply Schemes427 Rehabilitation428 Insurance430 Cost of Stamps431 House Sites433 Examination Expenses434 Transporation Charges436 NABARD Works442 Deduct - SCP Pooled Upfront443 Deduct - TSP Pooled Upfront500 Lumpsum - State
TotalB.District Sector of which
1.SalaryPOPSIRDAOAMA
Total-1
Plan Non-Plan Plan Non-Plan Plan Non-Plan Plan Non-Plan2009-10 2010-11 RE 2011-12 BE2008-09
0.00 0.00 0.00 0.00 0.00 0.00 0.00 0.000.00 0.00 0.00 0.00 0.00 0.00 0.00 0.00
0.00 0.00 0.00 0.00 0.00 0.00 0.00 0.000.00 0.00 0.00 0.00 0.00 0.00 0.00 0.000.00 0.00 0.00 0.00 0.00 0.00 0.00 0.00
0.00 0.00 0.00 0.00 0.00 0.00 0.00 0.00
0.00 0.00 0.00 0.00 0.00 0.00 0.00 0.000.00 0.00 0.00 0.00 0.00 0.00 0.00 0.00
534.65 0.01 199.53 0.00 500.00 0.00 500.00 0.000.00 0.00 0.00 0.00 0.00 0.00 0.00 0.000.00 0.00 0.00 0.00 0.00 0.00 0.00 0.00
37788.14 0.00 98652.52 0.00 210789.48 0.00 265251.97 0.0016608.69 0.00 35359.08 0.00 94242.80 0.00 111515.72 0.00
0.00 0.00 0.00 0.00 0.00 0.00 0.00 0.000.00 0.00 0.00 0.00 0.00 0.00 0.00 0.000.00 0.00 0.00 0.00 0.00 0.00 0.00 0.000.00 0.00 0.00 0.00 0.00 0.00 0.00 0.000.00 0.00 0.00 0.00 0.00 0.00 0.00 0.000.00 1052.85 0.00 393.58 0.00 800.00 0.00 832.000.00 0.00 0.00 0.00 0.00 0.00 0.00 0.000.00 0.00 0.00 0.00 2100.00 0.00 17800.00 0.000.00 0.00 0.00 0.00 -28105.00 0.00 -21386.50 0.000.00 0.00 0.00 0.00 -6850.00 -400.00 -10539.75 0.000.00 0.00 0.00 0.00 0.00 0.00 0.00 0.00
686597.46 1911330.22 831068.24 2248599.89 1087215.52 2593089.31 1251783.07 2696133.09324558.11 755659.85 350568.02 786850.48 442824.36 843306.99 489164.95 1006119.35
3016.80 21209.83 3662.06 20552.29 4199.03 23163.50 4520.08 23203.3226330.56 377155.51 31223.12 344263.88 33708.36 356275.00 36667.39 358083.71
0.00 0.00 0.00 0.00 0.00 0.00 0.00 0.008070.53 109550.47 13256.37 138630.14 18953.70 189719.25 28831.23 266900.923305.59 35213.99 3331.59 33701.97 5074.57 42165.38 5550.81 56288.86
0.00 0.00 0.00 0.00 162.52 1670.20 176.31 1646.2740723.48 543129.80 51473.14 537148.28 62098.18 612993.33 75745.82 706123.08
40

STATEMENT ‐ IXAnalysis of Revenue Expenditure (` in Lakhs)
Obj Hd ITEM
201 GIA for ZP300 Lumpsum - ZP401 Bangalore (Urban)402 Bangalore (Rural)403 Chitradurga404 Kolar405 Shimoga406 Tumkur407 Mysore408 Chickmagalore409 Dakshina Kannada410 Hassan411 Kodagu412 Mandya413 Belgaum414 Bijapur415 Dharwar416 Uttara Kannada417 Gulbarga418 Bellary419 Bidar420 Raichur421 Yadgir422423451 Davanagere452 Ramanagara453 Chickkaballabur456 Chamarajanagar457 Udupi461 Bagalkot462 Gadag463 Haveri466 Koppal
Less Salary
Plan Non-Plan Plan Non-Plan Plan Non-Plan Plan Non-Plan2009-10 2010-11 RE 2011-12 BE2008-09
208.50 14.99 0.00 0.00 0.00 0.00 0.00 0.0037790.94 17524.38 31649.64 22695.18 40277.07 20000.00 99208.57 86650.00
9747.55 39374.32 10263.98 38020.18 12657.79 40491.99 12454.39 46077.485924.21 14638.14 6242.53 14672.83 7294.35 14975.43 6735.65 16872.87
10505.36 27327.10 11079.81 26439.45 13907.81 28595.08 12703.33 32361.707640.15 23196.31 8460.48 21298.13 10597.43 23990.22 9249.40 27543.47
11045.65 25228.90 13727.20 26165.59 16097.96 27976.48 13955.36 31460.8717703.72 40521.84 18265.17 42099.99 24115.33 46531.35 22669.10 50850.0811842.65 31592.13 13606.40 32040.92 17613.02 34449.04 16444.58 39884.96
8843.05 20502.85 9268.66 21132.27 11094.88 22661.05 11005.53 25734.308998.57 21235.66 9797.34 21546.36 11789.66 23343.76 10793.88 26227.63
10470.64 31629.44 12197.03 32982.81 14440.59 35570.37 13563.00 38420.924603.85 7882.31 4719.24 8306.41 5083.29 9156.06 4671.80 10663.45
10406.46 25558.36 11212.48 26556.53 13702.87 27700.12 12918.34 31260.8521082.10 63998.73 22843.36 67217.45 28532.60 74551.77 29010.53 84452.5010883.58 25340.40 13200.62 28300.06 17936.43 30002.28 16908.91 33774.97
6969.97 21967.82 8012.96 21749.32 9592.33 24426.62 9402.43 25997.8110053.54 28276.36 11012.46 33152.20 13845.86 31064.46 14124.74 35278.9918832.63 62695.83 20314.40 65104.62 20395.67 51122.17 19841.20 54588.5411108.66 25585.56 12601.80 22649.48 15826.08 27133.51 15451.24 31527.23
9086.07 27322.40 9596.21 29032.39 13326.57 31532.76 12504.77 34741.8212110.28 17601.72 13558.37 18924.39 16861.03 20652.56 16509.27 22987.05
0.00 0.00 0.00 0.00 8841.01 20967.21 8943.36 18968.694750.001400.00
10490.48 26622.58 11417.97 26615.64 14632.44 28219.55 14247.26 34248.615974.78 15884.33 6822.90 17083.22 8844.32 16136.22 7952.02 18065.776930.84 16987.31 8277.82 20380.42 10802.08 19049.93 10555.81 21201.396588.04 12427.14 7865.41 12489.36 9530.38 13969.80 8792.08 15242.405401.31 14422.09 5369.89 14413.14 6488.43 18017.71 6336.28 20483.819582.79 21085.70 12525.00 24050.38 15204.10 23601.19 13936.33 26917.356094.74 14489.54 6996.19 15178.63 8825.10 16201.56 8375.41 18577.548694.45 21678.12 9826.07 22288.76 12445.37 24358.79 12068.99 26982.578942.55 13047.49 9836.63 14264.37 12222.51 16857.95 11681.39 18073.73
324558.11 755659.85 350568.02 786850.48 442824.36 843306.99 489164.95 1006119.3540723.48 543129.80 51473.14 537148.28 62098.18 612993.33 75745.82 706123.08
41

STATEMENT ‐ IXAnalysis of Revenue Expenditure (` in Lakhs)
Obj Hd ITEM
Total-2
Consolidated Fund (Total-A+Total B)(P+NP)
Plan Non-Plan Plan Non-Plan Plan Non-Plan Plan Non-Plan2009-10 2010-11 RE 2011-12 BE2008-09
283834.63 212530.05 299094.88 249702.20 380726.18 230313.66 413419.13 299996.27
1053030.81 3112898.53 1230268.07 3523423.51 1598012.05 4020911.42 1959647.88 4543785.034165929.34 4753691.58 5618923.47 6503432.91
42

STATEMENT ‐ XMajor Head‐wise Plan & Non‐Plan Expenditure (` in crores)
Plan Non Plan Plan Non Plan Plan Non Plan Plan Non Plan Plan Non Plan A. GENERAL SERVICE
2011 Parliament/State/Union Territory Legislatures 0.00 31.54 0.00 31.04 0.00 31.27 0.00 39.24 0.00 43.27
2012 President, Vice President, Governor, Administrator of Union Territories 0.00 2.10 0.00 2.40 0.00 2.31 0.00 2.55 0.00 2.58
2013 Council of Ministers 0.00 10.35 0.00 10.79 0.00 5.27 0.00 8.21 0.00 8.462014 Administration of Justice 0.00 147.05 0.00 169.42 0.00 163.40 0.20 175.37 6.29 193.942015 Elections 0.00 41.64 0.00 24.99 0.00 60.59 0.00 22.07 0.00 20.06
0.00 232.68 0.00 238.64 0.00 262.84 0.20 247.44 6.29 268.31 (b).Fiscal Services
2020 Collection of Taxes on Income & Expenditure 0.00 2.53 0.00 2.81 0.00 2.87 0.00 2.82 0.00 2.88
2029 Land Revenue 0.00 120.52 0.00 124.22 0.00 120.10 0.00 141.28 0.00 106.282030 Stamps and Registration 0.00 29.06 0.00 19.33 0.00 40.85 0.00 35.67 0.00 39.982039 State Excise 0.00 38.34 0.00 37.96 0.00 40.27 0.00 40.04 0.00 51.902040 Taxes on Sales, Trade, Etc., 8.64 95.28 0.00 117.18 0.00 98.91 5.85 92.11 4.39 97.952041 Taxes on Vehicles 0.23 25.44 0.13 26.84 0.28 28.80 0.48 32.00 0.29 39.64
2045 Other Taxes & Duties on Commodities and Services 0.00 3.28 0.00 3.28 0.00 3.80 0.00 6.55 0.00 4.00
2047 Other Fiscal Services 0.00 37.97 0.00 35.97 0.00 64.90 0.00 39.41 0.00 21.258.87 352.42 0.13 367.59 0.28 400.50 6.33 389.88 4.68 363.88
(c).Interest Payments and Servicing of Debt
2048 Appropriation for Reduction or Avoidance of Debt
2049 Interest Payments 0.00 3291.89 0.00 3710.00 0.00 3794.05 0.00 3764.82 0.00 4236.400.00 3291.89 0.00 3710.00 0.00 3794.05 0.00 3764.82 0.00 4236.40
(d).Administrative Services 2051 Public Service Commission 0.00 5.16 0.00 4.29 0.00 6.17 0.00 9.46 0.00 12.092052 Secretariat-General Services 0.00 37.91 0.00 40.12 0.00 40.70 0.56 44.25 0.77 47.392053 District Administration 0.00 93.08 0.00 100.77 0.00 166.84 0.00 138.25 0.00 157.172054 Treasury and Accounts Administration 0.00 52.27 0.00 40.39 0.00 40.80 0.00 44.14 0.31 45.122055 Police 0.00 797.82 0.00 859.29 0.00 873.18 0.00 1022.69 57.73 1064.482056 Jails 0.00 27.80 0.00 49.02 0.00 52.16 0.00 43.85 0.00 37.952057 Supplies & Disposals 0.00 0.87 0.00 0.51 0.00 0.10
Total:
Total:
Total:
2003-04Major Head Description 2002-03
(a).Oragans of state
2004-05 2005-06 2006-07
43

STATEMENT ‐ XMajor Head‐wise Plan & Non‐Plan Expenditure (` in crores)
Plan Non Plan Plan Non Plan Plan Non Plan Plan Non Plan Plan Non Plan2003-04Major
Head Description 2002-03 2004-05 2005-06 2006-07
2058 Stationery and Printing 2.42 29.12 1.40 30.14 0.45 80.36 0.66 64.35 0.93 76.682059 Public Works 1.47 196.64 1.46 208.72 1.18 214.37 1.35 282.12 3.49 335.102070 Other Administrative Services 2.18 64.91 0.57 70.32 0.84 70.76 2.92 77.80 2.02 88.08
6.07 1305.58 3.43 1403.57 2.47 1545.44 5.49 1726.91 65.25 1864.06
2071 Pension & Other Retirement Benefits 0.00 1773.08 0.00 1900.54 0.00 2156.92 0.00 2236.79 0.00 2495.882075 Miscellaneous General Services 0.00 141.50 0.00 1415.21 0.00 1737.73 0.00 1657.98 0.00 1114.68
0.00 1914.58 0.00 3315.75 0.00 3894.65 0.00 3894.77 0.00 3610.5614.94 7097.15 3.56 9035.55 2.75 9897.48 12.02 10023.82 76.22 10343.21
B.SOCIAL SERVICES Education,Sports,Art and culture
2202 General Education 484.11 2915.53 575.49 3034.44 868.08 3316.78 920.90 3649.92 1150.01 4210.022203 Technical Education 6.21 81.19 4.82 64.73 27.53 68.45 98.75 70.50 92.56 68.892204 Sports and Youth Services 7.45 22.36 12.47 23.02 7.76 23.08 10.70 26.34 16.93 36.842205 Art & Culture 10.25 36.90 9.68 41.38 10.60 35.63 23.31 36.98 80.55 47.43
508.02 3055.98 602.46 3163.57 913.97 3443.94 1053.66 3783.74 1340.05 4363.18 Health and Family Welfare
2210 Medical and Public Health 146.39 647.32 169.00 620.02 163.37 695.38 263.15 740.91 249.04 787.002211 Family Welfare 151.38 8.56 160.89 9.01 168.22 8.63 126.27 8.17 162.16 8.46
297.77 655.88 329.89 629.03 331.59 704.01 389.42 749.08 411.20 795.46 Water Supply,Sanitation and Housing
2215 Water Supply and Sanitation 296.02 6.89 324.53 10.24 292.06 6.19 138.86 9.20 165.42 9.122216 Housing 172.35 14.15 153.32 16.52 134.02 32.60 252.65 20.02 264.88 43.192217 Urban Development 76.44 10.19 236.55 53.06 381.47 11.54 432.53 58.51 703.15 19.69
544.81 31.23 714.40 79.82 807.55 50.33 824.04 87.73 1133.45 72.00 Information and Broadcasting
2220 Information and Publicity 3.28 15.98 1.97 20.77 1.51 24.94 2.37 17.09 3.29 23.903.28 15.98 1.97 20.77 1.51 24.94 2.37 17.09 3.29 23.90
Welfare of SC/ST/OBCs 2225 Welfare of SC,ST and OBC 277.33 213.72 240.98 166.62 289.82 245.10 414.22 261.32 619.55 306.16
277.33 213.72 240.98 166.62 289.82 245.10 414.22 261.32 619.55 306.16 Labour & Labour Welfare
2230 Labour and Employment Training 28.67 35.55 22.99 41.11 27.20 41.04 22.93 43.77 46.74 48.6128.67 35.55 22.99 41.11 27.20 41.04 22.93 43.77 46.74 48.61
Total:
Total:
Total:
Total:
10419.43
Total:
Total:
Total:
9900.23 10035.84
(e).Pension and Miscellaneous General Services
Total:Total A
Total -A (P+NP) 7112.09 9039.11
44

STATEMENT ‐ XMajor Head‐wise Plan & Non‐Plan Expenditure (` in crores)
Plan Non Plan Plan Non Plan Plan Non Plan Plan Non Plan Plan Non Plan2003-04Major
Head Description 2002-03 2004-05 2005-06 2006-07
Social Welfare & Nutrition 2235 Social Security and Welfare 131.62 212.70 196.93 237.82 179.87 238.25 214.56 257.43 546.66 314.732236 Nutrition 39.13 49.35 66.89 61.32 61.59 65.76 85.65 69.78 82.24 129.102245 Relief on Account of Natural Calamities 0.00 192.21 0.00 363.63 0.00 240.20 0.00 474.88 0.00 612.15
170.75 454.26 263.82 662.77 241.46 544.21 300.21 802.09 628.90 1055.98 Others
2250 Other Social Services 0.00 24.12 0.00 15.53 10.10 38.11 103.96 33.79 25.00 53.432251 Secretariat - Social Services 0.00 8.89 0.00 9.32 0.00 7.86 0.00 9.36 0.00 9.85
0.00 33.01 0.00 24.85 10.10 45.97 103.96 43.15 25.00 63.281830.63 4495.61 2176.51 4788.54 2623.20 5099.54 3110.81 5787.97 4208.18 6728.57
C.ECONOMIC SERVICES (a) Agriculture & Allied Activities
2401 Crop Husbandry 119.16 128.77 205.01 124.45 352.90 130.12 206.48 145.61 388.39 183.382402 Soil & Water Conservation 52.64 30.69 92.33 31.38 152.10 31.15 153.30 22.65 126.37 24.322403 Animal Husbandry 24.11 110.34 23.37 105.55 32.87 118.19 49.07 133.91 82.53 137.812404 Dairy Development 1.81 1.71 0.59 12.18 1.65 0.00 9.80 0.00 4.25 11.002405 Fisheries 8.39 10.36 9.14 9.95 17.29 9.98 16.10 10.66 29.88 11.372406 Forestry and Wild Life 106.18 143.50 92.88 242.78 85.00 207.18 83.02 176.33 140.76 188.742408 Food, Storage and Ware Housing 0.00 194.03 0.00 209.55 0.00 613.94 0.00 751.56 0.00 768.072415 Agricultural Research and Education 22.58 82.99 20.80 78.87 30.79 80.84 44.00 72.51 62.00 75.412425 Co-Operation 2.34 37.52 6.28 83.82 51.90 149.00 96.08 895.56 103.63 802.932435 Other Agriculture Programme 0.00 0.00
337.21 739.91 450.40 898.53 724.50 1340.40 657.85 2208.79 937.81 2203.03 (b) Rural Development
2501 Special Programmes for Rural Development 22.70 9.47 19.19 9.24 37.58 8.92 49.75 10.69 43.11 12.082505 Rural Employment 67.74 0.00 44.04 0.00 106.81 0.00 84.38 0.00 75.69 0.002506 Land Reforms 4.43 2.19 2.47 1.41 1.77 1.13 4.60 1.26 1.49 3.592515 Other Rural Development Programmes 329.83 86.19 289.60 89.13 418.76 121.89 491.76 133.56 471.58 299.27
424.70 97.85 355.30 99.78 564.92 131.94 630.49 145.51 591.87 314.94 (c) Special Area Programme
2551 Hill Areas 15.12 0.00 15.62 0.00 16.63 0.00 14.00 0.00 15.07 0.002575 Other Special Area Programme 0.00 31.73 3.75 0.15 30.00 0.10 15.00 142.45 30.07 303.38
15.12 31.73 19.37 0.15 46.63 0.10 29.00 142.45 45.14 303.38
Total:
Total:
Total:
6965.05 7722.74TOTAL B-SOCIAL SERVICES
Total B (P+NP) 8898.78 10936.756326.24
Total:
Total:
45

STATEMENT ‐ XMajor Head‐wise Plan & Non‐Plan Expenditure (` in crores)
Plan Non Plan Plan Non Plan Plan Non Plan Plan Non Plan Plan Non Plan2003-04Major
Head Description 2002-03 2004-05 2005-06 2006-07
(d) Irrigation & Flood Control 2700 Major Irrigation 2701 Major & Medium Irrigation 5.00 64.01 2.03 61.17 3.10 57.50 2.90 65.42 3.12 76.672702 Minor Irrigation 9.33 73.34 22.31 66.60 8.44 124.89 20.04 85.29 20.31 119.942705 Command Area Development 54.56 0.00 26.47 0.00 19.50 0.00 41.67 0.00 73.78 0.002711 Flood Control and Drainage System 0.00 0.48 0.00 0.49 0.00 0.48 0.00 0.49 0.00 0.59
68.89 137.83 50.81 128.26 31.04 182.87 64.61 151.20 97.21 197.20 (e) Energy
2801 Power 56.22 1844.74 45.25 1676.99 166.53 1725.76 10.63 1822.68 27.22 2371.412810 Non Conventional Sources of Energy 5.97 0.00 10.81 0.00 4.43 0.00 3.63 0.00 3.37 0.00
62.19 1844.74 56.06 1676.99 170.96 1725.76 14.26 1822.68 30.59 2371.41 (f) Industries & Minearls
2851 Village and Small Industries 154.28 108.23 86.60 118.81 74.87 190.51 115.07 195.17 179.69 150.352852 Industries 4.89 39.58 5.02 14.38 7.15 33.86 18.01 22.59 11.60 15.37
2853 Non Ferrous Mining and Metallurgical Industries 1.19 4.57 1.01 4.74 0.88 4.50 2.03 4.82 1.70 5.15
2885 Other Outlays on Industries and Minerals 2.24 0.00 0.00 0.00 3.50 0.00 0.00 0.00 2.00 0.00162.60 152.38 92.63 137.93 86.40 228.87 135.11 222.58 194.99 170.87
(g) Transport 3051 Ports and Light Houses 0.00 2.82 0.00 2.93 0.00 2.92 0.00 3.15 0.00 3.223053 Civil Aviation 0.00 0.51 0.00 0.65 0.00 0.70 0.00 1.10 0.00 0.693054 Roads and Bridges 66.87 259.52 47.50 229.92 288.82 208.44 314.88 337.00 581.58 703.833055 Road Transport 0.00 64.43 0.00 28.74 0.00 115.03 0.00 98.46 0.00 272.773056 Inland Water Transport 0.00 1.63 0.00 1.68 0.00 1.68 0.00 1.52 0.00 1.88
66.87 328.91 47.50 263.92 288.82 328.77 314.88 441.23 581.58 982.39 (i) Science,Tech & Environment
3425 Other Scientific Research 1.42 0.00 1.46 0.01 2.10 0.00 8.81 0.01 4.13 0.013435 Ecology and Environment 6.38 0.00 10.84 0.00 6.75 0.00 6.96 0.00 12.19 0.00
7.80 0.00 12.30 0.01 8.85 0.00 15.77 0.01 16.32 0.01 (j) General Economic Services
3451 Secretariat Economic Services 8.81 21.99 4.13 22.35 7.86 22.86 30.38 23.75 14.74 45.003452 Tourism 16.37 1.20 16.72 1.33 56.05 1.42 30.94 1.49 48.32 1.573454 Census Surveys & Statistics 2.29 9.39 3.29 10.66 2.72 10.27 7.29 10.90 4.09 12.023455 Meteorology 0.25 0.00 0.25 0.00 0.33 0.00 0.57 0.00 0.50 0.003456 Civil Supplies 1.94 2.86 0.76 3.16 1.64 3.59 1.95 3.43 2.01 5.06
Total:
Total:
Total:
Total:
Total:
46

STATEMENT ‐ XMajor Head‐wise Plan & Non‐Plan Expenditure (` in crores)
Plan Non Plan Plan Non Plan Plan Non Plan Plan Non Plan Plan Non Plan2003-04Major
Head Description 2002-03 2004-05 2005-06 2006-07
3465 General Financial and Trading Institutions 0.00 0.00 0.00 0.00 0.00 0.00 0.00 0.003475 Other General Economic Services 224.42 34.19 263.18 35.96 507.94 35.01 12.73 827.47 973.48 294.69
254.08 69.63 288.33 73.46 576.54 73.15 83.86 867.04 1043.14 358.341399.46 3402.98 1372.70 3279.03 2498.66 4011.86 1945.83 6001.49 3538.65 6901.57
3604 Grant-in -aid Contribution 0.00 573.71 0.00 628.85 0.00 798.34 0.00 1158.96 29.50 1609.560.00 573.71 0.00 628.85 0.00 798.34 0.00 1158.96 29.50 1609.56
3245.03 15569.45 3552.77 17731.97 5124.61 19807.22 5068.66 22972.24 7852.55 25582.91Total Revenue Account (P+NP)
A GENL. SERVICES A GENERAL. SERVICES
4055 Capital Outlay on Police 22.37 0.00 36.40 0.00 54.88 0.00 124.53 0.00 172.39 0.004059 Capital Outlay on Public Works 53.48 0.00 79.53 12.50 81.33 0.00 93.39 0.00 148.55 0.00
4070 Capital Outlay on Other Administrative Services 0.00 0.00 0.00 0.00
75.85 0.00 115.93 12.50 136.21 0.00 217.92 0.00 320.94 0.00 Total A GENL.SERVICES 75.85 0.00 115.93 12.50 136.21 0.00 217.92 0.00 320.94 0.00 B SOCIAL SERVICES (a) Education,Sports,Art & Culture
4202 Capital Outlay on Education, Sports, Art and Culture 6.40 0.31 5.08 0.23 4.72 0.20 50.58 2.09 54.19 0.79
6.40 0.31 5.08 0.23 4.72 0.20 50.58 2.09 54.19 0.79 (b) Health & Family Welfare
4210 Capital Outlay on Medical & Public Health 43.61 0.00 25.13 0.00 7.97 0.00 7.69 0.00 142.95 0.004211 Capital Outlay on Family Welfare 6.86 0.00 11.64 0.00 0.33 0.00
50.47 0.00 36.77 0.00 8.30 0.00 7.69 0.00 142.95 0.00 (c) Water Supply,Sanitation & Housing
4215 Capital Outlay On Water Supply and Sanitation 37.51 0.00 115.23 0.00 224.28 0.00 720.09 0.00 568.44 0.00
4216 Capital Outlay on Housing 127.71 2.00 144.23 4.35 147.75 0.00 215.87 0.00 225.04 0.004217 Capital Outlay on Urban Development 0.10 0.00 25.00 0.00 39.35 0.00 33.81 0.00 132.00 0.00
Total:
Total:
Total:
CAPITAL EXPENDITURE OUTSIDE REVNUE 28040.90 33435.46
TOTAL -REVENUE ACCOUNT18814.48 21284.74 24931.83
D-GRANT-IN-AID & CONTRIBUTION
Total:
10440.224802.44 4651.73 7947.32
Total:TOTAL -C ECO.SERVICES
TOTAL C (P+NP) 6510.52
47

STATEMENT ‐ XMajor Head‐wise Plan & Non‐Plan Expenditure (` in crores)
Plan Non Plan Plan Non Plan Plan Non Plan Plan Non Plan Plan Non Plan2003-04Major
Head Description 2002-03 2004-05 2005-06 2006-07
165.32 2.00 284.46 4.35 411.38 0.00 969.77 0.00 925.48 0.00 (d) Information & Broadcasting
4220 Capital Outlay on Information & Publicity 1.01 0.00 1.11 0.00 0.66 0.00 1.80 0.00 2.00 0.001.01 0.00 1.11 0.00 0.66 0.00 1.80 0.00 2.00 0.00
(e) Welfare of Sc,St& Obc 4225 Welfare of SC,ST and OBCs 55.10 0.00 88.35 0.00 55.29 0.00 66.37 0.00 164.40 0.00
55.10 0.00 88.35 0.00 55.29 0.00 66.37 0.00 164.40 0.00 (f) Social Welfare & Nutrition
4235 Capital Outlay on Social Security & Welfare 13.62 0.00 6.82 0.00 5.46 0.00 3.57 0.00 2.74 0.0013.62 0.00 6.82 0.00 5.46 0.00 3.57 0.00 2.74 0.00
(g) Other Social Services 4250 Capital Outlay on Other Social Services 1.07 0.00 0.03 0.00 0.03 0.00 3.42 0.00 0.07 0.00
1.07 0.00 0.03 0.00 0.03 0.00 3.42 0.00 0.07 0.00292.99 2.31 422.62 4.58 485.84 0.20 1103.20 2.09 1291.83 0.79
(a) Agricultural & Allied Services 4401 Capital Outlay on Crop Husbandry 0.05 0.00 0.05 0.00 0.10 0.00 0.04 0.00 0.23 0.00
4402 Capital Outlay on Soil and Water Conservation 0.00 0.00 0.00 0.00 0.00 0.00 19.99 0.00 3.86 0.00
4403 Capital Outlay on Animal Husbandry 0.02 0.00 0.00 0.00 0.14 0.00 0.10 0.00 7.51 0.004404 Capital Outlay on Dairy Development4405 Capital Outlay on Fisheries 6.80 0.00 3.26 0.00 7.56 0.00 5.60 -0.04 13.28 -0.024406 Capital Outlay on Forestry & Wild Life 3.57 0.00 2.48 0.00 3.61 0.00 0.78 0.00 6.18 0.00
4408 Capital Outlay on Food Storage & Ware Housing 0.00 0.00 1.00 0.00 0.05 0.00 0.10 0.00 0.10 0.00
4416 Investments in Agricultural Institutions 0.00 0.004425 Capital Outlay on Co- Operation 12.51 0.00 0.65 0.00 8.31 -0.97 0.00 -9.41 3.25 -1.24
22.95 0.00 7.44 0.00 19.77 -0.97 26.61 -9.45 34.41 -1.26 (b) Rural Development
4515 Capital Outlay on Other Rural Development Programmes 0.00 0.10 0.00 0.18 0.00 0.93 0.00 0.96 175.23 1.11
4575 Capital Outlay on Other Special Area Programme
0.00 0.10 0.00 0.18 0.00 0.93 0.00 0.96 175.23 1.11
TOTAL B SOCIAL SERVICESC ECONOMIC SERVICES
Total:
Total:
Total:
Total:
Total:
Total:
Total:
48

STATEMENT ‐ XMajor Head‐wise Plan & Non‐Plan Expenditure (` in crores)
Plan Non Plan Plan Non Plan Plan Non Plan Plan Non Plan Plan Non Plan2003-04Major
Head Description 2002-03 2004-05 2005-06 2006-07
(c) Irrigation & Flood Control 4700 Capital Outlay on Major Irrigation
4701 Capital Outlay on Major & Medium Irrigation 1717.23 200.02 1682.44 82.02 2797.10 7.83 3139.76 3.44 3730.59 3.554702 Capital Outlay on Minor Irrigation 102.99 0.00 109.88 0.00 197.29 0.00 177.22 0.00 360.51 0.00
4705 Capital Outlay on Command Area Development 0.10 0.00 0.00 0.00 0.00 0.00 0.00 0.00 0.40 0.00
4711 Capital Outlay on Flood Control Projects 8.11 0.00 7.11 0.00 7.51 0.00 9.27 0.00 20.69 0.001828.43 200.02 1799.43 82.02 3001.90 7.83 3326.25 3.44 4112.19 3.55
(d) Energy 4801 Capital Outlay on Power Projects 0.00 0.00 50.00 0.00 300.00 130.47
0.00 0.00 0.00 0.00 0.00 0.00 50.00 0.00 300.00 130.47 (e) Industry & Minerals
4851 Capital Outlay on Village & Small Industries 11.37 0.00 1.67 0.00 2.99 0.00 5.25 0.00 0.74 0.00
4852 Capital Outlay on Iron and Steel Industries 2.45 0.00 1.85 0.00 6.20 0.00 6.80 0.00 65.31 -2.414858 Capital Outlay on Engineering Industries -0.40 0.00
4859 Capital Outlay on Telecommunication and Electronics Industries
4860 Capital Outlay on Consumer Industries 0.00 0.00 0.00 0.00 0.08 0.00 0.05 0.00 0.07 0.00
4885 Other Capital Outlay on Industries & Minerals 2.25 0.00 0.00 0.00 0.00 0.00
16.07 0.00 3.52 0.00 8.87 0.00 12.10 0.00 66.12 -2.41 (f) Transport
5051 Capital Outlay on Ports & Light Houses 4.96 0.00 5.10 0.00 5.35 0.00 5.71 0.00 6.95 0.005053 Capital Outlay on Civil Aviation 0.00 0.005054 Capital Outlay on Roads & Bridges 418.12 0.00 505.11 0.00 810.52 34.96 1005.70 19.04 1758.35 0.005055 Capital Outlay on Road Transport 0.00 45.00 0.00 0.00 58.21 0.00
5075 Capital Outlay On Other Transport Services 423.08 0.00 510.21 0.00 815.87 79.96 1011.41 19.04 1823.51 0.00
(g) General Economic Services 5452 Capital Outlay on Tourism 0.00 0.00 0.00 0.005465 Inv.in Genl.Finl and Trdg Insts 74.54 0.00 71.43 0.00 117.72 0.00 48.58 0.00 281.56 0.00
Total:
Total:
Total:
Total:
49

STATEMENT ‐ XMajor Head‐wise Plan & Non‐Plan Expenditure (` in crores)
Plan Non Plan Plan Non Plan Plan Non Plan Plan Non Plan Plan Non Plan2003-04Major
Head Description 2002-03 2004-05 2005-06 2006-07
5475 Capital Outlay on Other General Economic Services -0.36 0.00 -0.47 -0.02 -0.29 -0.15 10.32 -0.55 5.00 -0.47
74.18 0.00 70.96 -0.02 117.43 -0.15 58.90 -0.55 286.56 -0.472364.71 200.12 2391.56 82.18 3963.84 87.60 4485.27 13.44 6798.02 130.992733.55 202.43 2930.11 99.26 4585.89 87.80 5806.39 15.53 8410.79 131.78
LOANS FOR PUBLIC DEBT6003 Internal Debt of the State Government 0.00 4380.05 0.00 6162.05 0.00 2084.60 0.00 393.36 0.00 1012.34
6004 Loans and Advances from Central Government 0.00 1409.19 0.00 3161.01 0.00 3407.59 0.00 417.50 0.00 737.03
Total Public Debt 0.00 5789.24 0.00 9323.06 0.00 5492.19 0.00 810.86 0.00 1749.37 Social Services
6202 Loans for Education, Sports, Art & Culture 9.59 0.006210 Loans for Medical & Public Health 4.62 0.00 3.59 0.006211 Loans For Family Welfare 0.00 0.00 0.11 0.00 0.25 0.00 0.35 0.00 0.10 0.006215 Loans for Water Supply & Sanitation 163.67 0.00 165.71 0.00 126.23 0.00 52.50 0.00 48.00 45.006216 Loans for Housing 0.00 0.00 0.00 0.00 46.40 0.00 75.00 0.006217 Loans for Urban Development 66.36 0.00 87.74 0.00 112.33 0.00 29.26 0.00 154.15 0.006220 Loans for Information and Publicity 6235 Loans for Social Security and Welfare 0.00 0.00 2.91 0.00 0.00 0.00
230.03 0.00 256.47 0.00 238.81 0.00 142.72 0.00 280.84 45.00 Economic Services
6401 Loans for Crop Husbandry 0.00 5.75 0.00 0.00 0.00 0.006402 Loans for Soil and Water Conservation 0.00 0.006405 Loans for Fisheries 0.06 0.00 0.30 0.00 0.16 0.00 0.01 0.00 0.04 0.006406 Loans for Forestry & Wild Life 0.00 0.00 0.01 0.00 0.04 0.006408 Loans for Food Storage & Ware Housing 0.71 0.00 0.39 0.00 4.39 0.00 0.00 0.00 0.00 0.00
6416 Loans for Agricultural Financial Institutions 5.90 0.00 3.16 0.00 3.16 0.00 5.65 0.00 5.93 0.006425 Loans for Co- Operation 9.30 0.00 0.67 0.00 1.77 0.00 0.00 0.00 3.83 0.006801 Loans for Power Projects 47.23 0.00 586.80 0.00 147.78 0.00 18.13 0.00 0.00 0.006851 Loans for Village and Small Industries 13.81 0.00 1.14 0.00 1.75 0.00 0.09 0.00 2.88 0.006852 Loans for Iron and Steel Industries 0.00 148.36 0.00 68.54 0.00 67.28 0.00 27.51 0.00 2.59
2935.98 3029.37 4673.69
Total Social Services
5821.92 8542.57 TOTAL - CAPITAL ACCOUNT Capital Account (P+NP)
Total: TOTAL C ECONOMIC SERVICES
50

STATEMENT ‐ XMajor Head‐wise Plan & Non‐Plan Expenditure (` in crores)
Plan Non Plan Plan Non Plan Plan Non Plan Plan Non Plan Plan Non Plan2003-04Major
Head Description 2002-03 2004-05 2005-06 2006-07
6853 Loans for Non- Ferrous Mining & Metallurgical Industries 0.00 0.00
6857 Loans for Chemical and Pharmaceutical Industries 2.36 0.00 0.00 0.00
6858 Loans for Engineering Industries 0.10 0.00 0.00 0.00 4.02 0.00 12.44 0.00
6859 Loans for Telecommunication & Electronic Industries 0.00 0.00 0.00 0.00
6860 Loans for Consumer Industries 69.02 9.88 45.06 0.00 81.40 0.00 62.15 0.24 12.51 0.006885 Loans for Minerals & other Industries 0.00 8.98 0.00 0.00 0.00 0.00 0.00 0.00 0.00 0.007055 Loans to Road Transports 7075 Loans for Other Transport 14.70 0.00
7465 Loans for General Financial and Trading Institutions 10.94 0.00 3.00 0.00 0.00 0.00 0.00 0.00
7475 Loans for Other General Economic Services 0.00 0.007610 Loans to Government Servants, etc., 0.70 2.97 0.28 1.24 0.11 6.64 0.04 2.26 0.04 1.857615 Miscellaneous Loans 0.00 61.48 0.00 44.16 0.00 54.16 0.00 13.65 0.00 1.68
160.13 237.42 640.80 113.94 244.54 128.08 113.22 43.66 25.27 6.12390.16 237.42 897.27 113.94 483.35 128.08 255.94 43.66 306.11 51.12
6368.74 21798.54 7380.15 27268.23 10193.85 25515.29 11130.99 23842.29 16569.45 27515.1834648.38 35709.14 34973.28 44084.63Total Consolidated Fund (P+NP) 28167.28
Total Economic ServicesTotal F Loans
TOTAL CONSOLIDATED FUND
51

STATEMENT ‐ XMajor Head‐wise Plan & Non‐Plan Expenditure (` in crores)
A. GENERAL SERVICE
2011 Parliament/State/Union Territory Legislatures
2012 President, Vice President, Governor, Administrator of Union Territories
2013 Council of Ministers 2014 Administration of Justice 2015 Elections
(b).Fiscal Services
2020 Collection of Taxes on Income & Expenditure
2029 Land Revenue 2030 Stamps and Registration 2039 State Excise 2040 Taxes on Sales, Trade, Etc., 2041 Taxes on Vehicles
2045 Other Taxes & Duties on Commodities and Services
2047 Other Fiscal Services
(c).Interest Payments and Servicing of Debt
2048 Appropriation for Reduction or Avoidance of Debt
2049 Interest Payments
(d).Administrative Services 2051 Public Service Commission 2052 Secretariat-General Services 2053 District Administration 2054 Treasury and Accounts Administration 2055 Police 2056 Jails 2057 Supplies & Disposals
Total:
Total:
Total:
Major Head Description
(a).Oragans of state
Plan Non Plan Plan Non Plan Plan Non Plan Plan Non Plan Plan Non Plan
0.00 41.70 0.00 42.22 0.00 78.20 0.00 70.58 0.00 93.38
0.00 3.41 0.00 4.55 0.00 4.98 0.00 4.55 0.00 5.250.00 8.92 0.00 8.07 0.00 10.97 0.00 11.76 0.00 13.82
11.40 225.63 18.16 256.07 26.08 285.57 21.17 374.12 31.25 488.990.00 38.21 0.00 125.82 0.00 137.72 0.00 54.27 0.00 66.19
11.40 317.87 18.16 436.73 26.08 517.44 21.17 515.28 31.25 667.63
0.00 3.28 0.00 4.46 0.00 4.89 0.00 6.89 0.00 8.670.00 135.99 0.00 138.44 0.00 154.96 5.00 159.60 0.00 217.910.00 44.68 0.00 41.04 0.00 53.19 0.00 75.67 0.00 74.270.00 65.78 0.00 58.38 0.00 65.24 0.00 80.23 0.00 94.73
11.32 110.95 6.44 125.12 9.44 139.13 8.01 194.98 8.00 227.380.61 41.54 0.75 47.76 0.46 51.56 1.00 59.72 1.00 72.07
0.00 4.75 0.00 9.99 0.00 8.00 0.00 12.61 0.00 14.660.00 30.20 0.00 11.99 0.00 5.02 0.00 6.01 0.00 6.73
11.93 437.17 7.19 437.18 9.90 481.99 14.01 595.71 9.00 716.42
0.00 4505.78 0.00 4532.03 0.00 5212.91 0.00 5542.37 0.00 6950.000.00 4505.78 0.00 4532.03 0.00 5212.91 0.00 5542.37 0.00 6950.00
0.00 10.97 0.00 18.59 0.00 12.76 0.00 19.37 0.00 21.032.27 57.88 0.00 68.58 0.00 74.51 2.50 80.83 3.00 93.05
10.22 178.70 2.61 201.96 4.03 220.07 0.00 230.37 0.00 305.141.21 52.80 1.44 59.97 1.78 63.40 5.00 116.90 4.00 110.75
37.85 1298.29 19.72 1570.91 40.00 1802.16 6.01 1991.02 59.50 2296.581.42 45.15 1.94 50.97 0.00 51.78 0.00 66.27 0.00 75.87
0.00 0.00 0.00 0.00 0.00 0.00
2008-092007-08 2009-10 2010-11-RE 2011-12 BE
52

STATEMENT ‐ XMajor Head‐wise Plan & Non‐Plan Expenditure (` in crores)
Major Head Description
2058 Stationery and Printing 2059 Public Works 2070 Other Administrative Services
2071 Pension & Other Retirement Benefits 2075 Miscellaneous General Services
B.SOCIAL SERVICES Education,Sports,Art and culture
2202 General Education 2203 Technical Education 2204 Sports and Youth Services 2205 Art & Culture
Health and Family Welfare 2210 Medical and Public Health 2211 Family Welfare
Water Supply,Sanitation and Housing 2215 Water Supply and Sanitation 2216 Housing 2217 Urban Development
Information and Broadcasting 2220 Information and Publicity
Welfare of SC/ST/OBCs 2225 Welfare of SC,ST and OBC
Labour & Labour Welfare 2230 Labour and Employment Training
Total:
Total:
Total:
Total:
Total:
Total:
Total: (e).Pension and Miscellaneous General Services
Total:Total A
Total -A (P+NP)
Plan Non Plan Plan Non Plan Plan Non Plan Plan Non Plan Plan Non Plan2008-092007-08 2009-10 2010-11-RE 2011-12 BE
0.83 118.78 20.24 85.78 10.49 81.07 10.00 93.71 11.30 104.202.08 375.80 1.28 424.92 2.98 457.10 5.00 486.13 5.00 453.636.03 115.40 37.61 138.49 2.52 254.52 52.78 433.08 7.10 1055.41
61.91 2253.77 84.84 2620.17 61.80 3017.37 81.29 3517.68 89.90 4515.66
0.00 3240.58 0.00 4112.63 0.00 3408.32 0.00 4297.02 0.00 5500.000.00 31.40 0.00 26.62 0.00 26.51 0.00 29.07 0.00 33.030.00 3271.98 0.00 4139.25 0.00 3434.83 0.00 4326.09 0.00 5533.03
85.24 10786.57 110.19 12165.36 97.78 12664.54 116.47 14497.13 130.15 18382.74
1217.56 5217.11 1692.56 6429.14 1611.72 6439.11 2577.28 7784.87 2631.45 8718.2979.23 82.56 53.71 91.86 65.61 110.04 112.88 147.41 132.00 261.6022.29 44.57 42.16 32.39 99.50 29.03 60.95 37.95 73.08 44.1590.32 57.57 95.98 54.58 142.12 79.34 202.26 84.09 196.76 91.01
1409.40 5401.81 1884.41 6607.97 1918.95 6657.52 2953.37 8054.32 3033.29 9115.05
260.29 1011.39 417.37 1089.66 476.11 1148.33 659.51 1408.71 876.50 1737.10196.15 10.10 250.21 15.46 286.40 16.32 311.44 16.58 369.98 16.68456.44 1021.49 667.58 1105.12 762.51 1164.65 970.95 1425.29 1246.48 1753.78
164.83 10.78 201.17 11.92 135.82 11.30 162.26 12.05 212.80 31.11294.36 45.42 558.17 51.57 602.70 55.47 681.97 177.01 1011.08 181.16926.09 51.57 479.23 82.27 611.50 141.07 1148.64 218.99 655.76 58.19
1385.28 107.77 1238.57 145.76 1350.02 207.84 1992.87 408.05 1879.64 270.46
7.02 22.45 17.39 36.85 7.96 29.52 27.75 46.41 27.05 42.567.02 22.45 17.39 36.85 7.96 29.52 27.75 46.41 27.05 42.56
820.56 413.10 849.38 469.55 1226.45 476.30 2057.29 516.11 2382.03 551.33820.56 413.10 849.38 469.55 1226.45 476.30 2057.29 516.11 2382.03 551.33
86.92 56.86 119.52 62.82 207.14 65.34 242.54 74.68 330.48 85.5886.92 56.86 119.52 62.82 207.14 65.34 242.54 74.68 330.48 85.58
14613.60 18512.8910871.81 12275.55 12762.32
53

STATEMENT ‐ XMajor Head‐wise Plan & Non‐Plan Expenditure (` in crores)
Major Head Description
Social Welfare & Nutrition 2235 Social Security and Welfare 2236 Nutrition 2245 Relief on Account of Natural Calamities
Others 2250 Other Social Services 2251 Secretariat - Social Services
C.ECONOMIC SERVICES (a) Agriculture & Allied Activities
2401 Crop Husbandry 2402 Soil & Water Conservation 2403 Animal Husbandry 2404 Dairy Development 2405 Fisheries 2406 Forestry and Wild Life 2408 Food, Storage and Ware Housing 2415 Agricultural Research and Education 2425 Co-Operation 2435 Other Agriculture Programme
(b) Rural Development
2501 Special Programmes for Rural Development 2505 Rural Employment 2506 Land Reforms 2515 Other Rural Development Programmes
(c) Special Area Programme 2551 Hill Areas 2575 Other Special Area Programme
Total:
Total:
Total:
TOTAL B-SOCIAL SERVICESTotal B (P+NP)
Total:
Total:
Plan Non Plan Plan Non Plan Plan Non Plan Plan Non Plan Plan Non Plan2008-092007-08 2009-10 2010-11-RE 2011-12 BE
492.22 922.70 994.01 968.89 1466.59 1012.39 1984.18 1341.05 1875.72 1292.11111.26 136.12 113.96 141.55 244.22 322.20 279.35 330.00 286.65 332.49
0.00 171.60 0.00 321.84 36.29 1826.43 0.00 160.96 0.00 176.06603.48 1230.42 1107.97 1432.28 1747.10 3161.02 2263.53 1832.01 2162.37 1800.66
15.00 73.44 40.63 71.43 25.12 96.08 44.70 105.56 52.19 122.390.00 12.24 0.00 15.77 0.00 15.34 0.00 18.72 0.00 23.41
15.00 85.68 40.63 87.20 25.12 111.42 44.70 124.28 52.19 145.804784.10 8339.58 5925.45 9947.55 7245.25 11873.61 10553.00 12481.15 11113.53 13765.22
464.13 287.28 755.23 232.86 793.61 254.27 815.90 341.85 2164.83 340.03195.28 48.75 114.73 59.68 56.49 51.93 145.72 59.99 212.19 67.62
81.41 168.11 115.16 192.63 143.92 193.46 194.01 223.61 275.46 246.0227.34 9.02 117.48 0.00 249.02 0.00 334.95 0.00 298.00 0.0017.59 15.03 37.46 17.21 66.86 18.63 60.22 19.68 136.06 18.34
153.59 235.61 215.91 252.38 263.09 512.82 241.50 799.80 197.37 780.801.18 672.63 0.00 752.10 13.00 1192.29 0.16 983.66 0.00 903.76
131.05 100.93 69.13 97.59 72.45 92.64 85.60 178.61 135.00 130.12526.06 1383.07 168.17 140.71 224.47 59.15 385.41 117.82 364.56 73.32
0.00 0.00 0.00 0.00 0.00 0.001597.63 2920.43 1593.27 1745.16 1882.91 2375.19 2263.47 2725.02 3783.47 2560.01
55.00 0.43 66.69 0.44 56.17 0.44 73.68 0.54 49.44 0.5672.04 0.00 78.87 0.00 275.32 0.00 144.83 0.00 139.13 0.00
0.76 2.77 1.55 2.86 1.18 3.60 9.78 5.62 14.69 5.69431.78 396.62 436.07 354.95 401.36 494.43 441.92 805.14 748.34 1106.14559.58 399.82 583.18 358.25 734.03 498.47 670.21 811.30 951.60 1112.39
23.21 0.00 31.73 0.00 26.60 0.00 31.22 0.00 26.78 0.00132.47 171.36 198.00 0.19 474.91 0.00 108.17 0.00 108.17 0.00155.68 171.36 229.73 0.19 501.51 0.00 139.39 0.00 134.95 0.00
19118.86 24878.7513123.68 15873.00 23034.15
54

STATEMENT ‐ XMajor Head‐wise Plan & Non‐Plan Expenditure (` in crores)
Major Head Description
(d) Irrigation & Flood Control 2700 Major Irrigation 2701 Major & Medium Irrigation 2702 Minor Irrigation 2705 Command Area Development 2711 Flood Control and Drainage System
(e) Energy 2801 Power 2810 Non Conventional Sources of Energy
(f) Industries & Minearls 2851 Village and Small Industries 2852 Industries
2853 Non Ferrous Mining and Metallurgical Industries
2885 Other Outlays on Industries and Minerals
(g) Transport 3051 Ports and Light Houses 3053 Civil Aviation 3054 Roads and Bridges 3055 Road Transport 3056 Inland Water Transport
(i) Science,Tech & Environment 3425 Other Scientific Research 3435 Ecology and Environment
(j) General Economic Services 3451 Secretariat Economic Services 3452 Tourism 3454 Census Surveys & Statistics 3455 Meteorology 3456 Civil Supplies
Total:
Total:
Total:
Total:
Total:
Plan Non Plan Plan Non Plan Plan Non Plan Plan Non Plan Plan Non Plan2008-092007-08 2009-10 2010-11-RE 2011-12 BE
0.00 28.67 0.00 0.00 1.20 35.51 0.00 35.354.30 66.36 6.03 34.52 61.46 68.07 12.95 139.09 12.98 187.18
22.88 89.97 26.93 106.37 28.07 105.18 46.83 118.11 36.95 124.1194.62 0.00 59.29 0.00 68.54 0.00 128.99 0.00 710.69 0.00
0.00 0.39 0.00 0.41 0.00 0.44 0.00 0.48 0.00 0.00121.80 156.72 92.25 169.97 158.07 173.69 189.97 293.19 760.62 346.64
5.23 2299.03 0.53 1944.56 0.42 2342.95 27.40 3694.06 1.20 4304.083.50 0.00 6.98 0.00 9.13 0.00 20.18 0.00 19.68 0.008.73 2299.03 7.51 1944.56 9.55 2342.95 47.58 3694.06 20.88 4304.08
216.35 344.73 155.76 211.94 177.58 176.08 225.67 219.17 300.59 228.9981.40 18.25 62.28 18.00 41.50 20.95 204.79 27.68 176.25 25.06
3.21 5.69 3.20 6.29 3.09 8.09 4.32 8.64 6.80 9.422.00 0.00 0.00 0.00 0.00 0.00 0.00 0.00
302.96 368.67 221.24 236.23 222.17 205.12 434.78 255.49 483.64 263.47
0.00 3.93 0.00 53.04 0.00 32.29 0.00 19.45 0.00 28.500.00 0.77 0.00 0.69 0.00 1.41 0.00 1.91 0.00 2.11
579.91 508.52 804.32 457.99 465.00 449.64 467.76 478.23 353.41 835.560.00 230.24 0.00 143.33 0.00 157.22 0.00 317.75 0.00 238.720.00 2.17 0.00 2.36 0.00 2.41 0.00 2.73 0.00 2.84
579.91 745.63 804.32 657.41 465.00 642.97 467.76 820.07 353.41 1107.73
18.65 0.01 12.96 0.01 15.28 0.01 27.36 0.01 31.18 0.018.80 0.00 9.03 0.00 8.30 0.00 15.09 0.00 16.70 0.00
27.45 0.01 21.99 0.01 23.58 0.01 42.45 0.01 47.88 0.01
21.06 46.73 47.51 34.71 61.40 38.82 104.28 54.95 125.83 53.2144.96 2.24 63.23 2.38 93.53 2.54 102.29 2.89 85.52 3.27
0.28 16.92 0.81 17.26 0.36 18.80 18.51 28.26 16.93 38.790.70 0.00 0.70 0.00 6.89 0.00 4.00 0.00 7.00 0.001.32 8.02 2.15 10.08 1.26 7.26 4.46 11.60 0.13 17.42
55
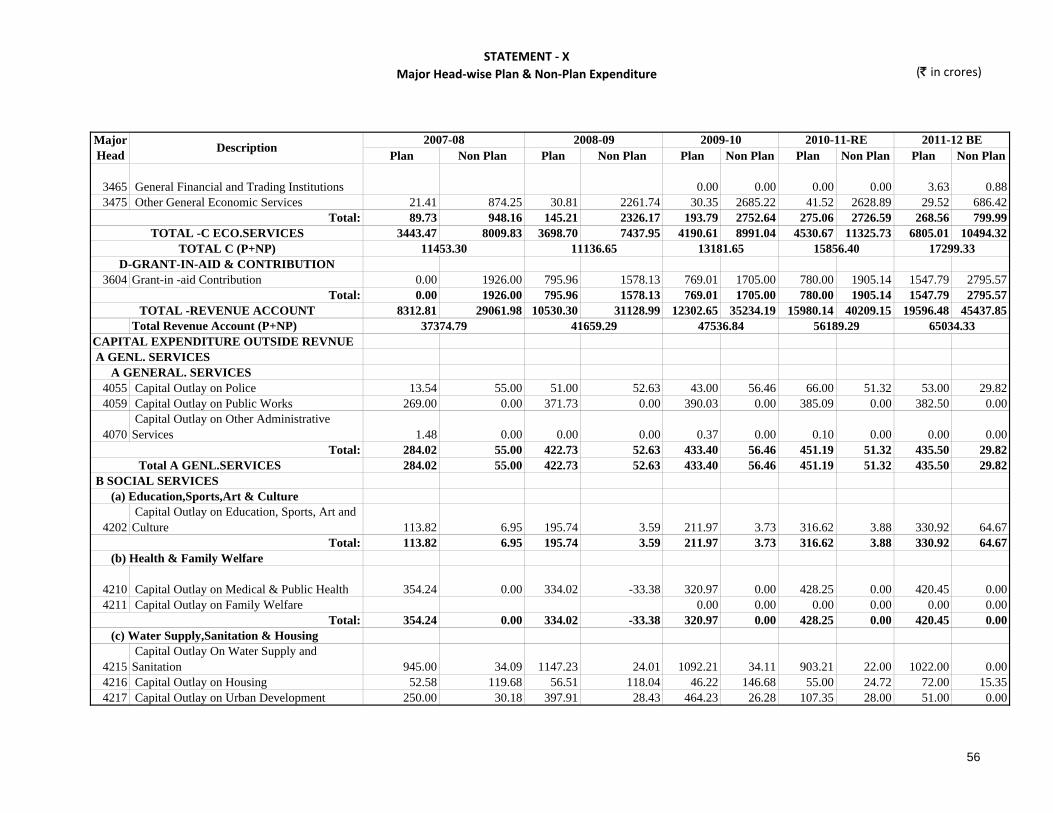
STATEMENT ‐ XMajor Head‐wise Plan & Non‐Plan Expenditure (` in crores)
Major Head Description
3465 General Financial and Trading Institutions 3475 Other General Economic Services
3604 Grant-in -aid Contribution
Total Revenue Account (P+NP)
A GENL. SERVICES A GENERAL. SERVICES
4055 Capital Outlay on Police 4059 Capital Outlay on Public Works
4070 Capital Outlay on Other Administrative Services
Total A GENL.SERVICES B SOCIAL SERVICES (a) Education,Sports,Art & Culture
4202 Capital Outlay on Education, Sports, Art and Culture
(b) Health & Family Welfare
4210 Capital Outlay on Medical & Public Health 4211 Capital Outlay on Family Welfare
(c) Water Supply,Sanitation & Housing
4215 Capital Outlay On Water Supply and Sanitation
4216 Capital Outlay on Housing 4217 Capital Outlay on Urban Development
Total:
Total:
Total:
CAPITAL EXPENDITURE OUTSIDE REVNUE
TOTAL -REVENUE ACCOUNT
D-GRANT-IN-AID & CONTRIBUTION
Total:
Total:TOTAL -C ECO.SERVICES
TOTAL C (P+NP)
Plan Non Plan Plan Non Plan Plan Non Plan Plan Non Plan Plan Non Plan2008-092007-08 2009-10 2010-11-RE 2011-12 BE
0.00 0.00 0.00 0.00 3.63 0.8821.41 874.25 30.81 2261.74 30.35 2685.22 41.52 2628.89 29.52 686.4289.73 948.16 145.21 2326.17 193.79 2752.64 275.06 2726.59 268.56 799.99
3443.47 8009.83 3698.70 7437.95 4190.61 8991.04 4530.67 11325.73 6805.01 10494.32
0.00 1926.00 795.96 1578.13 769.01 1705.00 780.00 1905.14 1547.79 2795.570.00 1926.00 795.96 1578.13 769.01 1705.00 780.00 1905.14 1547.79 2795.57
8312.81 29061.98 10530.30 31128.99 12302.65 35234.19 15980.14 40209.15 19596.48 45437.85
13.54 55.00 51.00 52.63 43.00 56.46 66.00 51.32 53.00 29.82269.00 0.00 371.73 0.00 390.03 0.00 385.09 0.00 382.50 0.00
1.48 0.00 0.00 0.00 0.37 0.00 0.10 0.00 0.00 0.00284.02 55.00 422.73 52.63 433.40 56.46 451.19 51.32 435.50 29.82284.02 55.00 422.73 52.63 433.40 56.46 451.19 51.32 435.50 29.82
113.82 6.95 195.74 3.59 211.97 3.73 316.62 3.88 330.92 64.67113.82 6.95 195.74 3.59 211.97 3.73 316.62 3.88 330.92 64.67
354.24 0.00 334.02 -33.38 320.97 0.00 428.25 0.00 420.45 0.000.00 0.00 0.00 0.00 0.00 0.00
354.24 0.00 334.02 -33.38 320.97 0.00 428.25 0.00 420.45 0.00
945.00 34.09 1147.23 24.01 1092.21 34.11 903.21 22.00 1022.00 0.0052.58 119.68 56.51 118.04 46.22 146.68 55.00 24.72 72.00 15.35
250.00 30.18 397.91 28.43 464.23 26.28 107.35 28.00 51.00 0.00
65034.3337374.79 41659.29 47536.84 56189.29
15856.40 17299.3311453.30 11136.65 13181.65
56

STATEMENT ‐ XMajor Head‐wise Plan & Non‐Plan Expenditure (` in crores)
Major Head Description
(d) Information & Broadcasting 4220 Capital Outlay on Information & Publicity
(e) Welfare of Sc,St& Obc 4225 Welfare of SC,ST and OBCs
(f) Social Welfare & Nutrition
4235 Capital Outlay on Social Security & Welfare
(g) Other Social Services 4250 Capital Outlay on Other Social Services
(a) Agricultural & Allied Services 4401 Capital Outlay on Crop Husbandry
4402 Capital Outlay on Soil and Water Conservation
4403 Capital Outlay on Animal Husbandry 4404 Capital Outlay on Dairy Development4405 Capital Outlay on Fisheries 4406 Capital Outlay on Forestry & Wild Life
4408 Capital Outlay on Food Storage & Ware Housing
4416 Investments in Agricultural Institutions 4425 Capital Outlay on Co- Operation
(b) Rural Development
4515 Capital Outlay on Other Rural Development Programmes
4575 Capital Outlay on Other Special Area Programme
TOTAL B SOCIAL SERVICESC ECONOMIC SERVICES
Total:
Total:
Total:
Total:
Total:
Total:
Total:
Plan Non Plan Plan Non Plan Plan Non Plan Plan Non Plan Plan Non Plan2008-092007-08 2009-10 2010-11-RE 2011-12 BE
1247.58 183.95 1601.65 170.48 1602.66 207.07 1065.56 74.72 1145.00 15.35
1.04 0.00 1.49 0.00 6.00 0.00 9.21 0.00 6.00 0.001.04 0.00 1.49 0.00 6.00 0.00 9.21 0.00 6.00 0.00
201.25 0.00 227.80 0.00 239.74 -0.01 236.68 0.00 320.95 0.00201.25 0.00 227.80 0.00 239.74 -0.01 236.68 0.00 320.95 0.00
19.57 0.00 48.37 0.00 48.19 0.00 108.85 0.00 118.95 0.0019.57 0.00 48.37 0.00 48.19 0.00 108.85 0.00 118.95 0.00
19.28 0.00 5.40 0.00 10.35 0.00 16.75 0.00 21.50 0.0019.28 0.00 5.40 0.00 10.35 0.00 16.75 0.00 21.50 0.00
1956.78 190.90 2414.47 140.69 2439.88 210.79 2181.92 78.60 2363.77 80.02
20.60 0.00 7.38 0.00 11.50 0.00 48.22 0.00 102.00 0.00
3.97 0.00 0.00 0.00 0.00 0.00 0.00 0.00 3.00 0.0039.70 0.00 24.52 0.00 39.68 0.00 43.00 0.00 63.55 0.00
10.0010.06 0.00 4.76 0.00 6.52 -0.01 28.60 0.00 40.00 0.00
3.55 0.00 3.08 0.00 2.96 0.00 3.99 0.00 3.55 0.00
0.00 0.00 0.00 0.00 0.00 0.000.00 0.00 0.00 0.00 0.00 0.00
2.27 -1.21 2.28 -2.17 4.27 -1.03 0.88 0.00 6.57 0.0080.15 -1.21 42.02 -2.17 64.93 -1.04 134.69 0.00 218.67 0.00
136.09 0.82 134.07 0.27 73.00 0.93 130.24 1.25 214.70 1.31
0.00 0.00 0.00 0.00 399.20 0.00 300.00 0.00136.09 0.82 134.07 0.27 73.00 0.93 529.44 1.25 514.70 1.31
57

STATEMENT ‐ XMajor Head‐wise Plan & Non‐Plan Expenditure (` in crores)
Major Head Description
(c) Irrigation & Flood Control 4700 Capital Outlay on Major Irrigation
4701 Capital Outlay on Major & Medium Irrigation 4702 Capital Outlay on Minor Irrigation
4705 Capital Outlay on Command Area Development
4711 Capital Outlay on Flood Control Projects
(d) Energy 4801 Capital Outlay on Power Projects
(e) Industry & Minerals
4851 Capital Outlay on Village & Small Industries
4852 Capital Outlay on Iron and Steel Industries 4858 Capital Outlay on Engineering Industries
4859 Capital Outlay on Telecommunication and Electronics Industries
4860 Capital Outlay on Consumer Industries
4885 Other Capital Outlay on Industries & Minerals
(f) Transport 5051 Capital Outlay on Ports & Light Houses 5053 Capital Outlay on Civil Aviation 5054 Capital Outlay on Roads & Bridges 5055 Capital Outlay on Road Transport
5075 Capital Outlay On Other Transport Services
(g) General Economic Services 5452 Capital Outlay on Tourism 5465 Inv.in Genl.Finl and Trdg Insts
Total:
Total:
Total:
Total:
Plan Non Plan Plan Non Plan Plan Non Plan Plan Non Plan Plan Non Plan2008-092007-08 2009-10 2010-11-RE 2011-12 BE
29.26 2.23 0.00 0.00 24.60 13.09 26.22 13.56
2148.67 928.51 2165.78 317.30 2839.36 540.83 3362.47 661.65 4293.80 460.17344.95 0.00 432.76 0.00 523.78 0.00 740.46 0.00 869.81 0.00
0.00 0.00 5.28 0.00 23.93 0.00 0.01 0.00 50.01 0.0019.37 0.00 33.29 0.00 14.08 0.00 16.30 0.00 14.50 0.00
2512.99 928.51 2666.37 319.53 3401.15 540.83 4143.84 674.74 5254.34 473.73
320.00 112.90 850.00 86.63 1675.00 75.37 538.71 54.67 800.00 16.65320.00 112.90 850.00 86.63 1675.00 75.37 538.71 54.67 800.00 16.65
11.08 -0.03 35.30 0.00 24.87 -0.01 43.46 0.00 21.10 0.00
94.99 -21.31 0.00 0.00 68.76 -0.01 5.54 0.00 29.00 0.000.00 0.00 0.00 0.00 0.00 0.00
1.17 0.00 1.92 0.00 2.15 0.00 37.07 0.00 23.50 0.00
224.21 0.00 110.00 0.00 25.00 0.00 0.00 0.00107.24 -21.34 261.43 0.00 205.78 -0.02 111.07 0.00 73.60 0.00
6.49 0.00 -6.49 0.00 0.00 0.00 1.81 0.00 50.00 0.000.00 0.00 0.00 0.00 0.00 0.00
1270.17 129.96 1913.83 134.13 2291.15 132.40 2169.15 135.00 2505.00 80.00105.00 0.00 205.26 0.00 222.84 0.00 196.00 5.00 209.32 0.00
1381.66 129.96 2112.60 134.13 2513.99 132.40 2366.96 140.00 2764.32 80.00
50.86 0.00 56.13 0.00 94.73 0.00 109.30 0.00 136.60 0.00362.90 55.00 170.43 3.58 201.10 3.30 401.58 3.25 497.00 1.97
58

STATEMENT ‐ XMajor Head‐wise Plan & Non‐Plan Expenditure (` in crores)
Major Head Description
5475 Capital Outlay on Other General Economic Services
LOANS FOR PUBLIC DEBT6003 Internal Debt of the State Government
6004 Loans and Advances from Central Government
Total Public Debt Social Services
6202 Loans for Education, Sports, Art & Culture 6210 Loans for Medical & Public Health 6211 Loans For Family Welfare 6215 Loans for Water Supply & Sanitation 6216 Loans for Housing 6217 Loans for Urban Development 6220 Loans for Information and Publicity 6235 Loans for Social Security and Welfare
Economic Services 6401 Loans for Crop Husbandry 6402 Loans for Soil and Water Conservation 6405 Loans for Fisheries 6406 Loans for Forestry & Wild Life 6408 Loans for Food Storage & Ware Housing
6416 Loans for Agricultural Financial Institutions 6425 Loans for Co- Operation 6801 Loans for Power Projects 6851 Loans for Village and Small Industries 6852 Loans for Iron and Steel Industries
Total Social Services
TOTAL - CAPITAL ACCOUNT Capital Account (P+NP)
Total: TOTAL C ECONOMIC SERVICES
Plan Non Plan Plan Non Plan Plan Non Plan Plan Non Plan Plan Non Plan2008-092007-08 2009-10 2010-11-RE 2011-12 BE
6.12 -0.40 5.00 -0.27 15.00 -0.31 14.89 0.00 12.45 0.00419.88 54.60 231.56 3.31 310.83 2.99 525.77 3.25 646.05 1.97
4958.01 1204.24 6298.05 541.70 8244.68 751.46 8350.48 873.91 10271.68 573.667198.81 1450.14 9135.25 735.02 11117.96 1018.71 10983.59 1003.83 13070.95 683.50
0.00 880.21 0.00 1316.46 0.00 1837.87 0.00 1928.07 0.00 3871.60
0.00 448.56 0.00 461.43 0.00 470.46 0.00 534.93 0.00 590.510.00 1328.77 0.00 1777.89 0.00 2308.33 0.00 2463.00 0.00 4462.11
0.00 0.00 0.00 0.00 0.00 0.003.91 0.00 3.17 0.00 0.00 0.00 0.00 0.00 0.00 0.000.02 0.00 0.71 0.00 0.22 0.00 0.50 0.00 0.00 0.00
95.85 0.00 63.80 0.00 532.51 0.00 832.50 0.00 1189.85 0.00300.00 0.00 100.00 0.00 76.00 0.00 0.00 0.00 0.00 0.00195.03 0.00 0.46 5.20 196.37 0.00 200.00 0.00 500.00 0.00
0.00 0.00 0.00 0.00 2.00 0.00 3.00 0.00594.81 0.00 168.14 5.20 805.10 0.00 1035.00 0.00 1692.85 0.00
0.00 0.00 0.00 0.00 0.00 0.000.00 0.00 0.00 0.00 0.00 0.00
0.04 0.00 0.04 0.00 0.00 0.00 0.00 0.00 0.00 0.000.06 3.00 0.09 0.00 0.00 0.00 0.00 0.00 0.00 0.008.13 0.00 15.53 0.00 18.00 0.00 18.00 0.00 15.00 0.00
8.33 0.00 8.79 0.00 3.30 0.00 4.25 0.00 3.00 0.002.09 0.00 10.79 0.00 5.51 0.00 27.07 0.00 1.11 0.005.55 0.00 0.01 500.00 5.34 0.00 251.44 0.00 150.00 0.000.00 0.00 1.17 0.00 1.66 0.00 3.96 0.00 8.10 0.000.00 0.88 0.00 0.00 0.00 14.33 100.00 0.00 50.00 30.00
12136.67 11987.42 13754.458648.95 9870.27
59

STATEMENT ‐ XMajor Head‐wise Plan & Non‐Plan Expenditure (` in crores)
Major Head Description
6853 Loans for Non- Ferrous Mining & Metallurgical Industries
6857 Loans for Chemical and Pharmaceutical Industries
6858 Loans for Engineering Industries
6859 Loans for Telecommunication & Electronic Industries
6860 Loans for Consumer Industries 6885 Loans for Minerals & other Industries 7055 Loans to Road Transports 7075 Loans for Other Transport
7465 Loans for General Financial and Trading Institutions
7475 Loans for Other General Economic Services 7610 Loans to Government Servants, etc., 7615 Miscellaneous Loans
Total Consolidated Fund (P+NP)
Total Economic ServicesTotal F Loans
TOTAL CONSOLIDATED FUND
Plan Non Plan Plan Non Plan Plan Non Plan Plan Non Plan Plan Non Plan2008-092007-08 2009-10 2010-11-RE 2011-12 BE
0.00 0.00 0.00 0.00 0.00 0.00
0.00 0.00 0.00 0.00 0.00 0.0080.00 0.00 0.00 0.00 1.07 0.00 0.64 0.00 0.00 0.00
0.00 0.00 0.00 0.00 0.00 0.0051.25 0.00 18.99 0.00 76.41 3.75 135.43 0.00 55.00 0.00
0.00 0.00 0.00 0.00 0.00 0.00 0.00 1.00 0.00 5.000.00 0.00 0.00 42.00 0.00 0.00 0.00 0.00
1.11 0.00 0.00 0.00 0.00 0.00 0.00 0.00
0.00 0.00 40.50 0.00 0.00 0.00
0.00 0.00 0.00 0.00 0.00 0.000.08 0.29 0.04 2.56 0.04 5.08 2.00 8.07 2.00 5.820.00 1.15 0.00 0.00 0.00 0.00 0.00 10.00 0.00 50.00
156.64 5.32 55.45 502.56 111.33 65.16 583.29 19.07 284.21 90.82751.45 5.32 223.59 507.76 916.43 65.16 1618.29 19.07 1977.06 90.82
16263.07 31846.21 19889.14 34149.66 24337.04 38626.39 28582.02 43695.05 34644.49 50674.2862963.43 72277.07 85318.7748109.28 54038.80
60

STATEMENT ‐ XISummary of Appropriation Accounts & Control Over Expenditure (` in crores)
1999-2000 2000-01 2001-02 2002-03 2003-04 2004-05 2005-06 2006-07 2007-08 2008-09 2009-10 Original grant/appropriation Revenue 15708.10 17412.02 20223.29 21738.64 22322.37 26020.06 28862.79 35183.86 39761.80 46306.82 47907.38 Capital 2956.50 2217.30 2417.38 3355.13 3865.57 3969.48 5710.79 7276.31 9115.48 11822.58 11950.85 Public Debt 1843.85 1862.44 2056.20 482.34 2392.45 3337.05 2246.17 2304.39 2649.47 3157.18 3554.31 Loans & Advances 298.84 463.22 573.73 2208.93 511.50 665.55 343.63 334.53 646.35 1007.09 1009.09 Others (Interstate settlement) Total 20807.29 21954.98 25270.60 27785.04 29091.89 33992.14 37163.38 45099.09 52173.10 62293.67 64421.63 Supplementary Revenue 1122.47 822.72 903.70 1730.74 2638.71 1535.06 2692.16 4013.30 2746.11 3517.39 8212.26 Capital 190.74 380.78 655.63 368.54 303.90 1240.51 1294.39 3199.40 2217.76 2186.72 3519.88 Public Debt 0.00 8.00 7.28 2501.81 4931.67 500.40 56.54 0.00 0.00 0.00 128.76 Loans & Advances 106.51 153.10 219.36 298.63 139.31 111.94 321.70 180.37 302.18 537.51 117.44 Total 1419.72 1364.60 1785.97 4899.72 8013.59 3387.91 4364.79 7393.07 5266.05 6241.62 11978.34 Total Grants/Appropriation Revenue 16830.57 18234.74 21126.99 23469.38 24961.08 27555.12 31554.95 39197.16 42507.91 49824.21 56119.64 Capital 3147.24 2598.08 3073.01 3723.67 4169.47 5209.99 7005.18 10475.71 11333.24 14009.30 15470.73 Public Debt 1843.85 1870.44 2063.48 2984.15 7324.12 3837.45 2302.71 2304.39 2649.47 3157.18 3683.07 Loans & Advances 405.35 616.32 793.09 2507.56 650.81 777.49 665.33 514.90 948.53 1544.60 1126.53 Others (Interstate settlement) Total 22227.01 23319.58 27056.57 32684.76 37105.48 37380.05 41528.17 52492.16 57439.15 68535.29 76399.97 Actual Expenditure (*) Revenue 15405.86 16859.25 18744.46 19017.84 21413.72 24667.34 28813.36 33883.10 37595.68 42067.22 49469.60 Capital 1819.78 1969.32 2162.59 3045.39 3105.77 4732.58 6192.64 8679.33 8805.81 10363.85 12677.74 Public Debt 570.52 520.55 1447.65 5789.24 9323.06 5492.19 810.86 1749.37 1328.77 1777.90 2308.33 Loans & Advances 316.59 511.30 514.47 627.57 1011.20 611.42 391.80 357.23 756.74 731.34 981.58 Others (Interstate settlement) Total 18112.75 19860.42 22869.17 28480.04 34853.75 35503.53 36208.66 44669.03 48487.00 54940.31 65437.25 Variations [Excess (+)/Savings (-)] Revenue -1424.71 -1375.49 -2382.53 -4451.54 -3547.36 -2887.78 -2741.59 -5314.06 -4912.23 -7756.99 -6650.04 Capital -1327.46 -628.76 -910.42 -678.28 -1063.70 -477.41 -812.54 -1796.38 -2527.43 -3645.45 -2792.99 Public Debt -1273.33 -1349.89 -615.83 2805.09 1998.94 1654.74 -1491.85 -555.02 -1320.70 -1379.28 -1374.74 Loans & Advances -88.76 -105.02 -278.62 -1879.99 360.39 -166.07 -273.53 -157.67 -191.79 -813.26 -144.95 Others (Interstate settlement) Total -4114.26 -3459.16 -4187.40 -4204.72 -2251.73 -1876.52 -5319.51 -7823.13 -8952.15 -13594.98 -10962.72 Savings -4448.72 -3573.62 -4300.77 -5283.22 -5069.55 -3795.55 -6128.53 -8306.58 -8957.29 -13660.83 -11878.14 Excess 334.46 114.46 113.37 1078.50 2817.82 1919.02 809.03 483.44 5.15 65.85 915.42 Overall Savings/Excess -4114.26 -3459.16 -4187.40 -4204.72 -2251.73 -1876.53 -5319.50 -7823.14 -8952.14 -13594.98 -10962.72 Cases and excess requiring regularisation under Art.205 of the Constitution 13 11 10 7 7 5 5 5 3 2 2 Total Surrenders 844.59 1881.52 1078.71 892.86 1022.71 1228.18 753.63 2571.18 2693.14 1393.63 2538.04 Surrenders on the last working day of the financial year 844.59 1881.52 1078.71 892.86 1022.71 1228.18 753.63 2571.18 2693.14 1393.63 1961.16
(*) The figures of actual expenditure shown above, are gross figures which include recoveries /credits
61

STATEMENT ‐ XIIProgressive Capital Expenditure in the form of Equity /Capital Assistance as at the end of 31st March (` in Lakhs)
Sl.No DETAILS 2001 2002 2003 2004 2005 2006 2007 2008 2009 2010
1 Karnataka State Warehousing Corpn 413.65 653.65 653.65 653.65 658.65 668.65 678.65 678.65 678.65 678.652 Karnataka State Finance Corpn 8187.89 8210.89 8210.89 8210.89 8210.89 8210.89 8210.89 8210.89 30631.40 42738.743 Industrial Finance Corpn of India, New Delhi 74.35 59.35 44.35 44.35 44.35 44.35 44.35 39.35 24.35 9.354 Karnataka Electricity Board 43601.00 43601.00 43601.00 43601.00 43601.00 43601.00 43601.00 43601.00 43601.00 43601.005 Karnataka State Road Transport Corpn 35867.26 35867.26 35867.26 35867.26 40367.26 43367.26 43367.26 46867.26 49092.26 51592.266 Bangalore Development Authority 20.00 20.00 20.00 20.00 20.00 20.00 20.00 20.00 20.00 20.007 NW Road Transport Corporation 10.00 10.00 10.00 10.00 10.00 1310.00 1310.00 4810.00 11185.00 13685.008 Bangalore Metro Transport Corpn 10.00 10.00 10.00 10.00 10.00 1310.00 6631.00 6631.00 6631.00 6631.009 Karnataka Power Transmission Corpn 0.07 0.07 0.07 0.07 0.07 0.07 0.07 0.07 25000.07 0.00
10 NE Road Transport Corporation 300.00 300.00 300.00 300.00 300.00 300.00 1400.00 4400.00 5900.00 8400.0088484.22 88732.22 88717.22 88717.22 93222.22 98832.22 105263.22 115258.22 172763.73 167356.00
(B). REGIONAL RURAL BANKS1 Kolar Grameena Bank 241.15 241.15 241.15 241.15 241.15 241.15 0.00 0.00 0.00 0.002 Regional Rural Bank, Bellary 11.25 11.25 11.25 0.00 0.00 0.00 0.00 0.00 0.00 0.003 Malaprabha Grameena Bank, Dharwad 106.76 106.76 106.76 106.76 106.76 106.76 0.00 0.00 0.00 0.004 Cauvery Grameena Bank, Mysore 214.31 214.31 214.31 214.31 214.31 214.31 214.31 214.31 214.31 445.385 Regional Rural Bank, Bijapur 104.26 104.26 104.26 104.26 104.26 104.26 0.00 0.00 0.00 0.006 Regional Rural Bank, North Kanara 3.75 3.75 3.75 0.00 0.00 0.00 0.00 0.00 0.00 0.007 Regional Rural Bank, Mandya 3.75 3.75 3.75 0.00 0.00 0.00 0.00 0.00 0.00 0.008 Krishna Grameena Bank, Gulbarga 296.37 296.37 296.37 296.37 296.37 296.37 296.37 296.37 296.37 296.379 Grameena Bank, Chitradurga 280.85 280.85 280.85 280.85 280.85 280.85 0.00 0.00 0.00 0.00
10 Kalpatharu Rural Bank, Tumkur 231.08 231.08 231.08 231.08 231.07 231.07 231.07 231.07 231.07 0.0011 Nethravathi Grameena Bank, Mangalore 68.66 68.66 68.66 72.41 72.41 72.41 0.00 0.00 0.00 0.0012 Varada Grameena Bank, Kumta 66.16 66.16 66.16 69.91 69.91 69.91 0.00 0.00 0.00 0.0013 Visveswaraiah Grameena Bank, Mandya 74.74 74.74 74.74 78.49 78.49 78.49 78.49 78.49 78.49 78.4914 Sahyadri Grameena Bank, Shimoga 84.91 84.91 84.91 84.91 84.91 84.91 0.00 0.00 0.00 0.0015 Thungabhadra Grameena Bank, Bellary 44.21 44.21 44.21 55.46 55.46 55.46 0.00 0.00 0.00 0.0016 Grameena Bank, Chickmagalore 105.57 105.57 105.57 105.57 105.57 105.57 105.57 105.57 105.57 105.5717 Regional Rural Bank, South Kanara 3.75 3.75 3.75 0.00 0.00 0.00 0.00 0.00 0.00 0.0018 Karnataka Vikas Grameena Bank 0.00 0.00 0.00 0.00 0.00 0.00 353.34 353.34 353.34 353.3419 Pragathi Grameen Bank (**) 0.00 0.00 0.00 0.00 0.00 0.00 662.37 662.37 662.37 562.37
1941.53 1941.53 1941.53 1941.53 1941.52 1941.52 1941.52 1941.52 1941.52 1841.52
1 Karnataka State Indl. Inv.& Dev. Corpn Ltd 11908.29 12433.29 16775.79 21513.79 28235.95 44792.61 62509.84 92055.40 106913.23 127239.28
2 Karnataka State Handicrafts Development Corpn 258.03 258.03 258.03 258.03 258.03 258.03 258.03 258.03 258.03 258.033 Mysore Chrome Tanning Company Ltd. 32.04 32.04 32.04 32.04 32.04 32.04 32.04 32.04 32.04 32.044 Mysore Sugar Company Ltd. 471.99 626.61 626.61 626.61 626.61 626.61 626.61 626.61 626.61 7402.365 Radio & Electricals Mfg. Company Ltd 101.52 101.52 101.52 101.52 101.52 101.52 101.52 101.52 101.52 101.526 Mysore Paints & Varnishes Ltd. 94.18 94.18 94.18 94.18 94.18 94.18 94.18 94.18 94.18 94.187 Thungabhadra Steel Products Ltd 74.00 74.00 74.00 74.00 74.00 74.00 74.00 74.00 74.00 74.008 Hutti Gold Mines Company Ltd 140.27 140.27 140.27 140.27 140.27 140.27 140.27 140.27 300.33 300.33
(A). STATUTORY CORPORATIONS
Total: (A). STATUTORY CORPORATIONS
Total: (B). REGIONAL RURAL BANKS(C). GOVERNMENT COMPANIES
62

STATEMENT ‐ XIIProgressive Capital Expenditure in the form of Equity /Capital Assistance as at the end of 31st March (` in Lakhs)
Sl.No DETAILS 2001 2002 2003 2004 2005 2006 2007 2008 2009 2010
9 Karnataka State Small Industries Dev. Corpn Ltd 1947.72 1972.72 1997.72 1997.72 1997.72 1997.72 1997.72 1997.72 1997.72 1997.7210 New Government Electric Factory Ltd 1548.02 1548.02 1548.02 1548.02 1548.02 1548.02 1548.02 1548.02 1548.02 1548.0211 Visveswaraiah Iron & Steel Ltd., Bhadravathi 3276.23 3276.23 3276.23 3276.23 3276.23 3276.23 3276.23 3276.23 3276.23 3276.2312 Indian Telephone Industries Ltd. 31.25 31.25 31.25 31.25 31.25 31.25 31.25 31.25 31.25 31.25
13 National Projects Constrn. Corpn Ltd. New Delhi 5.00 5.00 5.00 5.00 5.00 5.00 5.00 5.00 5.00 5.0014 Karnataka Agro Industries Corpn Ltd. 348.09 348.09 348.09 348.09 348.09 348.09 348.09 348.09 348.09 348.0915 Karnataka State Construction Corpn Ltd. 205.00 205.00 205.00 205.00 205.00 205.00 205.00 205.00 205.00 205.0016 Mysore Minerals Ltd 97.49 97.49 97.49 97.49 97.48 97.48 97.48 97.48 97.48 97.4817 Karnataka Forest Development Corpn Ltd 1154.05 1179.05 1179.05 1179.05 1179.05 1179.05 1179.05 1179.05 1179.05 1179.0518 Karnataka Power Corporation Ltd 67344.91 67344.91 67344.91 67344.91 67344.91 67344.91 97344.91 97344.91 147344.91 197344.9119 Mysore Paper Mills Ltd 7691.53 7691.57 7691.57 7691.57 7691.57 7691.57 7696.43 7696.43 7696.43 7696.43
20 Karnataka State Handloom Development Corpn 666.00 666.00 666.00 666.00 666.00 666.00 666.00 666.00 666.00 666.0021 Karnataka Fisheries Development Corpn 236.82 236.82 236.82 236.82 236.82 236.82 649.11 1399.11 1399.11 1399.1122 Karnataka Inland Fisheries Dev. Corpn Ltd 182.30 182.30 182.30 182.30 182.30 182.30 182.30 182.30 182.30 182.3023 Karnataka State Tourism Dev.Corpn Ltd 651.71 651.71 651.71 651.71 651.71 651.71 651.71 651.71 651.71 651.7124 MSK Mills Co. Ltd., Gulbarga 94.50 94.50 94.50 94.50 94.50 94.50 94.50 94.50 94.50 94.5025 Karnataka State Forest Industries Corpn Ltd 113.27 113.27 113.27 113.27 113.27 113.27 113.27 113.27 113.27 113.2726 Karnataka State Cashew Dev. Corpn Ltd 343.03 343.03 348.03 348.03 348.03 348.03 348.03 348.03 348.03 348.0327 Mysore Match Company Ltd, Shimoga 0.50 0.50 0.50 0.50 0.50 0.50 0.50 0.50 0.50 0.5028 Kar. State Food & Civil Supplies Corpn Ltd. 225.00 225.00 225.00 325.00 325.00 325.00 325.00 325.00 325.00 325.00
29Fertilisers & Chemicals Travancore Ltd., Udyogamandal (Kerala) 0.55 0.55 0.55 0.55 0.55 0.55 0.55 0.55 0.55 0.55
30 Karnataka State Film Industries Dev. Corpn Ltd. 95.00 95.00 95.00 95.00 95.00 95.00 95.00 95.00 95.00 95.0031 Karnataka Copper Consortium Ltd. 95.06 95.06 95.06 95.06 95.06 95.06 95.06 95.06 0.00 0.0032 Karnataka Seeds Certification Agency 16.13 16.13 16.13 16.13 16.13 16.13 16.13 16.13 16.13 16.1333 Karnataka SC & ST Development Corpn 6707.29 7267.84 7828.39 8388.39 8985.77 9650.77 10455.77 10958.27 11618.27 12308.2734 Chitradurga Copper Company Ltd., Bangalore 65.00 65.00 65.00 65.00 65.00 65.00 65.00 65.00 0.00 0.0035 Karnataka Implements & Machinery Co. Ltd 343.99 343.99 343.99 343.99 343.99 343.99 343.99 343.99 343.99 343.9936 Karnataka Dairy Development Corporation 92.61 92.61 92.61 92.61 92.61 92.61 92.61 299.00 299.00 299.0037 Karnataka Milk Products Limited 201.62 201.62 201.62 201.62 201.62 201.62 201.62 201.62 201.62 201.62
38 Karnataka Meat & Poultry Marketing Corpn Ltd 43.00 43.00 43.00 43.00 43.00 43.00 43.00 43.00 43.00 43.0039 Karnataka Land Army Corporation Ltd 12.04 12.04 1261.82 4320.72 7308.72 14131.72 16694.72 20103.37 22504.47 25915.7940 National Textiles Corporation Ltd. 94.50 94.50 94.50 94.50 94.50 94.50 94.50 94.50 94.50 94.5041 Karnataka State Textiles Corporation Ltd 50.00 50.00 50.00 50.00 50.00 50.00 50.00 50.00 50.00 50.0042 Karnataka State Electronics Dev. Corpn Ltd 787.20 787.20 787.20 787.20 787.20 787.20 787.20 787.20 1287.20 1787.2043 Karnataka Leather Industries Dev. Corpn Ltd 293.67 293.67 293.67 293.67 293.67 293.67 293.67 293.67 293.67 293.6744 Karnataka Backward Classes Dev. Corpn Ltd 5647.25 6147.25 6647.25 7147.25 7447.25 7672.25 8272.25 9454.75 10554.75 11804.7545 Sree Kanteerava Studios Ltd. 59.73 59.73 59.73 59.73 59.73 59.73 59.73 59.73 59.73 59.7346 Karnataka Shipping Corporation Ltd 306.10 306.10 306.10 306.10 306.10 306.10 306.10 306.10 306.10 306.1047 Mysore Tobacco Company Ltd 60.52 60.52 60.52 60.52 60.52 60.52 60.52 60.52 60.52 60.52
63

STATEMENT ‐ XIIProgressive Capital Expenditure in the form of Equity /Capital Assistance as at the end of 31st March (` in Lakhs)
Sl.No DETAILS 2001 2002 2003 2004 2005 2006 2007 2008 2009 201048 Indian Iron & Steel Company Ltd., Calcutta 0.04 0.04 0.04 0.04 0.04 0.04 0.04 0.04 0.04 0.0449 Mysore Acetate & Chemicals Company Ltd. 351.05 351.05 351.05 351.05 351.05 351.05 351.05 351.05 351.05 351.0550 Mysore Electrical Industries Ltd., Bangalore 577.14 577.14 577.14 577.14 577.14 577.14 577.14 577.14 577.14 577.1451 Karnataka Silk Marketing Board Ltd. 292.21 292.21 292.21 292.21 292.21 292.21 292.21 292.21 292.21 292.2152 Karnataka Silk Industries Corpn 905.00 905.00 905.00 905.00 905.00 905.00 905.00 905.00 905.00 905.0053 Karnataka State Seeds Corpn Ltd. 80.92 80.92 80.92 80.92 80.92 80.92 80.92 80.92 80.92 80.9254 Karnataka Vidyuth Karkhane Ltd. 98.00 98.00 98.00 98.00 58.10 58.10 58.10 58.10 58.10 58.1055 Chamundi Machine Tools Ltd 35.00 35.00 35.00 35.00 35.00 35.00 35.00 35.00 35.00 35.0056 Karnataka Soaps & Detergents Ltd. 2163.00 2163.00 2163.00 2163.00 2163.00 2163.00 2163.00 2163.00 2163.00 2163.0057 Karnataka Minorities Development Corpn Ltd 2879.20 3269.20 3636.45 4166.45 4466.45 4841.45 6341.45 7933.95 10183.95 12433.9558 Karnataka State Police Housing Corpn Ltd 178.00 178.00 178.00 12.00 12.00 12.00 12.00 12.00 12.00 12.0059 Karnataka State Women's Dev. Corpn Ltd 706.00 710.00 810.00 858.75 923.75 972.50 972.50 972.50 991.25 991.2560 Karnataka Agro Corn Products Ltd 63.40 63.40 63.40 63.40 63.40 63.40 63.40 63.40 63.40 63.4061 Karnataka Coir Development Corpn Ltd 164.60 188.35 188.35 188.35 188.35 188.35 188.35 188.35 188.35 188.35
62 Karnataka Small Industries Marketing Corpn Ltd 52.29 52.29 52.29 52.29 52.29 52.29 52.29 52.29 52.29 52.2963 Mysore Lamp Works Ltd 78.67 78.67 78.67 78.67 78.67 78.67 78.67 78.67 78.67 78.6764 Cauvery Basin Lift Irrigation Corpn, Mysore 772.78 772.78 772.78 772.78 772.79 772.79 772.79 772.79 772.79 772.7965 Krishna Basin Lift Irrigation Corpn, Bijapur 463.70 463.70 463.70 463.70 463.70 463.70 463.70 463.70 463.70 463.7066 Konkan Railway Corporation 12097.00 12097.00 12097.00 12097.00 12097.00 12097.00 12097.00 12097.00 12097.00 12097.0067 Vijayanagar Steel Plant 558.23 687.29 687.29 687.29 687.29 687.29 687.29 687.29 687.29 687.2968 Karnataka Agro Proteins Ltd. 0.01 0.01 0.01 0.01 0.00 0.00 0.00 0.00 0.00 0.0069 Karnataka Poultry Dev. Federation Board 40.00 40.00 40.00 40.00 40.00 40.00 40.00 40.00 40.00 40.0070 Krishna Bhagya Jala Nigama Ltd 148138.93 191060.43 281143.43 415688.42 603078.00 801728.31 1014175.72 1172638.63 1297852.77 1426744.5871 Karnataka State Power Loom Dev.Corpn 145.00 150.00 151.00 152.00 153.00 154.00 154.00 154.00 154.00 154.00
72 Kar. Urban Infrastructure Dev & Finance Corpn 560.00 560.00 570.00 570.00 570.00 570.00 570.00 570.00 570.00 570.00
73Karnataka State Agril.Produce Processing & Export Corpn Ltd 50.00 50.00 50.00 50.00 50.00 50.00 50.00 50.00 50.00 50.00
74 Karnataka Agriculture Dev. Finance Corpn Ltd 36.00 36.00 36.00 36.00 36.00 36.00 36.00 36.00 36.00 36.0075 Infrastructure Dev. Corpn (Karnataka) Ltd 630.00 1424.00 2130.00 2630.00 0.00 0.00 0.00 0.00 0.00 0.0076 Karnataka Neeravari Nigam Ltd 11952.85 25656.55 38614.52 56396.37 96990.04 152664.95 274746.77 359205.70 400586.30 481662.2277 Visveswariah Vidyuth Nigam Ltd 0.07 0.07 0.07 0.07 0.07 0.07 0.07 0.07 0.07 0.0778 Karnataka Road Development Corpn Ltd 1673.00 2883.00 6519.00 11566.03 23862.65 36833.72 81251.72 121737.03 177950.42 250460.1579 Rajeev Gandhi Rural Housing Corpn 300.00 300.00 4499.93 8214.93 13028.93 13028.93 13028.93 13028.93 13028.93 13028.9380 Karnataka Housing Board 0.00 0.00 8270.19 18570.19 27803.60 49066.55 65080.48 80243.92 94338.50 109006.5381 Rail Infrastructure Dev.Corpn (Karnataka) Ltd. 0.00 0.00 2630.00 4334.50 9334.50 15920.50 26309.50 38454.42 61231.17 81237.4182 Kar.State Brewerages Corpn 0.00 0.00 0.00 200.00 200.00 200.00 200.00 200.00 200.00 1200.0083 Sanna Neeravari Nigam 0.00 0.00 0.00 0.00 0.00 0.00 0.00 0.00 0.00 0.0084 Chamundeswari Electricity Supply Com Ltd. 0.00 0.00 0.00 0.00 0.00 0.00 5000.00 5000.00 5000.00 12000.00
85Karnataka Scheduled Tribe Development Corporation Limited, Bangalore 0.00 0.00 0.00 0.00 0.00 0.00 0.00 182.50 382.50 572.50
86Karnataka Power Transmission Corporation Limited, Bangalore 0.00 0.00 0.00 0.00 0.00 0.00 0.00 0.00 0.00 47500.07
87 Bangalore Electricity Supply Company Limited 0.00 0.00 0.00 0.00 0.00 0.00 0.00 0.00 0.00 17800.00
64

STATEMENT ‐ XIIProgressive Capital Expenditure in the form of Equity /Capital Assistance as at the end of 31st March (` in Lakhs)
Sl.No DETAILS 2001 2002 2003 2004 2005 2006 2007 2008 2009 201088 Hubli Electricity Supply Company Limited 0.00 0.00 0.00 0.00 0.00 0.00 0.00 0.00 0.00 31500.00
89 Mangalore Electricity Supply Company Limited 0.00 0.00 0.00 0.00 0.00 0.00 0.00 0.00 0.00 4700.0090 Gulbarga Electricity Supply Company Limited 0.00 0.00 0.00 0.00 0.00 0.00 0.00 0.00 0.00 16500.0091 Mysore Sales International Limited 0.00 0.00 0.00 0.00 0.00 0.00 0.00 0.00 0.00 383.20
300256.09 361227.31 490871.48 674035.50 941666.41 1261506.06 1725458.60 2073544.71 2405211.85 2934139.97
1 Mysore Coffee Curing Works Ltd 3.95 3.95 3.95 3.95 3.95 3.95 3.95 3.95 3.95 0.002 Binny Ltd 0.06 0.06 0.06 0.06 0.06 0.06 0.06 0.06 0.06 0.063 Mysore Spinning & Manufacturing Company 2.34 2.34 2.34 2.34 2.34 2.34 2.34 2.34 2.34 2.344 Mysore Silk Filatures Ltd., Siddlaghatta 0.60 0.60 0.60 0.60 0.60 0.60 0.60 0.60 0.60 0.605 Mysore Kirloskar Ltd 5.43 5.43 5.43 5.43 5.43 5.43 5.43 5.43 5.43 5.436 IDL Industries Ltd., Hyderabad 7.22 7.22 7.22 7.22 7.23 7.23 7.23 7.23 7.23 7.237 Mysore Paints & Water Proofs Ltd. -0.40 -0.40 -0.40 -0.40 -0.40 -0.40 -0.40 -0.40 -0.40 -0.408 Sri Shankara Textiles Mills Ltd., Davanagere 0.01 0.01 0.01 0.01 0.00 0.00 0.00 0.00 0.00 0.009 Relmar Electric Company Ltd., Madras 0.01 0.01 0.01 0.01 0.02 0.02 0.02 0.02 0.02 0.02
10 Sandur Plantation & Sandur Tobacco Co. Ltd 1.60 1.60 1.60 1.60 1.60 1.60 1.60 1.60 1.60 1.6011 Kobay Silk Mills Ltd., Modgi 0.16 0.16 0.16 0.16 0.16 0.16 0.16 0.16 0.16 0.1612 Mandya National Paper Mills Ltd., Belagula 82.96 82.96 82.96 82.96 82.96 82.96 82.96 82.96 82.96 82.9613 Associated Cement Companies Ltd., Bombay 16.38 16.38 16.38 16.38 16.38 16.38 16.38 16.38 16.38 16.3814 Tata Investment Corpn Ltd., Bombay 7.39 7.39 7.39 7.39 7.40 7.40 7.40 7.40 7.40 7.4015 Tata Hydro Electric Power Co. Ltd., Bombay 1.09 1.09 1.09 1.09 1.09 1.09 1.09 1.09 1.09 1.09
16 Andhra Valley Power Supply Company, Bombay 0.03 0.03 0.03 0.03 0.03 0.03 0.03 0.03 0.03 0.0317 Malanpur Steel Limited 3.29 3.29 3.29 3.29 3.29 3.29 3.29 3.29 3.29 3.2918 Tata Chemicals Ltd., Bombay 3.99 3.99 3.99 3.99 3.99 3.99 3.99 3.99 3.99 3.9919 Mafatlal Engineering Industries Ltd., Bombay 0.04 0.04 0.04 0.04 0.04 0.04 0.04 0.04 0.04 0.04
20 Tata Engineering Locomotive Co. Ltd., Bombay 25.87 25.87 25.87 25.87 25.87 25.87 25.87 25.87 25.87 25.8721 National Radio Electronics Co.Ltd., Bombay 0.39 0.39 0.39 0.39 0.39 0.39 0.39 0.39 0.39 0.3922 Tata Iron & Steel Company Ltd., Bombay 8.34 8.34 8.34 8.34 8.34 8.34 8.34 8.34 8.34 8.3423 Investa Ltd., Bombay 0.81 0.81 0.81 0.81 0.81 0.81 0.81 0.81 0.81 0.8124 Ugar Sugar Works Ltd., Sangli 4.34 4.34 4.34 4.34 4.34 4.34 4.34 4.34 4.34 4.3425 Mysore Cements Ltd., Bangalore 23.46 23.46 23.46 23.46 23.46 23.46 23.46 23.46 23.46 23.4626 Industrial & Prudential Inv. Co.Ltd., Bombay 0.01 0.01 0.01 0.01 0.00 0.00 0.00 0.00 0.00 0.0027 Industrial & Investment Trust Ltd., Bombay 0.42 0.42 0.42 0.42 0.43 0.43 0.43 0.43 0.43 0.4328 Tata Power Company Ltd., Bombay 2.78 2.78 2.78 2.78 2.78 2.78 2.78 2.78 2.78 2.7829 Sugarcane Product Industries Ltd., Bijapur 0.05 0.05 0.05 0.05 0.05 0.05 0.05 0.05 0.05 0.0530 Indian Vegetables Product Ltd., Bombay 2.10 2.10 2.10 2.10 2.10 2.10 2.10 2.10 2.10 2.1031 Krishna Sugar Mills Ltd., Kittur 2.86 2.86 2.86 2.86 2.86 2.86 2.86 2.86 2.86 2.8632 Scindia Steam Navigation Co Ltd., Bombay 1.18 1.18 1.18 1.18 1.18 1.18 1.18 1.18 1.18 1.1833 Sri Ganapathi Mills Ltd., Kundagol 0.05 0.05 0.05 0.05 0.05 0.05 0.05 0.05 0.05 0.0534 Kanoria Industries Ltd., Bombay 9.89 9.89 9.89 9.89 9.89 9.89 9.89 9.89 0.00 0.0035 Rainbow Record Company Ltd 0.01 0.01 0.01 0.01 0.01 0.01 0.01 0.01 0.01 0.0136 Deepak Insulated Cable Corpn Ltd., Madras 4.20 4.20 4.20 4.20 4.20 4.20 4.20 4.20 4.20 4.20
Total: (C). GOVERNMENT COMPANIES(D). JOINT STOCK COMPANIES
65

STATEMENT ‐ XIIProgressive Capital Expenditure in the form of Equity /Capital Assistance as at the end of 31st March (` in Lakhs)
Sl.No DETAILS 2001 2002 2003 2004 2005 2006 2007 2008 2009 2010
37 Banana & Fruit Development Corpn Ltd., Madras 1.44 1.44 1.44 1.44 1.44 1.44 1.44 1.44 1.44 1.44
38Walchandnagar Industries Ltd., Dharwad (Bombay) 2.00 2.00 2.00 2.00 2.00 2.00 2.00 2.00 2.00 2.00
39 Sri Valliappa Textiles Ltd., Hejjala, Bangalore 1.20 1.20 1.20 1.20 1.20 1.20 1.20 1.20 1.20 1.2040 Premier Construction Company Ltd., Bombay 0.00 0.00 0.00 0.00 0.00 0.00 0.00 0.00 0.00 0.0041 Karnataka Urban Development Corpn Ltd. 16.00 16.00 16.00 16.00 16.00 16.00 16.00 16.00 16.00 16.00
42 Karnataka Truck Terminals Pvt. Ltd., Bangalore 15.00 15.00 15.00 15.00 15.00 15.00 15.00 15.00 15.00 15.0043 Bangalore International Airport 130.00 260.00 260.00 260.00 260.00 260.00 260.00 260.00 260.00 260.0044 Infrastructure Dev. Corpn (Karnataka) Ltd (*) 0.00 0.00 0.00 0.00 2680.00 2730.00 2780.00 2880.00 2930.00 2930.0045 Bagalkot Udyog Limited 0.00 0.00 0.00 0.00 0.00 0.00 0.00 0.00 9.89 9.8946 Bangalore Metro Rail Corporation 0.00 0.00 0.00 0.00 0.00 0.00 0.00 0.00 50000.00 50000.00
388.55 518.55 518.55 518.55 3198.57 3248.57 3298.57 3398.57 53448.57 53444.62
1 Credit Co-operatives 7156.72 7156.72 7156.72 7156.72 7155.35 7155.22 7155.22 7155.22 7155.22 7473.222 Housing Co-operatives 189.63 189.63 189.63 189.63 189.63 189.63 189.63 189.63 189.63 189.633 Labour Co-operatives 7.38 7.38 7.38 7.38 7.38 7.38 7.38 7.38 7.38 7.384 Farming Co-operatives 133.06 133.06 133.06 133.06 133.06 133.06 133.06 133.06 133.06 133.065 Warehousing & Marketing Co-operatives 2929.62 3729.62 4729.62 4729.63 4729.63 4729.63 4729.63 4729.63 4729.63 4729.636 Processing Co-operatives 1913.67 1913.67 1918.67 1918.67 1918.67 1918.67 1918.67 1918.67 1918.67 1918.677 Dairy Co-operatives 215.09 215.09 215.09 215.10 215.10 215.10 215.10 11.71 11.71 11.718 Fisherman's Co-operatives 603.30 603.30 680.60 695.61 710.91 706.58 709.13 712.69 712.30 711.459 Co-operative Sugar Mills 7243.59 7368.59 7368.59 7368.59 7368.59 7368.59 7368.59 7368.59 7368.59 7368.59
10 Co-operative Spinning Mills 4240.45 4240.45 4240.45 4240.45 4248.89 4253.89 4255.89 4255.89 4289.64 4357.1411 Industrial Co-operatives 767.60 767.60 767.60 767.61 767.61 767.61 767.61 767.61 767.61 767.6112 Consumer Co-operatives 670.11 670.11 670.11 670.11 670.11 670.11 670.11 670.11 670.11 670.1113 Tribal Area Sub-Plan 129.87 129.87 129.87 129.87 129.87 129.87 129.87 129.87 129.87 129.8714 Other Co-operatives 4228.94 4462.00 4753.24 4956.58 5838.65 5350.91 5597.19 5713.84 5734.55 5750.6615 Other Expenditure 27.65 27.65 27.65 27.65 27.65 27.65 27.65 27.65 27.65 27.6516 Water Users Co-operative Societies 0.00 0.00 0.00 0.00 0.00 0.00 0.00 0.00 0.00 0.00
30456.68 31614.74 32988.28 33206.66 34111.10 33623.90 33874.73 33791.55 33845.62 34246.38(A). STATUTORY CORPORATIONS 88484.22 88732.22 88717.22 88717.22 93222.22 98832.22 105263.22 115258.22 172763.73 167356.00(B). REGIONAL RURAL BANKS 1941.53 1941.53 1941.53 1941.53 1941.52 1941.52 1941.52 1941.52 1941.52 1841.52(C). GOVERNMENT COMPANIES 300256.09 361227.31 490871.48 674035.50 941666.41 1261506.06 1725458.60 2073544.71 2405211.85 2934139.97(D). JOINT STOCK COMPANIES 388.55 518.55 518.55 518.55 3198.57 3248.57 3298.57 3398.57 53448.57 53444.62(E). CO-OPERATIVE SOCIETIES 30456.68 31614.74 32988.28 33206.66 34111.10 33623.90 33874.73 33791.55 33845.62 34246.38
TOTAL 421527.07 484034.35 615037.06 798419.46 1074139.82 1399152.27 1869836.64 2227934.57 2667211.29 3191028.49GRAND TOTAL 421527.07 484034.35 615037.06 798419.46 1074139.82 1399152.27 1869836.64 2227934.57 2667211.29 3191028.49
Dividend Received 274.65 513.66 1493.23 1690.05 1666.09 1687.68 1948.01 2335.14 4013.82 2947.72Interest Received 618.38 543.15 639.08 106.64 6.72 6.78 5.84 6.45 5.51 3.50Total Dividend & Interest 893.03 1056.81 2132.31 1796.69 1672.81 1694.46 1953.85 2341.59 4019.33 2951.22
Total: (D). JOINT STOCK COMPANIES(E). CO-OPERATIVE SOCIETIES
Total : (E). CO-OPERATIVE SOCIETIES
66

STATEMENT ‐ XIIProgressive Capital Expenditure in the form of Equity /Capital Assistance as at the end of 31st March (` in Lakhs)
Sl.No DETAILS 2001 2002 2003 2004 2005 2006 2007 2008 2009 2010% of Dividend to Total 0.07 0.11 0.24 0.21 0.16 0.12 0.10 0.10 0.15 0.09% of Interest to Total 0.15 0.11 0.10 0.01 0.00 0.00 0.00 0.00 0.00 0.00% of Dividend & Interest to Total 0.21 0.22 0.35 0.23 0.16 0.12 0.10 0.11 0.15 0.09
(**) Pragathi Grameena Bank has been formed by the amalgamation of Kolar Grdra Grameena Bank, Bellary. The Investment of Government in the four Banks shown in the previous years (*) Infrastructure Dev. Corpn (Karnataka)Ltd is considered as Joint Stock Company
67

STATEMENT ‐ XIIIState Resources for Plan Expenditure (` in crores)
ITEM 2000-01 2001-02 2002-03 2003-04 2004-05 2005-06 2006-07 2007-08 2008-09 2009-10 2010-11 RE 2011-12 BE Central Taxes 2504.72 2623.38 2786.20 3244.73 3878.44 4213.42 5374.33 6779.23 7153.77 7000.00 9060.09 11420.02 State Taxes 10131.62 9853.26 10439.71 12570.21 16072.32 18631.55 23301.03 25986.76 27645.66 29338.72 36228.32 43817.1 State Non-Taxes 1105.20 1001.11 1081.84 1488.10 2685.76 2158.01 2928.77 3291.30 3095.80 2404.44 2741.37 3452.26 Others 167.17 155.88 381.51 505.03 317.49 1735.74 2224.37 1482.43 1651.57 2828.46 1263.62 1684.88 Total 13908.71 13633.63 14689.26 17808.07 22954.01 26738.72 33828.50 37539.72 39546.80 41571.62 49293.40 60374.26 NPRE 14844.64 14569.98 15373.64 16261.72 18020.66 21255.52 24413.25 28995.60 31065.79 33178.41 37919.35 45215.31 BCR -935.93 -936.35 -684.38 1546.35 4933.35 5483.20 9415.25 8544.12 8481.01 8393.21 11374.05 15158.95 A.Estimates at Current Prices I. Budgetary Support 1. Balance from current revenues -935.92 -936.33 -684.39 1546.35 4933.35 5483.20 9415.25 8544.12 8481.00 8393.21 11374.04 15158.95 2. Grants for Special Problems 166.43 187.56 115.90 144.03 62.41 0.00 0.00 48.50 42.03 254.12 0.00 0 3. Market Borrowings 1047.03 1048.91 900.18 2602.85 2116.14 165.50 -232.54 287.48 6583.41 5953.43 7028.19 8199.75 4. Share of Small Savings 1285.14 1464.11 1755.84 2733.05 4386.26 4327.25 2592.76 209.34 -164.09 185.53 137.63 1155.85 5. State Provident Funds 641.00 572.71 626.74 559.03 585.39 655.87 659.38 748.38 1176.24 1700.35 1550.35 1585 6. Loans from financial Institutions 398.00 348.41 239.47 447.32 208.62 250.93 289.33 333.50 459.60 550.00 750.00 750 7. Normal & Additional Central Plan Asst 2657.06 2720.94 1990.56 2119.28 2505.07 1981.39 1927.68 2707.56 2616.54 3236.67 3548.82 5653.98 7a. Power Bonds 0.00 0.00 0.00 0.00 60.12 1.94 9.40 0.79 5.79 30.00 15.00 15 8. Misc. Capital Receipts -375.02 40.42 814.55 -4053.63 -5470.64 -2646.93 772.97 1646.38 -1378.00 1362.17 887.23 -379.59 9. ARM Budgetary 0.00 0.00 0.00 0.00 0.00 0.00 0.00 0.00 0.00 0.00 0.00 0 10. Adjustment of OB & CB (OB-CB) 67.25 -27.42 -73.88 57.65 -9.67 -29.59 -179.73 141.98 448.35 -313.65 -51.42 -294.78 Total Budgetary Support(1 to 10) - CSS/CPS 4923.61 5403.62 5542.19 6071.79 9405.80 10169.06 15424.27 14741.94 18046.55 21339.71 25222.44 31798.41 Less Amt Spent on CSS/CPS 27.36 15.69 142.78 84.14 -28.75 20.5 -169.77 -73.91 224.32 12.12 17.4 45.75 II. IEBR 1. Internal Resources of KEB/KPC/KSRTC 302.32 318.61 529.04 172.1 396.88 297.53 602.67 862.94 817.58 704.88 1226.57 1142.38 2. EBR of Boards & Corportions 2677.81 2625.27 2092.69 1824.61 2086.01 2211.69 2281.74 1622.03 3712.62 3395.13 3074.91 5129.21 Total IEBR(1+2) 2980.13 2943.88 2621.73 1996.71 2482.89 2509.22 2884.41 2484.97 4530.20 4100.01 4301.48 6271.59 III. Net resources available [I + II ] 7903.74 8347.50 8163.92 8068.50 11888.69 12678.28 18308.68 17226.91 22576.75 25439.72 29523.92 38070.00
68

STATEMENT ‐ XIVSectoral Outlay of State Plan Schemes (` in crores)
Heads of Development 2002-03 2003-04 2004-05 2005-06 2006-07 2007-08 2008-09 2009-10 2010-11 RE 2011-12 BE
01 Agriculture & Allied Activities001 Crop Husbandry 72.45 158.62 296.26 127.92 338.07 405.26 715.92 752.28 844.86 2164.48002 Soil and Water Conservation 37.77 68.83 124.91 130.23 88.96 163.38 71.69 31.24 93.10 162.55003 Animal Husbandry 20.67 22.84 25.98 38.96 79.59 110.08 124.74 167.56 217.08 327.11004 Dairy Development 0.93 0.04 0.02 7.01 0.00 26.50 114.80 247.73 334.95 288.00005 Fisheries 12.49 8.21 12.36 11.21 34.67 18.98 35.06 65.23 73.82 169.49006 Forestry 87.05 79.73 71.10 70.61 127.29 133.45 190.23 233.70 193.17 153.59007 Environmental Forestry and Wild Life 0.23 0.79 0.27 1.05 5.31 3.15 3.84 4.09 10.50 13.50008 Food, Storage and Warehousing 0.71 1.39 4.44 0.10 0.10 9.68 15.76 18.11 18.00 15.00009 Agriculture Research & Education 22.58 20.80 30.79 44.00 62.00 131.05 69.13 72.45 85.60 135.00010 Investment in Agricultural Financial Institutions 5.90 3.16 3.16 5.65 5.93 8.33 8.79 3.30 4.25 3.00
011 Other Agricultural Programmes, Marketing and Quality Control 4.10 3.67 10.49 7.00 10.70 11.20 10.00 2.00 3.25 3.50
012 Co-operation 22.77 7.20 61.58 96.16 110.83 530.60 181.44 234.44 423.52 395.43Total: 01 287.65 375.28 641.36 539.90 863.45 1551.66 1541.40 1832.13 2302.10 3830.65
02 Rural Development013 Special Programme for Rural Development 21.30 20.37 67.23 42.68 148.61 260.20 613.54 1107.60 1132.73 1010.78014 Rural Employment 67.74 44.04 106.81 84.38 0.00 0.00 0.00 0.00 0.00 0.00015 Land Reforms 2.19 1.59 0.89 0.96 147.68 0.76 195.76 299.67 203.50 203.90016 Other Rural Development Programme 0.00 0.00 0.00 0.00 175.23 136.09 134.07 60.00 78.54 128.00017 Community Development 227.67 231.43 366.59 318.64 355.12 327.31 379.06 307.42 369.49 496.72
Total: 02 318.90 297.43 541.52 446.66 826.64 724.36 1322.43 1774.69 1784.26 1839.4003 Special Area Programme
018 Hyderabad-Karnataka, Malnad and Border Area Development Programme 101.71 55.70 49.03 169.26 115.37 100.82 88.06 132.53 146.82 354.00Total: 03 101.71 55.70 49.03 169.26 115.37 100.82 88.06 132.53 146.82 354.00
04 Irrigation & Flood Control019 Major and Medium Irrigation 2761.68 2259.97 3531.25 3579.39 3951.75 2058.41 2043.16 2939.40 3600.02 5434.00020 Minor Irrigation 113.92 133.85 205.73 197.26 357.54 361.96 457.13 551.85 787.62 956.76021 Command Area Development 33.15 12.37 9.50 31.21 54.56 64.68 47.82 73.00 104.00 438.15022 Flood Control (Including Anti-Sea Erosion,etc.) 8.11 7.11 7.51 9.27 20.69 19.37 33.29 14.08 16.30 14.50
Total: 04 2916.86 2413.30 3753.99 3817.13 4384.54 2504.42 2581.40 3578.33 4507.94 6843.4105 Energy023 Power 860.07 1273.75 1481.15 1372.76 2259.77 2047.78 3597.47 4058.70 3043.46 4388.66024 Non-Conventional Source of Energy 5.74 2.05 3.91 1.91 1.37 1.97 3.23 4.68 8.86 7.22
69
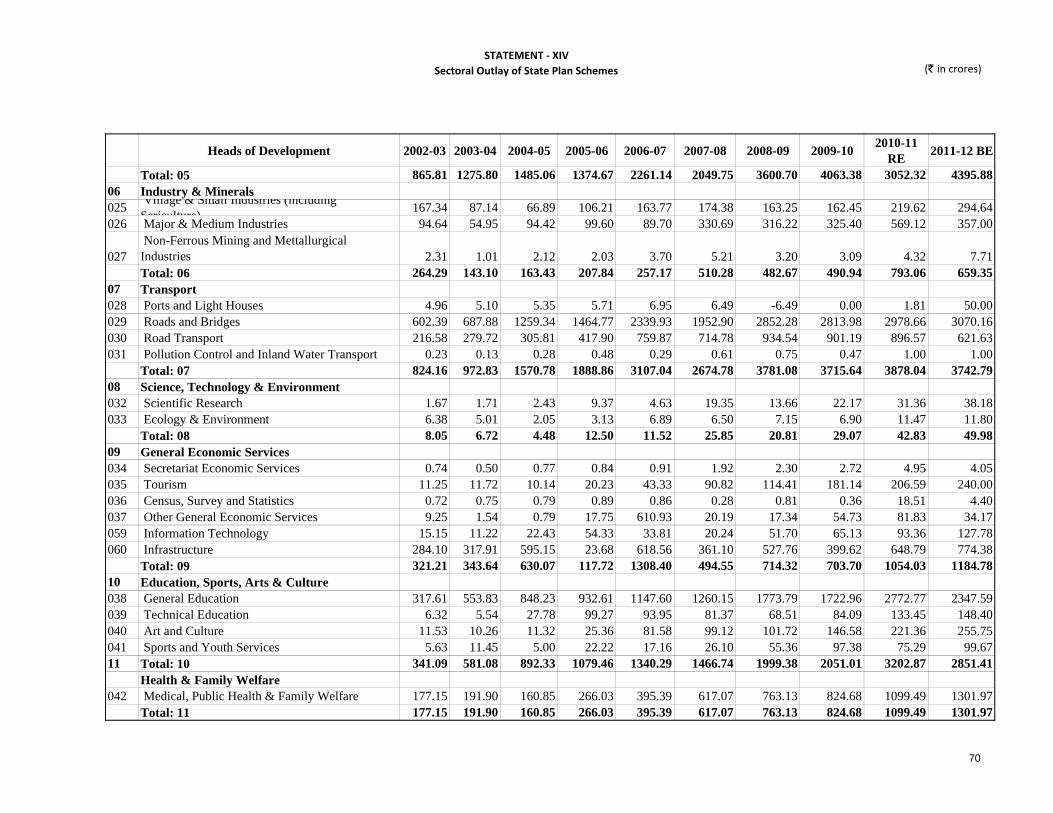
STATEMENT ‐ XIVSectoral Outlay of State Plan Schemes (` in crores)
Heads of Development 2002-03 2003-04 2004-05 2005-06 2006-07 2007-08 2008-09 2009-10 2010-11 RE 2011-12 BE
Total: 05 865.81 1275.80 1485.06 1374.67 2261.14 2049.75 3600.70 4063.38 3052.32 4395.8806 Industry & Minerals025 Village & Small Industries (including
Sericulture) 167.34 87.14 66.89 106.21 163.77 174.38 163.25 162.45 219.62 294.64026 Major & Medium Industries 94.64 54.95 94.42 99.60 89.70 330.69 316.22 325.40 569.12 357.00
027 Non-Ferrous Mining and Mettallurgical Industries 2.31 1.01 2.12 2.03 3.70 5.21 3.20 3.09 4.32 7.71Total: 06 264.29 143.10 163.43 207.84 257.17 510.28 482.67 490.94 793.06 659.35
07 Transport028 Ports and Light Houses 4.96 5.10 5.35 5.71 6.95 6.49 -6.49 0.00 1.81 50.00029 Roads and Bridges 602.39 687.88 1259.34 1464.77 2339.93 1952.90 2852.28 2813.98 2978.66 3070.16030 Road Transport 216.58 279.72 305.81 417.90 759.87 714.78 934.54 901.19 896.57 621.63031 Pollution Control and Inland Water Transport 0.23 0.13 0.28 0.48 0.29 0.61 0.75 0.47 1.00 1.00
Total: 07 824.16 972.83 1570.78 1888.86 3107.04 2674.78 3781.08 3715.64 3878.04 3742.7908 Science, Technology & Environment032 Scientific Research 1.67 1.71 2.43 9.37 4.63 19.35 13.66 22.17 31.36 38.18033 Ecology & Environment 6.38 5.01 2.05 3.13 6.89 6.50 7.15 6.90 11.47 11.80
Total: 08 8.05 6.72 4.48 12.50 11.52 25.85 20.81 29.07 42.83 49.9809 General Economic Services034 Secretariat Economic Services 0.74 0.50 0.77 0.84 0.91 1.92 2.30 2.72 4.95 4.05035 Tourism 11.25 11.72 10.14 20.23 43.33 90.82 114.41 181.14 206.59 240.00036 Census, Survey and Statistics 0.72 0.75 0.79 0.89 0.86 0.28 0.81 0.36 18.51 4.40037 Other General Economic Services 9.25 1.54 0.79 17.75 610.93 20.19 17.34 54.73 81.83 34.17059 Information Technology 15.15 11.22 22.43 54.33 33.81 20.24 51.70 65.13 93.36 127.78060 Infrastructure 284.10 317.91 595.15 23.68 618.56 361.10 527.76 399.62 648.79 774.38
Total: 09 321.21 343.64 630.07 117.72 1308.40 494.55 714.32 703.70 1054.03 1184.7810 Education, Sports, Arts & Culture038 General Education 317.61 553.83 848.23 932.61 1147.60 1260.15 1773.79 1722.96 2772.77 2347.59039 Technical Education 6.32 5.54 27.78 99.27 93.95 81.37 68.51 84.09 133.45 148.40040 Art and Culture 11.53 10.26 11.32 25.36 81.58 99.12 101.72 146.58 221.36 255.75041 Sports and Youth Services 5.63 11.45 5.00 22.22 17.16 26.10 55.36 97.38 75.29 99.6711 Total: 10 341.09 581.08 892.33 1079.46 1340.29 1466.74 1999.38 2051.01 3202.87 2851.41
Health & Family Welfare042 Medical, Public Health & Family Welfare 177.15 191.90 160.85 266.03 395.39 617.07 763.13 824.68 1099.49 1301.97
Total: 11 177.15 191.90 160.85 266.03 395.39 617.07 763.13 824.68 1099.49 1301.97
70

STATEMENT ‐ XIVSectoral Outlay of State Plan Schemes (` in crores)
Heads of Development 2002-03 2003-04 2004-05 2005-06 2006-07 2007-08 2008-09 2009-10 2010-11 RE 2011-12 BE
Water Supply, Sanitation, Housing & Urban Development
043 Water Supply and Sanitation 517.44 497.63 513.31 769.90 548.27 1180.24 704.27 1297.47 1554.24 2049.88044 Housing 598.35 532.73 423.53 749.75 570.13 318.26 604.80 580.61 876.64 1163.02045 Urban Development 170.48 393.29 515.98 473.21 981.24 1230.86 2049.66 2725.87 3261.56 3375.05
Total: 12 1286.27 1423.65 1452.82 1992.86 2099.64 2729.36 3358.73 4603.95 5692.44 6587.95Information and Publicity
046 Information and Publicity 4.29 3.08 2.17 4.17 5.29 8.06 18.88 13.96 36.95 33.05Total: 13 4.29 3.08 2.17 4.17 5.29 8.06 18.88 13.96 36.95 33.05SC, STs & Other Backward Classes
047 Scheduled Castes and Scheduled Tribes 219.96 209.40 227.65 263.42 422.99 581.81 572.99 792.33 511.30 489.97048 Backwarad Classes and Minorities 55.23 56.63 58.25 111.15 211.09 274.70 357.72 441.48 529.83 802.89
Total: 14 275.19 266.03 285.90 374.57 634.08 856.51 930.71 1233.81 1041.13 1292.86Labour & Labour Welfare
049 Labour And Employment 29.73 22.80 27.23 26.32 44.08 95.70 124.84 188.35 254.28 319.46Total: 15 29.73 22.80 27.23 26.32 44.08 95.70 124.84 188.35 254.28 319.46Social Welfare & Nutrition
050 Social Security and Welfare 42.44 96.67 79.04 176.38 291.45 323.96 615.10 884.53 1449.55 1303.46051 Nutrition and Civil Supplies 39.13 66.89 61.59 85.65 82.24 112.31 115.91 258.28 284.25 286.65
Total:16 81.57 163.56 140.63 262.03 373.69 436.27 731.01 1142.81 1733.80 1590.11Other Social Services
052 Fire Protection Services 1.26 0.00 0.55 2.00 0.99 5.00 1.00 1.11 11.00 6.00053 Stationery & Printing 2.42 1.40 0.45 0.66 0.93 0.83 20.24 10.49 10.00 11.30054 Public Works 56.12 82.04 85.78 94.56 213.56 254.59 352.14 331.24 136.84 949.50056 Training 0.18 0.11 0.29 0.33 0.38 0.45 0.59 0.72 1.08 0.40058 Administration of Justice 0.00 0.00 0.00 0.20 6.29 11.40 18.16 26.08 23.13 36.25059 Others 0.00 0.00 0.00 0.56 58.81 108.47 125.06 195.48 245.59 189.50
Total: 17 59.98 83.55 87.07 98.31 280.96 380.74 517.19 565.12 427.64 1192.95Grand TOTAL - STATE PLAN 8163.91 8619.45 11888.72 12678.29 18308.69 17226.92 22576.74 26944.10 31050.00 38070.00
Less
(a) Karnataka Power Corporation 302.00 429.00 534.00 694.00 1063.00 717.00 1238.00 951.75 1025.91 1861.18 (b) Kar.Electricity Board / KPC 454.62 212.70 632.85 600.00 869.55 1000.00 1508.93 1426.19 1200.00 1376.28
(A) Plan Programmes to be finaced by State Undertakings and otherBodies out of their own resources outside the state Budget
71

STATEMENT ‐ XIVSectoral Outlay of State Plan Schemes (` in crores)
Heads of Development 2002-03 2003-04 2004-05 2005-06 2006-07 2007-08 2008-09 2009-10 2010-11 RE 2011-12 BE
(c) Road Transport Corporation 0.00 0.00 0.00 0.00 0.00 0.00 0.00 0.00 0.00 0.00 (d) Kar.State Indl. Inv. & Dev, Corpn 0.00 0.00 0.00 0.00 0.00 0.00 0.00 0.00 0.00 0.00 (e) Kar. State Road Tr. Corpn. 77.19 95.73 157.78 178.32 204.93 230.52 219.14 202.21 227.00 137.38 (f) B'lore Water Supply & Sew.Board 49.50 0.00 0.00 0.00 0.00 0.00 -86.20 0.00 0.00 0.00
(g) Municipalities (Water Supply Scheme) KUWSDB 30.00 60.00 0.00 50.00 0.00 0.00 0.26 0.00 150.00 150.00
(h) Karnataka Housing Board 0.00 0.00 0.00 0.00 0.00 0.00 0.00 0.00 0.00 0.00 (i) Police Housing Corporation 78.27 76.20 30.03 45.00 0.00 0.00 0.00 0.00 0.00 0.00 (j) Kar.Slum Clearance Board 34.46 73.51 24.15 0.00 32.16 0.00 0.00 0.00 0.00 0.00 (k) Krishna Bhagya Jala Nigama 818.45 375.50 356.05 186.73 185.50 20.23 0.00 13.58 0.00 1000.00(l) Karnataka Neeravari Nigam Ltd. 221.00 200.00 375.00 250.00 32.54 36.24 0.00 25.00 0.00 0.00 (m) Road Development Corporation 110.00 128.00 160.00 144.19 0.00 102.82 134.13 0.00 0.00 500.00 (n) Rural Housing Corporation 190.55 122.08 60.00 120.98 0.00 0.00 0.00 0.00 0.00 0.00 (o) B'lore Metro. Transport Service 64.57 133.59 118.99 69.70 277.28 187.65 413.81 386.19 292.57 125.00 (p) North West Kar. Road Tr. Ser 53.56 40.00 20.58 88.25 162.71 133.02 14.04 37.93 110.00 61.75 (q) Karnataka Land Army Corpn 80.00 20.00 0.00 15.12 0.00 0.00 0.00 0.00 0.00 0.00 (r) North East Road Transport Corpn. 21.26 10.40 8.46 66.93 56.74 57.48 82.29 52.02 71.00 60.00 (s) Kar. Rural Edn Institns Society 36.30 20.00 5.00 0.00 0.00 0.00 0.00 0.00 0.00 0.00 (t) K.S.I.I.D.C. 0.00 0.00 0.00 0.00 0.00 0.00 0.00 0.00 0.00 0.00 (u) Bruhat B'lore Mahanagara Palike 0.00 0.00 0.00 0.00 0.00 0.00 602.48 400.00 500.00 500.00 (v) B'lore Metro Rail Corpn Ltd. 0.00 0.00 0.00 0.00 0.00 0.00 0.00 0.00 0.00 0.00 (w) BMRDA 0.00 0.00 0.00 0.00 0.00 0.00 38.50 19.63 0.00 0.00 (x) KUIDFC 0.00 0.00 0.00 0.00 0.00 0.00 0.21 200.00 300.00 0.00 (y) BDA 0.00 0.00 0.00 0.00 0.00 0.00 0.00 0.00 0.00 0.00(z) KIADB 0.00 0.00 0.00 0.00 0.00 0.00 0.00 0.00 0.00 0.00
2621.73 1996.71 2482.89 2509.22 2884.41 2484.96 4165.59 3714.50 3876.48 5771.59
(a) CMRRF 0.00 0.00 0.00 0.00 0.00 0.00 0.00 57.83 63.75 71.25 (b) Infrastructure 0.00 0.00 0.00 0.00 0.00 0.00 364.61 219.74 242.25 270.75 (c) BMRTS 0.00 0.00 0.00 0.00 0.00 0.00 0.00 107.94 119.00 133.00(d) Sate Urban Transport Fund 0.00 0.00 0.00 0.00 0.00 0.00 0.00 0.00 0.00 25.00
0.00 0.00 0.00 0.00 0.00 0.00 364.61 385.51 425.00 500.005542.18 6622.74 9405.83 10169.07 15424.28 14741.96 18046.54 22844.09 26748.52 31798.41Net Outlay Provided for in the State Budget
Total IEBR(B). Amount Met from Cess Fund
Total B
72

STATEMENT ‐ XVSectoral Outlay of Centrally Sposored Schemes (` in crores)
Heads of Development 2002-03 2003-04 2004-05 2005-06 2006-07 2007-08 2008-09 2009-10 2010-11 RE 2011-12 BE
01 Agriculture & Allied Activities
001 Crop Husbandry 49.24 49.10 58.96 104.13 56.21 82.91 50.12 55.69 77.31 115.78002 Soil and Water Conservation 15.32 23.98 27.19 17.92 36.33 32.87 40.14 22.49 51.78 51.44003 Animal Husbandry 4.52 0.85 3.81 8.73 10.08 6.79 10.47 12.75 29.22 39.11004 Dairy Development 0.88 0.56 1.63 2.80 4.25 0.84 2.68 1.29 10.00 10.00005 Fisheries 2.83 4.60 12.66 10.50 8.52 8.71 7.20 8.15 15.00 13.14006 Forestry 19.85 10.06 8.13 6.43 7.03 7.61 8.76 9.18 17.63 12.75007 Environmental Forestry and Wild Life 1.08 3.13 5.06 4.20 4.84 8.99 12.65 10.30 10.00 14.00008 Food, Storage and Warehousing 0.00 0.00 0.00 0.00 0.00 0.00 0.00 0.00 0.00 0.00009 Agriculture Research & Education 0.00 0.00 0.00 0.00 0.00 0.00 0.00 0.00 0.00 0.00010 Investment in Agricultural Financial Institutions 0.00 0.00 0.00 0.00 0.00 0.00 0.00 0.00 0.00 0.00
011 Other Agricultural Programmes, Marketing and Quality Control 0.00 0.00 0.81 0.00 0.00 0.00 0.00 0.00 0.00 0.00
012 Co-operation 1.49 0.48 0.54 0.11 0.08 0.00 0.00 0.00 0.00 0.00Total: 01 95.21 92.76 118.79 154.82 127.34 148.72 132.02 119.85 210.94 256.22
02 Rural Development013 Special Programme for Rural Development 0.00 0.70 0.00 21.17 0.00 2.11 0.00 0 2.89 0014 Rural Employment 0.00 0.00 0.00 0.00 0.00 0.00 0.00 0 0 0015 Land Reforms 2.23 0.87 0.88 3.65 0.79 0.00 0.43 0.28 6.28 10.79016 Other Rural Development Programme 0.00 0.00 0.00 0.00 0.00 0.00 0.00 0 0 0017 Community Development 0.00 1.95 2.62 3.41 0.63 0.36 0.39 0.43 1.1 1
Total: 02 2.23 3.52 3.50 28.23 1.42 2.47 0.82 0.71 10.27 11.7903 Special Area Programme
018 Hyderabad-Karnataka, Malnad and Border Area Development Programme 0.45 0.52 0.51 0.45 0.47 0.49 0.56 0.84 1.94 2.1Total: 03 0.45 0.52 0.51 0.45 0.47 0.49 0.56 0.84 1.94 2.10
04 Irrigation & Flood Control019 Major and Medium Irrigation 0.00 0.00 0.00 0.00 0.00 151.04 157.91 0.00 0.00 0.00020 Minor Irrigation 0.00 0.00 0.00 0.00 23.28 5.87 2.56 0.00 50.87 0.00021 Command Area Development 21.50 14.10 10.00 10.46 19.62 29.94 16.74 19.48 25.00 322.55022 Flood Control (Including Anti-Sea Erosion,etc.) 0.00 0.00 0.00 0.00 0.00 0.00 0.00 0.00 0.00 0.00
Total: 04 21.50 14.10 10.00 10.46 42.90 186.85 177.21 19.48 75.87 322.55
73

STATEMENT ‐ XVSectoral Outlay of Centrally Sposored Schemes (` in crores)
Heads of Development 2002-03 2003-04 2004-05 2005-06 2006-07 2007-08 2008-09 2009-10 2010-11 RE 2011-12 BE
05 Energy023 Power 0.00 0.00 0.00 0.00 0.00 0.00 0.00 0.00 0.00 0.00024 Non-Conventional Source of Energy 0.23 8.75 0.52 1.71 2.01 1.53 3.74 4.44 11.32 12.46
Total: 05 0.23 8.75 0.52 1.71 2.01 1.53 3.74 4.44 11.32 12.4606 Industry & Minerals025 Village & Small Industries (including Sericulture) 4.92 3.30 3.11 11.83 19.29 30.73 19.75 16.68 42.68 36.70026 Major & Medium Industries 2.25 0.00 0.18 0.00 0.00 0.00 0.00 0.00 0.35 2.50027 Non-Ferrous Mining and Mettallurgical Industries 1.12 0.00 2.25 0.00 0.00 0.00 0.00 0.00 0.00 0.00
Total: 06 8.29 3.30 5.54 11.83 19.29 30.73 19.75 16.68 43.03 39.2007 Transport028 Ports and Light Houses 0.00 0.00 0.00 0.00 0.00 0.00 0.00 0.00 0.00 0.00029 Roads and Bridges 0.00 0.00 0.00 0.00 0.00 0.00 0.00 0.00 0.00 0.00030 Road Transport 0.00 0.00 0.00 0.00 0.00 0.00 0.00 0.00 0.00 17.54031 Pollution Control and Inland Water Transport 0.00 0.00 0.00 0.00 0.00 0.00 0.00 0.00 0.00 0.00
Total: 07 0.00 0.00 0.00 0.00 0.00 0.00 0.00 0.00 0.00 17.5408 Science, Technology & Environment032 Scientific Research 0.00 0.00 0.00 0.00 0.00 0.00 0.00 0.00 0.00 0.00033 Ecology & Environment 0.00 5.83 4.70 3.84 5.30 2.30 1.88 1.40 3.62 4.90
Total: 08 0.00 5.83 4.70 3.84 5.30 2.30 1.88 1.40 3.62 4.9009 General Economic Services034 Secretariat Economic Services 0.00 0.00 0.00 0.00 0.00 0.00 0.00 0.00 0.00 0.00035 Tourism 0.00 5.00 45.92 10.70 5.00 5.00 4.95 7.13 5.00 5.00036 Census, Survey and Statistics 1.37 1.55 1.63 0.79 0.76 0.00 0.00 0.00 0.00 12.53037 Other General Economic Services 0.00 0.00 0.80 0.00 0.00 0.00 0.00 0.00 0.00 0.0059 Information Technology 0.00 0.00 0.00 0.00 0.00 0.00 0.00 0.00 0.0060 Infrastructure 0.00 0.00 0.00 0.00 0.00 0.00 0.00 0.00 0.00
Total: 09 1.37 6.55 48.35 11.49 5.76 5.00 4.95 7.13 5.00 17.5310 Education, Sports, Arts & Culture
038 General Education 21.53 5.38 1.57 6.35 12.37 23.56 38.30 35.35 110.00 559.64039 Technical Education 0.00 0.00 0.00 0.00 0.00 0.00 0.00 0.00 4.02 6.00040 Art and Culture 0.00 0.01 0.04 0.00 0.00 0.00 0.00 0.00 0.06 0.06041 Sports and Youth Services 1.02 0.74 1.81 1.80 1.64 1.57 1.75 8.12 15.40 17.42
Total: 10 22.55 6.13 3.42 8.15 14.01 25.13 40.05 43.47 129.48 583.1211 Health & Family Welfare
74

STATEMENT ‐ XVSectoral Outlay of Centrally Sposored Schemes (` in crores)
Heads of Development 2002-03 2003-04 2004-05 2005-06 2006-07 2007-08 2008-09 2009-10 2010-11 RE 2011-12 BE
042 Medical, Public Health & Family Welfare 66.10 60.02 69.07 35.39 17.70 23.51 17.71 18.75 38.47 53.8Total: 11 66.10 60.02 69.07 35.39 17.70 23.51 17.71 18.75 38.47 53.80
12Water Supply, Sanitation, Housing & Urban Development
043 Water Supply and Sanitation 148.85 37.90 16.69 260.04 343.67 373.59 640.67 382.75 81.25 81.77044 Housing 0.63 0.28 0.11 0.04 0.04 0.08 0.04 0.04 2.00 2.00045 Urban Development 10.21 33.36 43.22 27.13 64.43 115.55 148.40 0.00 0.00 127.50
Total: 12 159.69 71.54 60.02 287.21 408.14 489.22 789.11 382.79 83.25 211.2713 Information and Publicity
046 Information and Publicity 0.00 0.00 0.00 0.00 0.00 0.00 0.00 0.00 0.00 0.00Total; 13 0.00 0.00 0.00 0.00 0.00 0.00 0.00 0.00 0.00 0.00
14 SC,STs & Other Backward Classes047 Scheduled Castes and Scheduled Tribes 20.61 28.63 53.19 52.14 52.63 54.84 56.27 76.84 123.57 138.17048 Backwarad Classes and Minorities 0.00 1.40 4.90 7.23 8.90 0.24 5.66 36.78 59.00 70.50
Total: 14 20.61 30.03 58.09 59.37 61.53 55.08 61.93 113.62 182.57 208.6715 Labour & Labour Welfare
049 Labour And Employment 0.00 0.22 0.00 0.03 2.74 5.09 0.08 29.14 10.01 36.51Total: 15 0.00 0.22 0.00 0.03 2.74 5.09 0.08 29.14 10.01 36.51
16 Social Welfare & Nutrition050 Social Security and Welfare 0.50 0.59 0.77 0.83 0.95 1.30 3.25 10.96 59.56 73.55051 Nutrition and Civil Supplies 0.00 0.00 0.00 0.00 0.00 0.00 0.00 0.00 0.00 0.00
Total :16 0.50 0.59 0.77 0.83 0.95 1.30 3.25 10.96 59.56 73.5517 Other Social Services
052 Fire Protection Services 0.00 0.00 0.00 0.00 0.00 0.00 0.00 0.00 0.00 0.00053 Stationery & Printing 0.00 0.00 0.00 0.00 0.00 0.00 0.00 0.00 0.00 0.00054 Public Works 2.84 4.63 4.50 4.55 5.98 0.00 0.00 0.00 0.00 0.00056 Training 0.00 0.00 0.00 0.00 0.00 0.00 0.00 0.00 0.00 0.00058 Administration of Justice 0.00 0.00 0.00 0.00 0.00 0.00 0.00 0.00 0.29 0.00059 Others 0.00 0.00 0.00 0.00 0.00 0.00 0.00 0.00 0.00 0.00
Total :17 2.84 4.63 4.50 4.55 5.98 0.00 0.00 0.00 0.29 0.00Grand Total 401.57 308.49 387.78 618.36 715.54 977.42 1253.06 769.26 865.62 1851.21
75

STATEMENT ‐ XVISectoral Outlay of Central Plan Schemes (` in crores)
Heads of Development 2002-03 2003-04 2004-05 2005-06 2006-07 2007-08 2008-09 2009-10 2010-11 RE
2011-12 BE
01 Agriculture & Allied Activities
001 Crop Husbandry 1.09 1.23 0.00 0.00 0.12 0.01 0.00 4.83 0.00 0.00002 Soil and Water Conservation 0.00 0.00 0.00 0.00 0.00 0.00 0.00 0.00 0.00 0.00003 Animal Husbandry 0.26 0.98 3.22 1.49 0.37 4.24 4.47 3.29 2.70 0.75004 Dairy Development 0.00 0.00 0.00 0.00 0.00 0.00 0.00 0.00 0.00 0.00005 Fisheries 0.00 0.00 0.00 0.00 0.00 0.00 0.00 0.00 0.00 0.00006 Forestry 0.00 0.00 0.00 0.00 0.00 0.00 0.00 0.00 0.00 0.00007 Environmental Forestry and Wild Life 1.72 2.31 2.18 2.04 1.91 2.01 2.83 3.89 7.00 7.00008 Food, Storage and Warehousing 0.00 0.00 0.00 0.00 0.00 0.00 0.00 0.00 0.00 0.00009 Agriculture Research & Education 0.00 0.00 0.00 0.00 0.00 0.00 0.00 0.00 0.00 0.00010 Investment in Agricultural Financial Institutions 0.00 0.00 0.00 0.00 0.00 0.00 0.00 0.00 0.00 0.00
011 Other Agricultural Programmes, Marketing and Quality Control 0.00 0.00 0.00 0.00 0.00 0.00 0.00 0.00 0.00 0.00
012 Co-operation 0.00 0.00 0.00 0.00 0.00 0.00 0.00 0.00 0.00 0.00Total: 01 3.07 4.52 5.40 3.53 2.40 6.26 7.30 12.01 9.70 7.75
02 Rural Development013 Special Programme for Rural Development 0.40 0.00 0.00 0.00 0.00 0.00 0.00 0.00 0.00 0.00014 Rural Employment 0.00 0.00 0.00 0.00 0.00 0.00 0.00 0.00 0.00 0.00015 Land Reforms 0.00 0.00 0.00 0.00 0.00 0.00 0.00 0.00 0.00 0.00016 Other Rural Development Programme 0.00 0.00 0.00 0.00 0.00 0.00 0.00 0.00 0.00 0.00017 Community Development 0.00 0.00 0.00 0.00 0.00 0.00 0.00 0.00 0.00 0.00
Total: 02 0.40 0.00 0.00 0.00 0.00 0.00 0.00 0.00 0.00 0.0003 Special Area Programme
018 Hyderabad-Karnataka, Malnad and Border Area Development Programme 0.16 0.19 0.13 0.19 0.18 0.20 0.24 0.00 4.60 0.00Total: 03 0.16 0.19 0.13 0.19 0.18 0.20 0.24 0.00 4.60 0.00
04 Irrigation & Flood Control019 Major and Medium Irrigation 0.00 0.00 0.00 0.00 0.00 0.00 0.00 0.00 0.00 0.00
76

STATEMENT ‐ XVISectoral Outlay of Central Plan Schemes (` in crores)
Heads of Development 2002-03 2003-04 2004-05 2005-06 2006-07 2007-08 2008-09 2009-10 2010-11 RE
2011-12 BE
020 Minor Irrigation 0.00 0.00 0.00 0.00 0.00 0.00 0.00 0.00 0.00 0.00021 Command Area Development 0.00 0.00 0.00 0.00 0.00 0.00 0.00 0.00 0.00 0.00
022 Flood Control (Including Anti-Sea Erosion,etc.) 0.00 0.00 0.00 0.00 0.00 0.00 0.00 0.00 0.00 0.00Total: 04 0.00 0.00 0.00 0.00 0.00 0.00 0.00 0.00 0.00 0.00
05 Energy023 Power 0.00 0.00 0.00 0.00 0.00 0.00 0.00 0.00 0.00 0.00024 Non-Conventional Source of Energy 0.00 0.00 0.00 0.00 0.00 0.00 0.00 0.00 0.00 0.00
Total: 05 0.00 0.00 0.00 0.00 0.00 0.00 0.00 0.00 0.00 0.0006 Industry & Minerals
025 Village & Small Industries (including Sericulture) 4.35 0.90 9.37 2.32 0.26 3.15 3.21 2.40 1.29 1.20
026 Major & Medium Industries 0.00 0.00 4.20 0.00 0.00 0.00 0.00 0.00 0.00 0.00
027 Non-Ferrous Mining and Mettallurgical Industries 0.00 0.00 0.00 0.00 0.00 0.00 0.00 0.00 0.00 0.00Total: 06 4.35 0.90 13.57 2.32 0.26 3.15 3.21 2.40 1.29 1.20
07 Transport028 Ports and Light Houses 0.00 0.00 0.00 0.00 0.00 0.00 0.00 0.00 0.00 0.00029 Roads and Bridges 0.00 0.00 0.00 0.00 0.00 0.00 0.00 0.00 0.00 0.00030 Road Transport 0.00 0.00 0.00 0.00 0.00 0.00 0.00 0.00 0.00 0.00031 Pollution Control and Inland Water Transport 0.00 0.00 0.00 0.00 0.00 0.00 0.00 0.00 0.00 0.00
Total: 07 0.00 0.00 0.00 0.00 0.00 0.00 0.00 0.00 0.00 0.0008 Science, Technology & Environment032 Scientific Research 0.00 0.00 0.00 0.00 0.00 0.00 0.00 0.00 0.00 0.00033 Ecology & Environment 0.00 0.00 0.00 0.00 0.00 0.00 0.00 0.00 0.00 0.00
Total: 08 0.00 0.00 0.00 0.00 0.00 0.00 0.00 0.00 0.00 0.0009 General Economic Services034 Secretariat Economic Services 0.00 0.00 0.00 0.00 0.00 0.00 0.00 0.00 0.00 0.00
77

STATEMENT ‐ XVISectoral Outlay of Central Plan Schemes (` in crores)
Heads of Development 2002-03 2003-04 2004-05 2005-06 2006-07 2007-08 2008-09 2009-10 2010-11 RE
2011-12 BE
035 Tourism 5.12 0.00 0.00 0.00 0.00 0.00 0.00 0.00 0.00 0.00036 Census, Survey and Statistics 0.19 0.98 0.29 5.61 2.47 0.00 0.00 0.00 0.00 0.00037 Other General Economic Services 0.00 0.00 0.00 0.00 0.00 0.00 0.00 0.00 0.00 0.00059 Information Technology 0.00 0.00 0.00 0.00 0.00 0.00 0.00 0.00 0.00 0.00060 Infrastructure 0.00 0.00 0.00 0.00 0.00 0.00 0.00 0.00 0.00 0.00
Total: 09 5.31 0.98 0.29 5.61 2.47 0.00 0.00 0.00 0.00 0.0010 Education, Sports, Arts & Culture
038 General Education 149.99 20.04 22.00 25.84 39.80 31.05 40.72 36.43 41.1 59.26039 Technical Education 0.00 0.00 0.00 0.00 0.00 0.00 0.00 0.00 0.00 0.00040 Art and Culture 0.00 0.00 0.00 0.00 0.00 0.00 0.00 0.00 0.00 0.00041 Sports and Youth Services 0.81 0.28 0.95 0.38 0.13 0.30 0.00 0.00 0.00 0.00
Total: 10 150.80 20.32 22.95 26.22 39.93 31.35 40.72 36.43 41.10 59.2611 Health & Family Welfare
042 Medical, Public Health & Family Welfare 100.28 110.91 104.99 94.07 136.99 162.98 211.22 224.97 251.79 292.43Total: 11 100.28 110.91 104.99 94.07 136.99 162.98 211.22 224.97 251.79 292.43
12Water Supply, Sanitation, Housing & Urban Development
043 Water Supply and Sanitation 0.00 159.54 112.57 0.00 0.00 0.00 0.00 0.00 0.00 0.00044 Housing 0.00 0.00 0.00 0.00 0.00 0.00 0.00 0.00 0.00 0.00045 Urban Development 0.00 0.00 0.00 0.00 0.00 0.00 0.00 0.00 0.00 0.00
Total: 12 0.00 159.54 112.57 0.00 0.00 0.00 0.00 0.00 0.00 0.0013 Information and Publicity
046 Information and Publicity 0.00 0.00 0.00 0.00 0.00 0.00 0.00 0.00 0.00 0.00Total; 13 0.00 0.00 0.00 0.00 0.00 0.00 0.00 0.00 0.00 0.00
14 SC,STs & Other Backward Classes047 Scheduled Castes and Scheduled Tribes 49.50 30.61 10.52 55.96 91.33 115.83 77.60 100.42 252.26 179.45048 Backwarad Classes and Minorities 0.00 0.00 0.00 0.00 0.00 0.00 7.44 18.35 18 22
Total: 14 49.50 30.61 10.52 55.96 91.33 115.83 85.04 118.77 270.26 201.45
78

STATEMENT ‐ XVISectoral Outlay of Central Plan Schemes (` in crores)
Heads of Development 2002-03 2003-04 2004-05 2005-06 2006-07 2007-08 2008-09 2009-10 2010-11 RE
2011-12 BE
15 Labour & Labour Welfare049 Labour And Employment 0.00 0.00 0.00 0.00 0.00 0.00 0.00 0.00 0.00 0.00
Total: 15 0.00 0.00 0.00 0.00 0.00 0.00 0.00 0.00 0.00 0.0016 Social Welfare & Nutrition
050 Social Security and Welfare 91.05 101.10 108.12 135.27 133.43 189.87 228.39 313.84 373.72 389.01051 Nutrition and Civil Supplies 0.00 0.00 0.00 0.00 0.00 0.00 0.00 0.00 0.00 0.00
Total :16 91.05 101.10 108.12 135.27 133.43 189.87 228.39 313.84 373.72 389.0117 Other Social Services
052 Fire Protection Services 0.00 0.00 0.00 0.00 0.00 0.00 0.00 0.00 0.00 0.00053 Stationery & Printing 0.00 0.00 0.00 0.00 0.00 0.00 0.00 0.00 0.00 0.00054 Public Works 0.00 0.00 0.00 0.00 0.00 0.00 0.00 0.00 0.00 0.00056 Training 0.00 0.00 0.00 0.00 0.00 0.00 0.00 0.00 0.00 0.00058 Administration of Justice 0.00 0.00 0.00 0.00 0.00 0.00 0.00 0.00 0.00 0.00059 Others 0.00 0.00 0.00 0.00 0.00 0.00 0.00 0.00 0.00 0.00
Total :17 0.00 0.00 0.00 0.00 0.00 0.00 0.00 0.00 0.00 0.00Grand Total 404.92 429.07 378.54 323.17 406.99 509.64 576.12 708.42 952.46 951.10
79

STATEMENT ‐ XVIIMajor Head‐wise Expenditure Under State Plan Schemes (` in Lakhs)
Major Head DESCRIPTION 2002-03 2003-04 2004-05 2005-06 2006-07 2007-08 2008-09 2009-10 2010-11 RE 2011-12
BE
A. REVENUE A/C2014 Administration of Justice 0.00 0.00 0.00 20.00 629.17 1140.29 1816.29 2608.38 2087.84 3125.002029 Land Revenue 0.00 0.00 0.00 0.00 0.00 0.00 0.00 0.00 500.00 0.002030 Stamps and Registration 0.00 0.00 0.00 0.00 0.00 0.00 0.00 0.00 0.00 0.002040 Taxes on Sales, Trade, Etc., 864.48 0.00 0.00 585.48 439.24 1131.69 644.34 943.50 801.13 800.002041 Taxes on Vehicles 22.85 12.80 27.73 47.57 28.66 61.38 74.92 46.46 100.00 100.002052 Secretariat-General Services 0.00 0.00 0.00 56.40 76.88 226.68 0.00 0.00 250.00 300.002053 District Administration 0.00 0.00 0.00 0.00 0.00 1021.66 260.85 402.86 0.00 0.002054 Treasury and Accounts Administration 0.00 0.00 0.00 0.00 31.20 121.43 143.98 177.90 500.00 400.002055 Police 0.00 0.00 0.00 0.00 5772.54 3785.24 1972.16 4000.00 600.53 5950.002056 Jails 0.00 0.00 0.00 0.00 0.00 142.00 193.51 0.00 0.00 0.002058 Stationery and Printing 242.22 139.77 44.64 66.10 93.39 82.82 2024.24 1049.08 1000.00 1130.002059 Public Works 146.85 146.43 118.16 134.51 348.71 207.52 128.45 298.26 500.00 500.002070 Other Administrative Services 217.87 57.48 83.85 291.64 201.91 602.81 3761.47 252.06 5277.50 710.002075 Miscellaneous General Services 0.00 0.00 0.00 0.00 0.00 0.00 0.00 0.00 0.00 0.002202 General Education 31259.15 55006.84 84452.73 88871.46 109783.55 116295.11 161354.34 153993.75 242618.22 201254.202203 Technical Education 621.06 481.54 2752.57 9874.59 9255.77 7923.41 5371.19 6561.00 10886.00 12600.002204 Sports and Youth Services 562.73 1144.50 500.23 851.85 1516.49 2042.09 4041.42 9137.47 4555.64 5566.542205 Art & Culture 1025.42 966.89 1056.00 2331.43 8054.71 9031.82 9597.32 14212.36 20220.38 19669.862210 Medical and Public Health 13007.83 16533.88 14900.95 25184.23 24094.54 24808.36 41401.23 47377.89 65147.51 86803.392211 Family Welfare 817.75 538.24 909.38 847.09 1566.40 2188.37 2534.77 4522.90 2971.58 3221.482215 Water Supply and Sanitation 14716.69 12710.06 16280.03 9069.33 13888.25 13276.15 16978.19 12451.49 16175.67 21229.952216 Housing 17235.28 15331.80 13402.38 25265.33 26487.56 29436.49 48211.84 49530.00 60122.70 92980.422217 Urban Development 6866.87 21127.60 35738.79 40540.21 63871.57 81656.67 34245.32 61149.64 114864.38 65575.552220 Information and Publicity 328.35 196.81 150.88 236.88 328.83 701.65 1739.10 795.73 2774.76 2705.002225 Welfare of SC,ST and OBC 21608.16 19874.34 23665.89 30324.93 48861.05 66368.07 71725.32 101378.32 162648.03 201223.612230 Labour and Employment Training 2866.71 2276.70 2720.12 2290.21 4400.89 8182.23 11944.09 17800.04 23253.48 29396.622235 Social Security and Welfare 4006.78 9382.09 6657.85 7738.49 41219.17 30080.59 76236.76 114179.54 155089.61 141316.352236 Nutrition 3913.16 6689.20 6159.21 8564.94 8224.21 11125.50 11396.30 24422.04 27934.85 28664.832245 Relief on Account of Natural Calamities 0.00 0.00 0.00 0.00 0.00 0.00 0.00 3628.99 0.00 0.002250 Other Social Services 0.00 0.00 1010.00 10396.18 2500.00 1499.55 4062.76 2511.63 4470.00 5219.002251 Secretariat - Social Services 0.00 0.00 0.00 0.00 0.00 0.00 0.00 0.00 0.00 0.002401 Crop Husbandry 6882.53 15485.33 29615.95 12317.19 33290.26 38165.99 70564.47 73309.11 74009.78 205077.312402 Soil & Water Conservation 3731.45 6835.18 12491.28 11494.85 9004.22 16240.41 7458.71 3399.33 9394.31 16075.602403 Animal Husbandry 1933.48 2154.23 2584.59 3885.37 7207.88 7038.50 10021.96 12788.22 16208.39 23560.012404 Dairy Development 93.25 3.50 2.28 700.97 0.00 2650.00 11480.12 24773.01 32495.00 28800.00
80

STATEMENT ‐ XVIIMajor Head‐wise Expenditure Under State Plan Schemes (` in Lakhs)
Major Head DESCRIPTION 2002-03 2003-04 2004-05 2005-06 2006-07 2007-08 2008-09 2009-10 2010-11 RE 2011-12
BE
2405 Fisheries 658.48 598.93 677.44 635.45 2250.78 938.68 3111.67 6001.60 5386.68 13316.372406 Forestry and Wild Life 8413.07 7813.18 6770.07 7086.09 12638.01 13453.68 19113.35 23988.47 20537.46 16189.872408 Food, Storage and Ware Housing 0.00 0.00 0.00 0.00 0.00 118.40 0.00 1300.00 16.20 0.002415 Agricultural Research and Education 2258.00 2080.00 3079.00 4400.00 6200.00 13105.00 6912.50 7245.00 8560.00 13500.002425 Co-Operation 199.07 607.68 5170.71 9596.88 10354.78 52606.14 16817.18 22446.61 38541.42 36455.882435 Other Agriculture Programme 0.00 0.00 0.00 0.00 0.00 0.00 0.00 0.00 0.00 0.002501 Special Programmes for Rural Development 2170.59 1755.83 3728.72 2767.80 4286.10 5288.94 6669.12 5601.18 7368.31 4943.582505 Rural Employment 6773.82 4403.71 10681.27 8438.48 7568.71 7203.98 7886.74 27532.43 14482.71 13912.712506 Land Reforms 219.37 159.20 89.34 95.42 69.30 76.36 112.20 90.63 350.00 390.002515 Other Rural Development Programmes 32937.88 28712.55 41562.26 48790.11 47048.86 43093.91 43512.10 40038.94 43628.62 74570.132551 Hill Areas 1496.16 1543.46 1650.60 1381.26 1488.52 2300.96 3149.04 2630.46 2632.00 2632.002575 Other Special Area Programme 0.00 375.00 3000.00 1500.00 3006.61 13247.00 19800.00 47491.15 10817.00 10817.002700 Major Irrigation 0.00 0.00 119.89 0.002701 Major & Medium Irrigation 500.34 202.64 310.03 290.26 311.80 430.18 603.45 6146.09 1294.71 1298.082702 Minor Irrigation 932.91 2230.50 843.76 2003.61 2031.00 2287.95 2693.32 2806.80 4682.65 3694.932705 Command Area Development 3305.16 1237.09 949.89 3120.60 5416.27 6467.87 4254.79 4906.61 10399.00 38814.002801 Power 5621.65 4525.36 16652.58 1062.74 2722.00 523.04 53.33 42.32 2739.76 120.002810 Non Conventional Sources of Energy 573.63 205.14 390.50 191.19 136.60 196.83 323.41 468.48 885.77 722.052851 Village and Small Industries 14504.99 8239.52 6240.23 10092.28 16014.52 18247.23 13280.35 15849.75 18170.48 26268.902852 Industries 489.32 501.67 714.74 1800.66 1160.36 8140.12 6227.80 4150.40 20443.76 17375.00
2853 Non Ferrous Mining and Metallurgical Industries 118.55 101.18 87.60 202.88 170.23 321.45 319.50 309.22 431.68 680.00
2885 Other Outlays on Industries and Minerals 112.04 0.00 124.62 0.00 200.00 200.00 0.00 0.00 0.00 0.003053 Civil Aviation 0.00 0.00 0.00 0.00 0.00 0.00 0.00 0.00 0.00 0.003054 Roads and Bridges 6687.14 4749.94 28882.14 31488.05 58158.45 57990.59 80431.64 46500.40 46776.01 35341.483056 Inland Water Transport 0.00 0.00 0.00 0.00 0.00 0.00 0.00 0.00 0.00 0.003425 Other Scientific Research 142.42 145.92 210.43 880.50 412.91 1865.23 1296.02 1528.20 2735.60 3118.363435 Ecology and Environment 637.52 501.17 204.89 312.81 689.32 650.18 715.00 690.33 1147.00 1180.003451 Secretariat Economic Services 880.68 412.86 786.21 3037.52 1473.90 2106.03 4750.81 6140.03 10427.72 12582.823452 Tourism 1125.40 1172.19 1014.09 2023.37 4332.69 3996.45 5827.70 8640.05 9729.00 8052.053454 Census Surveys & Statistics 72.35 75.49 78.99 89.24 85.95 27.67 80.82 36.25 1850.58 440.003455 Meteorology 25.00 25.00 33.00 57.00 50.00 70.00 70.00 688.90 400.00 700.003456 Civil Supplies 193.82 76.20 163.55 195.47 200.98 132.11 214.96 125.55 445.99 12.953465 General Financial & Trading Institutions 0.00 0.00 363.003475 Other General Economic Services 22198.13 26029.18 50633.47 1272.83 97348.17 1538.71 1919.33 3034.71 4151.74 2952.00
81

STATEMENT ‐ XVIIMajor Head‐wise Expenditure Under State Plan Schemes (` in Lakhs)
Major Head DESCRIPTION 2002-03 2003-04 2004-05 2005-06 2006-07 2007-08 2008-09 2009-10 2010-11 RE 2011-12
BE
3604 Compensation and Assignments to Local Bodiesand Panchayat Raj Institutions 0.00 0.00 0.00 0.00 2950.00 0.00 79596.29 76900.68 78000.00 142029.00Total: A.REVENUE A/C 246218.41 285575.80 440055.62 434799.73 709953.87 733859.17 941127.84 1111032.20 1424609.03 1686426.88
4055 Capital Outlay on Police 2237.09 3640.00 5488.20 12453.00 17239.00 1354.02 5100.00 4300.00 6600.00 5300.004059 Capital Outlay on Public Works 5097.98 7537.00 7728.65 8899.43 14318.02 26899.68 37173.45 39002.71 38509.00 38250.00
4070 Capital Outlay on Other Administrative Services 0.00 0.00 0.00 0.00 0.00 148.14 0.00 36.79 9.50 0.00
4202 Capital Outlay on Education, Sports, Art and Culture 640.06 507.93 471.88 5057.98 5419.35 11382.35 19573.64 21196.76 31662.18 33091.75
4210 Capital Outlay on Medical & Public Health 4360.87 2512.87 797.07 768.86 14295.41 35423.79 33402.48 32097.12 42825.00 42045.004211 Capital Outlay on Family Welfare 0.00 0.00 0.00 0.00 0.00 0.00 0.00 0.00 0.00 0.00
4215 Capital Outlay On Water Supply and Sanitation 3750.78 11523.44 22428.00 50821.36 25130.90 60348.63 61398.79 82816.89 90320.52 102200.004216 Capital Outlay on Housing 12737.69 14375.25 14729.82 21572.08 22443.00 5258.36 5651.40 4621.98 5500.00 7200.004217 Capital Outlay on Urban Development 10.01 2500.05 3935.00 3380.80 13200.00 25000.00 39791.00 46422.74 10735.00 5100.004220 Capital Outlay on Information & Publicity 100.95 111.38 66.04 180.22 200.00 104.00 149.23 600.00 920.50 600.004225 Welfare of SC,ST and OBCs 4623.83 7135.84 4423.79 6308.10 14256.98 18745.82 21296.02 22002.32 21465.35 28063.084235 Capital Outlay on Social Security & Welfare 1362.43 682.11 545.69 357.41 274.00 1956.54 4836.57 4819.14 10885.00 11895.004250 Capital Outlay on Other Social Services 106.64 3.33 3.17 342.11 7.13 1928.13 539.55 1035.29 1675.00 2149.604401 Capital Outlay on Crop Husbandry 5.07 5.28 10.42 4.49 22.98 2060.00 737.70 1150.00 4821.50 10200.004402 Capital Outlay on Soil and Water Conservation 0.00 0.00 0.00 1998.74 385.69 397.23 0.00 0.00 0.00 300.004403 Capital Outlay on Animal Husbandry 2.00 0.00 13.70 10.38 751.25 3969.50 2452.27 3967.83 4300.00 6355.004405 Capital Outlay on Fisheries 576.56 181.48 542.13 484.50 1212.22 955.37 390.11 0.00 1000.00 0.004406 Capital Outlay on Forestry & Wild Life 357.47 248.17 361.16 78.10 617.63 354.50 307.90 521.87 1995.00 2975.00
4408 Capital Outlay on Food Storage & Ware Housing 0.00 100.00 5.00 10.00 10.00 0.00 0.00 295.57 399.40 355.00
4416 Investments in Agricultural Institutions 0.00 0.00 0.00 0.00 0.00 0.00 0.00 0.00 0.00 0.004425 Capital Outlay on Co- Operation 1232.90 64.86 823.82 0.00 325.18 227.48 227.54 0.00 0.00 0.00
4515 Capital Outlay on Other Rural Development Programmes 0.00 0.00 0.00 0.00 17522.56 13608.79 13407.36 427.35 87.98 657.03
4575 Capital Outlay on Other Special Area Programme 0.00 0.00 0.00 0.00 0.00 0.00 0.00 7300.00 13024.00 21470.00
4700 Capital Outlay on Major Irrigation 0.00 0.00 0.00 0.00 0.00 0.00 2926.04 0.00 39920.33 30000.004701 Capital Outlay on Major & Medium Irrigation 171723.15 168244.44 279709.55 313976.06 373059.49 199763.67 200786.99 0.00 2459.96 2621.874702 Capital Outlay on Minor Irrigation 10299.46 10988.38 19729.21 17722.28 33722.67 33907.73 43020.06 283936.13 336247.38 429380.05
B.CAPITAL A/C Capital Outlay on
82

STATEMENT ‐ XVIIMajor Head‐wise Expenditure Under State Plan Schemes (` in Lakhs)
Major Head DESCRIPTION 2002-03 2003-04 2004-05 2005-06 2006-07 2007-08 2008-09 2009-10 2010-11 RE 2011-12
BE
4705 Capital Outlay on Command Area Development 10.00 0.00 0.00 0.00 40.00 0.00 527.67 52378.16 68959.08 86980.964711 Capital Outlay on Flood Control Projects 810.81 711.27 750.65 926.80 2068.81 1936.75 3328.89 2393.45 1.00 5001.004801 Capital Outlay on Power Projects 0.00 0.00 0.00 5000.00 30000.00 32000.00 85000.00 1408.15 1630.00 1450.004851 Capital Outlay on Village & Small Industries 912.22 166.91 280.55 524.61 74.17 1107.51 3530.45 167500.00 53871.00 80000.004852 Capital Outlay on Iron and Steel Industries 245.10 185.00 270.70 680.00 6531.47 9499.00 0.00 2486.55 4345.58 2110.004858 Capital Outlay on Engineering Industries 0.00 0.00 -39.90 0.00 0.00 0.00 0.00 6875.75 554.25 2900.00
4859 Capital Outlay on Telecommunication and Electronics Industries 0.00 0.00 0.00 0.00 0.00 0.00 0.00 0.00 0.00 0.00
4860 Capital Outlay on Consumer Industries 0.00 0.00 8.44 5.00 6.86 116.86 192.39 215.13 3706.77 2350.004885 Other Capital Outlay on Industries & Minerals 225.00 0.00 0.00 0.00 0.00 0.00 22420.51 11000.00 2500.00 0.005051 Capital Outlay on Ports & Light Houses 496.03 510.14 534.55 571.15 694.72 648.50 -648.50 0.00 181.36 5000.005053 Capital Outlay on Civil Aviation 0.00 0.00 0.00 0.00 0.00 0.00 0.00 0.00 0.00 0.005054 Capital Outlay on Roads & Bridges 41812.14 50511.24 81051.51 100570.02 175834.58 127017.26 191383.40 229115.01 216915.40 250500.005055 Capital Outlay on Road Transport 0.00 0.00 0.00 0.00 5821.00 10500.00 20526.26 22284.18 19600.00 19178.255075 Capital Outlay On Other Transport Services 0.00 0.00 0.00 0.00 0.00 0.00 0.00 0.00 0.00 0.005452 Capital Outlay on Tourism 0.00 0.00 0.00 0.00 0.00 5085.51 5613.00 9473.45 10930.00 13660.005465 Inv.in Genl.Finl and Trdg Insts 7453.50 7142.50 11772.16 4857.66 28156.23 36290.23 17043.38 20110.06 40158.00 49700.00
5475 Capital Outlay on Other General Economic Services -35.50 -46.69 -29.49 1031.82 500.00 611.79 500.00 1500.00 1488.98 1245.00
271154.24 289542.18 456411.47 558592.96 804141.30 668607.14 842585.55 1083290.38 1090204.02 1300283.59
6202 Loans for Education, Sports, Art & Culture 0.00 0.00 0.00 959.00 0.00 0.00 0.00 0.00 0.00 0.006210 Loans for Medical & Public Health 0.00 0.00 0.00 462.06 358.77 391.15 317.48 0.00 0.00 0.006211 Loans For Family Welfare 0.00 0.00 0.00 0.00 0.00 0.00 0.00 0.00 0.00 0.006215 Loans for Water Supply & Sanitation 16367.18 16571.05 12623.08 5250.00 4800.00 9584.54 6379.75 53251.41 83250.00 118985.006216 Loans for Housing 0.00 0.00 0.00 4640.00 7500.00 30000.00 10000.00 7600.00 0.00 0.006217 Loans for Urban Development 6635.58 8253.62 9319.10 2925.79 15414.52 19503.04 45.97 19637.00 20000.00 50000.006220 Loans for Information and Publicity 0.00 0.00 0.00 0.00 0.00 0.00 0.00 0.00 200.00 300.006235 Loans for Social Security and Welfare 0.00 291.29 0.00 0.00 0.00 0.00 0.00 0.00 0.00 0.006401 Loans for Crop Husbandry 0.00 0.00 0.00 0.00 0.00 0.00 0.00 0.00 0.00 0.006402 Loans for Soil and Water Conservation 0.00 0.00 0.00 0.00 0.00 0.00 0.00 0.00 0.00 0.006405 Loans for Fisheries 5.59 30.00 16.37 1.00 4.00 4.00 4.00 0.00 0.00 0.006406 Loans for Forestry & Wild Life 0.00 0.00 0.00 1.38 4.14 6.39 8.85 1800.00 1800.00 1500.006408 Loans for Food Storage & Ware Housing 71.22 39.02 438.95 0.00 0.00 812.93 1553.03 329.81 425.00 300.006416 Loans for Agricultural Financial Institutions 590.03 315.86 315.54 565.00 593.06 832.55 879.32 550.60 2706.88 110.68
Total: B.CAPITAL A/C Capital Outlay onC.LOAN A/C
83

STATEMENT ‐ XVIIMajor Head‐wise Expenditure Under State Plan Schemes (` in Lakhs)
Major Head DESCRIPTION 2002-03 2003-04 2004-05 2005-06 2006-07 2007-08 2008-09 2009-10 2010-11 RE 2011-12
BE
6425 Loans for Co- Operation 834.24 39.04 149.34 0.00 382.66 208.66 1079.00 533.64 25144.00 15000.006801 Loans for Power Projects 4723.00 58679.90 14777.50 1813.00 0.00 555.00 0.79 166.00 396.00 810.006851 Loans for Village and Small Industries 1376.17 113.88 173.68 9.25 288.25 0.29 117.00 0.00 10000.00 5000.006852 Loans for Iron and Steel Industries 0.00 0.00 0.00 0.00 0.00 0.00 0.00 0.00 0.00 0.00
6853 Loans for Non- Ferrous Mining & Metallurgical Industries 0.00 0.00 0.00 0.00 0.00 0.00 0.00 0.00 0.00 0.00
6857 Loans for Chemical and Pharmaceutical Industries 236.00 0.00 0.00 0.00 0.00 0.00 0.00 107.00 64.40 0.00
6858 Loans for Engineering Industries 10.13 0.00 402.00 1243.57 0.00 8000.00 0.00 0.00 0.00 0.00
6859 Loans for Telecommunication & Electronic Industries 0.00 0.00 0.00 0.00 0.00 0.00 0.00 7641.10 13542.55 5500.00
6860 Loans for Consumer Industries 6901.95 4505.54 8069.95 6215.22 1251.33 5124.57 1898.88 0.00 0.00 0.006885 Loans for Minerals & other Industries 0.00 0.00 0.00 0.00 0.00 0.00 0.00 0.00 0.00 0.007055 Loans to Road Transports 0.00 0.00 0.00 0.00 0.00 0.00 0.00 0.00 0.00 0.007075 Loans for Other Transport 0.00 0.00 0.00 1470.00 0.00 110.58 0.00 0.00 4050.00 0.00
7465 Loans for General Financial and Trading Institutions 1094.00 300.00 0.00 0.00 0.00 0.00 0.00 0.00 0.00 0.00
7475 Loans for Other General Economic Services 0.00 0.00 0.00 0.00 0.00 0.00 0.00 0.00 0.00 0.007610 Loans to Government Servants, etc., 6.95 0.00 0.00 0.00 0.00 0.00 0.00 0.00 0.00 0.007615 Miscellaneous Loans 0.00 0.00 0.00 0.00 0.00 0.00 0.00 0.00 0.00 0.00
Total: C.LOAN A/C 38852.04 89139.20 46285.51 25555.27 30596.73 75133.70 22284.07 91616.56 161578.83 197505.68GRAND TOTAL 556224.69 664257.18 942752.60 1018947.96 1544691.90 1477600.01 1805997.46 2285939.14 2676391.88 3184216.15
84

STATEMENT ‐ XVIIIMajor Head‐wise Expenditure Under Centrally Sponsore Schemes (` in Lakhs)
Major Head DESCRIPTION 2002-03 2003-04 2004-05 2005-06 2006-07 2007-08 2008-09 2009-10 2010-11 RE 2011-12
BEA. REVENUE A/C
2014 Administration of Justice 0.00 0.00 0.00 0.00 0.00 0.00 0.00 0.00 29.00 0.002202 General Education 2152.89 538.27 155.81 634.91 1236.84 2355.97 3829.53 3534.68 11000.00 55964.002203 Technical Education 0.00 0.00 0.00 0.00 0.00 0.00 0.00 0.00 401.60 600.002204 Sports and Youth Services 102.20 74.20 180.33 180.33 163.72 156.58 175.00 812.18 1539.69 1741.912205 Art & Culture 0.00 0.74 4.46 0.05 0.00 0.00 0.33 0.00 6.00 6.002210 Medical and Public Health 1589.24 273.59 1240.62 1095.10 643.59 1086.40 246.31 185.07 636.19 697.062211 Family Welfare 4334.12 4552.38 5608.56 2408.41 1116.26 1262.64 1453.72 1668.01 3160.65 4683.082215 Water Supply and Sanitation 14885.20 3789.70 1668.95 4816.37 2653.83 3207.26 3138.67 1130.68 50.00 50.002216 Housing 0.00 0.00 0.00 0.00 0.00 0.00 7604.68 10739.77 8074.56 8127.392217 Urban Development 776.97 2527.00 2408.50 2713.01 6443.05 10952.74 13677.62 0.00 0.00 0.002225 Welfare of SC,ST and OBC 1375.98 1163.11 4557.42 5827.04 4355.85 4178.30 4789.19 9470.89 16247.22 16834.722230 Labour and Employment Training 0.00 22.23 0.00 3.21 273.52 509.39 8.12 2913.80 1000.91 3651.002235 Social Security and Welfare 50.06 198.68 517.21 190.41 103.62 154.14 324.91 1095.62 5956.10 7354.632251 Secretariat - Social Services 0.00 0.00 0.00 0.00 0.00 0.00 0.00 5568.70 7580.61 11405.742401 Crop Husbandry 4923.98 4892.55 5673.59 8330.65 5536.68 8246.66 4958.40 2249.34 5178.09 5143.802402 Soil & Water Conservation 1532.18 2398.28 2719.20 3834.65 3633.15 3287.39 4014.03 1275.39 2922.31 3911.342403 Animal Husbandry 451.81 85.01 380.80 872.55 1008.24 678.69 1046.87 129.00 1000.00 1000.002404 Dairy Development 88.00 55.90 163.00 279.50 424.98 83.89 268.06 684.60 634.88 289.442405 Fisheries 180.30 314.65 1052.04 974.37 736.91 819.88 633.97 1932.33 2913.00 2847.002406 Forestry and Wild Life 2032.65 1243.58 1512.47 1012.13 1246.34 1704.52 2194.63 0.00 0.00 0.002425 Co-Operation 35.03 19.88 19.60 11.46 8.00 0.00 0.00 15.39 0.01 0.002501 Special Programmes for Rural Development 59.98 163.00 29.31 2207.47 24.87 210.87 0.00 0.00 0.00 0.002505 Rural Employment 223.15 0.00 0.00 0.00 0.00 0.00 0.00 27.71 628.00 1079.002506 Land Reforms 45.00 87.37 87.50 364.71 79.21 0.00 43.25 97.30 563.46 264.002515 Other Rural Development Programmes 0.00 247.05 313.67 386.34 109.51 84.53 95.08 30.00 30.00 46.392551 Hill Areas 0.00 0.00 0.00 0.00 0.00 0.00 0.00 1947.70 2500.00 32255.002705 Command Area Development 2150.37 1409.91 999.93 1046.39 1962.16 2994.18 1674.06 444.38 1132.31 1246.152810 Non Conventional Sources of Energy 23.49 875.37 52.43 171.32 200.58 153.42 374.37 1668.41 4267.64 3670.002851 Village and Small Industries 488.01 330.23 309.04 1182.95 1928.62 3072.61 1974.70 0.00 35.00 250.002852 Industries 0.00 0.00 0.00 0.00 0.00 0.00 0.00 0.00 0.00 0.002885 Other Outlays on Industries and Minerals 112.04 0.00 225.38 0.00 0.00 0.00 0.00 139.98 362.00 490.003435 Ecology and Environment 0.00 582.55 470.45 383.68 530.10 230.19 188.39 713.28 500.00 500.003452 Tourism 0.00 500.00 4591.38 1070.44 499.74 500.00 495.02 0.00 0.00 1253.003454 Census Surveys & Statistics 137.07 155.04 163.31 79.22 75.93 0.03 0.00 0.00 0.00 0.003455 Meteorology 243.94 0.00 0.00 0.00 0.00 0.00 0.00 0.00 0.00 0.003475 Other General Economic Services 0.00 288.65 160.45 0.00 0.00 602.60 1162.13 0.00 0.00 12750.00
37993.66 26788.92 35265.41 40076.67 34995.30 46532.88 54371.04 48474.21 78349.23 178110.65Total: A.REVENUE A/C
85

STATEMENT ‐ XVIIIMajor Head‐wise Expenditure Under Centrally Sponsore Schemes (` in Lakhs)
Major Head DESCRIPTION 2002-03 2003-04 2004-05 2005-06 2006-07 2007-08 2008-09 2009-10 2010-11 RE 2011-12
BEB. CAPITAL A/C Capital Outlay on
4059 Capital Outlay on Public Works 250.22 415.62 404.50 439.79 537.00 0.00 0.00 0.00 0.00 0.004211 Capital Outlay on Family Welfare 686.41 1164.41 33.06 0.00 0.00 0.00 0.00 0.00 0.00 0.004215 Capital Outlay On Water Supply and Sanitation 0.00 0.00 0.00 21188.03 31713.03 34151.68 53324.13 26404.28 0.00 0.004216 Capital Outlay on Housing 33.46 47.89 45.50 15.08 60.60 0.00 0.00 0.00 0.00 0.004225 Welfare of SC,ST and OBCs 684.60 1699.52 811.88 2.63 1788.14 1305.64 1403.27 1890.94 2010.00 4032.004405 Capital Outlay on Fisheries 102.98 145.01 214.23 75.32 115.30 50.77 86.26 130.60 865.00 1025.004425 Capital Outlay on Co- Operation 18.00 0.00 6.98 0.00 0.00 0.00 0.00 0.00 0.00 0.004701 Capital Outlay on Major & Medium Irrigation 0.00 0.00 0.00 0.00 0.00 15103.66 15791.00 0.00 0.00 0.004702 Capital Outlay on Minor Irrigation 0.00 0.00 0.00 0.00 2328.19 587.42 255.72 0.00 5087.30 0.004851 Capital Outlay on Village & Small Industries 225.00 0.00 18.27 0.00 0.00 0.00 0.00 0.00 0.00 0.005055 Capital Outlay on Road Transport 1753.90
2000.67 3472.45 1534.42 21720.85 36542.26 51199.17 70860.38 28425.82 7962.30 6810.90C.LOAN A/C
6211 Loans For Family Welfare 0.00 11.25 24.61 35.21 10.43 1.50 70.75 0.00 0.00 0.006217 Loans for Urban Development 0.00 520.09 1913.49 0.00 0.00 0.00 0.00 22.00 50.00 0.006402 Loans for Soil and Water Conservation 0.00 0.00 0.07 0.00 0.00 0.00 0.00 0.00 0.00 0.006425 Loans for Co- Operation 95.57 27.75 27.38 0.00 0.00 0.00 0.00 0.00 0.00 0.006851 Loans for Village and Small Industries 4.48 0.00 1.55 0.00 0.00 0.00 0.00 0.00 0.00 0.007610 Loans to Government Servants, etc., 63.07 28.43 11.06 3.75 3.75 7.50 3.75 3.79 200.00 200.00
163.12 587.52 1978.16 38.96 14.18 9.00 74.50 25.79 250.00 200.00GRAND TOTAL 40157.45 30848.89 38777.99 61836.48 71551.74 97741.05 125305.92 76925.82 86561.53 185121.55
Total: B. CAPITAL A/C Capital Outlay on
Total: C.LOAN A/C
86

STATEMENT ‐ XIXMajor Head‐wise Expenditure Under Central Plan Schemes (` in Lakhs)
Major Head DESCRIPTION 2002-03 2003-04 2004-05 2005-06 2006-07 2007-08 2008-09 2009-10 2010-11 RE 2011-12
BEA. REVENUE A/C
2202 General Education 14998.81 2004.14 2199.52 2583.80 3980.15 3104.94 4072.06 3643.26 4110.01 5926.332204 Sports and Youth Services 80.40 27.87 95.39 37.95 12.50 30.00 0.00 0.00 0.00 0.002210 Medical and Public Health 41.54 92.70 195.80 35.62 165.83 134.67 89.30 47.72 167.79 150.002211 Family Welfare 9986.60 10998.36 10303.61 9371.48 13533.56 16163.74 21032.65 22449.37 25011.40 29093.122215 Water Supply and Sanitation 0.00 15953.51 11256.79 0.00 0.00 0.00 0.00 0.00 0.00 0.002225 Welfare of SC,ST and OBC 4748.86 3060.53 758.71 5269.79 8737.95 11509.57 8423.13 11796.28 26833.46 20144.542235 Social Security and Welfare 9105.43 10111.74 10811.84 13527.49 13342.73 18986.79 22839.07 31384.32 37372.13 38901.362251 Secretariat - Social Services 0.00 0.00 0.00 0.00 0.00 0.00 0.002401 Crop Husbandry 109.17 123.00 0.00 0.00 11.71 0.74 0.00 483.42 0.00 0.002403 Animal Husbandry 25.83 97.78 321.95 149.44 36.78 424.13 447.19 328.70 270.00 75.002406 Forestry and Wild Life 172.17 230.83 217.76 203.97 191.62 200.51 283.18 388.52 700.00 700.002501 Special Programmes for Rural Development 39.75 0.00 0.00 0.00 0.00 0.00 0.00 0.00 0.00 0.002551 Hill Areas 15.47 18.63 12.86 18.77 18.07 19.83 24.04 0.00 460.00 0.002851 Village and Small Industries 435.22 89.86 937.60 231.88 26.29 314.88 321.31 240.07 129.00 120.003452 Tourism 512.00 0.00 0.00 0.00 0.00 0.00 0.00 0.00 0.00 0.003454 Census Surveys & Statistics 19.15 98.20 29.46 560.92 247.42 0.03 0.00 0.00 0.00 0.00
40290.40 42907.15 37141.29 31991.11 40304.61 50889.83 57531.93 70761.66 95053.79 95110.35B.CAPITAL A/C Capital Outlay on
4225 Welfare of SC,ST and OBCs 201.46 0.00 292.96 326.17 394.87 73.47 81.00 80.97 193.00 0.004852 Capital Outlay on Iron and Steel Industries 0.00 0.00 349.30 0.00 0.00 0.00 0.00 0.00 0.00 0.00
Total: B.CAPITAL A/C Capital Outlay onC.LOAN A/C 201.46 0.00 642.26 326.17 394.87 73.47 81.00 80.97 193.00 0.00
6425 Loans for Co- Operation 0.00 0.00 0.00 0.00 0.00 0.00 0.00 0.00 0.00 0.006860 Loans for Consumer Industries 0.00 0.00 70.42 0.00 0.00 0.00 0.00 0.00 0.00 0.00
0.00 0.00 70.42 0.00 0.00 0.00 0.00 0.00 0.00 0.0040491.86 42907.15 37853.97 32317.28 40699.48 50963.30 57612.93 70842.63 95246.79 95110.35
Total: C.LOAN A/CGRAND TOTAL
Total: A.REVENUE A/C
87

STATEMENT ‐ XXPublic Debt Liabilities as on 31st March (` in crores)
Details 2003 2004 2005 2006 2007 2008 2009 2009-10 2010-11 RE 2011-12 BE
I. Internal Debt
1. Market Loans 7050.51 9653.36 11769.50 11935.00 11702.46 11989.95 18573.35 23257.18 24555.37 32755.12
2. Others 7031.89 10179.96 14395.68 18831.71 20943.40 21326.39 21422.51 21940.79 24589.60 26133.25
Total Internal Debt 14082.40 19833.32 26165.18 30766.71 32645.86 33316.34 39995.86 45197.97 49144.97 58888.37
II. Loans & Adv. from Central Govt. 12086.91 10882.90 9031.06 9282.22 9199.64 9557.08 9691.81 9902.21 10906.00 12054.29
Public Debt (I+II) 26169.31 30716.22 35196.24 40048.93 41845.50 42873.42 49687.67 55100.18 60050.97 70942.66
III. Other Liabilities
(a) Small Savings, PF, etc. 5325.27 5884.45 6469.68 7125.55 7784.93 8498.05 9709.55 11183.78 12734.14 14319.14
(c) Interest bearing Obligations 500.87 287.68 277.36 366.20 408.98 308.10 347.70 274.53 274.32 274.32
(d) Non-interest bearing obligations 5238.18 5078.49 4996.63 4695.38 7642.76 8427.65 11805.25 17640.48 17640.69 16646.81
Other Liabilities (III) 11064.32 11250.62 11743.67 12187.13 15836.67 17233.80 21862.50 29098.79 30649.15 31240.27
IV. Total Liabilities (I+II+III) 37233.63 41966.84 46939.91 52236.06 57682.17 60107.22 71550.17 84198.97 90700.12 102182.93
V. Interest Payments 3291.89 3710.00 3794.05 3764.82 4236.40 4505.78 4532.00 5213.00 5542.00 6950.00
VI. Debt Service
(a) Repayment of Principal-GoI 1409.19 3161.01 3407.59 417.50 737.03 448.56 461.43 470.46 534.93 590.51
(b) Payment of Interest-GoI 1523.65 1535.91 1296.15 715.16 754.38 746.13 757.69 752.21 748.50 818.98
Total 2932.84 4696.92 4703.74 1132.66 1491.41 1194.69 1219.12 1222.67 1283.43 1409.49
(a) Repayment of Principal-Internal Debt 286.76 780.41 621.81 393.36 1012.34 802.08 482.99 791.75 956.25 2571.35
(b) Payment of Interest-Internal Debt 1327.63 1732.18 2043.12 2517.46 2913.64 3100.57 963.81 3674.54 3894.57 4919.73
Total 1614.39 2512.59 2664.93 2910.82 3925.98 3902.65 1446.80 4466.29 4850.82 7491.08
(c) Loans received during the year 5432.74 8488.33 8509.43 5663.54 3545.94 2278.55 8592.15 7990.86 7143.72 14353.80
(d) Net receipts after deducting the repayment 885.51 1278.82 1140.76 1620.06 -1871.45 -2818.79 5926.23 2301.90 1009.47 5453.23(e) Percentage of repayment incl. Interest to Loans received 84 85 87 71 153 224 31 71 86 62
* Excludes small savings loans which is from NSSF (RBI) from 1999-2000
88

STATEMENT ‐ XXIContingent Liabilities for Guarantee Given by the Government (` in crores)
Principal Interest1998 9719.07 5457.89 135.621999 13368.27 7817.84 2052000 13333.66 9416.56 412.172001 16424.54 11624.27 1379.862002 20823.48 11844.98 434.192003 20972.85 12799.61 514.072004 21224.69 13913.93 265.32005 19909.51 11293.11 280.892006 20107.33 8875.88 108.042007 19792.93 9728.54 150.942008 23108.87 10390.27 396.132009 18732.42 8177.69 515.282010 18420.17 6953.88 249.17
Amount Outstanding Max.amount guaranteed (Principal Only)As on 31st March
89

STATEMENT ‐ XXIILoans & Advances by the State Government (` in crores)
2002-03 2003-04 2004-05 2005-06 2006-07 2007-08 2008-09 2009-10 2010-11 RE 2011-12 BE Opeing Balance 4556.45 4256.03 5202.94 5767.51 5943.56 6240.82 6945.49 7620.18 8046.40 9524.26 Amount advanced during the year 627.58 1011.2 611.42 299.6 357.23 756.74 731.34 981.58 1637.36 2067.88 Amount repaid during the year 928 64.29 46.85 123.55 59.97 52.07 56.65 555.36 159.50 61.72 Closing Balance 4256.03 5202.94 5767.51 5943.56 6240.82 6945.49 7620.18 8046.40 9524.26 11530.42 Net increase(+)/decrease(-) -300.43 946.91 564.57 176.05 297.26 704.67 674.69 426.22 1477.86 2006.16 Interest received and credited to Revenue 19.98 96.27 94.95 32.85 32.85 53.23 32.39 59.05 168.27 78.45 Interest recived as % to Outstanding Loan 0.47 1.85 1.65 0.55 0.53 0.77 0.43 0.73 1.77 0.68
90

STATEMENT ‐ XXIIIOutstanding Loans as on 31st March (` in Lakhs)
Sl.No Category 2001 2002 2003 2004 2005 2006 2007 2008 2009 2010(A).PUBLIC SECTOR UNDERTAKINGS
1 Kar.Antibiotics & Pharmaceuticals Ltd 113.89 113.89 113.89 113.89 113.89 113.89 113.89 113.89 113.89 113.892 Kar.Urban Water Supply & Drainage Board 28931.11 29375.75 29818.69 30213.75 25665.35 25665.35 25665.24 25665.24 25665.02 25665.023 Bangalore Water Supply & Sewerage Board 55995.67 77960.90 93863.08 110054.13 122377.21 122377.21 126377.20 131561.74 136941.49 186941.494 Kar.State Film Industries Dev. Corpn Ltd 52.84 52.84 52.84 52.84 52.84 52.84 52.84 42.24 42.24 42.245 Karnataka State Seeds Corporation 197.03 197.03 367.45 451.35 451.35 451.35 445.96 445.96 445.96 445.966 Kar.State Oil Seed Growers Co-op Federation 153.60 193.60 418.60 328.48 328.48 328.48 328.48 328.48 328.48 328.487 Karnataka Agro Industries Corporation 2020.97 2020.93 1578.32 1636.20 606.20 583.00 583.00 583.00 442.00 583.008 Kar. Milk Producers Co-op Federation Ltd 2477.32 2477.32 2477.32 1259.26 1259.27 1259.27 1259.27 356.99 356.99 356.999 Karnataka Fishermen Development Corpn 70.00 70.00 70.00 70.00 70.00 70.00 70.00 70.00 70.00 70.00
10 Karnataka Forest Industries Corporation 1.17 1.16 1.16 1.16 1.16 1.16 1.16 1.16 1.16 1.1611 Karnataka Forest Development Corporation 116.05 116.05 116.05 116.05 116.05 116.05 0.00 0.00 0.00 0.00
11Karnataka Forest Development Corporation(Formerly Known as Karnataka Forest Plantation Corporation) 0.00 0.00 0.00 0.00 0.00 0.00 0.00 0.00 0.00 1507.05
12 Karnataka Food & Civil Supplies Corpn 162.41 162.41 162.41 162.42 162.42 162.42 162.42 162.42 162.42 162.4213 Karnataka State Co-op Agril & Rural Dev. Bank 4748.89 4716.33 4723.98 5039.84 5355.38 4332.35 4925.41 5757.93 6637.25 -585.3714 (i) KPC 32988.30 32988.30 1924.99 2624.98 1280.63 1280.63 1280.63 1280.63 1280.63 1280.63
(ii) Chakra Scheme 6291.31 6291.31 0.00 0.00 0.00 0.00 0.00 0.00 0.00 0.00(iii) Implementation of Plan schemes 33633.08 33633.08 0.00 0.00 0.00 0.00 0.00 0.00 0.00 0.00
15 KEB 0.00 0.00 0.00 0.00 0.00 0.00 0.00 0.00 0.00 0.00(i) Electrical Pumpsets 447.93 742.28 447.93 447.93 447.93 447.93 447.93 447.93 447.93 447.93(ii) Rural Electrification 761.74 761.74 761.70 761.70 761.70 761.70 761.70 761.70 761.70 761.70(iii) Other Schemes 19385.43 19385.43 19385.43 19385.43 19385.43 19385.43 19385.43 19385.43 19385.43 19385.43(iv) Plan Schemes 8070.00 8070.00 8070.00 8070.00 8070.00 8070.00 8070.00 8070.00 8070.00 8070.00(v) TSP - Rural Electrification 5423.00 5423.00 9796.00 12676.85 1348.00 1348.00 1348.00 1348.00 1348.00 1348.00(vi) Other Loans 6171.78 6171.78 6171.78 6171.79 12435.33 12160.98 12160.98 12692.68 12692.68 12080.44(vii) CPSUs liability as loans to KPTCL 0.00 0.00 0.00 0.00 55095.40 55095.40 55095.40 55095.40 55095.40 55095.40
16 Kar. State Small Industries Corpn 718.32 720.32 717.95 717.95 586.74 586.74 578.30 578.30 577.87 574.1117 Karnataka Handloom Development Corpn 561.03 561.03 559.96 549.76 549.76 549.76 549.76 549.76 549.76 549.7618 Karnataka Leather Industries Corpn 129.55 179.55 179.55 179.55 179.55 179.55 178.11 178.11 178.11 177.7119 Dandeli Steel & Ferro Alloys Ltd 30.71 30.71 30.71 30.71 30.71 30.71 30.71 30.71 30.71 30.7120 Gold Mining Companies -3.20 -3.20 -3.20 -3.20 -3.20 -3.20 -3.20 -3.20 -3.20 -3.2021 Copper Consortium 30.00 30.00 30.00 30.00 30.00 30.00 30.00 30.00 30.00 30.0022 Mangalore Chemicals & Fertilisers Ltd 1049.00 1049.00 1049.00 1049.00 1049.00 1049.00 1049.00 465.40 -118.20 -410.0023 Mysore Acetate & Chemicals Ltd 1316.25 1316.25 1552.25 1552.25 1552.25 1552.25 1552.25 1552.25 1552.25 1552.2524 New Government Electric Factory 11703.19 12259.43 12259.43 12259.43 12259.43 12259.43 12259.43 20259.43 20259.43 20259.4325 Mysore Electrical Engineering Industries 615.89 1405.89 1405.89 1405.89 1405.89 1405.89 1405.89 1405.89 1405.89 1405.8926 Mysore Lamp Works 2685.81 2989.81 2989.81 2989.81 3391.81 4635.38 4625.53 4625.53 4625.53 4732.53
91

STATEMENT ‐ XXIIIOutstanding Loans as on 31st March (` in Lakhs)
Sl.No Category 2001 2002 2003 2004 2005 2006 2007 2008 2009 201027 Karnataka Vidyuth Karkhane 49.08 49.08 49.08 49.08 49.08 49.08 49.08 49.08 49.08 49.0828 Karnataka Implements & Machinery Ltd 218.78 218.78 218.78 218.78 215.89 215.89 215.89 215.89 215.89 215.8929 Electro Mobiles India Ltd 61.00 61.00 61.00 61.00 61.00 61.00 61.00 61.00 61.00 61.0030 KEONICS 200.00 200.00 200.00 200.00 150.00 150.00 150.00 150.00 150.00 150.0031 REMCO 200.00 200.00 200.00 200.00 200.00 200.00 200.00 200.00 200.00 200.0032 TEXTILES MILLS 0.00 0.00 0.00 0.00 0.00 0.00 0.00 0.00 0.00 0.00
(i) Mahadeva Textile Mills 878.80 887.24 1417.24 1417.24 1413.74 1413.74 1413.74 1413.74 1413.74 1413.74(ii) Sri Someshwara Farmers Co-op Spinning Mills 121.69 121.69 121.69 121.69 121.69 121.69 121.70 121.70 121.70 121.70
(iii) Tungabhadra Farmers Co-op Spinning Mills Ltd 151.00 151.00 151.00 151.00 151.00 151.00 151.00 151.00 151.00 151.00(iv) Karnataka Textile Mills Pvt. Ltd 50.00 50.00 50.00 50.00 50.00 50.00 50.00 50.00 50.00 50.00
33 SUGAR MILLS 0.00 0.00 0.00 0.00 0.00 0.00 0.00 0.00 0.00 0.00(I) Chamundeshwari Sugar Mills 309.00 309.00 309.00 309.00 309.00 309.00 309.00 309.00 309.00 309.00(ii) Doodhganga Sugar Mills 300.77 300.77 300.77 300.77 300.77 300.77 300.77 300.77 300.77 300.77(iii) Gangavathi Sugar Mills 866.18 866.18 866.18 866.18 866.18 866.18 866.18 866.18 866.18 1241.18(iv) Bhadra Sugar Mills 180.42 180.42 180.42 180.42 180.42 180.42 180.42 180.42 180.42 180.42(v) Mahadeshwara Sugar Mills 93.71 93.71 93.71 93.71 93.71 93.71 93.71 93.71 93.71 93.71(vi) Godavari Sugar Mills 85.81 85.81 85.81 85.81 85.81 85.81 85.81 85.81 85.81 85.81(vii) Davanagere Sugar Mills 270.87 270.87 270.87 270.87 270.87 270.87 270.87 270.87 270.87 270.87(viii) Mysore Paper Mills Sugar Factory 1008.02 1008.02 996.52 996.52 996.52 996.52 996.52 996.52 996.52 996.44
34 Mandya National Paper Mills Ltd 85.81 85.81 85.81 85.81 85.81 85.81 85.81 85.80 85.80 85.8035 Mysore Paper Mills Ltd 7603.39 7713.39 7713.39 7713.39 7496.89 10192.77 10204.10 10204.10 20.88 20.8836 Kar. State Soaps & Detergents Ltd 325.00 325.00 325.00 325.00 406.22 406.22 406.22 406.22 225.00 225.0037 Karnataka Electronic Development Corpn 50.00 50.00 50.00 50.00 50.00 50.00 50.00 50.00 50.00 50.0038 Mysore Porcelain Ltd -36.96 -36.96 -36.96 -36.96 -36.96 -36.96 -36.96 -36.96 -36.96 -36.9639 Mysore Sales International Ltd 987.77 987.77 387.77 387.77 387.77 387.77 387.77 387.77 387.77 387.7740 Mysore Tobacco Company Ltd 134.11 134.11 134.11 134.11 134.11 134.11 134.11 134.11 134.11 134.1141 Karnataka State Construction Corpn Ltd 677.43 677.43 677.43 676.33 621.34 621.34 588.76 577.90 577.90 30.0042 Kar. State Industrial Investment & Dev. Corpn 1775.89 1775.89 1775.89 1775.89 1775.90 1775.90 1775.90 1775.90 1775.89 1775.8943 Karnataka State Financial Corpn Ltd 2268.84 2268.84 2906.17 1941.17 1308.03 1308.03 1308.03 1308.03 1308.03 0.0044 Karnataka Industrial Area Development Board 560.02 560.02 560.02 560.02 560.02 560.02 560.02 560.02 560.02 560.0245 Karnataka Shipping Corporation 252.00 252.00 252.00 252.00 252.00 252.00 252.00 252.00 252.00 252.0046 KSRTC 500.00 500.00 500.00 500.00 500.00 500.00 500.00 263.71 0.00 4376.7547 Karnataka Secondary Education Examn Board 54.50 54.50 54.50 54.50 54.50 54.50 54.50 54.50 54.50 54.50
48 National Institute of Advanced Studies, Bangalore 100.00 100.00 100.00 100.00 100.00 100.00 100.00 100.00 100.00 100.0049 Karnataka Truck Terminals 25.00 25.00 25.00 25.00 25.00 25.00 15.00 10.00 5.00 0.0050 Land Army Corporation 413.18 408.57 328.79 328.79 338.79 338.79 338.79 338.79 338.79 338.7951 Bangalore Mass Rapid Transport System 14284.00 14284.00 14484.00 14479.37 14479.37 14479.37 24313.37 41602.68 41601.37 0.00
92
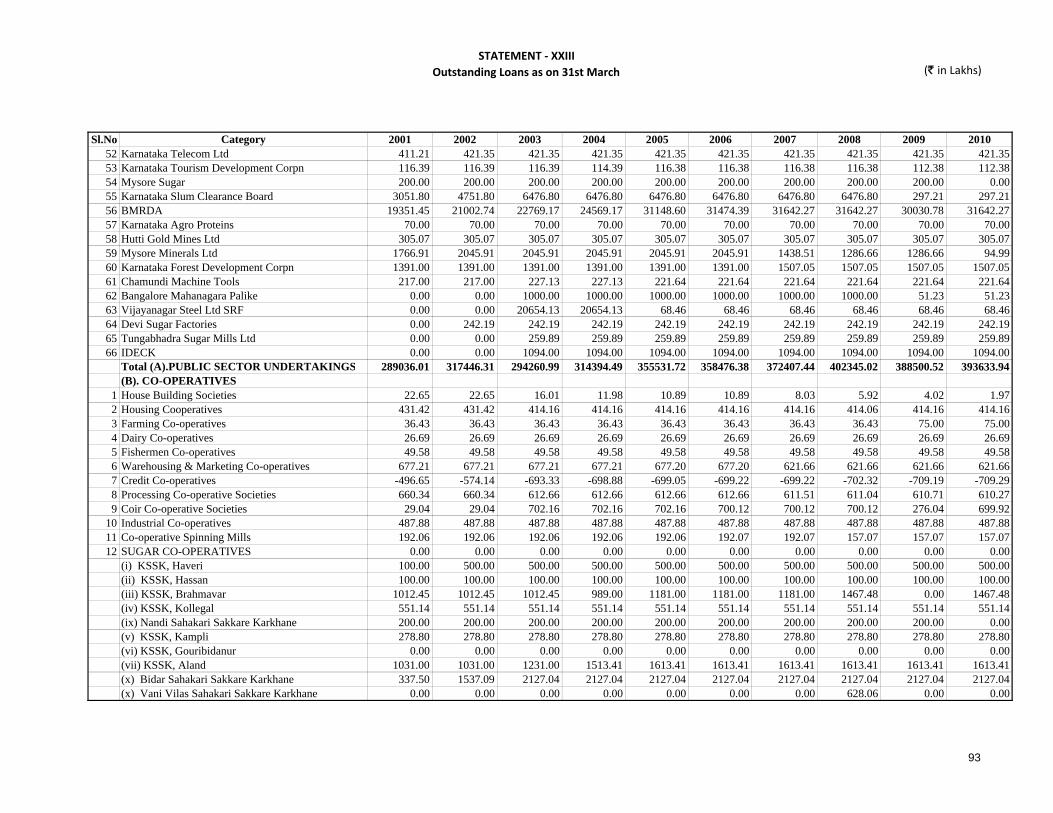
STATEMENT ‐ XXIIIOutstanding Loans as on 31st March (` in Lakhs)
Sl.No Category 2001 2002 2003 2004 2005 2006 2007 2008 2009 201052 Karnataka Telecom Ltd 411.21 421.35 421.35 421.35 421.35 421.35 421.35 421.35 421.35 421.3553 Karnataka Tourism Development Corpn 116.39 116.39 116.39 114.39 116.38 116.38 116.38 116.38 112.38 112.3854 Mysore Sugar 200.00 200.00 200.00 200.00 200.00 200.00 200.00 200.00 200.00 0.0055 Karnataka Slum Clearance Board 3051.80 4751.80 6476.80 6476.80 6476.80 6476.80 6476.80 6476.80 297.21 297.2156 BMRDA 19351.45 21002.74 22769.17 24569.17 31148.60 31474.39 31642.27 31642.27 30030.78 31642.2757 Karnataka Agro Proteins 70.00 70.00 70.00 70.00 70.00 70.00 70.00 70.00 70.00 70.0058 Hutti Gold Mines Ltd 305.07 305.07 305.07 305.07 305.07 305.07 305.07 305.07 305.07 305.0759 Mysore Minerals Ltd 1766.91 2045.91 2045.91 2045.91 2045.91 2045.91 1438.51 1286.66 1286.66 94.9960 Karnataka Forest Development Corpn 1391.00 1391.00 1391.00 1391.00 1391.00 1391.00 1507.05 1507.05 1507.05 1507.0561 Chamundi Machine Tools 217.00 217.00 227.13 227.13 221.64 221.64 221.64 221.64 221.64 221.6462 Bangalore Mahanagara Palike 0.00 0.00 1000.00 1000.00 1000.00 1000.00 1000.00 1000.00 51.23 51.2363 Vijayanagar Steel Ltd SRF 0.00 0.00 20654.13 20654.13 68.46 68.46 68.46 68.46 68.46 68.4664 Devi Sugar Factories 0.00 242.19 242.19 242.19 242.19 242.19 242.19 242.19 242.19 242.1965 Tungabhadra Sugar Mills Ltd 0.00 0.00 259.89 259.89 259.89 259.89 259.89 259.89 259.89 259.8966 IDECK 0.00 0.00 1094.00 1094.00 1094.00 1094.00 1094.00 1094.00 1094.00 1094.00
Total (A).PUBLIC SECTOR UNDERTAKINGS 289036.01 317446.31 294260.99 314394.49 355531.72 358476.38 372407.44 402345.02 388500.52 393633.94(B). CO-OPERATIVES
1 House Building Societies 22.65 22.65 16.01 11.98 10.89 10.89 8.03 5.92 4.02 1.972 Housing Cooperatives 431.42 431.42 414.16 414.16 414.16 414.16 414.16 414.06 414.16 414.163 Farming Co-operatives 36.43 36.43 36.43 36.43 36.43 36.43 36.43 36.43 75.00 75.004 Dairy Co-operatives 26.69 26.69 26.69 26.69 26.69 26.69 26.69 26.69 26.69 26.695 Fishermen Co-operatives 49.58 49.58 49.58 49.58 49.58 49.58 49.58 49.58 49.58 49.586 Warehousing & Marketing Co-operatives 677.21 677.21 677.21 677.21 677.20 677.20 621.66 621.66 621.66 621.667 Credit Co-operatives -496.65 -574.14 -693.33 -698.88 -699.05 -699.22 -699.22 -702.32 -709.19 -709.298 Processing Co-operative Societies 660.34 660.34 612.66 612.66 612.66 612.66 611.51 611.04 610.71 610.279 Coir Co-operative Societies 29.04 29.04 702.16 702.16 702.16 700.12 700.12 700.12 276.04 699.92
10 Industrial Co-operatives 487.88 487.88 487.88 487.88 487.88 487.88 487.88 487.88 487.88 487.8811 Co-operative Spinning Mills 192.06 192.06 192.06 192.06 192.06 192.07 192.07 157.07 157.07 157.0712 SUGAR CO-OPERATIVES 0.00 0.00 0.00 0.00 0.00 0.00 0.00 0.00 0.00 0.00
(i) KSSK, Haveri 100.00 500.00 500.00 500.00 500.00 500.00 500.00 500.00 500.00 500.00(ii) KSSK, Hassan 100.00 100.00 100.00 100.00 100.00 100.00 100.00 100.00 100.00 100.00(iii) KSSK, Brahmavar 1012.45 1012.45 1012.45 989.00 1181.00 1181.00 1181.00 1467.48 0.00 1467.48(iv) KSSK, Kollegal 551.14 551.14 551.14 551.14 551.14 551.14 551.14 551.14 551.14 551.14(ix) Nandi Sahakari Sakkare Karkhane 200.00 200.00 200.00 200.00 200.00 200.00 200.00 200.00 200.00 0.00(v) KSSK, Kampli 278.80 278.80 278.80 278.80 278.80 278.80 278.80 278.80 278.80 278.80(vi) KSSK, Gouribidanur 0.00 0.00 0.00 0.00 0.00 0.00 0.00 0.00 0.00 0.00(vii) KSSK, Aland 1031.00 1031.00 1231.00 1513.41 1613.41 1613.41 1613.41 1613.41 1613.41 1613.41(x) Bidar Sahakari Sakkare Karkhane 337.50 1537.09 2127.04 2127.04 2127.04 2127.04 2127.04 2127.04 2127.04 2127.04(x) Vani Vilas Sahakari Sakkare Karkhane 0.00 0.00 0.00 0.00 0.00 0.00 0.00 628.06 0.00 0.00
93

STATEMENT ‐ XXIIIOutstanding Loans as on 31st March (` in Lakhs)
Sl.No Category 2001 2002 2003 2004 2005 2006 2007 2008 2009 2010(x) Vani Vilas Sahakari Sakkare Karkhane 128.06 628.06 628.06 628.06 628.06 628.06 628.06 0.00 628.06 628.06(xi) Sri Rama Sahakari Sakkare Karkhane 100.00 100.00 700.00 700.00 700.00 700.00 700.00 700.00 700.00 700.00
13 Consumer Co-operatives 127.64 126.86 124.67 124.67 124.67 124.67 103.93 100.76 0.00 97.3614 Farmers Co-operative Spinning Mills, Hulkoti 417.86 417.86 417.86 417.86 417.86 417.86 417.86 417.86 417.86 417.8615 Bijapur Co-operative Spinning Mills 273.44 273.44 273.44 273.44 273.44 273.44 362.89 295.05 295.05 295.0516 Pandavapura Sahakari Sakkare Karkhane 2159.52 3347.82 3636.44 3951.45 3951.45 3951.45 3951.44 3951.44 3951.44 3951.4417 Raichur Co-operative Spinning Mills 270.61 270.61 270.61 270.61 270.61 385.64 385.64 391.65 391.65 391.6518 Belgaum Co-operative Cotton Spinning Mills 592.42 592.42 592.42 592.42 592.42 592.42 592.42 592.42 592.42 592.4219 Lakshmeshwara Farmers Co-op Spinning Mills 555.90 555.90 555.90 555.90 555.90 555.90 555.90 555.90 555.90 555.9020 Bagalkot Co-operative Spinning Mills 80.84 80.84 80.84 80.84 80.84 161.68 161.68 258.52 258.52 258.5221 Tungabhadra Farmers' Co-op Spinning Mills 265.50 265.50 265.50 265.50 265.50 531.00 531.00 531.00 531.00 531.0022 Gadag Co-op Textiles Mills, Hulkoti 448.00 736.00 736.00 736.00 736.00 736.00 736.00 736.00 736.00 736.0023 Raibag Sahakari Sakkare Karkhane Ltd 0.00 775.80 1163.82 1163.82 1163.82 1163.82 1163.82 1163.82 1163.82 1163.8224 Mahatma Gandhi Sahakari Sakkare Karkhane 0.00 0.00 2530.73 2656.20 2656.20 2684.00 2924.00 2963.40 2963.40 2963.4025 Sangam Sahakari Sakkare Karkhane 0.00 0.00 0.00 700.00 1500.00 1500.00 1500.00 1500.00 1500.00 1500.00
Total (B). CO-OPERATIVES 11147.33 15420.75 20498.23 21888.09 22978.82 23465.79 23714.94 24031.88 22069.13 23855.26(A). PUBLIC SECTOR UNDERTAKINGS 289036.01 317446.31 294260.99 314394.49 355531.72 358476.38 372407.44 402345.02 388500.52 393633.94(B). CO-OPERATIVES 11147.33 15420.75 20498.23 21888.09 22978.82 23465.79 23714.94 24031.88 22069.13 23855.26(C). OTHERS 107485.93 122779.00 110844.08 184012.45 198466.92 212415.15 227960.21 268172.90 351449.73 387152.52TOTAL 407669.27 455646.06 425603.30 520295.03 576977.46 594357.32 624082.59 694549.80 762019.38 804641.72Interest Received & Credited 12942.11 11211.04 1997.90 9626.68 2425.68 9495.02 3849.20 5846.36 10304.58 7413.32(i) Undertakings 11953.01 10616.62 1410.53 8140.66 22.96 8580.79 3172.25 5191.85 3042.01 5789.40(ii) Co-Operatives 386.69 208.36 135.24 158.36 114.49 225.44 107.60 127.67 196.54 114.34(iii) Local Bodies 63.14 41.74 65.86 33.37 6.95 0.29 4.81 3.12 0.27 1.23(iv) Others 539.27 344.32 386.27 1294.29 2281.28 688.50 564.54 523.72 7065.76 1508.40
94

STATEMENT ‐ XXIVGrou‐wise Details of Staff Strength (` in Units)
State Z.P Total State Z.P Total State Z.P Total State Z.P Total State Z.P TotalGroup-A (*) 12083 7163 19246 12180 7119 19299 12210 7209 19419 13851 6612 20463 14565 13406 27971Group-B 18238 48274 66512 18495 39641 58136 25849 40153 66002 28368 39231 67599 19057 22169 41226Group-C 198213 238528 436741 218208 241704 459912 192303 226344 418647 203290 225943 429233 209919 265897 475816Group-D 53622 29533 83155 33665 17965 51630 48885 28866 77751 29064 19340 48404 28646 24910 53556Others 6522 17481 24003 6499 33722 40221 3581 33426 37007 377 32741 33118 1933 1619 3552Total: 288678 340979 629657 289047 340151 629198 282828 335998 618826 274950 323867 598817 274120 328001 602121
Vacant Posts 49781 51217 100998 54444 41307 95751 50509 39762 90271 52005 37030 89035 48818 40651 89469Working Strength 238897 289762 528659 234603 298844 533447 232319 296236 528555 222945 286837 509782 225302 287350 512652
(*) Group A includes AIS officers
Item2002-03 2003-04 2004-05 2005-06 2006-07
95

STATEMENT ‐ XXIVGrou‐wise Details of Staff Strength (` in Units)
Group-A (*)Group-BGroup-CGroup-DOthersTotal:
Vacant PostsWorking Strength
Item State Z.P Total State Z.P Total State Z.P Total State Z.P Total State Z.P Total15212 5264 20476 10517 1319 11836 11216 4009 15225 11079 5574 16653 10542 5515 1605715304 5383 20687 24056 9898 33954 22736 12334 35070 24098 21777 45875 27833 16516 44349
193110 295462 488572 233023 328274 561297 233603 326890 560493 237038 321201 558239 241794 327202 56899656797 38929 95726 30410 20503 50913 30448 24681 55129 30210 24534 54744 30956 22824 53780
4301 2557 6858 4048 0 4048 11405 0 11405 12311 0 12311 13060 0 13060284724 347595 632319 302054 359994 662048 309408 367914 677322 314736 373086 687822 324185 372057 696242
60645 47321 107966 76305 39602 115907 83179 73904 157083 80757 60919 141676 84895 57435 142330224079 300274 524353 225749 320392 546141 226229 294010 520239 233979 312167 546146 239290 314622 553912
2011-122010-112008-092007-08 2009-10
96

STATEMENT ‐ XXVExpenditure on Salaries (` in crores)
Plan Non-Plan Plan Non-Plan Plan Non-Plan Plan Non-Plan Plan Non-Plan A.REVENUE ACCOUNT State Sector 136.36 2177.49 128.82 2411.53 124.19 2390.96 114.45 2599.59 119.31 2691.28 ZP Sector 142.52 2431.94 166.11 2560.05 180.00 2677.51 196.64 2973.37 302.50 3417.84Total A.REVENUE ACCOUNT 278.88 4609.43 294.93 4971.58 304.19 5068.47 311.09 5572.96 421.81 6109.12
B.CAPITAL ACCOUNT State Sector 18.82 33.56 20.76 35.49 13.34 6.15 12.82 1.64 12.73 1.70
Total B.CAPITAL ACCOUNT 18.82 33.56 20.76 35.49 13.34 6.15 12.82 1.64 12.73 1.70Grand Total 297.70 4642.99 315.69 5007.07 317.53 5074.62 323.91 5574.60 434.54 6110.82Total Salary Expenditure (Plan+Non-Plan)
2002-03
6545.36
2006-07
4940.69 5322.76 5392.15 5898.51
2004-05 2005-062003-04
97

STATEMENT ‐ XXVExpenditure on Salaries (` in crores)
A.REVENUE ACCOUNT State Sector ZP Sector Total A.REVENUE ACCOUNT
B.CAPITAL ACCOUNT State Sector
Total B.CAPITAL ACCOUNTGrand TotalTotal Salary Expenditure (Plan+Non-Plan)
Plan Non-Plan Plan Non-Plan Plan Non-Plan Plan Non-Plan Plan Non-Plan
158.31 3564.99 250.48 3822.83 324.49 4070.24 412.14 4964.62 635.43 6468.67279.74 4377.55 407.23 5431.30 514.73 5371.48 620.98 6124.43 757.46 7061.23438.05 7942.54 657.71 9254.13 839.22 9441.72 1033.12 11089.05 1392.89 13529.90
14.58 2.11 15.84 2.09 13.21 2.23 14.59 2.62 16.53 2.63
14.58 2.11 15.84 2.09 13.21 2.23 14.59 2.62 16.53 2.63452.63 7944.65 673.55 9256.22 852.43 9443.95 1047.71 11091.67 1409.42 13532.53
2008-09
8397.28 9929.77
2007-08
14941.9512139.38
2010-11 RE
10296.38
2009-10 2011-12 BE
98

STATEMENT ‐ XXVIPensioners & Pension Liability
Year No of Pensioners (In Units) Expenditure (Rs.in Crore)2002-03 248880 1773.082003-04 263880 1900.542004-05 354222 2156.922005-06 419010 2236.792006-07 434100 2495.882007-08 450000 3295.942008-09 434100 2495.882009-10 426000 3408.322010-11 RE 426000 4297.022011-12 BE 441000 5500.00
99

STATEMENT ‐ XXVIIWays & Means Advance & Over Draft (` in crores)
Sl.No Item 1999-00 2000-01 2001-02 2002-03 2003-04 2004-05 2005-06 2006-07 2007-08 2008-09 2009-10
(i)Number of days on which minimum balance was maintained(a) Without obtaining any advance 361 365 325 195 187 304 365 365 361 365 365(b) By obtaining ways and means advance 4 - 40 170 179 61 - - 4 - -
(ii) Number of days on which overdraft was taken - - - 1 33 - - - - - -
(iii)
Number of days on which there was shortfall from the agreed minimum balance even after obtaining Ways and Means advances - - - - - - - - - - -Ways and Means Advances
(i) Advances taken during the year (gross) 79.93 - 735.88 4045.45 4623.92 1462.79 - - 78.13 - -(ii) Advances Outstanding at the end of the year - - - - - - - - - -(iii) Interest paid 0.02 - 0.91 5.22 7.94 1.20 - - 0.04 - -
Overdraft(i) Overdraft taken during the year (gross) - - - 47.84 757.72 - - - - - -(ii) Overdraft Outstanding at the end of the year - - - - - - - - - - -(iii) Interest paid - - - 0.01 0.90 - - - - - -
100

STATEMENT ‐ XXVIIIMisappropriation & Defaulcations
Sl.No Department No.of CasesAmount (Rs.in
Lakhs)1 Horticulture 7 41.202 Animal Husbandry & Veterinary Services 1 1.103 Commerce & Industries 8 20.184 Labour 7 13.925 Law & parlimentary Affairs 9 3.496 Education 6 1.917 Finance 3 5.428 Forest, Environment & Ecology 14 270.289 Health & Family Welfare 20 20.18
10 Home 4 86.5511 Information, Tourism & Youth Services 14 32.0412 Planning 1 1.0113 Public Works 27 239.9014 Water Resources 72 256.1215 Revenue 10 10.1816 Rural Development & Panchayat Raj 9 0.3717 Social Welfare 2 2.9418 Women & Child Development 3 0.88
TheState Government reported 217 cases of Misappropriation, defalcation etc., involving Government money amounting to Rs. 1007.67 lakhs upto the period 31st March 2009 on which final action is pending. Department - wise details are as follows.
101

STATEMENT ‐ XXIXDevelopmental & Non‐ Developmental Expenditure (` in Lakhs)
Sl.No Item 2002-03 2003-04 2004-05 2005-06 2006-07 2007-08 2008-09 2009-10 2010-11 RE 2011-12 BE
CONSOLIDATED FUND 2816731.49 3464837.17 3570914.84 3496369.24 4408459.70 4810922.37 5403881.98 6296351.19 7227701.70 8531875.701 REVENUE
(a) General Services 711212.29 903912.72 990024.47 1003582.24 1041942.11 1087178.22 1227557.34 1276233.86 1461357.71 1851287.51(b) Social Services 632625.38 696503.88 772274.84 889878.93 1093670.88 1312367.44 1587299.14 1911885.64 2303413.27 2487875.13(c) Economic Services 480241.37 465169.78 651051.72 794732.38 1044024.02 1145331.22 1113663.92 1318171.38 1585638.37 1729934.59(d) Grant-in-Aid 57370.72 62884.89 79834.09 115896.22 163905.65 192600.14 237408.94 247400.70 268514.12 434335.68
Total (1) 1881449.76 2128471.27 2493185.12 2804089.77 3343542.66 3737477.02 4165929.34 4753691.58 5618923.47 6503432.912 CAPITAL
(a) General Services 7585.29 12842.62 13621.35 21792.22 32094.02 33901.84 47536.38 48985.17 50250.00 46531.74(b) Social Services 29530.22 42721.57 48604.34 110529.97 129262.51 214767.65 255516.14 265067.74 226051.91 244378.30(c) Economic Services 256484.33 247375.02 405142.55 449870.57 692900.69 616224.31 683976.20 899615.41 922440.49 1084534.07
Total (2) 293599.84 302939.21 467368.24 582192.76 854257.22 864893.80 987028.72 1213668.32 1198742.40 1375444.113 LOAN
(a) General Services 0.00 0.00 0.00 0.00 0.00 0.00 0.00 0.00 0.00 0.00(b) Social Services 23002.86 25647.30 23880.28 14272.06 32583.72 59480.23 17333.70 80510.41 103500.00 169285.00(c) Economic Services 39754.59 75473.13 37262.14 15687.94 3138.99 16194.13 55800.66 17648.02 60235.83 37502.68
Total (3) 62757.45 101120.43 61142.42 29960.00 35722.71 75674.36 73134.36 98158.43 163735.83 206787.68G Inter-State Settlement 0.00 0.00 0.00 0.00 0.00 0.00 0.00 0.00 0.00 0.00H Transfer to Contigency Fund 0.00 0.00 0.00 0.00 0.00 0.00 0.00 0.00 0.00 0.00
Total (G+H) 0.00 0.00 0.00 0.00 0.00 0.00 0.00 0.00 0.00 0.004 PUBLIC DEBT
(a) Internal Debti) Ways & Means 404545.00 462392.00 146279.00 0.00 0.00 7813.00 0.00 0.00 0.00 100000.00ii) Overdraft 4784.44 75771.55 0.00 0.00 0.00 0.00 0.00 0.00 0.00 35000.00iii Others 28675.99 78041.66 62181.32 39336.18 101234.07 80207.78 131646.38 183787.20 192807.00 252160.00
Total 4(a) 438005.43 616205.21 208460.32 39336.18 101234.07 88020.78 131646.38 183787.20 192807.00 387160.00(b) GoI Loansi) Debt Swap 83102.00 201726.00 279417.00 0.00 0.00 0.00 0.00 0.00 0.00 0.00ii) Others 57817.01 114375.05 61341.74 41749.53 73703.04 44856.41 46143.18 47045.66 53493.00 59051.00
Total 4(b) 140919.01 316101.05 340758.74 41749.53 73703.04 44856.41 46143.18 47045.66 53493.00 59051.00Total (4) = (a) + (b) 578924.44 932306.26 549219.06 81085.71 174937.11 132877.19 177789.56 230832.86 246300.00 446211.00
5 Development Expenditure 1519009.47 1615775.57 2018049.96 2390868.07 3159486.46 3556965.12 3950998.70 4740299.30 5469793.99 6187845.45[1+2+3-1a-2a-3a]
6 Non-Dev Expenditure 805290.58 1109172.05 1127168.88 1106460.17 1248973.24 1246144.25 1452883.28 1556051.89 1757907.71 2209030.251a+2a+3a+4-[4(a)(i)+4(a)(ii)+4(b)(i)]
7 Balance 492431.44 739889.55 425696.00 0.00 0.00 7813.00 0.00 0.00 0.00 135000.004(a)(i)+4(a)(ii)+4(b)(i) + (G)
8 CF Verificaton (5+6+7) 2816731.49 3464837.17 3570914.84 3497328.24 4408459.70 4810922.37 5403881.98 6296351.19 7227701.70 8531875.70
102