Government of Bihar - AMRUT
115
BIHAR STATE ANNUAL ACTION PLAN (Remaining Years of Mission Period) FOR PROPOSED SCHEMES UNDER AMRUT Urban Development & Housing Department Government of Bihar
Transcript of Government of Bihar - AMRUT

BIHAR STATE ANNUAL ACTION PLAN (Remaining Years of Mission Period)
FOR PROPOSED SCHEMES UNDER AMRUT
Urban Development & Housing Department Government of Bihar

Bihar State Annual Action Plan under AMRUT
For Remaining Years of Mission Period
Urban Development & Housing Department Page 1
TABLE OF CONTENTS
S.No. Contents Page No.
1 Checklist – Consolidated State Annual Action Plan of all ULBs to be sent for Assessment by MoUD
2-4
2 Minutes of State High Powered Steering Committee (SHPSC) Meeting 5
3 Project Background & Summary 6-7
4 State Scenario 7-10
5 SAAP TABLES 11-30
6 REVIEW OF SAAPs
Project Progress 31-40
Service Levels 40-55
Capacity Building 56-64
Reforms 65-69
Use of A&OE 69-70
Funds Flow 71-78
8 State Annual Action Plan (SAAP) for the remaining years of Mission Period 78-113

Bihar State Annual Action Plan under AMRUT
For Remaining Years of Mission Period
Urban Development & Housing Department Page 2
Table6.2: Checklist- Consolidated State Annua lAction Plan of all ULBs to be sent for Assessment by MoUD
Sl.No. Points of Consideration Yes/No Give Details
1 Have all the Cities prepared SLIP as per
the suggested approach? Yes
27 AMRUT cities have given priority to either water supply or drainage. While doing the prioritization, complementarity of these two basic services has been the key consideration. Development of one park every year (if land is available) has been made mandatory to each ULB.
2 Has the SAAP prioritized proposed
investments across cities? Yes
ULB-wise allocation has been done in line with gaps in service levels in water supply, sewerage and drainage. Factors like completing ongoing projects in water supply and availability of land for infrastructure are the key deciding factors.
3
Is the indicator wise summary of
improvements proposed (both investments
and management improvements) by State
in place?
Yes
Summary of indicator-wise improvement proposed in water supply, sewerage, drainage and parks has been provided from the perspective of investment and O&M.
4
Have all the cities under Mission
identified/done baseline assessments of
service coverage indicators?
Yes
While deciding on the priority projects, 100% coverage of households with potable water has been the first priority. The presence of recently completed DPRs for water supply, sewerage, storm water drainage has also been considered – all these documents include baselines as does the City Sanitation Plans that have been prepared for 25 of the 27 AMRUT cities in the state.

Bihar State Annual Action Plan under AMRUT
For Remaining Years of Mission Period
Urban Development & Housing Department Page 3
5
Are SAAPs addressing an approach
towards meeting Service Level Benchmarks
agreed by Ministry for each Sector?
Yes Targets defined in the SAAP ensure that there is incremental progress towards achievement of the Service Level Benchmarks especially for water supply.
6
Is the investment proposed commensurate
to the level of improvement envisaged in
the indicator?
Yes Proposed investments are commensurate with envisaged improvements in service levels.
7 Are State Share and ULBs share in line
with proposed Mission approach? Yes
The State and ULB shares are in line with guidelines specified under the programme for ULBs with population of <10 lakhs and >10 lakhs.
8
Is there a need for additional resources and have state considered raising additional resources (State programs, aided projects, additional devolution to cities,14thFinance Commission, external sources)?
Yes
Bihar is considering raising additional resources through the 14thth Finance Commission, ADB, BRICS, JBIC, KfW, and State Programme.
9
Does State Annual Action Plan verify that
the cities have undertaken financial
projections to identify revenue requirements
for O&M and repayments?
Yes
27 of the AMRUT cities are successfully implementing municipal financial reforms and have shown remarkable improvement in own revenue base. Financial projections and targets for own revenue are defined. Additionally, ULBs will also actively pursue imposition of user charges and explore other options for enhanced resources for O&M.
10
Has the State Annual Action Plan
considered the resource mobilization
capacity of each ULB to ensure that ULBs
share can be mobilized?
Yes The SAAP has taken this fact into consideration.
Bihar State Annual Action Plan under AMRUT
For Remaining Years of Mission Period
Urban Development & Housing Department Page 4
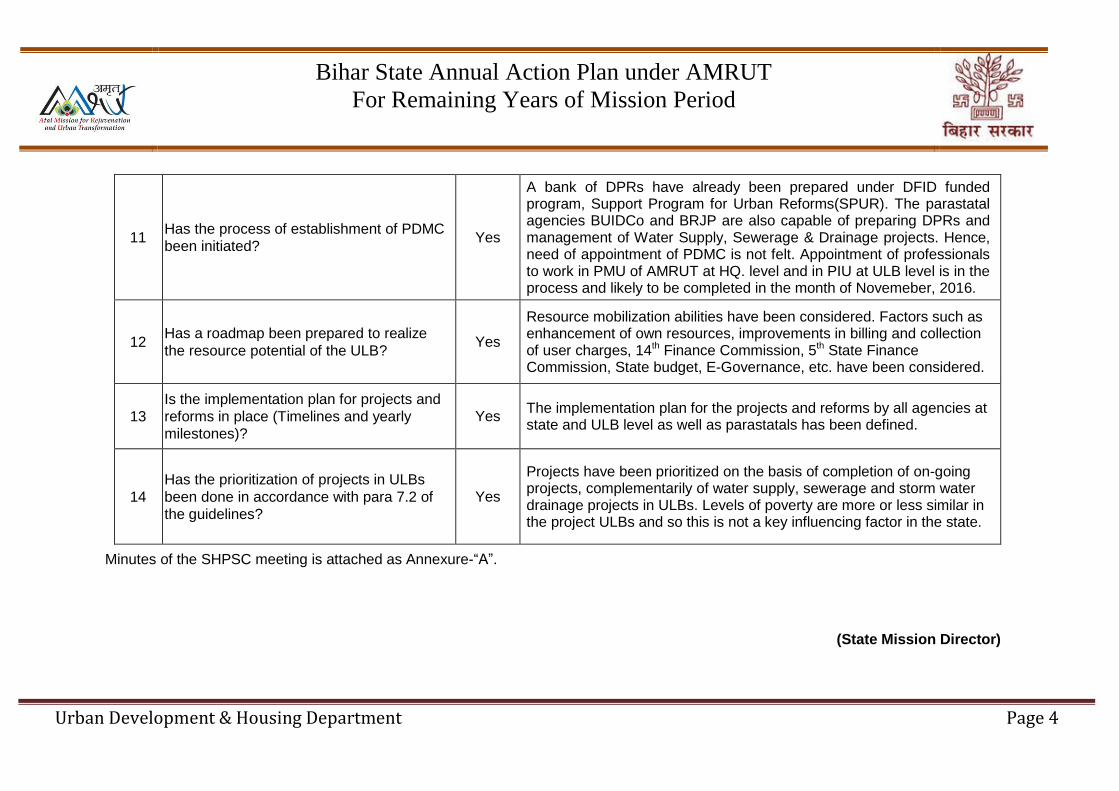
11 Has the process of establishment of PDMC
been initiated? Yes
A bank of DPRs have already been prepared under DFID funded program, Support Program for Urban Reforms(SPUR). The parastatal agencies BUIDCo and BRJP are also capable of preparing DPRs and management of Water Supply, Sewerage & Drainage projects. Hence, need of appointment of PDMC is not felt. Appointment of professionals to work in PMU of AMRUT at HQ. level and in PIU at ULB level is in the process and likely to be completed in the month of Novemeber, 2016.
12 Has a roadmap been prepared to realize
the resource potential of the ULB? Yes
Resource mobilization abilities have been considered. Factors such as enhancement of own resources, improvements in billing and collection of user charges, 14th Finance Commission, 5th State Finance Commission, State budget, E-Governance, etc. have been considered.
13
Is the implementation plan for projects and
reforms in place (Timelines and yearly
milestones)?
Yes The implementation plan for the projects and reforms by all agencies at state and ULB level as well as parastatals has been defined.
14
Has the prioritization of projects in ULBs
been done in accordance with para 7.2 of
the guidelines?
Yes
Projects have been prioritized on the basis of completion of on-going projects, complementarily of water supply, sewerage and storm water drainage projects in ULBs. Levels of poverty are more or less similar in the project ULBs and so this is not a key influencing factor in the state.
Minutes of the SHPSC meeting is attached as Annexure-“A”.
(State Mission Director)
Bihar State Annual Action Plan under AMRUT
For Remaining Years of Mission Period
Urban Development & Housing Department Page 5
Minutes of State High Powered Steering Committee (SHPSC) Meeting
Bihar State Annual Action Plan under AMRUT
For Remaining Years of Mission Period
Urban Development & Housing Department Page 6
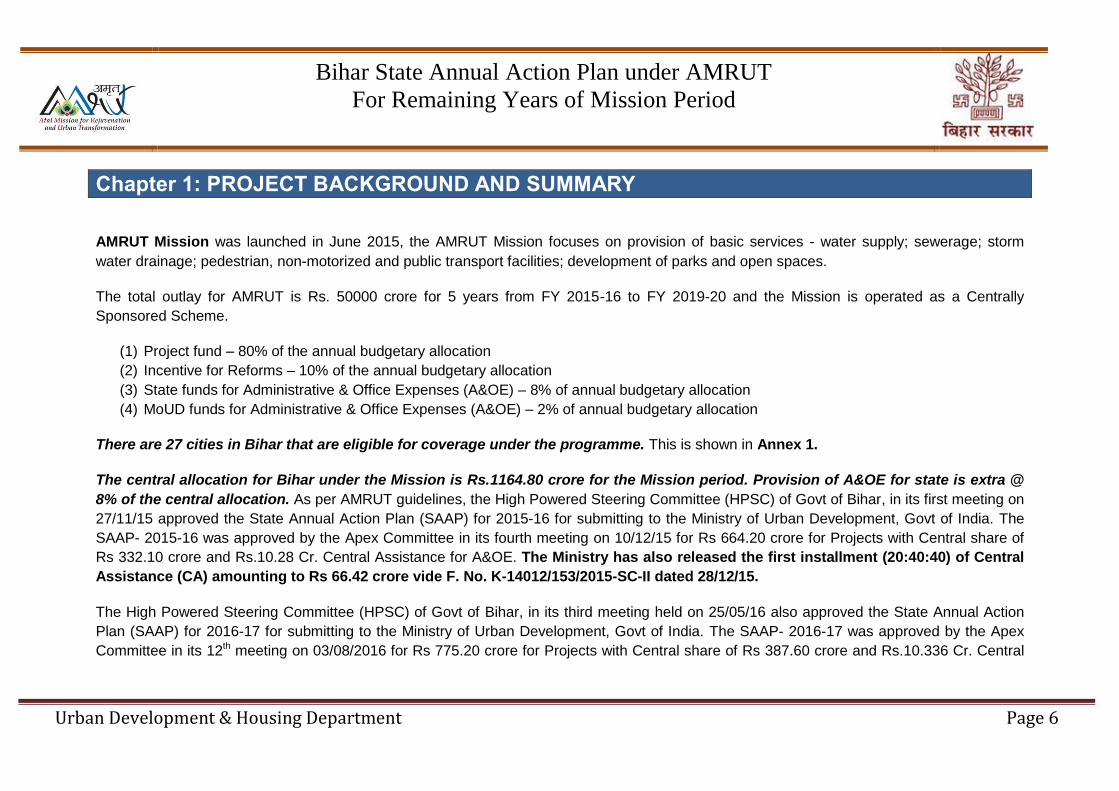
Chapter 1: PROJECT BACKGROUND AND SUMMARY
AMRUT Mission was launched in June 2015, the AMRUT Mission focuses on provision of basic services - water supply; sewerage; storm
water drainage; pedestrian, non-motorized and public transport facilities; development of parks and open spaces.
The total outlay for AMRUT is Rs. 50000 crore for 5 years from FY 2015-16 to FY 2019-20 and the Mission is operated as a Centrally
Sponsored Scheme.
(1) Project fund – 80% of the annual budgetary allocation
(2) Incentive for Reforms – 10% of the annual budgetary allocation
(3) State funds for Administrative & Office Expenses (A&OE) – 8% of annual budgetary allocation
(4) MoUD funds for Administrative & Office Expenses (A&OE) – 2% of annual budgetary allocation
There are 27 cities in Bihar that are eligible for coverage under the programme. This is shown in Annex 1.
The central allocation for Bihar under the Mission is Rs.1164.80 crore for the Mission period. Provision of A&OE for state is extra @
8% of the central allocation. As per AMRUT guidelines, the High Powered Steering Committee (HPSC) of Govt of Bihar, in its first meeting on
27/11/15 approved the State Annual Action Plan (SAAP) for 2015-16 for submitting to the Ministry of Urban Development, Govt of India. The
SAAP- 2015-16 was approved by the Apex Committee in its fourth meeting on 10/12/15 for Rs 664.20 crore for Projects with Central share of
Rs 332.10 crore and Rs.10.28 Cr. Central Assistance for A&OE. The Ministry has also released the first installment (20:40:40) of Central
Assistance (CA) amounting to Rs 66.42 crore vide F. No. K-14012/153/2015-SC-II dated 28/12/15.
The High Powered Steering Committee (HPSC) of Govt of Bihar, in its third meeting held on 25/05/16 also approved the State Annual Action
Plan (SAAP) for 2016-17 for submitting to the Ministry of Urban Development, Govt of India. The SAAP- 2016-17 was approved by the Apex
Committee in its 12th meeting on 03/08/2016 for Rs 775.20 crore for Projects with Central share of Rs 387.60 crore and Rs.10.336 Cr. Central

Bihar State Annual Action Plan under AMRUT
For Remaining Years of Mission Period
Urban Development & Housing Department Page 7
Assistance for A&OE. The Ministry has also released the first installment (20:40:40) of Central Assistance (CA) amounting to Rs 77.52
crore vide F. No. K-15012/04/2015-SC-IV/AMRUT-II dated 7th April 2016.
The allocation in respect of Govt. of Bihar for which SAAP for remaining years of Mission period is to be submitted is amounting to
Rs 445.10 crore for Projects. The High Powered Steering Committee (HPSC) of Govt of Bihar, in its fifth meeting held on 26/10/16 also
approved the State Annual Action Plan (SAAP) for the remaining year of Mission Period for submitting to the Ministry of Urban Development,
Govt of India.
STATE SCENARIO: BIHAR
Introduction
Bihar is located in Eastern India and is the thirteenth largest
state in India. With a population of 10,40,99,452, Bihar
accounts for 8.60% of India’s total population. Bihar is
predominantly a rural state with only 11.29% of the state’s
population classified as urban. Bihar has 141 Urban Local
Bodies of which 11 are classified as Nagar Nigams (Municipal
Corporation), 42 are classified as Nagar Parishads (Municipal
Councils) and 87 are classified as Nagar Panchayats
(Municipal Panchayats).
AMRUT Towns
Bihar State Annual Action Plan under AMRUT
For Remaining Years of Mission Period
Urban Development & Housing Department Page 8
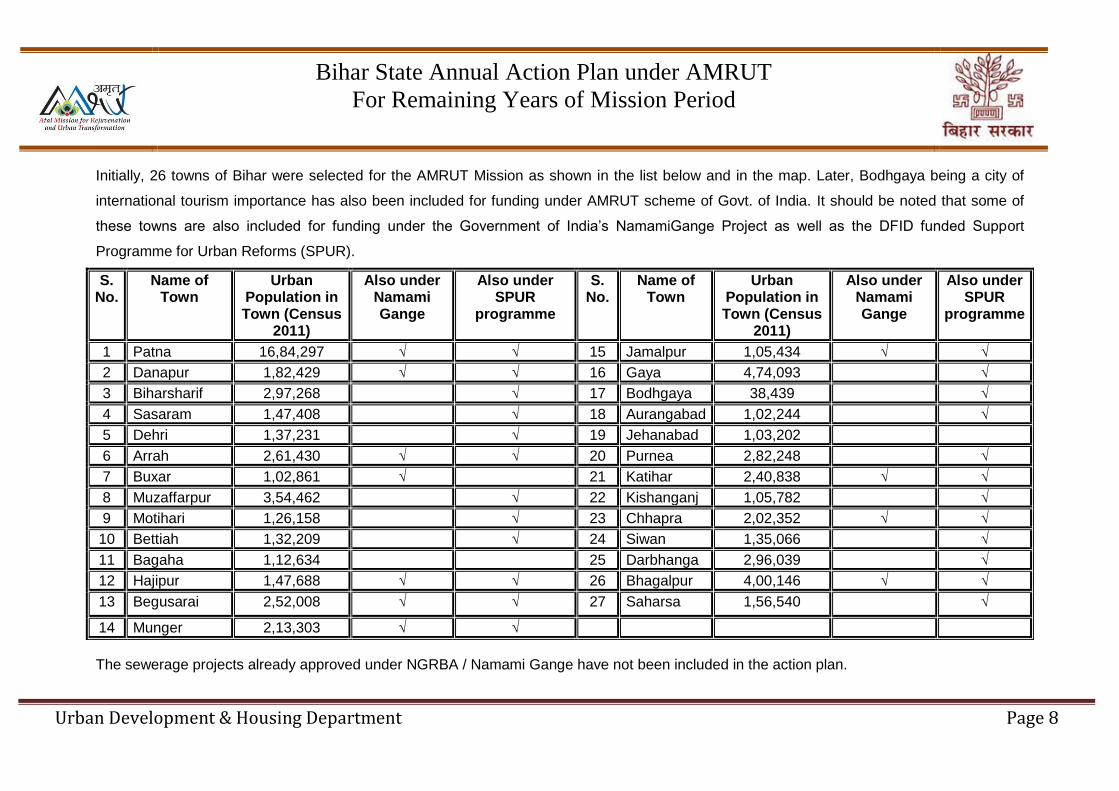
Initially, 26 towns of Bihar were selected for the AMRUT Mission as shown in the list below and in the map. Later, Bodhgaya being a city of
international tourism importance has also been included for funding under AMRUT scheme of Govt. of India. It should be noted that some of
these towns are also included for funding under the Government of India’s NamamiGange Project as well as the DFID funded Support
Programme for Urban Reforms (SPUR).
S. No.
Name of Town
Urban Population in Town (Census
2011)
Also under Namami Gange
Also under SPUR
programme
S. No.
Name of Town
Urban Population in Town (Census
2011)
Also under Namami Gange
Also under SPUR
programme
1 Patna 16,84,297 √ √ 15 Jamalpur 1,05,434 √ √
2 Danapur 1,82,429 √ √ 16 Gaya 4,74,093 √
3 Biharsharif 2,97,268 √ 17 Bodhgaya 38,439 √
4 Sasaram 1,47,408 √ 18 Aurangabad 1,02,244 √
5 Dehri 1,37,231 √ 19 Jehanabad 1,03,202
6 Arrah 2,61,430 √ √ 20 Purnea 2,82,248 √
7 Buxar 1,02,861 √ 21 Katihar 2,40,838 √ √
8 Muzaffarpur 3,54,462 √ 22 Kishanganj 1,05,782 √
9 Motihari 1,26,158 √ 23 Chhapra 2,02,352 √ √
10 Bettiah 1,32,209 √ 24 Siwan 1,35,066 √
11 Bagaha 1,12,634 25 Darbhanga 2,96,039 √
12 Hajipur 1,47,688 √ √ 26 Bhagalpur 4,00,146 √ √
13 Begusarai 2,52,008 √ √ 27 Saharsa 1,56,540 √
14 Munger 2,13,303 √ √
The sewerage projects already approved under NGRBA / Namami Gange have not been included in the action plan.
Bihar State Annual Action Plan under AMRUT
For Remaining Years of Mission Period
Urban Development & Housing Department Page 9
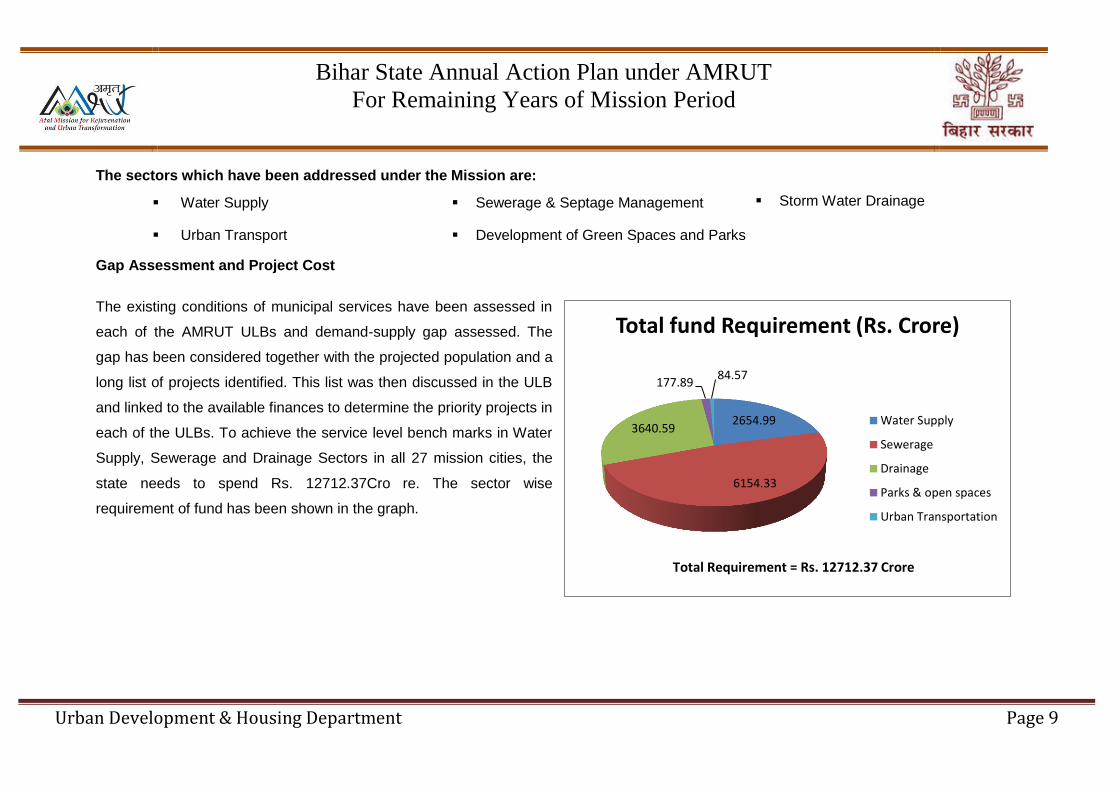
The sectors which have been addressed under the Mission are:
Water Supply Sewerage & Septage Management Storm Water Drainage
Urban Transport Development of Green Spaces and Parks
Gap Assessment and Project Cost
The existing conditions of municipal services have been assessed in
each of the AMRUT ULBs and demand-supply gap assessed. The
gap has been considered together with the projected population and a
long list of projects identified. This list was then discussed in the ULB
and linked to the available finances to determine the priority projects in
each of the ULBs. To achieve the service level bench marks in Water
Supply, Sewerage and Drainage Sectors in all 27 mission cities, the
state needs to spend Rs. 12712.37Cro re. The sector wise
requirement of fund has been shown in the graph.
2654.99
6154.33
3640.59
177.89 84.57
Total fund Requirement (Rs. Crore)
Water Supply
Sewerage
Drainage
Parks & open spaces
Urban Transportation
Total Requirement = Rs. 12712.37 Crore

Bihar State Annual Action Plan under AMRUT
For Remaining Years of Mission Period
Urban Development & Housing Department Page 10
However, there has been limited fund with Govt. of India, with the State
and with the ULBs for improvement of Infrastructure services. Therefore,
priority projects have been divided in to phases for implementation
under AMRUT Mission period. The fund requirement under the Mission
period is Rs. 2469.78 Cr. including Rs. 120.69 Crore in convergence
under State Plan Water Supply Schemes which has been shown in the
graph below.
2184.25
37.75 182.34 63.44 0.00 Water Supply
Fecal SludgeManagement
Drainage
Parks & open spaces
Urban Transportation
Total Requirement - Rs. 2467.78 Crore
Project Investment During Mission Period (Rs. in Crore)
Bihar State Annual Action Plan under AMRUT
For Remaining Years of Mission Period
Urban Development & Housing Department Page 11
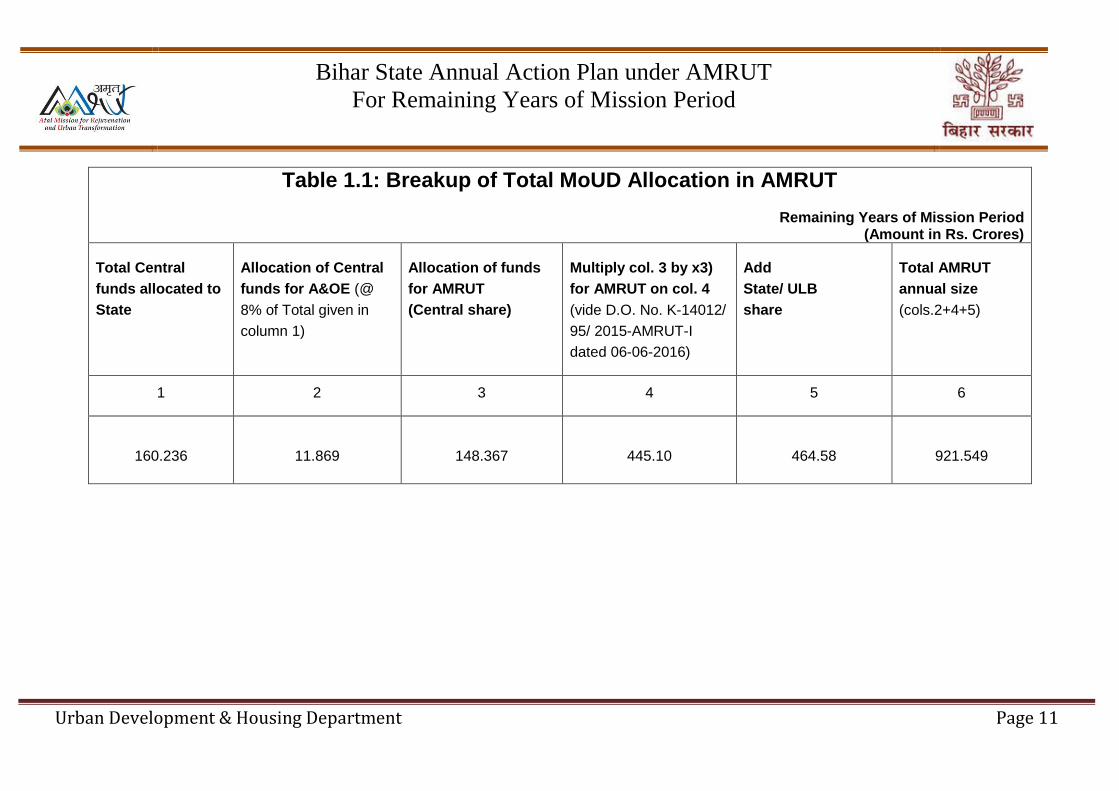
Table 1.1: Breakup of Total MoUD Allocation in AMRUT
Remaining Years of Mission Period (Amount in Rs. Crores)
Total Central
funds allocated to
State
Allocation of Central
funds for A&OE (@
8% of Total given in
column 1)
Allocation of funds
for AMRUT
(Central share)
Multiply col. 3 by x3)
for AMRUT on col. 4
(vide D.O. No. K-14012/
95/ 2015-AMRUT-I
dated 06-06-2016)
Add
State/ ULB
share
Total AMRUT
annual size
(cols.2+4+5)
1 2 3 4 5 6
160.236
11.869
148.367
445.10
464.58
921.549

Bihar State Annual Action Plan under AMRUT
For Remaining Years of Mission Period
Urban Development & Housing Department Page 12
Table 1.2.1: Abstract-Sector Wise Proposed Total Project
Fund and Sharing Pattern For Remaining Years of Mission Period
(Amount in Rs. Crores)
Sl. No Sector No. of
Projects Centre State ULB Convergence Others Total
1 Water Supply 17 394.20 236.52 157.68 120.69 0.00 909.09
2 Sewerage (FSM) 1 18.87 11.32 7.55 0.00 0.00 37.74
3 Storm Water Drainage 1 19.48 27.27 11.69 0.00 0.00 58.44
4 Others (Parks & Open spaces) 20 12.55 7.53 5.02 0.00 0.00 25.10
5 A & O.E @ 8% of Central Grant 11.87 11.87
6 Grand Total 39 456.97 282.64 181.94 120.69 0.00 1042.24

Bihar State Annual Action Plan under AMRUT
For Remaining Years of Mission Period
Urban Development & Housing Department Page 13
Table 1.2.2: Abstract-Break-up of Total Fund Sharing Pattern
For Remaining Years of Mission Period
(Amount in Rs. Crores)
Sl.No. Sector
Centre State ULB
Convergence Others Total Mission 14th FC Others Total 14th FC Others Total
1 Water Supply 394.20 0.00 236.52 236.52 2.50 155.18 157.68 120.69 0.00 909.09
2 Sewerage (FSM)
18.87 0.00 11.32 11.32 6.70 0.85 7.55 0.00 0.00 37.74
3 Storm Water Drainage
19.48 0.00 27.27 27.27 11.69 0.00 11.69 0.00 0.00 58.44
4 Others (Parks & Open spaces)
12.55 0.00 7.53 7.53 4.70 0.32 5.02 0.00 0.00 25.10
5 A & O.E @ 8% of Central Grant
11.87 11.87
6 Grand Total 456.97 0.00 282.64 282.64 25.59 156.35 181.94 120.69 0.00 1042.24

Bihar State Annual Action Plan under AMRUT
For Remaining Years of Mission Period
Urban Development & Housing Department Page 14
Table 1.3: Abstract-Use of Funds on Projects: On Going and New (Amount in Rs. Crores)
Sl No
Sector
To
tal P
roje
ct
Inve
stm
en
t
Committed Expenditure (if any) from Previous year 2015-16
Proposed Spending during Current Financial year 2016-17
Balance Carry Forward for Next Financial Years Till 2020
Ce
ntr
e
State ULB
Ce
ntr
e State ULB
Ce
ntr
e State ULB
14th
FC
Oth
ers
To
tal
14th
FC
Oth
ers
To
tal
14th
FC
Oth
ers
To
tal
14
th F
C
Oth
ers
To
tal
14th
FC
Oth
ers
To
tal
14th
FC
Oth
ers
To
tal
1 Water Supply
2063.56 323.67 0 194.20 194.20 67.57 61.90 129.47 313.91 0 188.35 188.35 34.26 91.30 125.56 394.20 0 236.52 236.52 2.50 155.18 157.68
2 Sewerage (FSM)
37.74 0.00 0 0.00 0.00 0.00 0.00 0.00 0.00 0 0.00 0.00 0.00 0.00 0.00 18.87 0 11.32 11.32 6.70 0.85 7.55
3 Drainage 182.34 0.00 0 0.00 0.00 0.00 0.00 0.00 61.95 0 37.17 37.17 14.82 9.96 24.78 19.48 0 27.27 27.27 11.69 0.00 11.69
4
Others (Parks & Open spaces)
65.44 8.43 0 5.06 5.06 3.37 0.00 3.37 11.74 0 7.04 7.04 4.70 0.00 4.70 12.55 0 7.53 7.53 4.70 0.32 5.02
5 Urban Transport
0.00 0.00 0 0.00 0.00 0.00 0.00 0.00 0.00 0.00 0.00 0.00 0.00 0.00 0.00 0 0.00 0.00 0.00 0.00 0.00
6 Total 2349.08 332.10 0 199.26 199.26 70.94 61.90 132.84 387.60 0 232.56 232.56 53.78 101.26 155.04 445.10 0 282.64 282.64 25.59 156.35 181.94

Bihar State Annual Action Plan under AMRUT
For Remaining Years of Mission Period
Urban Development & Housing Department Page 15
Table1.4: Abstract-Plan for Achieving Service Level Benchmarks Mission Period
(Amount in Rs. Crores)
Proposed Priority Projects
Total Project
Cost Indicator1
Baseline2
Annual Targets based on Master Plan (Increment from the Baseline Value)
FY2016 FY FY FY FY
H1 H2 2017 2018 2019 2020
Water Supply
1. Biharshariff 168.57
1. Household level coverage of direct water supply connections
55.30% 70% 80% 80% 90% 100% 100%
2. Per capita quantum of water supplied
105lpcd 105 lpcd
105 lpcd
105 lpcd
120 lpcd
135lpcd 135lpcd
3. Quality of water supplied 20% 20% 30% 80% 100% 100% 100%
2. Sasaram 110.54
1. Household level coverage of direct water supply connections
30% 30% 30% 50% 80% 90% 100%
2. Per capita quantum of water supplied
25lpcd 25lpcd 25lpcd 70lpcd 100 lpcd
120lpcd 135lpcd
3. Quality of water supplied 80% 80% 80% 100% 100% 100% 100%
3. Dehri 102.80
1. Household level coverage of direct water supply connections
7.40% 7.40% 20% 40% 60% 90% 100%
2. Per capita quantum of water supplied
18 lpcd 18 lpcd 30 lpcd 50 lpcd 70 lpcd 100 lpcd 135 lpcd

Bihar State Annual Action Plan under AMRUT
For Remaining Years of Mission Period
Urban Development & Housing Department Page 16
3. Quality of water supplied 80% 80% 80% 80% 90% 100% 100%
4. Arrah 135.73
1. Household level coverage of direct water supply connections
20% 20% 20% 50% 80% 90% 100%
2. Per capita quantum of water supplied
30lpcd 30lpcd 30lpcd 70lpcd 100 lpcd
120lpcd 135lpcd
3. Quality of water supplied 80% 80% 80% 80% 80% 100% 100%
5. Buxar 76.91
1. Household level coverage of direct water supply connections
60% 60% 80% 90% 100% 100% 100%
2. Per capita quantum of water supplied
51lpcd 100 lpcd
100 lpcd
120 lpcd
135 lpcd
135lpcd 135lpcd
3. Quality of water supplied 100% 100% 100% 100% 100% 100% 100%
6. Motihari 114.07
1. Household level coverage of direct water supply connections
21.80% 22% 40% 50% 80% 90% 100%
2. Per capita quantum of water supplied
19lpcd 19lpcd 45lpcd 75lpcd 100 lpcd
120lpcd 135lpcd
3. Quality of water supplied 70% 70% 70% 100% 100% 100% 100%
7. Bettiah 127.88
1. Household level coverage of direct water supply connections
15.70% 15.70% 40% 60% 80% 100% 100%
2. Per capita quantum of water supplied
40 lpcd 40 lpcd 60 lpcd 80 lpcd 100 lpcd
135 lpcd 135 lpcd
3. Quality of water supplied 100% 100% 100% 100% 100% 100% 100%
8. Bagaha 184.52 1. Household level coverage of direct water supply connections
12% 12% 12% 50% 80% 90% 100%

Bihar State Annual Action Plan under AMRUT
For Remaining Years of Mission Period
Urban Development & Housing Department Page 17
2. Per capita quantum of water supplied
21lpcd 21lpcd 21lpcd 75lpcd 100 lpcd
120lpcd 135lpcd
3. Quality of water supplied 70% 70% 70% 100% 100% 100% 100%
9. Hajipur 127.46
1. Household level coverage of direct water supply connections
27% 27% 50% 70% 80% 90% 100%
2. Per capita quantum of water supplied
52lpcd 52 lpcd 100 lpcd
110 lpcd
120 lpcd
130 lpcd 135lpcd
3. Quality of water supplied 100% 100% 100% 100% 100% 100% 100%
10. Begusarai 121.37
1. Household level coverage of direct water supply connections
22% 22% 50% 80% 100% 100% 100%
2. Per capita quantum of water supplied
45lpcd 45lpcd 75lpcd 100 lpcd
135 lpcd
135 lpcd 135lpcd
3. Quality of water supplied 20% 20% 100% 100% 100% 100% 100%
11. Munger 59.31
1. Household level coverage of direct water supply connections
46% 46% 80% 80% 90% 100% 100%
2. Per capita quantum of water supplied
57lpcd 100 lpcd
135 lpcd
135 lpcd
135 lpcd
135lpcd 135lpcd
3. Quality of water supplied 80% 80% 100% 100% 100% 100% 100%
12. Jamalpur 28.00
1. Household level coverage of direct water supply connections
60% 60% 70% 90% 100% 100% 100%
2. Per capita quantum of water supplied
80lpcd 80lpcd 100 lpcd
135 lpcd
135 lpcd
135lpcd 135lpcd
3. Quality of water supplied 70% 70% 80% 100% 100% 100% 100%

Bihar State Annual Action Plan under AMRUT
For Remaining Years of Mission Period
Urban Development & Housing Department Page 18
13.Aurangabad 119.57
1. Household level coverage of direct water supply connections
10% 10% 10% 50% 80% 90% 100%
2. Per capita quantum of water supplied
45lpcd 45lpcd 45lpcd 75lpcd 100 lpcd
120lpcd 135lpcd
3. Quality of water supplied 70% 70% 70% 100% 100% 100% 100%
14. Jehanabad 69.79
1. Household level coverage of direct water supply connections
10.40% 10.40% 10.40% 50% 80% 90% 100%
2. Per capita quantum of water supplied
28lpcd 28lpcd 28lpcd 40lpcd 90lpcd 100lpcd 135lpcd
3. Quality of water supplied 30% 30% 30% 80% 90% 100% 100%
15. Purnea 78.97
1. Household level coverage of direct water supply connections
60% 60% 70% 90% 100% 100% 100%
2. Per capita quantum of water supplied
65lpcd 65lpcd 75lpcd 100 lpcd
100 lpcd
135lpcd 135lpcd
3. Quality of water supplied 70% 70% 80% 100% 100% 100% 100%
16. Katihar 119.76
1. Household level coverage of direct water supply connections
30% 30% 30% 70% 80% 90% 100%
2. Per capita quantum of water supplied
45lpcd 45lpcd 45lpcd 100 lpcd
110 lpcd
120lpcd 135lpcd
3. Quality of water supplied 50% 50% 50% 100% 100% 100% 100%
17. Kishanganj 75.45 1. Household level coverage of direct water supply connections
3.20% 10% 10% 50% 80% 90% 100%

Bihar State Annual Action Plan under AMRUT
For Remaining Years of Mission Period
Urban Development & Housing Department Page 19
2. Per capita quantum of water supplied
32lpcd 45lpcd 50lpcd 75lpcd 100 lpcd
120lpcd 135lpcd
3. Quality of water supplied 80% 80% 80% 100% 100% 100% 100%
18. Chhapra 125.02
1. Household level coverage of direct water supply connections
45% 60% 75% 80% 90% 100% 100%
2. Per capita quantum of water supplied
57 lpcd 100 lpcd
100 lpcd
110 lpcd
120 lpcd
135lpcd 135lpcd
3. Quality of water supplied 100% 100% 100% 100% 100% 100% 100%
19. Siwan 80.33
1. Household level coverage of direct water supply connections
20% 20% 20% 80% 80% 90% 100%
2. Per capita quantum of water supplied
35lpcd 35lpcd 35lpcd 100 lpcd
110 lpcd
120lpcd 135lpcd
3. Quality of water supplied 80% 80% 80% 80% 100% 100% 100%
20. Darbhanga 68.00
1. Household level coverage of direct water supply connections
15% 50% 70% 100% 100% 100% 100%
2. Per capita quantum of water supplied
39lpcd 39lpcd 100 lpcd
135 lpcd
135 lpcd
135lpcd 135lpcd
3. Quality of water supplied 85% 85% 85% 100% 100% 100% 100%
21. Saharsa 90.20
1. Household level coverage of direct water supply connections
10% 10% 25% 50% 70% 90% 100%
2. Per capita quantum of water supplied
45 lpcd 45 lpcd 60 lpcd 80 lpcd 100 lpcd
120 lpcd 135 lpcd
3. Quality of water supplied 20% 20% 40% 60% 80% 100% 100%
Bihar State Annual Action Plan under AMRUT
For Remaining Years of Mission Period
Urban Development & Housing Department Page 20
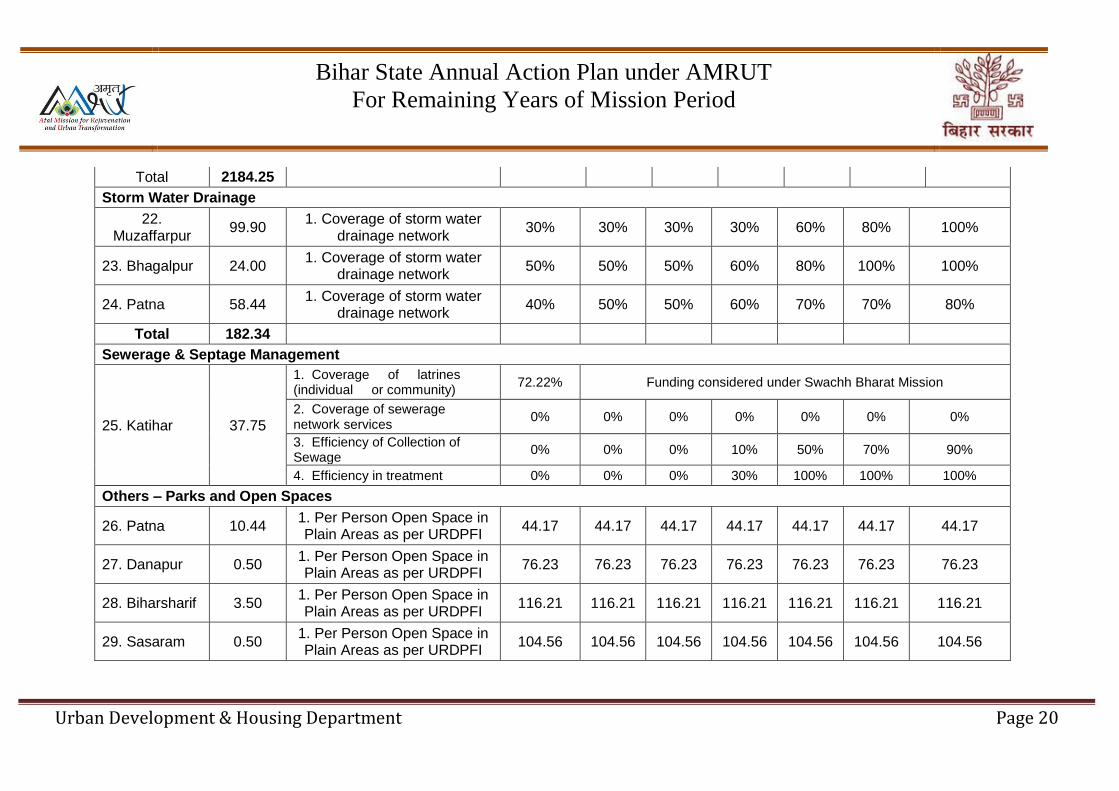
Total 2184.25
Storm Water Drainage
22. Muzaffarpur
99.90 1. Coverage of storm water
drainage network 30% 30% 30% 30% 60% 80% 100%
23. Bhagalpur 24.00 1. Coverage of storm water
drainage network 50% 50% 50% 60% 80% 100% 100%
24. Patna 58.44 1. Coverage of storm water
drainage network 40% 50% 50% 60% 70% 70% 80%
Total 182.34
Sewerage & Septage Management
25. Katihar 37.75
1. Coverage of latrines (individual or community)
72.22% Funding considered under Swachh Bharat Mission
2. Coverage of sewerage network services
0% 0% 0% 0% 0% 0% 0%
3. Efficiency of Collection of Sewage
0% 0% 0% 10% 50% 70% 90%
4. Efficiency in treatment 0% 0% 0% 30% 100% 100% 100%
Others – Parks and Open Spaces
26. Patna 10.44 1. Per Person Open Space in Plain Areas as per URDPFI
44.17 44.17 44.17 44.17 44.17 44.17 44.17
27. Danapur 0.50 1. Per Person Open Space in Plain Areas as per URDPFI
76.23 76.23 76.23 76.23 76.23 76.23 76.23
28. Biharsharif 3.50 1. Per Person Open Space in Plain Areas as per URDPFI
116.21 116.21 116.21 116.21 116.21 116.21 116.21
29. Sasaram 0.50 1. Per Person Open Space in Plain Areas as per URDPFI
104.56 104.56 104.56 104.56 104.56 104.56 104.56

Bihar State Annual Action Plan under AMRUT
For Remaining Years of Mission Period
Urban Development & Housing Department Page 21
30. Dehri 1.00 1. Per Person Open Space
in Plain Areas as per URDPFI 75.37 75.37 75.37 75.37 75.37 75.37 75.37
31. Ara 2.00 1. Per Person Open Space in
Plain Areas as per URDPFI 104.21 104.21 104.21 104.21 104.21 104.21 104.21
32. Buxar 0.50 1. Per Person Open Space in Plain Areas as per URDPFI
99.45 99.45 99.45 99.45 99.45 99.45 99.45
33. Muzaffarpur
5.10 1. Per Person Open Space in Plain Areas as per URDPFI
58.37 58.37 58.37 58.37 58.37 58.37 58.37
34. Motihari 2.12 1. Per Person Open Space in Plain Areas as per URDPFI
121.36 121.36 121.36 121.36 121.36 121.36 121.36
35. Bettiah 1.50 1. Per Person Open Space
in Plain Areas as per URDPFI 66.86 66.86 66.86 66.86 66.86 66.86 66.86
36. Bagha 0.50 1. Per Person Open Space in Plain Areas as per URDPFI
78.24 78.24 78.24 78.24 78.24 78.24 78.24
37.Hajipur 2.00 1. Per Person Open Space in Plain Areas as per URDPFI
110.7 110.7 110.7 110.7 110.7 110.7 110.7
38. Begusrai 1.94 1. Per Person Open Space in Plain Areas as per URDPFI
177.17 177.17 177.17 177.17 177.17 177.17 177.17
39. Munger 3.50 1. Per Person Open Space in Plain Areas as per URDPFI
68.92 68.92 68.92 68.92 68.92 68.92 68.92
40. Jamalpur 1.00 1. Per Person Open Space in Plain Areas as per URDPFI
58.23 58.23 58.23 58.23 58.23 58.23 58.23
41. Gaya 4.32 1. Per Person Open Space in Plain Areas as per URDPFI
90.1 90.1 90.1 90.1 90.1 90.1 90.1
42. Bodhgaya 2.50 1. Per Person Open Space in Plain Areas as per URDPFI
106.1 106.1 106.1 106.1 106.1 106.1 106.1

Bihar State Annual Action Plan under AMRUT
For Remaining Years of Mission Period
Urban Development & Housing Department Page 22
43. Aurangabad
2.00 1. Per Person Open Space in Plain Areas as per URDPFI
88.45 88.45 88.45 88.45 88.45 88.45 88.45
44. Jehanabad 1.50 1. Per Person Open Space in Plain Areas as per URDPFI
69.56 69.56 69.56 69.56 69.56 69.56 69.56
45. Purnea 3.92 1. Per Person Open Space
in Plain Areas as per URDPFI 310.72 310.72 310.72 310.72 310.72 310.72 310.72
46. Katihar 2.10 1. Per Person Open Space
in Plain Areas as per URDPFI 124.5 124.5 124.5 124.5 124.5 124.5 124.5
47. Kishanganj 1.50 1. Per Person Open Space
in Plain Areas as per URDPFI 251.93 251.93 251.93 251.93 251.93 251.93 251.93
48. Chhapra 2.50 1. Per Person Open Space in Plain Areas as per URDPFI
52.93 52.93 52.93 52.93 52.93 52.93 52.93
49. Siwan 1.50 1. Per Person Open Space in Plain Areas as per URDPFI
77.89 77.89 77.89 77.89 77.89 77.89 77.89
50. Darbhanga 2.50 1. Per Person Open Space in
Plain Areas as per URDPFI 112.35 112.35 112.35 112.35 112.35 112.35 112.35
51. Bhagalpur 4.50 1. Per Person Open Space in Plain Areas as per URDPFI
52.26 52.26 52.26 52.26 52.26 52.26 52.26
52. Saharsa 0.50 1. Per Person Open Space in Plain Areas as per URDPFI
212 212 212 212 212 212 212
Total 65.44
[1] As per SLB framework for water supply, sewerage, solid waste management and drainage and proposed SLB indicator for urban transport
[2] Detailed information for arriving at% target against baseline shall be worked out from details provided by Cities so as to arrive at state indicators

Bihar State Annual Action Plan under AMRUT
For Remaining Years of Mission Period
Urban Development & Housing Department Page 23
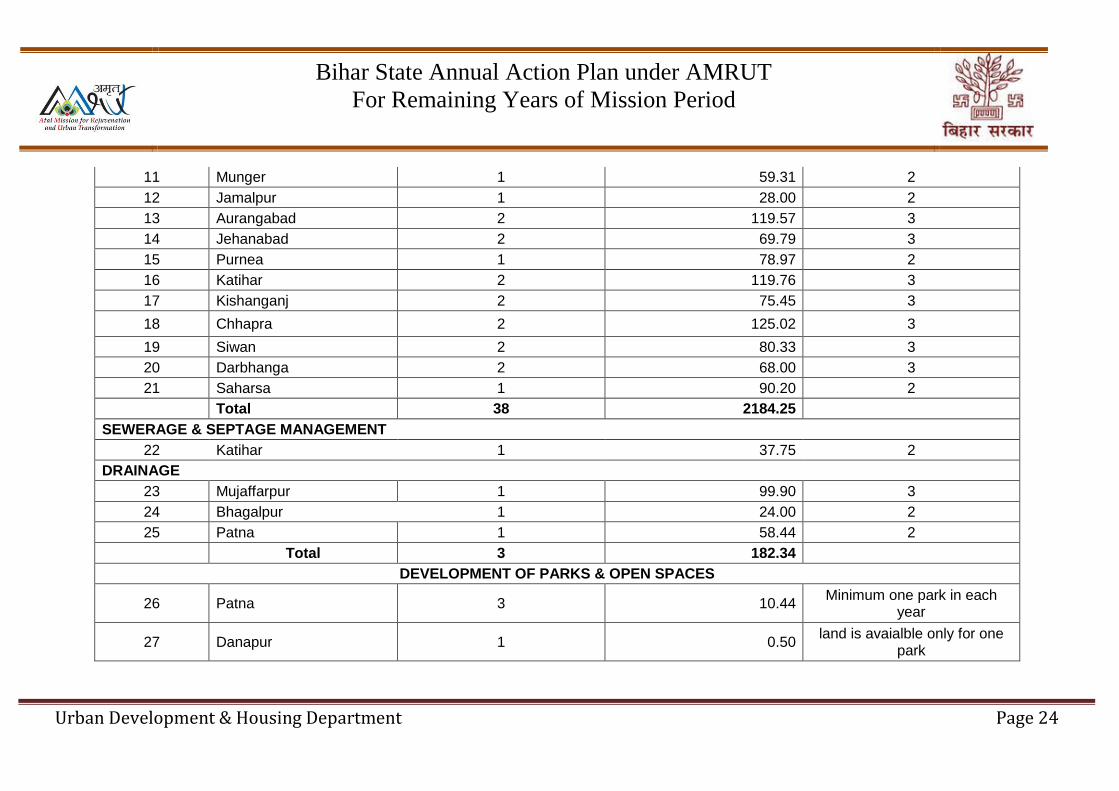
Table 3.1: SAAP – Master Plan of all projects details to achieve universal coverage during the current Mission period based on Table 2.1 (FYs 2015-16 to 2019-20)
Current Mission period 2015-20
(Amount in Rs. Crores)
Sr.No. Name of ULB (water
supply and sewerage) Total number of projects to achieve universal coverage
Estimated Cost (Rs. Crore)
Number of years to achieve universal coverage
1 2 3 4 5
WATER SUPPLY
1 Biharshariff 2 168.57 3
2 Sasaram 2 110.54 3
3 Dehri 2 102.80 3
4 Ara 2 135.73 3
5 Buxar 2 76.91 3
6 Motihari 2 114.07 3
7 Bettiah 2 127.88 3
8 Bagaha 2 184.52 3
9 Hajipur 2 127.46 3
10 Begusarai 2 121.37 3
Bihar State Annual Action Plan under AMRUT
For Remaining Years of Mission Period
Urban Development & Housing Department Page 24
11 Munger 1 59.31 2
12 Jamalpur 1 28.00 2
13 Aurangabad 2 119.57 3
14 Jehanabad 2 69.79 3
15 Purnea 1 78.97 2
16 Katihar 2 119.76 3
17 Kishanganj 2 75.45 3
18 Chhapra 2 125.02 3
19 Siwan 2 80.33 3
20 Darbhanga 2 68.00 3
21 Saharsa 1 90.20 2
Total 38 2184.25
SEWERAGE & SEPTAGE MANAGEMENT
22 Katihar 1 37.75 2
DRAINAGE
23 Mujaffarpur 1 99.90 3
24 Bhagalpur 1 24.00 2
25 Patna 1 58.44 2
Total 3 182.34
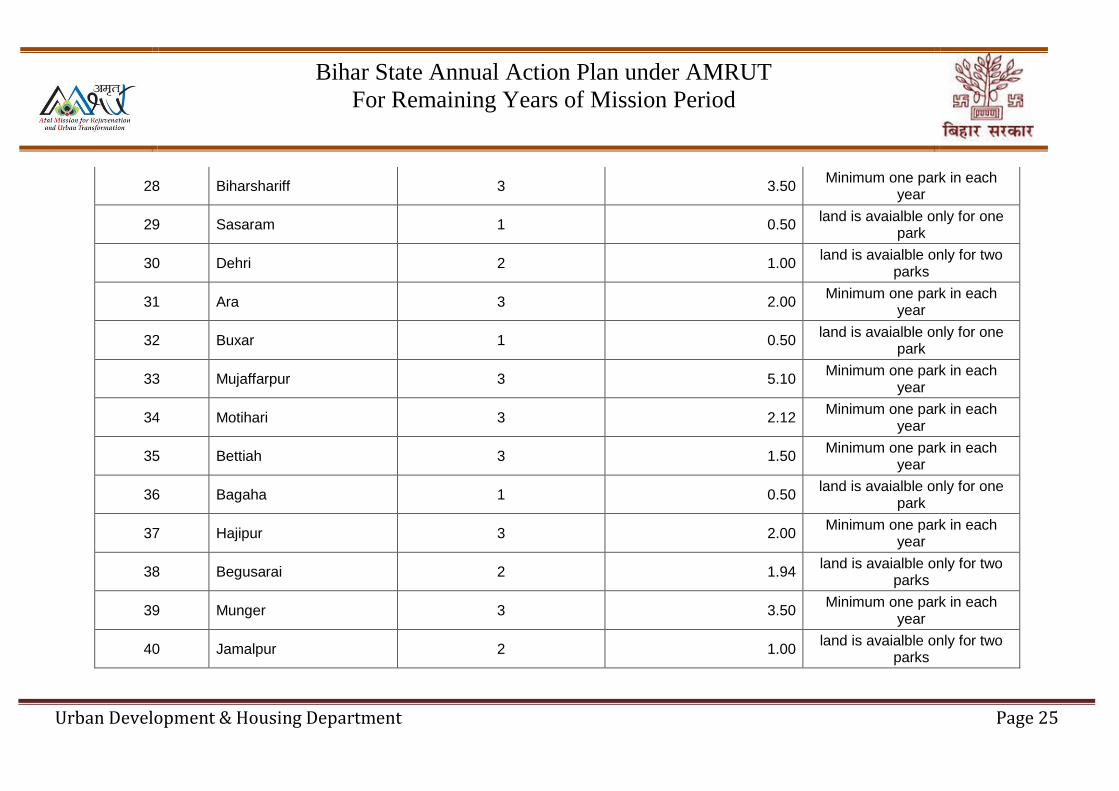
DEVELOPMENT OF PARKS & OPEN SPACES
26 Patna 3 10.44 Minimum one park in each
year
27 Danapur 1 0.50 land is avaialble only for one
park
Bihar State Annual Action Plan under AMRUT
For Remaining Years of Mission Period
Urban Development & Housing Department Page 25
28 Biharshariff 3 3.50 Minimum one park in each
year
29 Sasaram 1 0.50 land is avaialble only for one
park
30 Dehri 2 1.00 land is avaialble only for two
parks
31 Ara 3 2.00 Minimum one park in each
year
32 Buxar 1 0.50 land is avaialble only for one
park
33 Mujaffarpur 3 5.10 Minimum one park in each
year
34 Motihari 3 2.12 Minimum one park in each
year
35 Bettiah 3 1.50 Minimum one park in each
year
36 Bagaha 1 0.50 land is avaialble only for one
park
37 Hajipur 3 2.00 Minimum one park in each
year
38 Begusarai 2 1.94 land is avaialble only for two
parks
39 Munger 3 3.50 Minimum one park in each
year
40 Jamalpur 2 1.00 land is avaialble only for two
parks

Bihar State Annual Action Plan under AMRUT
For Remaining Years of Mission Period
Urban Development & Housing Department Page 26
41 Gaya 3 4.32 Minimum one park in each
year
42 Bodhgaya 2 2.50 land is avaialble only for two
parks
43 Aurangabad 3 2.00 Minimum one park in each
year
44 Jehanabad 3 1.50 Minimum one park in each
year
45 Purnea 3 3.92 Minimum one park in each
year
46 Katihar 2 2.10 land is avaialble only for two
parks
47 Kishanganj 3 1.50 Minimum one park in each
year
48 Chhapra 3 2.50 Minimum one park in each
year
49 Siwan 3 1.50 Minimum one park in each
year
50 Darbhanga 3 2.50 Minimum one park in each
year
51 Bhagalpur 3 4.50 Minimum one park in each
year
52 Saharsa 1 0.50 land is avaialble only for one
park
Total 66 65.44
Grand Total 108 2469.78

Bihar State Annual Action Plan under AMRUT
For Remaining Years of Mission Period
Urban Development & Housing Department Page 27
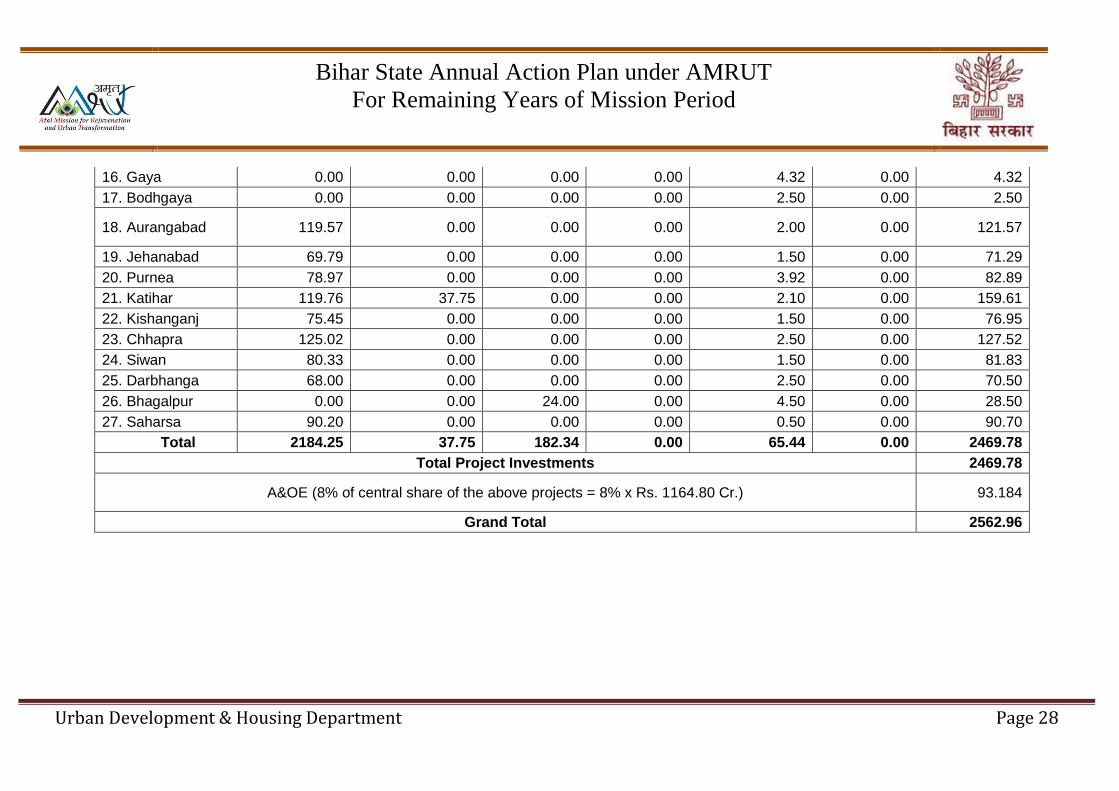
Table 3.2: SAAP- Sector Wise Breakup of Consolidated Investments
for all ULBs in the State
(Amount in Rs. Crores)
Name of City Water Supply Sewerage and
Septage Management
Drainage Urban
Transport
Others (Parks & Open Spaces)
Reforms Total
1 2 3 4 5 6 7 8
1. Patna 0.00 0.00 58.44 0.00 10.44 0.00 68.88
2. Danapur 0.00 0.00 0.00 0.00 0.50 0.00 0.50
3. Biharsharif 168.57 0.00 0.00 0.00 3.50 0.00 172.07
4. Sasaram 110.54 0.00 0.00 0.00 0.50 0.00 111.04
5. Dehri 102.80 0.00 0.00 0.00 1.00 0.00 103.80
6. Ara 135.73 0.00 0.00 0.00 2.00 0.00 137.73
7. Buxar 76.91 0.00 0.00 0.00 0.50 0.00 77.41
8. Muzaffarpur 0.00 0.00 99.90 0.00 5.10 0.00 105.00
9. Motihari 114.07 0.00 0.00 0.00 2.12 0.00 116.19
10. Bettiah 127.88 0.00 0.00 0.00 1.50 0.00 129.38
11. Bagha 184.52 0.00 0.00 0.00 0.50 0.00 185.02
12. Hajipur 127.46 0.00 0.00 0.00 2.00 0.00 129.46
13. Begusrai 121.37 0.00 0.00 0.00 1.94 0.00 123.31
14. Munger 59.31 0.00 0.00 0.00 3.50 0.00 62.81
15. Jamalpur 28.00 0.00 0.00 0.00 1.00 0.00 29.00
Bihar State Annual Action Plan under AMRUT
For Remaining Years of Mission Period
Urban Development & Housing Department Page 28
16. Gaya 0.00 0.00 0.00 0.00 4.32 0.00 4.32
17. Bodhgaya 0.00 0.00 0.00 0.00 2.50 0.00 2.50
18. Aurangabad 119.57 0.00 0.00 0.00 2.00 0.00 121.57
19. Jehanabad 69.79 0.00 0.00 0.00 1.50 0.00 71.29
20. Purnea 78.97 0.00 0.00 0.00 3.92 0.00 82.89
21. Katihar 119.76 37.75 0.00 0.00 2.10 0.00 159.61
22. Kishanganj 75.45 0.00 0.00 0.00 1.50 0.00 76.95
23. Chhapra 125.02 0.00 0.00 0.00 2.50 0.00 127.52
24. Siwan 80.33 0.00 0.00 0.00 1.50 0.00 81.83
25. Darbhanga 68.00 0.00 0.00 0.00 2.50 0.00 70.50
26. Bhagalpur 0.00 0.00 24.00 0.00 4.50 0.00 28.50
27. Saharsa 90.20 0.00 0.00 0.00 0.50 0.00 90.70
Total 2184.25 37.75 182.34 0.00 65.44 0.00 2469.78
Total Project Investments 2469.78
A&OE (8% of central share of the above projects = 8% x Rs. 1164.80 Cr.) 93.184
Grand Total 2562.96
Bihar State Annual Action Plan under AMRUT
For Remaining Years of Mission Period
Urban Development & Housing Department Page 29
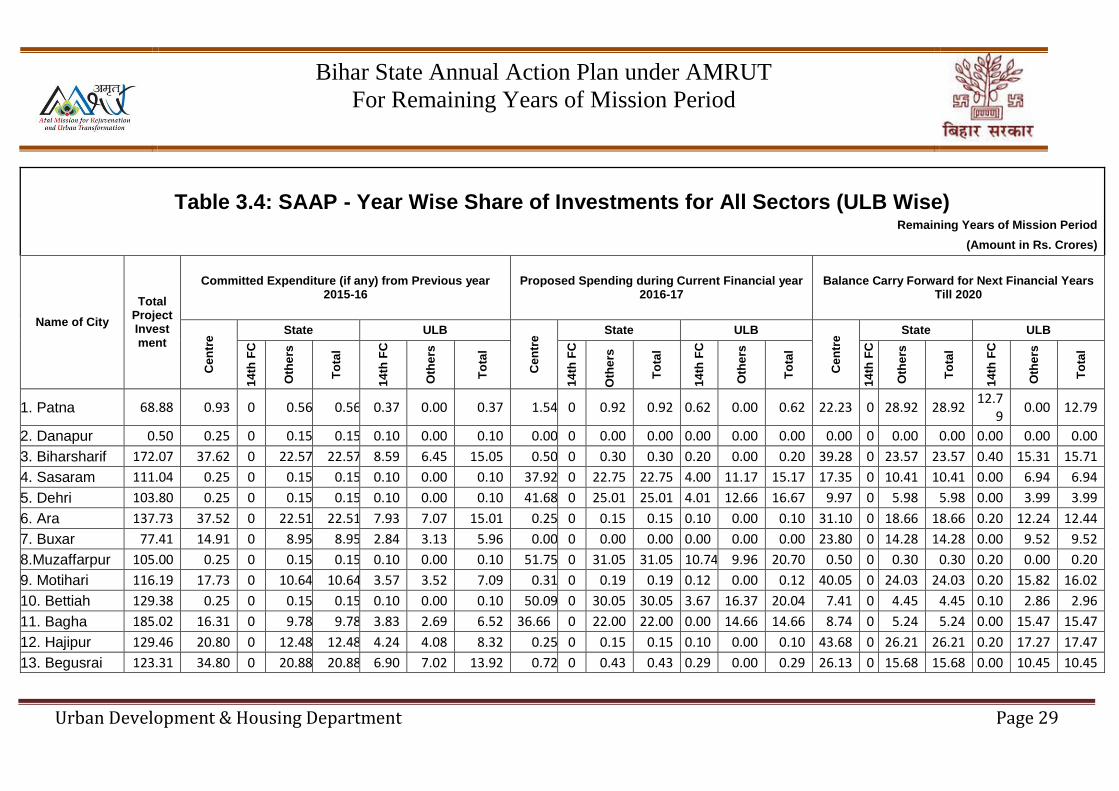
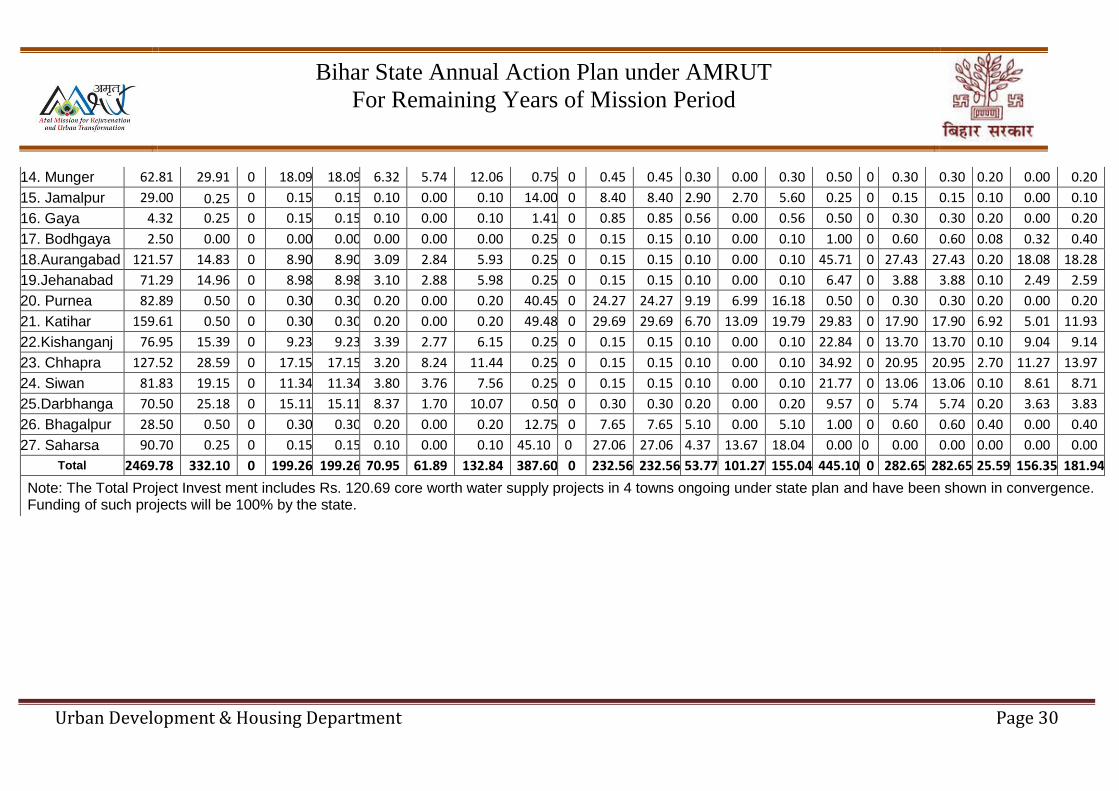
Table 3.4: SAAP - Year Wise Share of Investments for All Sectors (ULB Wise) Remaining Years of Mission Period
(Amount in Rs. Crores)
Name of City
Total Project Investment
Committed Expenditure (if any) from Previous year 2015-16
Proposed Spending during Current Financial year 2016-17
Balance Carry Forward for Next Financial Years Till 2020
Cen
tre
State ULB
Cen
tre
State ULB
Cen
tre
State ULB
14
th F
C
Oth
ers
To
tal
14
th F
C
Oth
ers
To
tal
14
th F
C
Oth
ers
To
tal
14
th F
C
Oth
ers
To
tal
14
th F
C
Oth
ers
To
tal
14
th F
C
Oth
ers
To
tal
1. Patna 68.88 0.93 0 0.56 0.56 0.37 0.00 0.37 1.54 0 0.92 0.92 0.62 0.00 0.62 22.23 0 28.92 28.92 12.7
9 0.00 12.79
2. Danapur 0.50 0.25 0 0.15 0.15 0.10 0.00 0.10 0.00 0 0.00 0.00 0.00 0.00 0.00 0.00 0 0.00 0.00 0.00 0.00 0.00
3. Biharsharif 172.07 37.62 0 22.57 22.57 8.59 6.45 15.05 0.50 0 0.30 0.30 0.20 0.00 0.20 39.28 0 23.57 23.57 0.40 15.31 15.71
4. Sasaram 111.04 0.25 0 0.15 0.15 0.10 0.00 0.10 37.92 0 22.75 22.75 4.00 11.17 15.17 17.35 0 10.41 10.41 0.00 6.94 6.94
5. Dehri 103.80 0.25 0 0.15 0.15 0.10 0.00 0.10 41.68 0 25.01 25.01 4.01 12.66 16.67 9.97 0 5.98 5.98 0.00 3.99 3.99
6. Ara 137.73 37.52 0 22.51 22.51 7.93 7.07 15.01 0.25 0 0.15 0.15 0.10 0.00 0.10 31.10 0 18.66 18.66 0.20 12.24 12.44
7. Buxar 77.41 14.91 0 8.95 8.95 2.84 3.13 5.96 0.00 0 0.00 0.00 0.00 0.00 0.00 23.80 0 14.28 14.28 0.00 9.52 9.52
8.Muzaffarpur 105.00 0.25 0 0.15 0.15 0.10 0.00 0.10 51.75 0 31.05 31.05 10.74 9.96 20.70 0.50 0 0.30 0.30 0.20 0.00 0.20
9. Motihari 116.19 17.73 0 10.64 10.64 3.57 3.52 7.09 0.31 0 0.19 0.19 0.12 0.00 0.12 40.05 0 24.03 24.03 0.20 15.82 16.02
10. Bettiah 129.38 0.25 0 0.15 0.15 0.10 0.00 0.10 50.09 0 30.05 30.05 3.67 16.37 20.04 7.41 0 4.45 4.45 0.10 2.86 2.96
11. Bagha 185.02 16.31 0 9.78 9.78 3.83 2.69 6.52 36.66 0 22.00 22.00 0.00 14.66 14.66 8.74 0 5.24 5.24 0.00 15.47 15.47
12. Hajipur 129.46 20.80 0 12.48 12.48 4.24 4.08 8.32 0.25 0 0.15 0.15 0.10 0.00 0.10 43.68 0 26.21 26.21 0.20 17.27 17.47
13. Begusrai 123.31 34.80 0 20.88 20.88 6.90 7.02 13.92 0.72 0 0.43 0.43 0.29 0.00 0.29 26.13 0 15.68 15.68 0.00 10.45 10.45
Bihar State Annual Action Plan under AMRUT
For Remaining Years of Mission Period
Urban Development & Housing Department Page 30
14. Munger 62.81 29.91 0 18.09 18.09 6.32 5.74 12.06 0.75 0 0.45 0.45 0.30 0.00 0.30 0.50 0 0.30 0.30 0.20 0.00 0.20
15. Jamalpur 29.00 0.25 0 0.15 0.15 0.10 0.00 0.10 14.00 0 8.40 8.40 2.90 2.70 5.60 0.25 0 0.15 0.15 0.10 0.00 0.10
16. Gaya 4.32 0.25 0 0.15 0.15 0.10 0.00 0.10 1.41 0 0.85 0.85 0.56 0.00 0.56 0.50 0 0.30 0.30 0.20 0.00 0.20
17. Bodhgaya 2.50 0.00 0 0.00 0.00 0.00 0.00 0.00 0.25 0 0.15 0.15 0.10 0.00 0.10 1.00 0 0.60 0.60 0.08 0.32 0.40
18.Aurangabad 121.57 14.83 0 8.90 8.90 3.09 2.84 5.93 0.25 0 0.15 0.15 0.10 0.00 0.10 45.71 0 27.43 27.43 0.20 18.08 18.28
19.Jehanabad 71.29 14.96 0 8.98 8.98 3.10 2.88 5.98 0.25 0 0.15 0.15 0.10 0.00 0.10 6.47 0 3.88 3.88 0.10 2.49 2.59
20. Purnea 82.89 0.50 0 0.30 0.30 0.20 0.00 0.20 40.45 0 24.27 24.27 9.19 6.99 16.18 0.50 0 0.30 0.30 0.20 0.00 0.20
21. Katihar 159.61 0.50 0 0.30 0.30 0.20 0.00 0.20 49.48 0 29.69 29.69 6.70 13.09 19.79 29.83 0 17.90 17.90 6.92 5.01 11.93
22.Kishanganj 76.95 15.39 0 9.23 9.23 3.39 2.77 6.15 0.25 0 0.15 0.15 0.10 0.00 0.10 22.84 0 13.70 13.70 0.10 9.04 9.14
23. Chhapra 127.52 28.59 0 17.15 17.15 3.20 8.24 11.44 0.25 0 0.15 0.15 0.10 0.00 0.10 34.92 0 20.95 20.95 2.70 11.27 13.97
24. Siwan 81.83 19.15 0 11.34 11.34 3.80 3.76 7.56 0.25 0 0.15 0.15 0.10 0.00 0.10 21.77 0 13.06 13.06 0.10 8.61 8.71
25.Darbhanga 70.50 25.18 0 15.11 15.11 8.37 1.70 10.07 0.50 0 0.30 0.30 0.20 0.00 0.20 9.57 0 5.74 5.74 0.20 3.63 3.83
26. Bhagalpur 28.50 0.50 0 0.30 0.30 0.20 0.00 0.20 12.75 0 7.65 7.65 5.10 0.00 5.10 1.00 0 0.60 0.60 0.40 0.00 0.40
27. Saharsa 90.70 0.25 0 0.15 0.15 0.10 0.00 0.10 45.10 0 27.06 27.06 4.37 13.67 18.04 0.00 0 0.00 0.00 0.00 0.00 0.00
Total 2469.78 332.10 0 199.26 199.26 70.95 61.89 132.84 387.60 0 232.56 232.56 53.77 101.27 155.04 445.10 0 282.65 282.65 25.59 156.35 181.94
Note: The Total Project Invest ment includes Rs. 120.69 core worth water supply projects in 4 towns ongoing under state plan and have been shown in convergence. Funding of such projects will be 100% by the state.
Bihar State Annual Action Plan under AMRUT
For Remaining Years of Mission Period
Urban Development & Housing Department Page 31
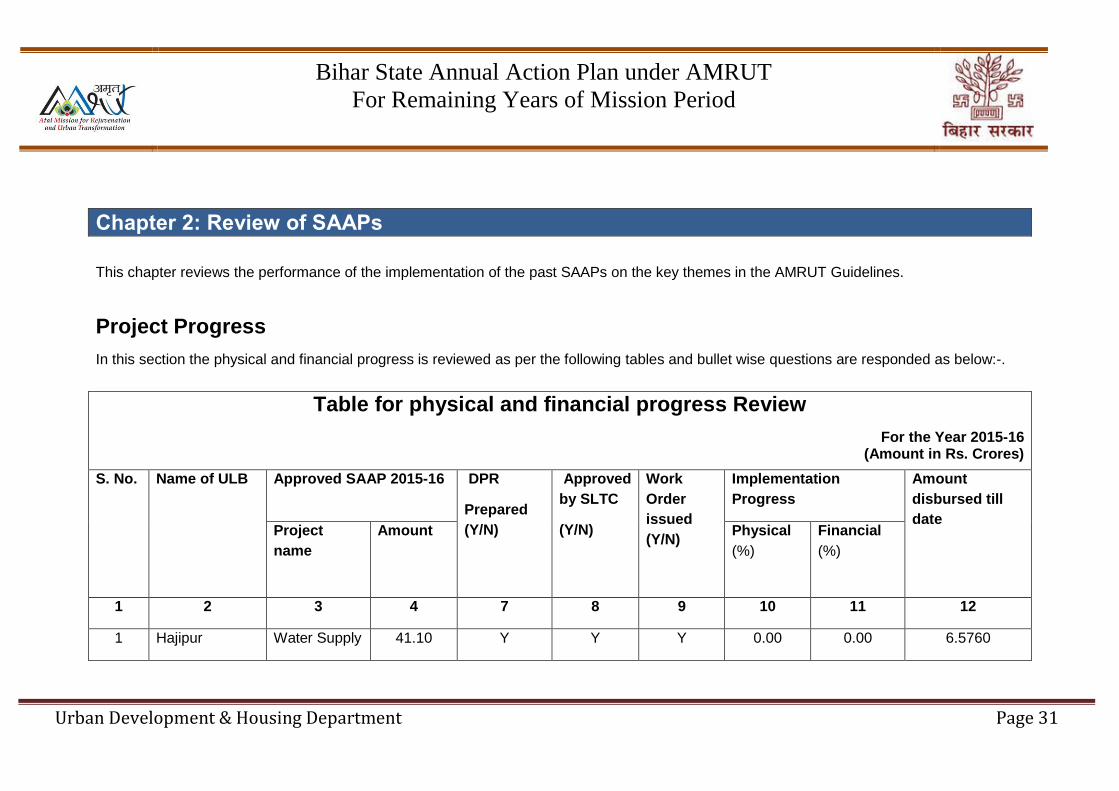
Chapter 2: Review of SAAPs
This chapter reviews the performance of the implementation of the past SAAPs on the key themes in the AMRUT Guidelines.
Project Progress
In this section the physical and financial progress is reviewed as per the following tables and bullet wise questions are responded as below:-.
Table for physical and financial progress Review
For the Year 2015-16 (Amount in Rs. Crores)
S. No. Name of ULB Approved SAAP 2015-16 DPR
Prepared
(Y/N)
Approved
by SLTC
(Y/N)
Work
Order
issued
(Y/N)
Implementation
Progress
Amount
disbursed till
date Project
name
Amount Physical
(%)
Financial
(%)
1 2 3 4 7 8 9 10 11 12
1 Hajipur Water Supply 41.10 Y Y Y 0.00 0.00 6.5760
Bihar State Annual Action Plan under AMRUT
For Remaining Years of Mission Period
Urban Development & Housing Department Page 32
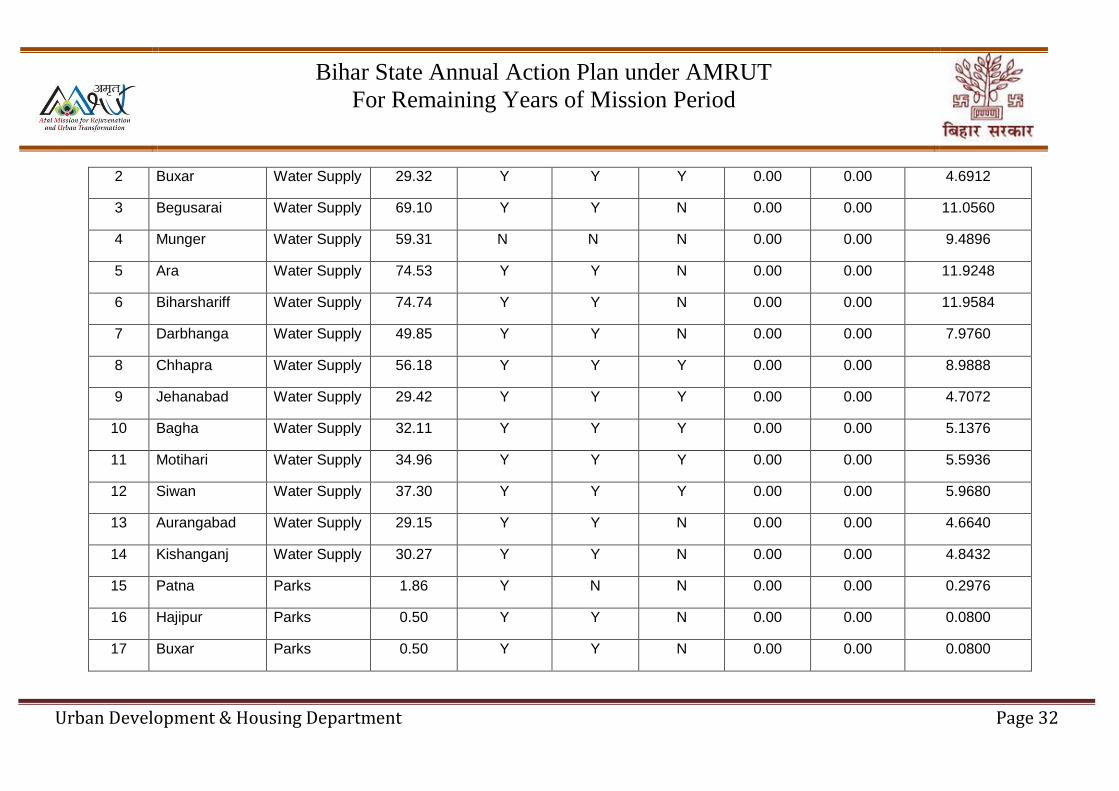
2 Buxar Water Supply 29.32 Y Y Y 0.00 0.00 4.6912
3 Begusarai Water Supply 69.10 Y Y N 0.00 0.00 11.0560
4 Munger Water Supply 59.31 N N N 0.00 0.00 9.4896
5 Ara Water Supply 74.53 Y Y N 0.00 0.00 11.9248
6 Biharshariff Water Supply 74.74 Y Y N 0.00 0.00 11.9584
7 Darbhanga Water Supply 49.85 Y Y N 0.00 0.00 7.9760
8 Chhapra Water Supply 56.18 Y Y Y 0.00 0.00 8.9888
9 Jehanabad Water Supply 29.42 Y Y Y 0.00 0.00 4.7072
10 Bagha Water Supply 32.11 Y Y Y 0.00 0.00 5.1376
11 Motihari Water Supply 34.96 Y Y Y 0.00 0.00 5.5936
12 Siwan Water Supply 37.30 Y Y Y 0.00 0.00 5.9680
13 Aurangabad Water Supply 29.15 Y Y N 0.00 0.00 4.6640
14 Kishanganj Water Supply 30.27 Y Y N 0.00 0.00 4.8432
15 Patna Parks 1.86 Y N N 0.00 0.00 0.2976
16 Hajipur Parks 0.50 Y Y N 0.00 0.00 0.0800
17 Buxar Parks 0.50 Y Y N 0.00 0.00 0.0800

Bihar State Annual Action Plan under AMRUT
For Remaining Years of Mission Period
Urban Development & Housing Department Page 33
18 Begusarai Parks 0.50 N N N 0.00 0.00 0.0800
19 Munger Parks 1.00 Y Y N 0.00 0.00 0.1600
20 Ara Parks 0.50 Y Y N 0.00 0.00 0.0800
21 Biharshariff Parks 0.50 Y Y N 0.00 0.00 0.0800
22 Darbhanga Parks 0.50 Y Y N 0.00 0.00 0.0800
23 Chhapra Parks 1.00 Y Y N 0.00 0.00 0.1600
24 Jehanabad Parks 0.50 Y Y N 0.00 0.00 0.0800
25 Bagha Parks 0.50 N N N 0.00 0.00 0.0800
26 Motihari Parks 0.50 Y Y N 0.00 0.00 0.0800
27 Siwan Parks 0.50 Y Y N 0.00 0.00 0.0800
28 Aurangabad Parks 0.50 Y Y N 0.00 0.00 0.0800
29 Sasaram Parks 0.50 Y Y N 0.00 0.00 0.0800
30 Katihar Parks 1.00 Y Y N 0.00 0.00 0.1600
31 Kishanganj Parks 0.50 Y Y N 0.00 0.00 0.0800
32 Purnea Parks 1.00 Y Y N 0.00 0.00 0.1600
33 Dehri Parks 0.50 Y Y N 0.00 0.00 0.0800
Bihar State Annual Action Plan under AMRUT
For Remaining Years of Mission Period
Urban Development & Housing Department Page 34
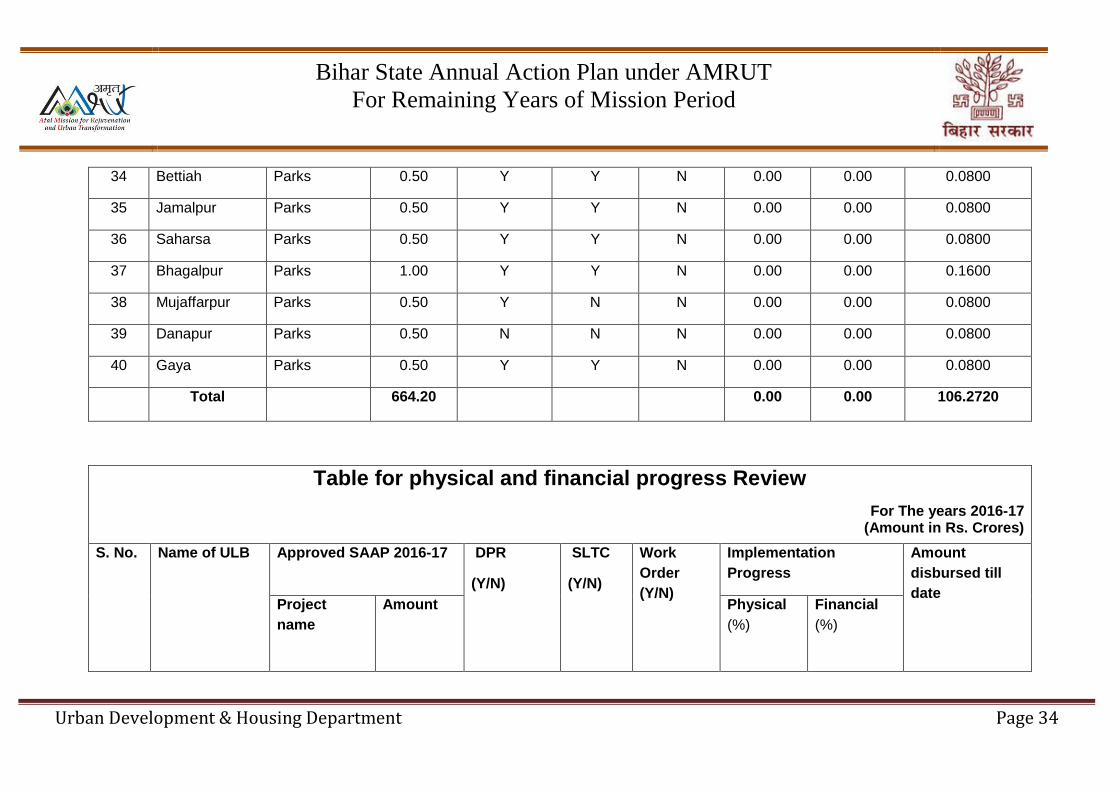
34 Bettiah Parks 0.50 Y Y N 0.00 0.00 0.0800
35 Jamalpur Parks 0.50 Y Y N 0.00 0.00 0.0800
36 Saharsa Parks 0.50 Y Y N 0.00 0.00 0.0800
37 Bhagalpur Parks 1.00 Y Y N 0.00 0.00 0.1600
38 Mujaffarpur Parks 0.50 Y N N 0.00 0.00 0.0800
39 Danapur Parks 0.50 N N N 0.00 0.00 0.0800
40 Gaya Parks 0.50 Y Y N 0.00 0.00 0.0800
Total 664.20 0.00 0.00 106.2720
Table for physical and financial progress Review
For The years 2016-17 (Amount in Rs. Crores)
S. No. Name of ULB Approved SAAP 2016-17 DPR
(Y/N)
SLTC
(Y/N)
Work
Order
(Y/N)
Implementation
Progress
Amount
disbursed till
date Project
name
Amount Physical
(%)
Financial
(%)

Bihar State Annual Action Plan under AMRUT
For Remaining Years of Mission Period
Urban Development & Housing Department Page 35
1 2 3 4 7 8 9 10 11 12
1 Sasaram Water Supply 75.84 N N N 0.00 0.00 0.00
2 Dehri Water Supply 82.86 N N N 0.00 0.00 0.00
3 Bettiah Water Supply 99.68 N N N 0.00 0.00 0.00
Bagaha Water Supply 73.32 N N N 0.00 0.00 0.00
4 Jamalpur Water Supply 28.00 N N N 0.00 0.00 0.00
5 Purnea Water Supply 78.97 N N N 0.00 0.00 0.00
6 Katihar Water Supply 98.95 N N N 0.00 0.00 0.00
7 Saharsa Water Supply 90.20 N N N 0.00 0.00 0.00
8 Muzaffarpur Drainage 99.90 N N N 0.00 0.00 0.00
9 Bhagalpur Drainage 24.00 N N N 0.00 0.00 0.00
10 Patna Parks 3.08 N N N 0.00 0.00 0.00
11 Hajipur Parks 0.50 N N N 0.00 0.00 0.00
12 Begusarai Parks 1.44 N N N 0.00 0.00 0.00
13 Munger Parks 1.50 N N N 0.00 0.00 0.00
14 Ara Parks 0.50 Y N N 0.00 0.00 0.00

Bihar State Annual Action Plan under AMRUT
For Remaining Years of Mission Period
Urban Development & Housing Department Page 36
15 Biharshariff Parks 1.00 N N N 0.00 0.00 0.00
16 Darbhanga Parks 1.00 N N N 0.00 0.00 0.00
17 Chhapra Parks 0.50 N N N 0.00 0.00 0.00
18 Jehanabad Parks 0.50 N N N 0.00 0.00 0.00
19 Motihari Parks 0.62 N N N 0.00 0.00 0.00
20 Siwan Parks 0.50 N N N 0.00 0.00 0.00
21 Aurangabad Parks 0.50 N N N 0.00 0.00 0.00
22 Kishanganj Parks 0.50 N N N 0.00 0.00 0.00
23 Purnea Parks 1.92 N N N 0.00 0.00 0.00
24 Dehri Parks 0.50 N N N 0.00 0.00 0.00
25 Bettiah Parks 0.50 N N N 0.00 0.00 0.00
26 Bhagalpur Parks 1.50 N N N 0.00 0.00 0.00
27 Mujaffarpur Parks 3.60 Y N N 0.00 0.00 0.00
28 Gaya Parks 2.82 Y Y N 0.00 0.00 0.00
29 Bodhgaya Parks 0.50 N N N 0.00 0.00 0.00
Total 775.20 0.00 0.00 0.00

Bihar State Annual Action Plan under AMRUT
For Remaining Years of Mission Period
Urban Development & Housing Department Page 37
Have DPRs been prepared for all projects approved earlier? If not then which are the projects for which DPR is pending and
why? (500 words)
DPRs of 13 water supply projects out of 21 approved in SAAP 2015-16 and 2016-17 have been prepared and approved by
SLTC/SHPSC..Out of 46 DPRs approved for Development of parks in SAAP 2015-16 & 2016-17, 21 DPRs have been prepared and
approved by SLTC/SHPSC.
What is the plan of action for the pending DPRs? (300 words)
Bihar Rajya Jal Parishad (BRJP) is preparing the DPRs of water supply projects while the ULBs are preparing DPRs for Park
Development.
How many SLTC meetings had been held in the State? How many DPRs have been approved by the SLTC till date? (250
words)
Four SLTC meetings have been held as yet. 13 DPRs of Water Supply Projects and 21 DPRs of Park Projects have been approved by
SLTC.
By when will the pending DPRs be approved by the SLTC and when will implementation start? (250 words)
Remaining projects of Water Supply and Development of Parks will be approved in the 5th & 6th SLTC meeting likely to be held in
November & December, 2016.

Bihar State Annual Action Plan under AMRUT
For Remaining Years of Mission Period
Urban Development & Housing Department Page 38
Based on the identification of delayed projects and the reasons for slow physical progress, what is the plan of action to
speed-up the projects? (300 words)
BRJP has been asked to speed up the progress. Regular review meetings are planned to discuss on pending issues and to prepare
plan of action. Regular follow up with the ULBs for preparation of DPRs and tendering is being done at state Mission level.
How much amount has been utilized and what is the percentage share of the funding agencies? Are there any deviations from
the approved funding pattern approved by the Apex Committee? (tabular form and 500 words)
No money has been utilized as yet. No deviations from the funding pattern approved by the Apex Committee has yet been envisaged.
Deviation in the project cost of Water Supply Saharsa as approved by the Apex Committee has been envisaged after review of the
status of ongoing water supply scheme in the town under State Plan.
List out the projects where release of funds to ULBs by the State was delayed?
State has already released its matching share of 20% of total allocation, as per approved SAAP 2015-16, to the concerned ULBs in
conformity with the release of 20% CA by Govt of India.ULBs. Bidding process has been started for the projects already sanctioned by
SLTC. The CA released by MoUD for year 2016-17 could not be released to ULBs due to delay in withdrawal from state treasury.
In how many ULBs implementation was done by agencies other than ULBs? Was a resolution taken from all ULBs? (tabular
and 200 words)
Bihar State Annual Action Plan under AMRUT
For Remaining Years of Mission Period
Urban Development & Housing Department Page 39
All Water Supply Projects is being implemented by Bihar Rajya Jal Parishad who has awarded works for 7 Water Supply Projects.
Tripartite Agreement is under process of execution. The bidding process of remaining projects approved by SLTC is ongoing and hence
implementation at ULB level has not yet started.
List out the projects where the assessed value approved by the Apex Committee was greater than the tendered value and
there was a saving? Was this addressed by the HPSC in the present SAAP? (tabular and 200 words)
The project cost of Water Supply Saharsa approved by Apex Committee has been reviewed after review of the status of ongoing water
supply scheme in the town under State Plan. It is estimated that the project cost as approved by Apex Committee Rs. 163.52 Crore is
more than that required Rs. 90.20 Crore for 100% coverage of the households. This has been approved by the SHPSC and considered
in the present SAAP.
List out the number of city-wise projects where the second and third installments were claimed. (Tabular form).
No further installment has been asked for as yet since implementation process is yet to begin.
List out the city-wise completed projects. Was the targeted benchmark achieved? Explain the reasons for non-achievement
(tabular form and 400 words)
No project has yet been completed. However, 7 water supply projects have been recently started.
List out the details of projects taken up in PPP model. Describe the type of PPP (tabular; 300 words)
No PPP project has yet been taken up.

Bihar State Annual Action Plan under AMRUT
For Remaining Years of Mission Period
Urban Development & Housing Department Page 40
List out and describe any out-of-the-box initiatives/Smart Solutions/resilience used/incorporated in the projects under
implementation. What is the nature of the innovation in the projects? (tabular; 300 words)
Out-of-the-box initiatives/Smart Solutions will be promoted during project implementation. However, SCADA has been proposed in all
Water Supply Projects.
Service Levels
The focus of AMRUT is to achieve service level benchmarks, such as universal coverage in water supply, sewer connections and drainage etc..
In the approved SAAPs, the Govt of Bihar has targeted the benchmark of universal coverage. The SAAP will review the progress towards
targets set by the ULBs to move towards achievement of universal coverage.
Table for Progress Review
FY 2016-17
Name of City Service Level Benchmark SAAP
Baseline
(as in 2015-
16)
SAAP Mission
Target FY 2020
For the last Financial Year
Target upto
beginning of current
FY 2016-17
Achievement upto
beginning of current
FY 2016-17
Sector: Water Supply
1. Hajipur 1. Household level
coverage of direct water
supply connections
27% 100% 27% 27%

Bihar State Annual Action Plan under AMRUT
For Remaining Years of Mission Period
Urban Development & Housing Department Page 41
2. Per capita quantum of
water supplied
52lpcd 135lpcd 52 lpcd 52 lpcd
3. Quality of water supplied 100% 100% 100% 100%
2. Buxar 1. Household level
coverage of direct water
supply connections
60% 100% 60% 60%
2. Per capita quantum of
water supplied
51lpcd 135lpcd 100 lpcd 100 lpcd
3. Quality of water supplied 100% 100% 100% 100%
3. Begusarai 1. Household level
coverage of direct water
supply connections
22% 100% 22% 22%
2. Per capita quantum of
water supplied
45lpcd 135lpcd 45lpcd 45lpcd
3. Quality of water supplied 20% 100% 20% 20%
4. Munger 1. Household level
coverage of direct water
supply connections
46% 100% 46% 46%
2. Per capita quantum of
water supplied
57lpcd 135lpcd 100 lpcd 100 lpcd
3. Quality of water supplied 80% 100% 80% 80%
5. Arrah 1. Household level
coverage of direct water
supply connections
20% 100% 20% 20%

Bihar State Annual Action Plan under AMRUT
For Remaining Years of Mission Period
Urban Development & Housing Department Page 42
2. Per capita quantum of
water supplied
30lpcd 135lpcd 30lpcd 30lpcd
3. Quality of water supplied 80% 100% 80% 80%
6. Bihar sharif 1. Household level
coverage of direct water
supply connections
55.30% 100% 70% 70%
2. Per capita quantum of
water supplied
105lpcd 135lpcd 105 lpcd 105 lpcd
3. Quality of water supplied 20% 100% 20% 20%
7. Darbhanga 1. Household level
coverage of direct water
supply connections
15% 100% 50% 50%
2. Per capita quantum of
water supplied
39lpcd 135lpcd 39lpcd 39lpcd
3. Quality of water supplied 85% 100% 85% 85%
8. Chhapra 1. Household level
coverage of direct water
supply connections
45% 100% 60% 60%
2. Per capita quantum of
water supplied
57 lpcd 135lpcd 100 lpcd 100 lpcd
3. Quality of water supplied 100% 100% 100% 100%
9. Jehanabad 1. Household level
coverage of direct water
supply connections
10.40% 100% 10.40% 10.40%
Bihar State Annual Action Plan under AMRUT
For Remaining Years of Mission Period
Urban Development & Housing Department Page 43
2. Per capita quantum of
water supplied
28lpcd 135lpcd 28lpcd 28lpcd
3. Quality of water supplied 30% 100% 30% 30%
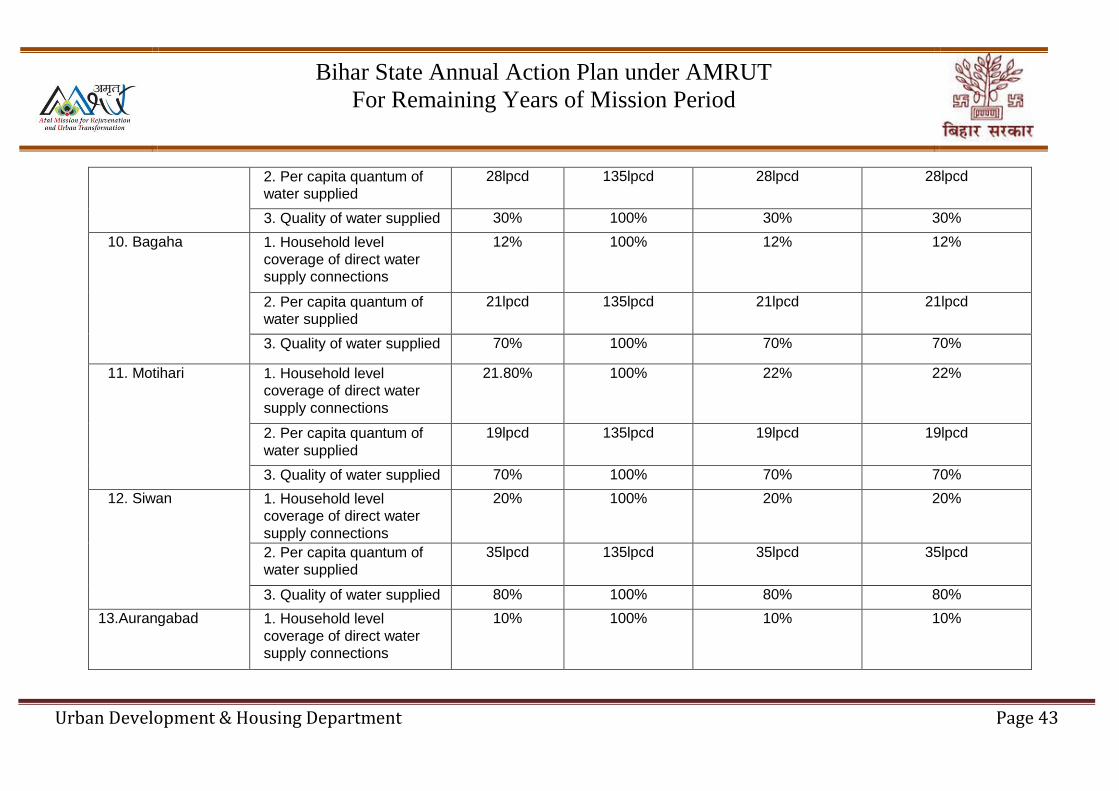
10. Bagaha 1. Household level
coverage of direct water
supply connections
12% 100% 12% 12%
2. Per capita quantum of
water supplied
21lpcd 135lpcd 21lpcd 21lpcd
3. Quality of water supplied 70% 100% 70% 70%
11. Motihari 1. Household level
coverage of direct water
supply connections
21.80% 100% 22% 22%
2. Per capita quantum of
water supplied
19lpcd 135lpcd 19lpcd 19lpcd
3. Quality of water supplied 70% 100% 70% 70%
12. Siwan 1. Household level
coverage of direct water
supply connections
20% 100% 20% 20%
2. Per capita quantum of
water supplied
35lpcd 135lpcd 35lpcd 35lpcd
3. Quality of water supplied 80% 100% 80% 80%
13.Aurangabad 1. Household level
coverage of direct water
supply connections
10% 100% 10% 10%

Bihar State Annual Action Plan under AMRUT
For Remaining Years of Mission Period
Urban Development & Housing Department Page 44
2. Per capita quantum of
water supplied
45lpcd 135lpcd 45lpcd 45lpcd
3. Quality of water supplied 70% 100% 70% 70%
14. Sasaram 1. Household level
coverage of direct water
supply connections
30% 100% 30% 30%
2. Per capita quantum of
water supplied
25lpcd 135lpcd 25lpcd 25lpcd
3. Quality of water supplied 80% 100% 80% 80%
15. Katihar 1. Household level
coverage of direct water
supply connections
30% 100% 30% 30%
2. Per capita quantum of
water supplied
45lpcd 135lpcd 45lpcd 45lpcd
3. Quality of water supplied 50% 100% 50% 50%
16. Kishanganj 1. Household level
coverage of direct water
supply connections
3.20% 100% 10% 10%
2. Per capita quantum of
water supplied
32lpcd 135lpcd 45lpcd 45lpcd
3. Quality of water supplied 80% 100% 80% 80%
17. Purnea 1. Household level
coverage of direct water
supply connections
60% 100% 60% 60%
Bihar State Annual Action Plan under AMRUT
For Remaining Years of Mission Period
Urban Development & Housing Department Page 45
2. Per capita quantum of
water supplied
65lpcd 135lpcd 65lpcd 65lpcd
3. Quality of water supplied 70% 100% 70% 70%
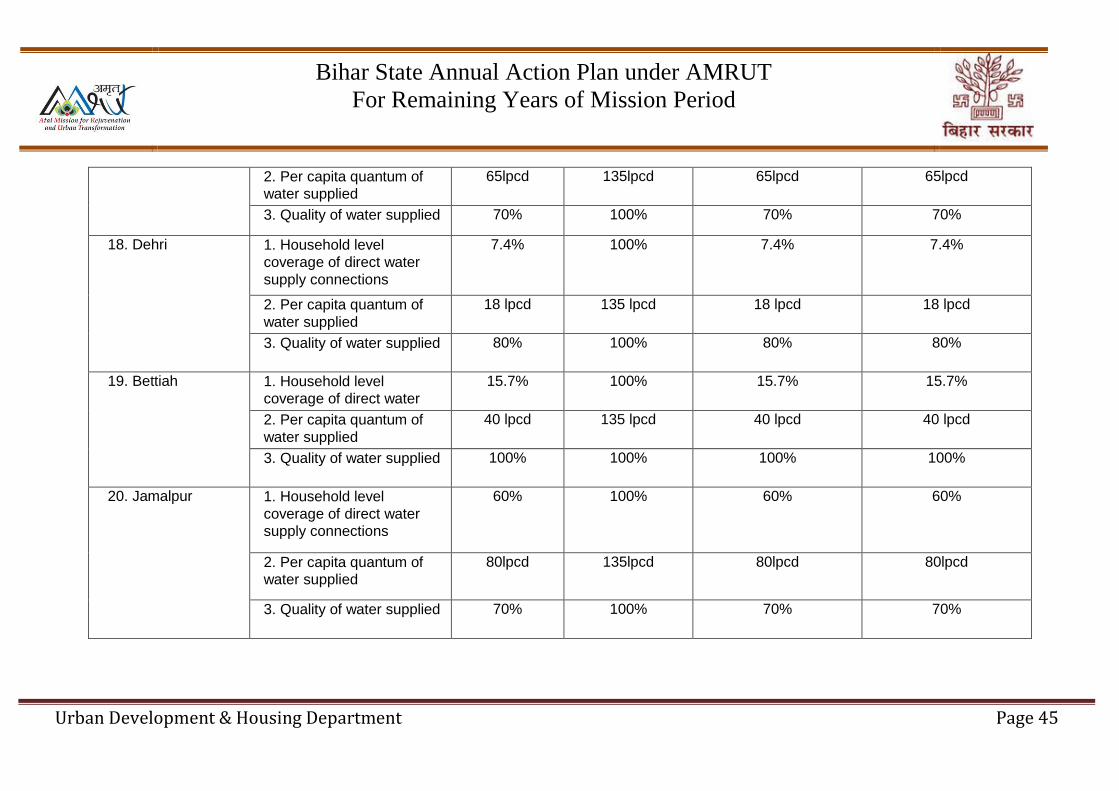
18. Dehri 1. Household level
coverage of direct water
supply connections
7.4% 100% 7.4% 7.4%
2. Per capita quantum of
water supplied
18 lpcd 135 lpcd 18 lpcd 18 lpcd
3. Quality of water supplied 80% 100% 80% 80%
19. Bettiah 1. Household level
coverage of direct water
supply connections
15.7% 100% 15.7% 15.7%
2. Per capita quantum of
water supplied
40 lpcd 135 lpcd 40 lpcd 40 lpcd
3. Quality of water supplied 100% 100% 100% 100%
20. Jamalpur 1. Household level
coverage of direct water
supply connections
60% 100% 60% 60%
2. Per capita quantum of
water supplied
80lpcd 135lpcd 80lpcd 80lpcd
3. Quality of water supplied 70% 100% 70% 70%
Bihar State Annual Action Plan under AMRUT
For Remaining Years of Mission Period
Urban Development & Housing Department Page 46
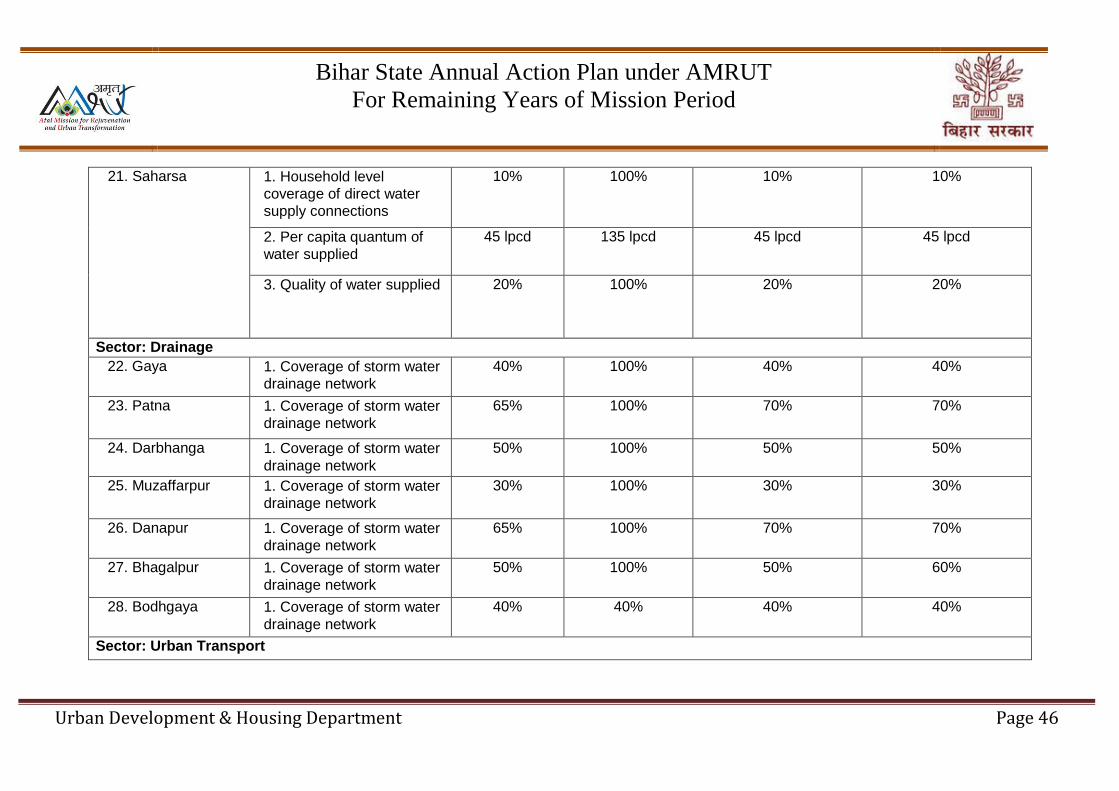
21. Saharsa 1. Household level
coverage of direct water
supply connections
10% 100% 10% 10%
2. Per capita quantum of
water supplied
45 lpcd 135 lpcd 45 lpcd 45 lpcd
3. Quality of water supplied 20% 100% 20% 20%
Sector: Drainage
22. Gaya 1. Coverage of storm water
drainage network
40% 100% 40% 40%
23. Patna 1. Coverage of storm water
drainage network
65% 100% 70% 70%
24. Darbhanga 1. Coverage of storm water
drainage network
50% 100% 50% 50%
25. Muzaffarpur 1. Coverage of storm water
drainage network
30% 100% 30% 30%
26. Danapur 1. Coverage of storm water
drainage network
65% 100% 70% 70%
27. Bhagalpur 1. Coverage of storm water
drainage network
50% 100% 50% 60%
28. Bodhgaya 1. Coverage of storm water
drainage network
40% 40% 40% 40%
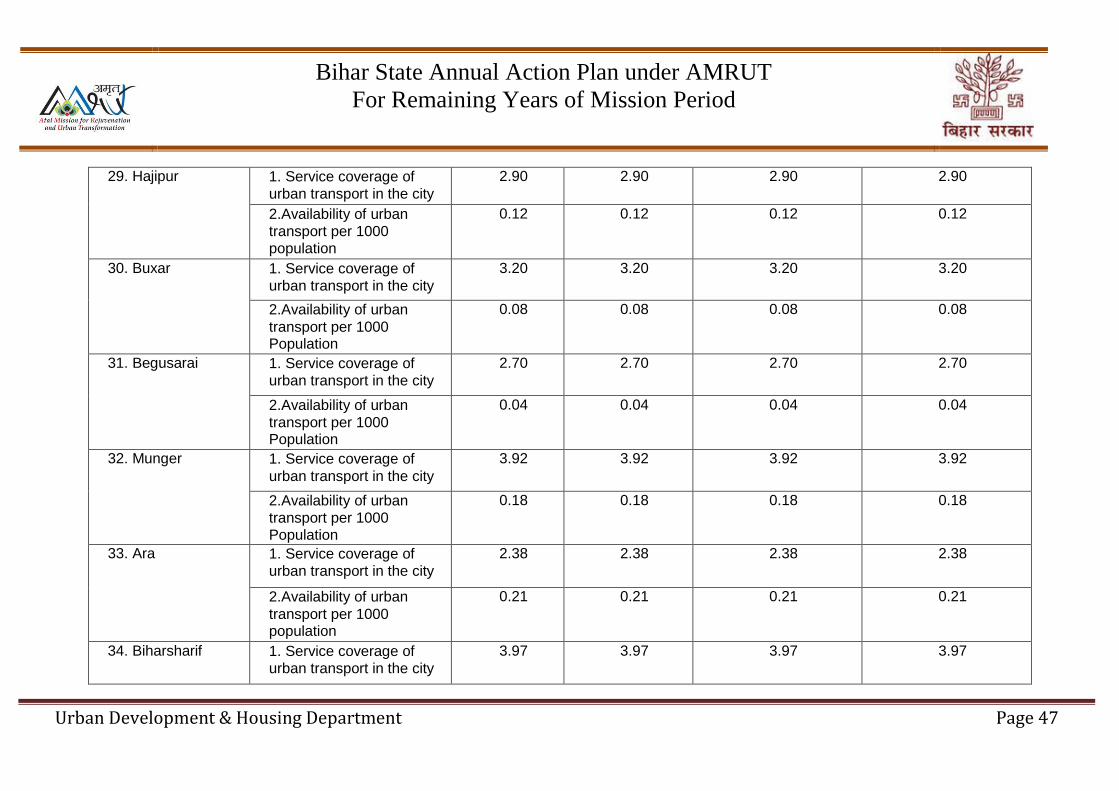
Sector: Urban Transport
Bihar State Annual Action Plan under AMRUT
For Remaining Years of Mission Period
Urban Development & Housing Department Page 47
29. Hajipur 1. Service coverage of
urban transport in the city
2.90 2.90 2.90 2.90
2.Availability of urban
transport per 1000 population
0.12 0.12 0.12 0.12
30. Buxar 1. Service coverage of
urban transport in the city
3.20 3.20 3.20 3.20
2.Availability of urban
transport per 1000 Population
0.08 0.08 0.08 0.08
31. Begusarai 1. Service coverage of
urban transport in the city
2.70 2.70 2.70 2.70
2.Availability of urban
transport per 1000 Population
0.04 0.04 0.04 0.04
32. Munger 1. Service coverage of
urban transport in the city
3.92 3.92 3.92 3.92
2.Availability of urban
transport per 1000 Population
0.18 0.18 0.18 0.18
33. Ara 1. Service coverage of
urban transport in the city
2.38 2.38 2.38 2.38
2.Availability of urban
transport per 1000 population
0.21 0.21 0.21 0.21
34. Biharsharif 1. Service coverage of
urban transport in the city
3.97 3.97 3.97 3.97
Bihar State Annual Action Plan under AMRUT
For Remaining Years of Mission Period
Urban Development & Housing Department Page 48
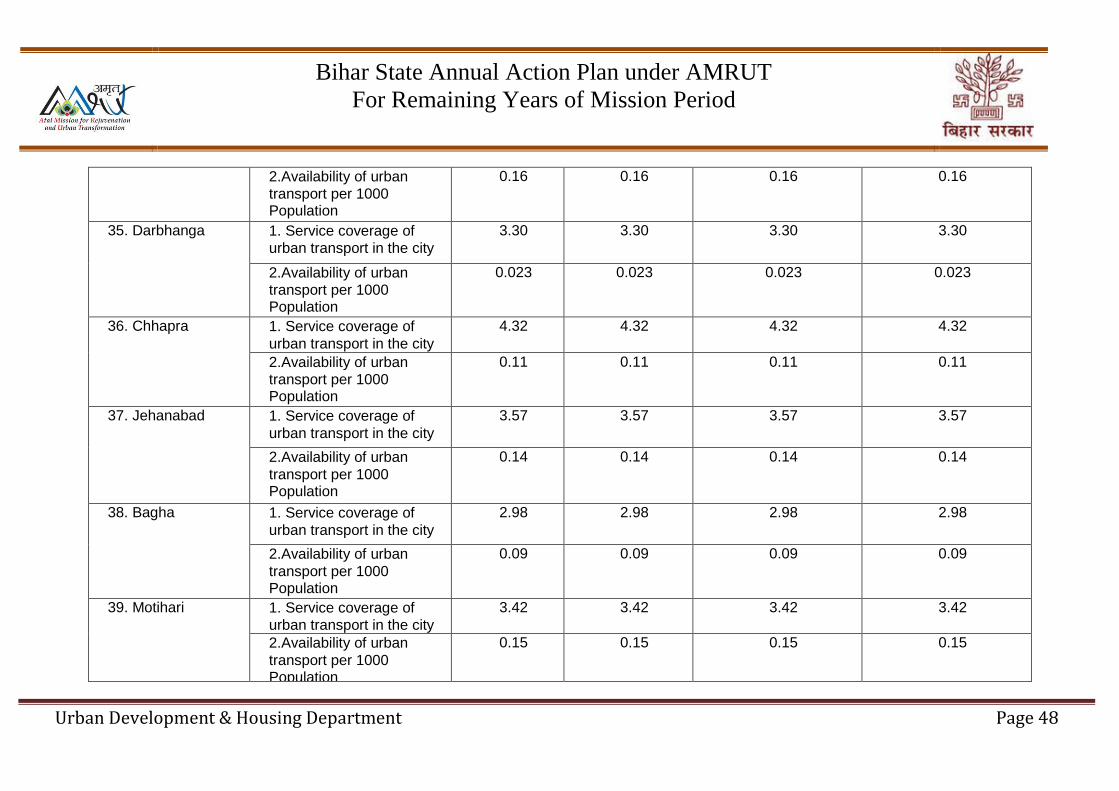
2.Availability of urban
transport per 1000 Population
0.16 0.16 0.16 0.16
35. Darbhanga 1. Service coverage of
urban transport in the city
3.30 3.30 3.30 3.30
2.Availability of urban
transport per 1000 Population
0.023 0.023 0.023 0.023
36. Chhapra 1. Service coverage of
urban transport in the city
4.32 4.32 4.32 4.32
2.Availability of urban
transport per 1000 Population
0.11 0.11 0.11 0.11
37. Jehanabad 1. Service coverage of
urban transport in the city
3.57 3.57 3.57 3.57
2.Availability of urban
transport per 1000 Population
0.14 0.14 0.14 0.14
38. Bagha 1. Service coverage of
urban transport in the city
2.98 2.98 2.98 2.98
2.Availability of urban
transport per 1000 Population
0.09 0.09 0.09 0.09
39. Motihari 1. Service coverage of
urban transport in the city
3.42 3.42 3.42 3.42
2.Availability of urban
transport per 1000 Population
0.15 0.15 0.15 0.15
Bihar State Annual Action Plan under AMRUT
For Remaining Years of Mission Period
Urban Development & Housing Department Page 49
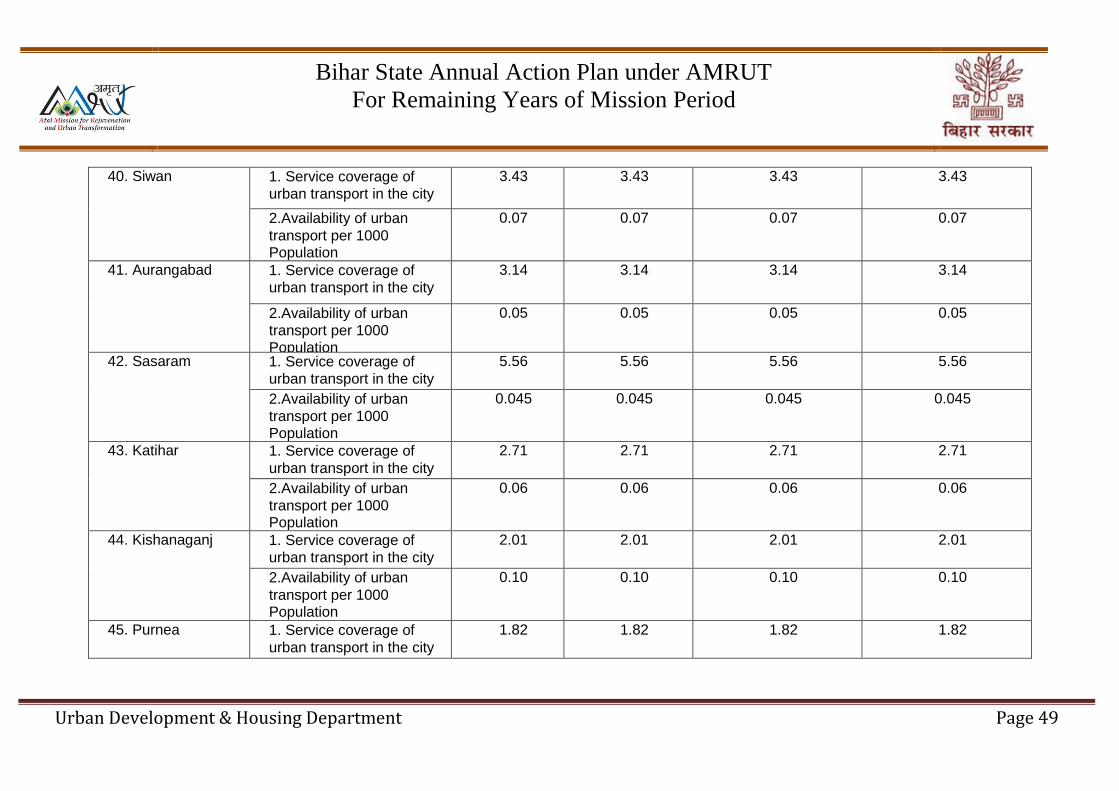
40. Siwan 1. Service coverage of
urban transport in the city
3.43 3.43 3.43 3.43
2.Availability of urban
transport per 1000 Population
0.07 0.07 0.07 0.07
41. Aurangabad 1. Service coverage of
urban transport in the city
3.14 3.14 3.14 3.14
2.Availability of urban
transport per 1000 Population
0.05 0.05 0.05 0.05
42. Sasaram 1. Service coverage of
urban transport in the city
5.56 5.56 5.56 5.56
2.Availability of urban
transport per 1000 Population
0.045 0.045 0.045 0.045
43. Katihar 1. Service coverage of
urban transport in the city
2.71 2.71 2.71 2.71
2.Availability of urban
transport per 1000 Population
0.06 0.06 0.06 0.06
44. Kishanaganj 1. Service coverage of
urban transport in the city
2.01 2.01 2.01 2.01
2.Availability of urban
transport per 1000 Population
0.10 0.10 0.10 0.10
45. Purnea 1. Service coverage of
urban transport in the city
1.82 1.82 1.82 1.82

Bihar State Annual Action Plan under AMRUT
For Remaining Years of Mission Period
Urban Development & Housing Department Page 50
2.Availability of urban
transport per 1000 Population
0.04 0.04 0.04 0.04
46. Dehri 1. Service coverage of
urban transport in the city
4.18 4.18 4.18 4.18
2.Availability of urban
transport per 1000 population
0.08 0.08 0.08 0.08
47. Bettiah 1. Service coverage of
urban transport in the city
3.87 3.87 3.87 3.87
2.Availability of urban
transport per 1000 population
0.065 0.065 0.065 0.065
48. Jamalpur 1. Service coverage of
urban transport in the city
0.91 0.91 0.91 0.91
2.Availability of urban
transport per 1000 Population
0.19 0.19 0.19 0.19
49. Saharsa 1. Service coverage of
urban transport in the city
2.24 2.24 2.24 2.24
2.Availability of urban
transport per 1000 Population
0.08 0.08 0.08 0.08
50. Bhagalpur 1. Service coverage of
urban transport in the city
4.71 4.71 4.71 4.71
2.Availability of urban
transport per 1000 Population
0.07 0.07 0.07 0.07
Bihar State Annual Action Plan under AMRUT
For Remaining Years of Mission Period
Urban Development & Housing Department Page 51
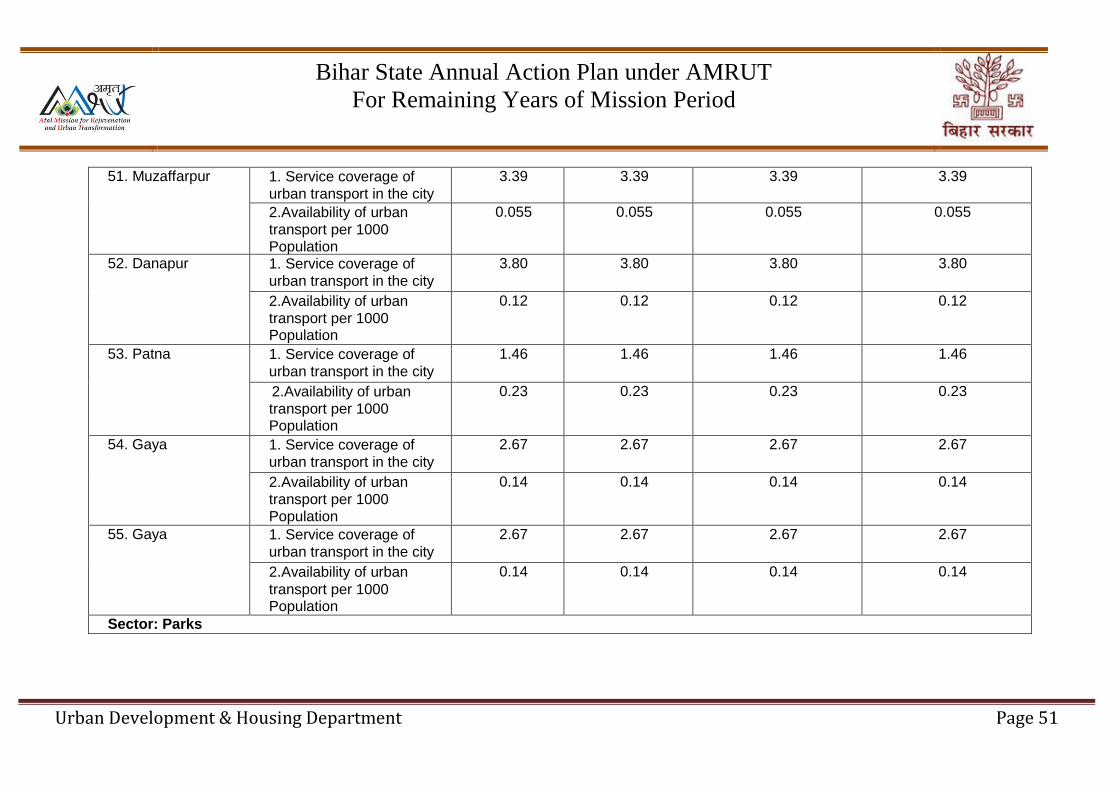
51. Muzaffarpur 1. Service coverage of
urban transport in the city
3.39 3.39 3.39 3.39
2.Availability of urban
transport per 1000 Population
0.055 0.055 0.055 0.055
52. Danapur 1. Service coverage of
urban transport in the city
3.80 3.80 3.80 3.80
2.Availability of urban
transport per 1000 Population
0.12 0.12 0.12 0.12
53. Patna 1. Service coverage of
urban transport in the city
1.46 1.46 1.46 1.46
2.Availability of urban
transport per 1000 Population
0.23 0.23 0.23 0.23
54. Gaya 1. Service coverage of
urban transport in the city
2.67 2.67 2.67 2.67
2.Availability of urban
transport per 1000 Population
0.14 0.14 0.14 0.14
55. Gaya 1. Service coverage of
urban transport in the city
2.67 2.67 2.67 2.67
2.Availability of urban
transport per 1000 Population
0.14 0.14 0.14 0.14
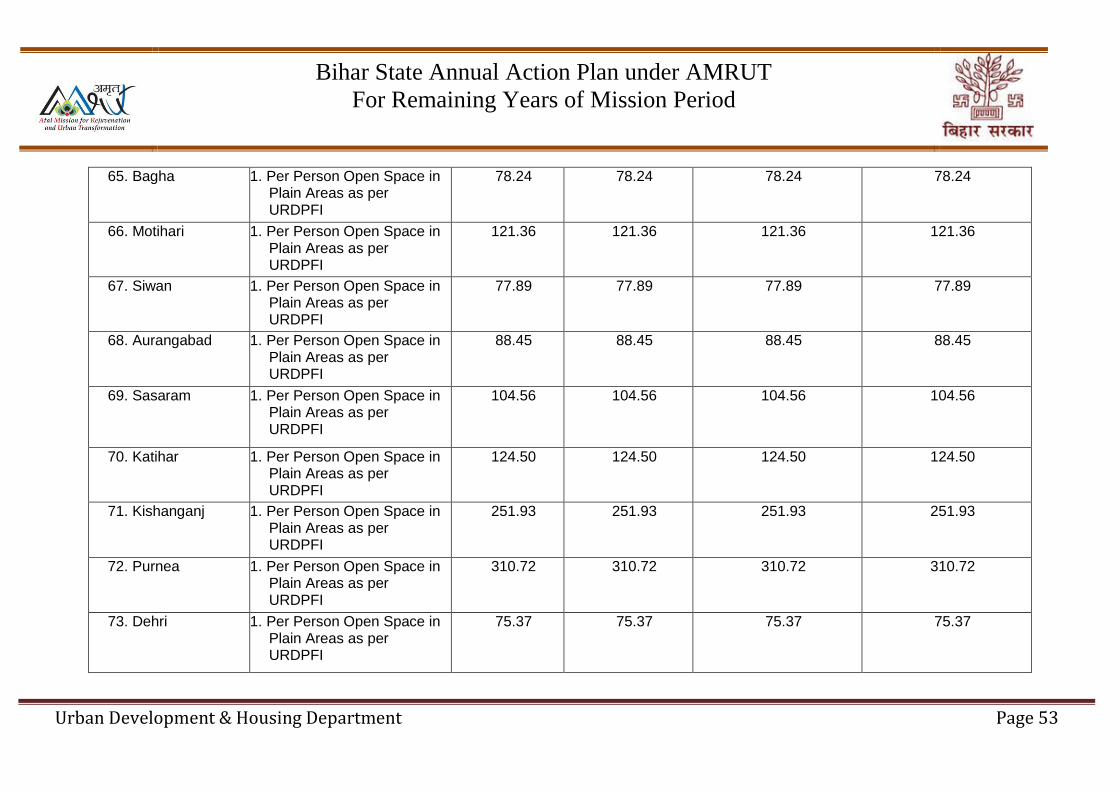
Sector: Parks

Bihar State Annual Action Plan under AMRUT
For Remaining Years of Mission Period
Urban Development & Housing Department Page 52
56.Hajipur 1. Per Person Open Space in Plain Areas as per URDPFI
110.7 110.7 110.7 110.7
57. Buxar 1. Per Person Open Space in Plain Areas as per URDPFI
99.45 99.45 99.45 99.45
58. Begusrai 1. Per Person Open Space in Plain Areas as per URDPFI
177.17 177.17 177.17 177.17
59. Munger 1. Per Person Open Space in Plain Areas as per URDPFI
68.92 68.92 68.92 68.92
60. Ara 1. Per Person Open Space in Plain Areas as per URDPFI
104.21 104.21 104.21 104.21
61. Biharsharif 1. Per Person Open Space in Plain Areas as per URDPFI
116.21 116.21 116.21 116.21
62. Darbhanga 1. Per Person Open Space in Plain Areas as per URDPFI
112.35 112.35 112.35 112.35
63. Chhapra 1. Per Person Open Space in Plain Areas as per URDPFI
52.93 52.93 52.93 52.93
64. Jehanabad 1. Per Person Open Space in Plain Areas as per URDPFI
69.56 69.56 69.56 69.56
Bihar State Annual Action Plan under AMRUT
For Remaining Years of Mission Period
Urban Development & Housing Department Page 53
65. Bagha 1. Per Person Open Space in Plain Areas as per URDPFI
78.24 78.24 78.24 78.24
66. Motihari 1. Per Person Open Space in Plain Areas as per URDPFI
121.36 121.36 121.36 121.36
67. Siwan 1. Per Person Open Space in Plain Areas as per URDPFI
77.89 77.89 77.89 77.89
68. Aurangabad 1. Per Person Open Space in Plain Areas as per URDPFI
88.45 88.45 88.45 88.45
69. Sasaram 1. Per Person Open Space in Plain Areas as per URDPFI
104.56 104.56 104.56 104.56
70. Katihar 1. Per Person Open Space in Plain Areas as per URDPFI
124.50 124.50 124.50 124.50
71. Kishanganj 1. Per Person Open Space in Plain Areas as per URDPFI
251.93 251.93 251.93 251.93
72. Purnea 1. Per Person Open Space in Plain Areas as per URDPFI
310.72 310.72 310.72 310.72
73. Dehri 1. Per Person Open Space in Plain Areas as per URDPFI
75.37 75.37 75.37 75.37
Bihar State Annual Action Plan under AMRUT
For Remaining Years of Mission Period
Urban Development & Housing Department Page 54
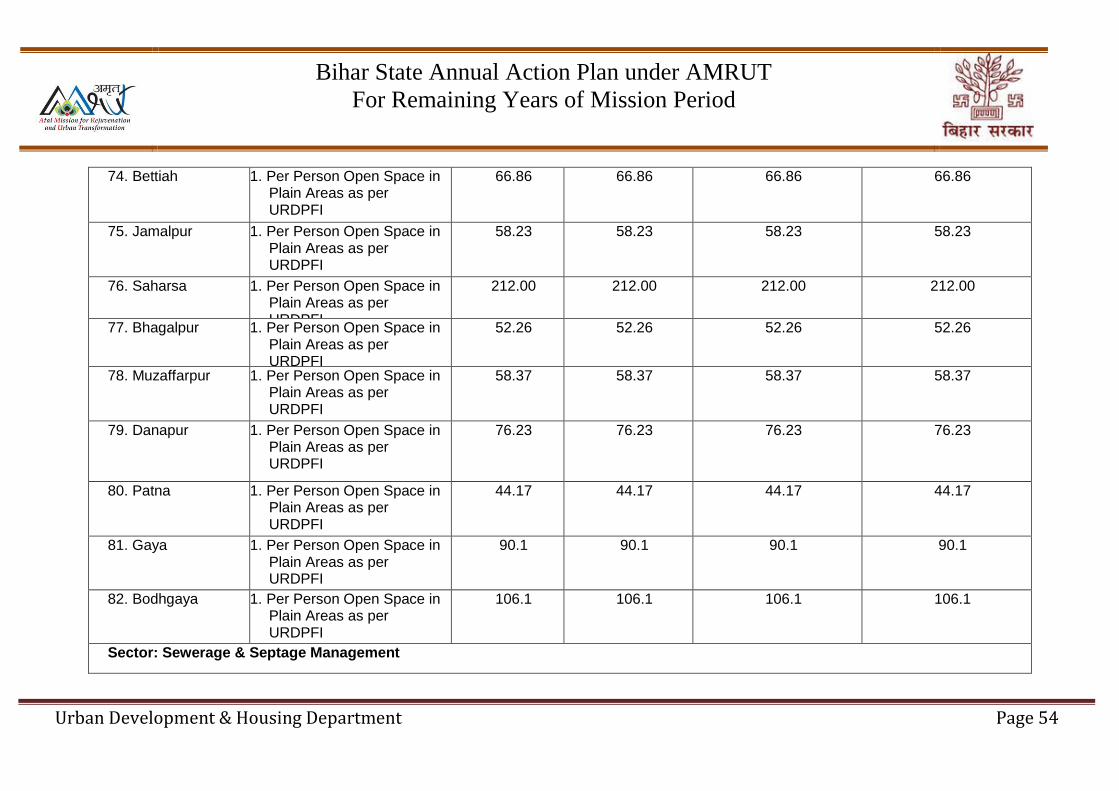
74. Bettiah 1. Per Person Open Space in Plain Areas as per URDPFI
66.86 66.86 66.86 66.86
75. Jamalpur 1. Per Person Open Space in Plain Areas as per URDPFI
58.23 58.23 58.23 58.23
76. Saharsa 1. Per Person Open Space in Plain Areas as per URDPFI
212.00 212.00 212.00 212.00
77. Bhagalpur 1. Per Person Open Space in Plain Areas as per URDPFI
52.26 52.26 52.26 52.26
78. Muzaffarpur 1. Per Person Open Space in Plain Areas as per URDPFI
58.37 58.37 58.37 58.37
79. Danapur 1. Per Person Open Space in Plain Areas as per URDPFI
76.23 76.23 76.23 76.23
80. Patna 1. Per Person Open Space in Plain Areas as per URDPFI
44.17 44.17 44.17 44.17
81. Gaya 1. Per Person Open Space in Plain Areas as per URDPFI
90.1 90.1 90.1 90.1
82. Bodhgaya 1. Per Person Open Space in Plain Areas as per URDPFI
106.1 106.1 106.1 106.1
Sector: Sewerage & Septage Management
Bihar State Annual Action Plan under AMRUT
For Remaining Years of Mission Period
Urban Development & Housing Department Page 55
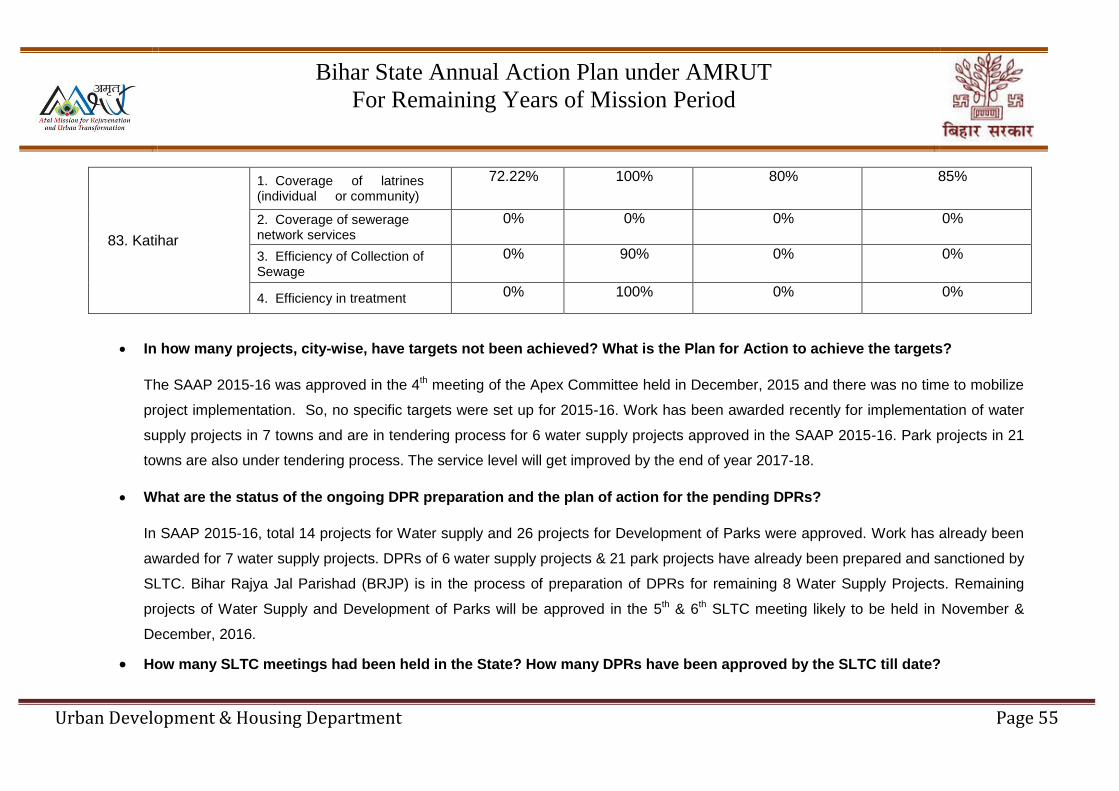
83. Katihar
1. Coverage of latrines (individual or community)
72.22% 100% 80% 85%
2. Coverage of sewerage network services
0% 0% 0% 0%
3. Efficiency of Collection of Sewage
0% 90% 0% 0%
4. Efficiency in treatment 0% 100% 0% 0%
In how many projects, city-wise, have targets not been achieved? What is the Plan for Action to achieve the targets?
The SAAP 2015-16 was approved in the 4th meeting of the Apex Committee held in December, 2015 and there was no time to mobilize
project implementation. So, no specific targets were set up for 2015-16. Work has been awarded recently for implementation of water
supply projects in 7 towns and are in tendering process for 6 water supply projects approved in the SAAP 2015-16. Park projects in 21
towns are also under tendering process. The service level will get improved by the end of year 2017-18.
What are the status of the ongoing DPR preparation and the plan of action for the pending DPRs?
In SAAP 2015-16, total 14 projects for Water supply and 26 projects for Development of Parks were approved. Work has already been
awarded for 7 water supply projects. DPRs of 6 water supply projects & 21 park projects have already been prepared and sanctioned by
SLTC. Bihar Rajya Jal Parishad (BRJP) is in the process of preparation of DPRs for remaining 8 Water Supply Projects. Remaining
projects of Water Supply and Development of Parks will be approved in the 5th & 6th SLTC meeting likely to be held in November &
December, 2016.
How many SLTC meetings had been held in the State? How many DPRs have been approved by the SLTC till date?
Bihar State Annual Action Plan under AMRUT
For Remaining Years of Mission Period
Urban Development & Housing Department Page 56
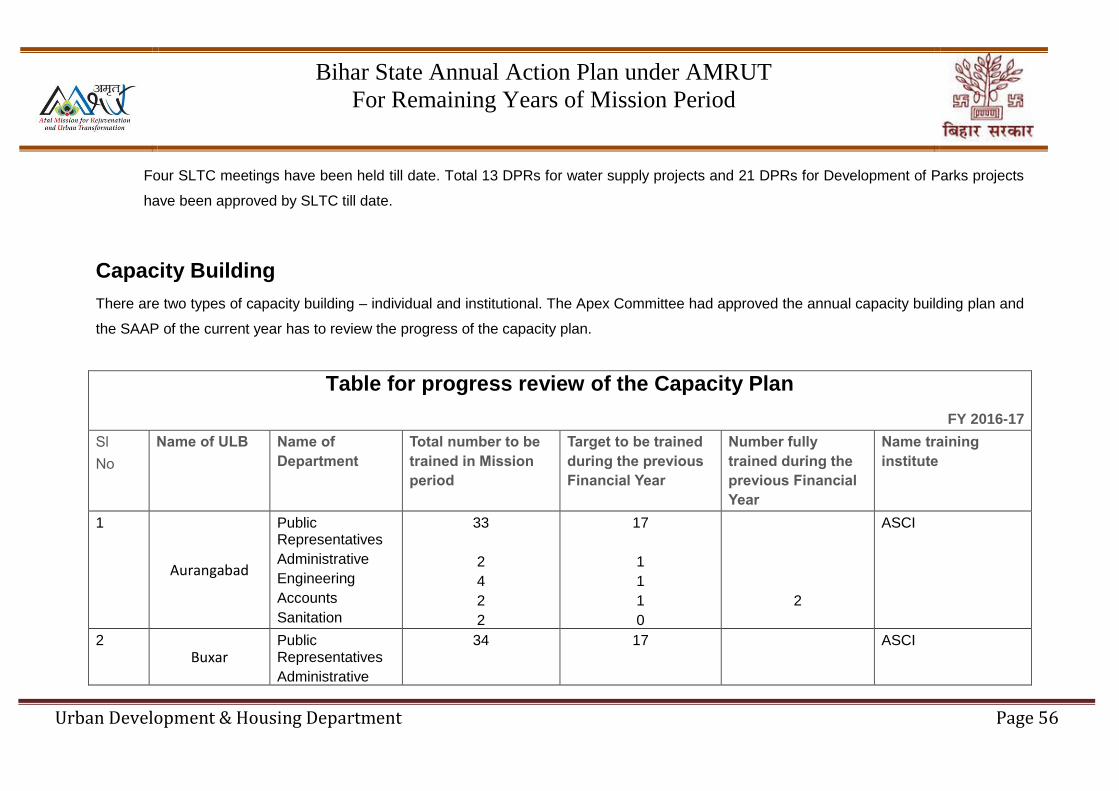
Four SLTC meetings have been held till date. Total 13 DPRs for water supply projects and 21 DPRs for Development of Parks projects
have been approved by SLTC till date.
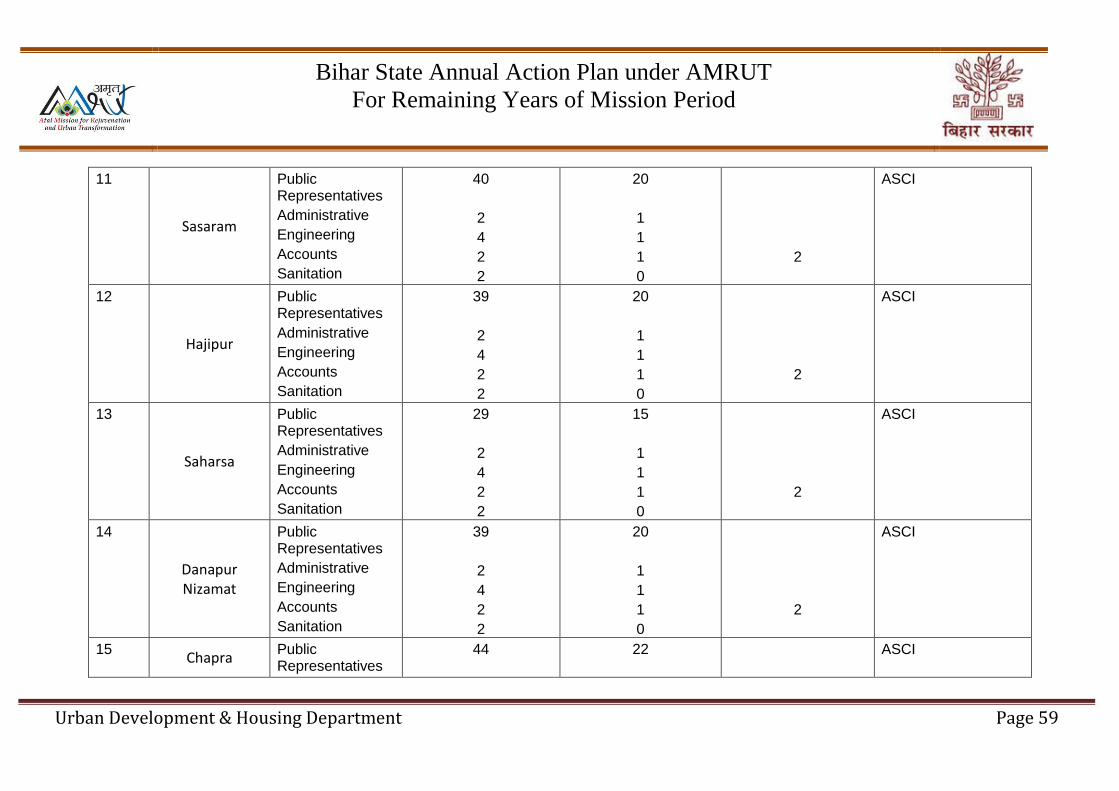
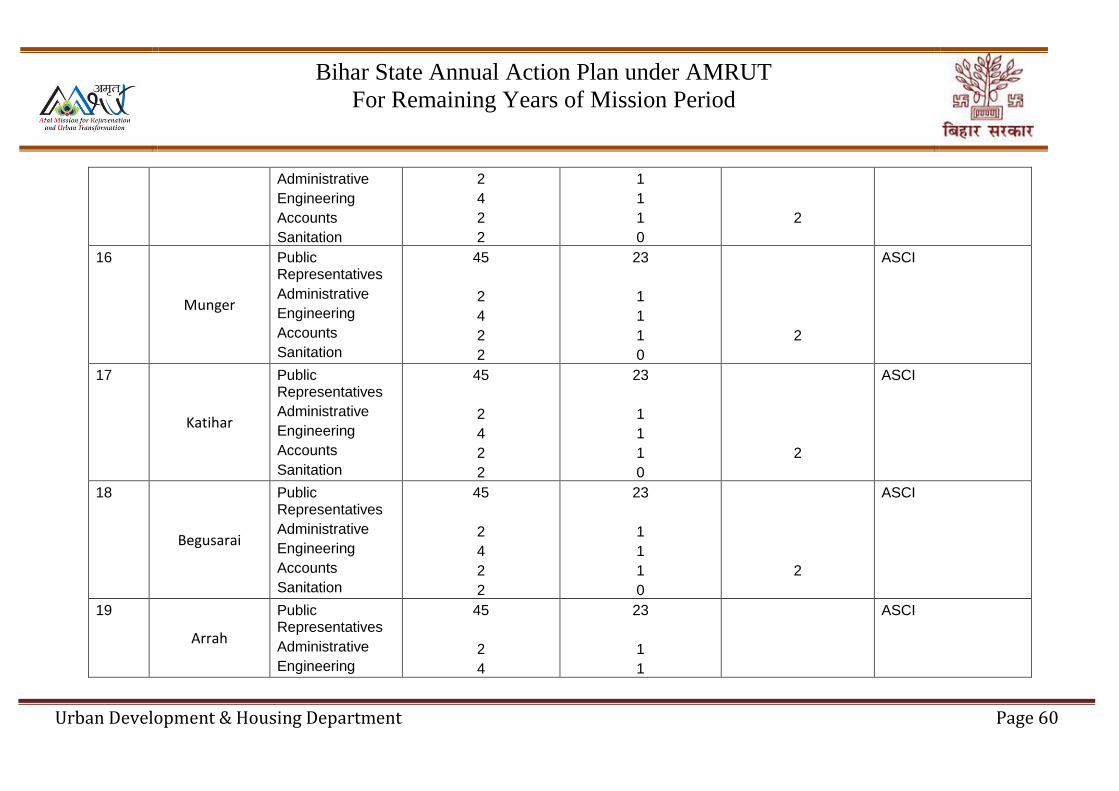
Capacity Building
There are two types of capacity building – individual and institutional. The Apex Committee had approved the annual capacity building plan and
the SAAP of the current year has to review the progress of the capacity plan.
Table for progress review of the Capacity Plan
FY 2016-17
Sl
No
Name of ULB Name of
Department
Total number to be
trained in Mission
period
Target to be trained
during the previous
Financial Year
Number fully
trained during the
previous Financial
Year
Name training
institute
1
Aurangabad
Public Representatives
Administrative
Engineering
Accounts
Sanitation
33
2
4
2
2
17
1
1
1
0
2
ASCI
2 Buxar
Public Representatives
Administrative
34
17
ASCI

Bihar State Annual Action Plan under AMRUT
For Remaining Years of Mission Period
Urban Development & Housing Department Page 57
Engineering
Accounts
Sanitation
2
4
2
2
1
1
1
0
2
3
Jehanabad
Public Representatives
Administrative
Engineering
Accounts
Sanitation
33
2
4
2
2
17
1
1
1
0
2
ASCI
4
Jamalpur
Public Representatives
Administrative
Engineering
Accounts
Sanitation
36
2
4
2
2
18
1
1
1
0
2
ASCI
5
Kishanganj
Public Representatives
Administrative
Engineering
Accounts
Sanitation
34
2
4
2
2
17
1
1
1
0
2
ASCI
6
Bagaha
Public Representatives
Administrative
Engineering
35
2
4
18
1
1
ASCI

Bihar State Annual Action Plan under AMRUT
For Remaining Years of Mission Period
Urban Development & Housing Department Page 58
Accounts
Sanitation
2
2
1
0
2
7
Motihari
Public Representatives
Administrative
Engineering
Accounts
Sanitation
38
2
4
2
2
19
1
1
1
0
2
ASCI
8
Bettiah
Public Representatives
Administrative
Engineering
Accounts
Sanitation
39
2
4
2
2
20
1
1
1
0
2
ASCI
9
Siwan
Public Representatives
Administrative
Engineering
Accounts
Sanitation
38
2
4
2
2
19
1
1
1
0
2
ASCI
10
Dehri
Public Representatives
Administrative
Engineering
Accounts
Sanitation
40
2
4
2
2
20
1
1
1
0
2
ASCI
Bihar State Annual Action Plan under AMRUT
For Remaining Years of Mission Period
Urban Development & Housing Department Page 59
11
Sasaram
Public Representatives
Administrative
Engineering
Accounts
Sanitation
40
2
4
2
2
20
1
1
1
0
2
ASCI
12
Hajipur
Public Representatives
Administrative
Engineering
Accounts
Sanitation
39
2
4
2
2
20
1
1
1
0
2
ASCI
13
Saharsa
Public Representatives
Administrative
Engineering
Accounts
Sanitation
29
2
4
2
2
15
1
1
1
0
2
ASCI
14
Danapur Nizamat
Public Representatives
Administrative
Engineering
Accounts
Sanitation
39
2
4
2
2
20
1
1
1
0
2
ASCI
15 Chapra
Public Representatives
44
22
ASCI
Bihar State Annual Action Plan under AMRUT
For Remaining Years of Mission Period
Urban Development & Housing Department Page 60
Administrative
Engineering
Accounts
Sanitation
2
4
2
2
1
1
1
0
2
16
Munger
Public Representatives
Administrative
Engineering
Accounts
Sanitation
45
2
4
2
2
23
1
1
1
0
2
ASCI
17
Katihar
Public Representatives
Administrative
Engineering
Accounts
Sanitation
45
2
4
2
2
23
1
1
1
0
2
ASCI
18
Begusarai
Public Representatives
Administrative
Engineering
Accounts
Sanitation
45
2
4
2
2
23
1
1
1
0
2
ASCI
19
Arrah
Public Representatives
Administrative
Engineering
45
2
4
23
1
1
ASCI

Bihar State Annual Action Plan under AMRUT
For Remaining Years of Mission Period
Urban Development & Housing Department Page 61
Accounts
Sanitation
2
2
1
0
2
20
Purnia
Public Representatives
Administrative
Engineering
Accounts
Sanitation
46
2
4
2
2
23
1
1
1
0
2
ASCI
21
Darbhanga
Public Representatives
Administrative
Engineering
Accounts
Sanitation
48
2
4
2
2
24
1
1
1
0
2
ASCI
22
Biharsharif
Public Representatives
Administrative
Engineering
Accounts
Sanitation
46
2
4
2
2
23
1
1
1
0
2
ASCI
23
Muzaffarpur
Public Representatives
Administrative
Engineering
Accounts
Sanitation
49
2
4
2
2
25
1
1
1
0
2
ASCI

Bihar State Annual Action Plan under AMRUT
For Remaining Years of Mission Period
Urban Development & Housing Department Page 62
24
Bhagalpur
Public Representatives
Administrative
Engineering
Accounts
Sanitation
51
2
4
2
2
26
1
1
1
0
2
ASCI
25
Gaya
Public Representatives
Administrative
Engineering
Accounts
Sanitation
53
2
4
2
2
27
1
1
1
0
2
ASCI
26
Bodhgaya
Public Representatives
Administrative
Engineering
Accounts
Sanitation
19
1
2
2
1
0
0
0
0
0
0
ASCI
27
Patna
Public Representatives
Administrative
Engineering
Accounts
Sanitation
72
8
13
2
2
36
1
1
1
0
13
ASCI
Total 1364 633 63
Bihar State Annual Action Plan under AMRUT
For Remaining Years of Mission Period
Urban Development & Housing Department Page 63
In how many departments was training completed as approved in the SAAP of the last Financial Year? In how many
departments was training partially done and in how many departments training not done at all? Please give reasons (300
words)
Training of accounts department has been completed during last financial year and training for any other department could neither be
completed nor initiated. Training focused on strengthening municipal financial systems i.e. enhancing generation of own resources as
well as improved financial management. Special focus was given to improved budgeting in the ULBs with an attempt being made to
link service level benchmarks with financial outlays for infrastructure works. Accrual based double entry accounting is under
implementation in all ULBs as is internal audit – these will ensure that performance grant under 14th FC is accessed. Partial
training has been conducted for preparation of GIS Based Master Plans and the state has initiated procurement of services for this
intervention in the next 6 months. Through the year decentralized interactions have taken place regularly with the elected
representatives of the ULBs on issues of governance and reforms. As part of the ongoing E-Municipality intervention, decentralized
training has been conducted periodically in the 11 Municipal Corporations that are part of AMRUT on the use of the various
modules that have been rolled out. The remaining towns will receive this training in the coming year as various E-Municipality modules
are rolled out. MoU has been executed with 5 training agencies who will submit their training plan in consultation with the Mission
Director.
List out the training institutes that could not complete training of targeted functionaries. What were the reasons and how will
this be avoided in future? (tabular; 300 words)
The state has signed the MoU with ASCI & other 4 institutes for this purpose. However, the agreement was signed recently. The training
that has been conducted has been through the expertise available under the ongoing DFID funded Support Programme for Urban
Bihar State Annual Action Plan under AMRUT
For Remaining Years of Mission Period
Urban Development & Housing Department Page 64
Reforms (SPUR). In the SAAP submitted for FY 2015-16, BIPARD was identified as the training institute, however, with the exception of
one round of training for Executive Officers, no other training was conducted by the Agency on account of absence of trainers. It is
under these circumstances that the MoU was signed with ASCI & other 4 institutes..
What is the status of utilization of funds? (250 words)
No funds could be utilized during last financial year as the MoU with ASCI could take place in January to March 2016 only.
Have the participants visited best practice sites? Give details (350 words)
As part of the training of Executive Officers conducted by BIPARD, exposure visit was undertaken to Gujarat. The Team spent 2 weeks
in the state and interacted closely with the local government, visits were made to water & sewage treatment plants to understand
operations, detailed discussions and understanding on the BRT in Ahmedabad were held. On return, the Team prepared presentations
and shared key learning with the Officers of the Urban Development & Housing Department including the Principal Secretary.
Have the participants attended any national/international workshops, as per guideline (Annexure 7)? (350 words)
No participants attended any International workshops. However, only Municipal Commissioner Bhagalpur has attended workshops for
Smart City initiative organized by the Ministry of Urban Development, Govt. of India.
What is the plan of action for the pending activities, if any? (400 words)
In the immediate future, a detailed training plan will be prepared in consultation with ASCI & other 4 institutes. The Training Calendar
will be shared in advance and monitoring undertaken to ensure successful implementation.
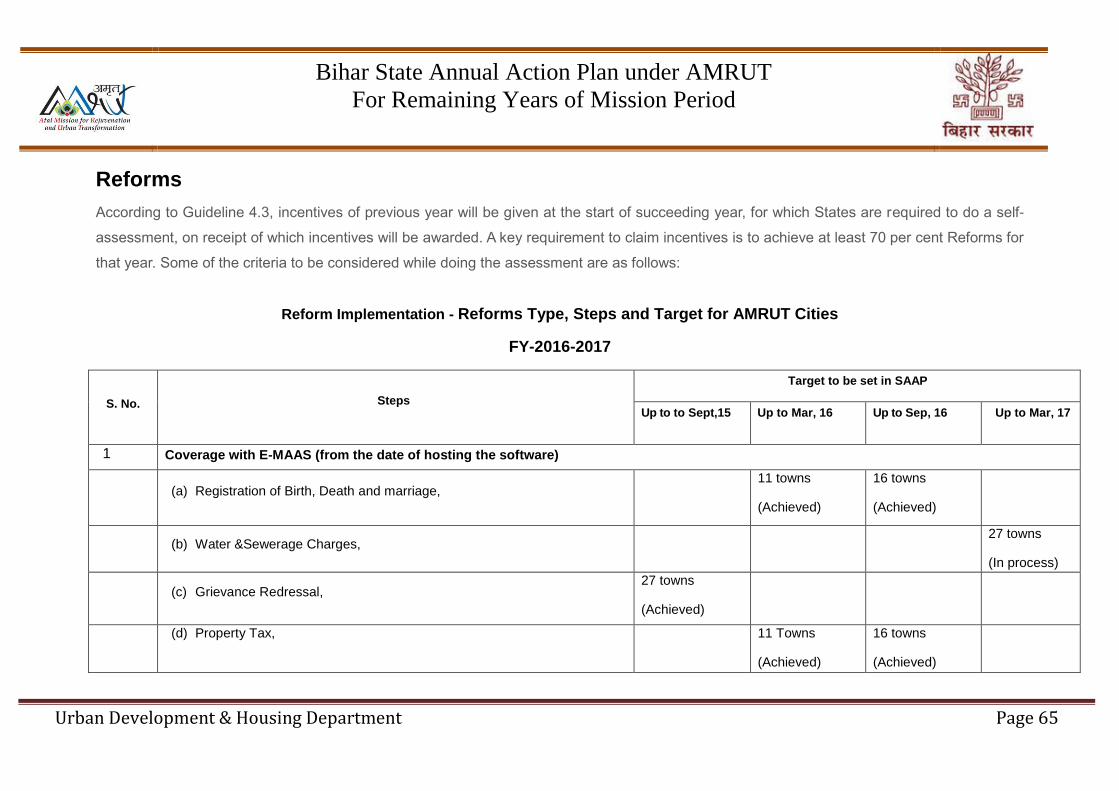
Bihar State Annual Action Plan under AMRUT
For Remaining Years of Mission Period
Urban Development & Housing Department Page 65
Reforms
According to Guideline 4.3, incentives of previous year will be given at the start of succeeding year, for which States are required to do a self-
assessment, on receipt of which incentives will be awarded. A key requirement to claim incentives is to achieve at least 70 per cent Reforms for
that year. Some of the criteria to be considered while doing the assessment are as follows:
Reform Implementation - Reforms Type, Steps and Target for AMRUT Cities
FY-2016-2017
S. No. Steps
Target to be set in SAAP
Up to to Sept,15 Up to Mar, 16 Up to Sep, 16 Up to Mar, 17
1 Coverage with E-MAAS (from the date of hosting the software)
(a) Registration of Birth, Death and marriage, 11 towns
(Achieved)
16 towns
(Achieved)
(b) Water &Sewerage Charges, 27 towns
(In process)
(c) Grievance Redressal, 27 towns
(Achieved)
(d) Property Tax,
11 Towns
(Achieved)
16 towns
(Achieved)

Bihar State Annual Action Plan under AMRUT
For Remaining Years of Mission Period
Urban Development & Housing Department Page 66
S. No. Steps
Target to be set in SAAP
Up to to Sept,15 Up to Mar, 16 Up to Sep, 16 Up to Mar, 17
(e) Advertisement tax, 11 towns
(In process)
16 towns
(In process)
(f) Issuance of Licences 11 towns
(In process)
16 towns
(In process)
(g) Building Permissions, 11 towns
(Achieved)
16 towns
(In process)
(h) Mutations, Payroll, Pension 11 towns
(In process)
16 towns
(In process)
(i) e- Procurement. 27 towns
(Achieved)
2 Establishment of municipal cadre.
All 27 ULBs
(In process)
3 Cadre linked training. All 27 ULBs
(In process)
4 Appointment of internal auditor. All 27 ULBs
(Achieved)
5 Augmenting Double entry accounting
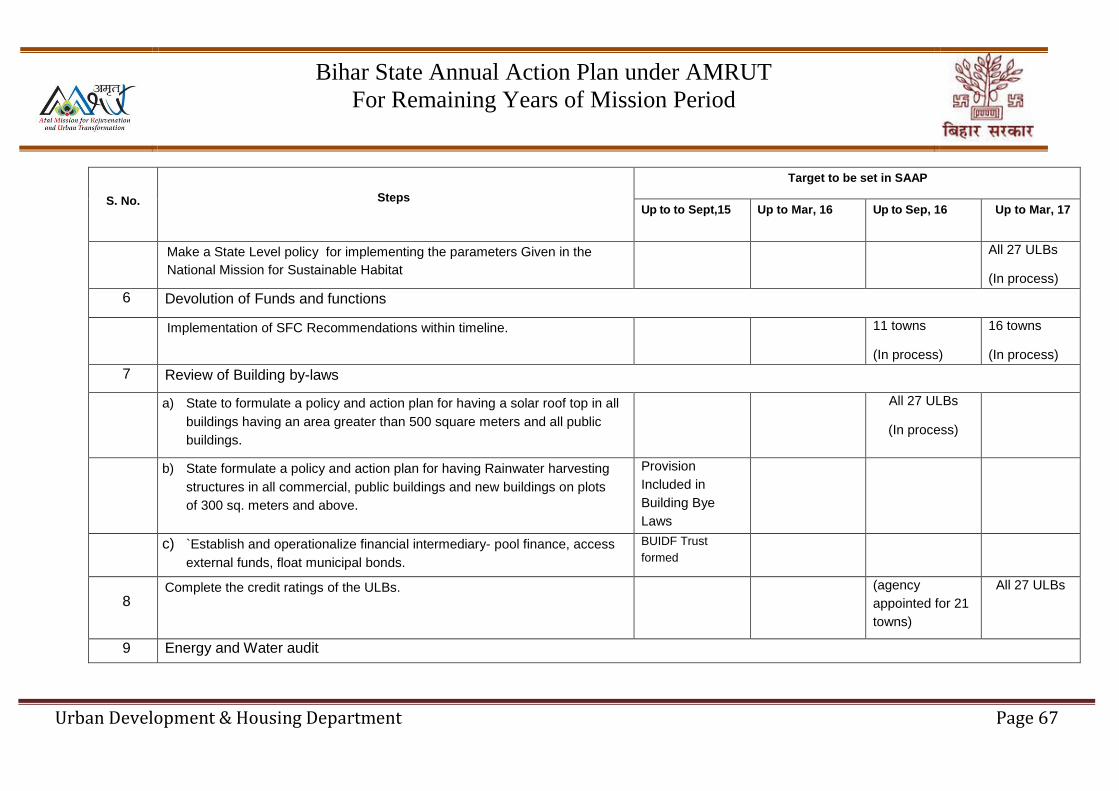
Bihar State Annual Action Plan under AMRUT
For Remaining Years of Mission Period
Urban Development & Housing Department Page 67
S. No. Steps
Target to be set in SAAP
Up to to Sept,15 Up to Mar, 16 Up to Sep, 16 Up to Mar, 17
Make a State Level policy for implementing the parameters Given in the
National Mission for Sustainable Habitat
All 27 ULBs
(In process)
6 Devolution of Funds and functions
Implementation of SFC Recommendations within timeline. 11 towns
(In process)
16 towns
(In process)
7 Review of Building by-laws
a) State to formulate a policy and action plan for having a solar roof top in all
buildings having an area greater than 500 square meters and all public
buildings.
All 27 ULBs
(In process)
b) State formulate a policy and action plan for having Rainwater harvesting
structures in all commercial, public buildings and new buildings on plots
of 300 sq. meters and above.
Provision
Included in
Building Bye
Laws
c) `Establish and operationalize financial intermediary- pool finance, access
external funds, float municipal bonds.
BUIDF Trust
formed
8 Complete the credit ratings of the ULBs. (agency
appointed for 21
towns)
All 27 ULBs
9 Energy and Water audit
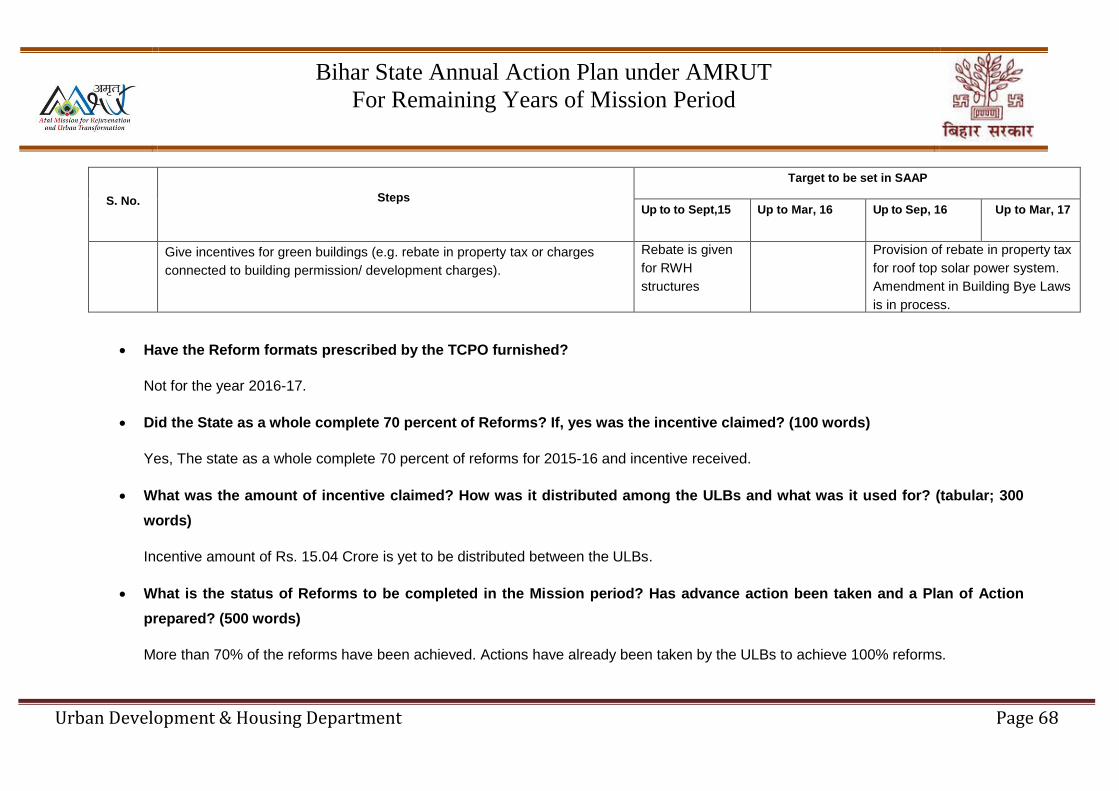
Bihar State Annual Action Plan under AMRUT
For Remaining Years of Mission Period
Urban Development & Housing Department Page 68
S. No. Steps
Target to be set in SAAP
Up to to Sept,15 Up to Mar, 16 Up to Sep, 16 Up to Mar, 17
Give incentives for green buildings (e.g. rebate in property tax or charges
connected to building permission/ development charges).
Rebate is given
for RWH
structures
Provision of rebate in property tax
for roof top solar power system.
Amendment in Building Bye Laws
is in process.
Have the Reform formats prescribed by the TCPO furnished?
Not for the year 2016-17.
Did the State as a whole complete 70 percent of Reforms? If, yes was the incentive claimed? (100 words)
Yes, The state as a whole complete 70 percent of reforms for 2015-16 and incentive received.
What was the amount of incentive claimed? How was it distributed among the ULBs and what was it used for? (tabular; 300
words)
Incentive amount of Rs. 15.04 Crore is yet to be distributed between the ULBs.
What is the status of Reforms to be completed in the Mission period? Has advance action been taken and a Plan of Action
prepared? (500 words)
More than 70% of the reforms have been achieved. Actions have already been taken by the ULBs to achieve 100% reforms.

Bihar State Annual Action Plan under AMRUT
For Remaining Years of Mission Period
Urban Development & Housing Department Page 69
Give any instances of innovation in Reform implementation. (300 words)
GIS Base Maps have been prepared for 29 of 140 towns of the state of Bihar which include mapping of all utilities and contour
generation at 0.5 meter interval. Procurement for consultants for preparation of Base Maps for 40 other towns is in the final stage. GIS
based Property survey of 5 towns completed successfully in the state which also includes GIS based unique house number generation,
house number plate fixation and it’s integration with GIS base map.
Use of A&OE
What are the items for which the A&OE has been used? (tabular; 250 words)
Rs. 9.16 Lakh has been spent on training of 63 Accounts personnel and other meetings related to AMRUT. Payment of Rs. 2.50 Crore
has been released to the e-municipality vendor. Partial payment has also been released for GIS based property survey work.
Are the items similar to the approved items in SAAP or there is any deviation? If yes, list the items with reasons (tabular; 300
words)
There is no deviation from the approved SAAP.
What is the utilization status of funds? (tabular; 250 words)
The process of hiring of professionals for PMU & PIU is almost completed and likely to be appointed in the month of November, 2016.
Only minor amount has been spent on training of Accounts Personnel only.
Has the IRMA been appointed? What was the procedure followed?(250 words)

Bihar State Annual Action Plan under AMRUT
For Remaining Years of Mission Period
Urban Development & Housing Department Page 70
IRMA has not yet been appointed as the implementation is not yet started. MoUD, GoI will appoint the IRMA.
If not appointed, give reason for delay and the likely date of appointment (100 words)
IRMA has not yet been appointed as the implementation is not yet started. Will be appointed by MoUD, GoI.
Have you taken up activities connected to E-Municipality as a Service (E-MAAS)? Please give details. (250 words)
Yes, Five important modules (i) Website of ULB & Computerized Citizen’s Facility Center (ii) Birth & Death Certificates (iii) Online
Property Tax Collection (iv) Online Building Plan Approval and (v) online RTI applications disposal system have been made go live in all
27 ULBs and being used by the citizens.
Have you displayed the logo and tagline of AMRUT prominently on all projects? Please give list. (tabular; 100 words)
Implementation of WS projects has started recently. AMRUT logo and tagline will be prominently displayed during and after
implementation of projects.
Have you utilized the funds on any of the inadmissible components (para 4.4)? If yes, give list and reasons. (tabular; 350
words)
Fund have not been utilized on any inadmissible components.
Funds flow

Bihar State Annual Action Plan under AMRUT
For Remaining Years of Mission Period
Urban Development & Housing Department Page 71
Govt. of Bihar recognizes that one reason for project delay has been delayed release of funds. In the following table the status of funds release
and resource mobilization are indicated.
Table indicating the status of funds release and resource mobilization
FY 2016-17
(Amount in Rs. Crores)
S. No
City name Project name
Funds flow
GoI (Approval of SAAP-2015-16 in
4th Apex committee meeting)
GoI (Approval of SAAP-2016-17 in
12th Apex committee meeting)
State (Approval in
SHPSC meeting on 04-03-16 & 16-09-
16)
ULB/ Others Total funds flow to project
Total spent
on project
Approved
amount
Disbursed
Approved
amount
Disbursed
Approved
amount
Disbursed
Approved amount
Disbursed
1 Biharshariff Water Supply 37.37 7.474 0.00 0.000 22.271 4.484 14.847 0 11.958 0
2 Sasaram Water Supply 0.00 37.92 7.584 0 0.000 0
3 Dehri Water Supply 0.00 41.43 8.286 0 0.000 0
4 Ara Water Supply 37.27 7.453 0.00 0.000 22.325 4.472 14.883 0 11.925 0
5 Buxar Water Supply 14.66 2.932 0.00 0.000 8.814 1.759 5.876 0 4.691 0
6 Motihari Water Supply 17.48 3.496 0.00 0.000 9.620 2.098 6.413 0 5.594 0
7 Bettiah Water Supply 0.00 49.84 9.968 0 0.000 0

Bihar State Annual Action Plan under AMRUT
For Remaining Years of Mission Period
Urban Development & Housing Department Page 72
8 Bagha Water Supply 16.06 3.211 0.00 0.000 8.909 1.927 5.939 0 5.138 0
9 Hajipur Water Supply 20.55 4.110 0.00 0.000 11.537 2.466 7.692 0 6.576 0
10 Begusarai Water Supply 34.55 6.910 0.00 0.000 20.517 4.146 13.678 0 11.056 0
11 Munger Water Supply 29.66 5.931 0.000 3.559 0 9.490 0
12 Jamalpur Water Supply 14.00 2.800 0 0.000 0
13 Aurangabad Water Supply 14.58 2.915 0.00 0.000 8.931 1.749 5.954 0 4.664 0
14 Jehanabad Water Supply 14.71 2.942 0.00 0.000 8.783 1.765 5.855 0 4.707 0
15 Purnea Water Supply 39.49 7.897 0 0.000 0
16 Katihar Water Supply 0.00 49.48 9.895 0 0.000 0
17 Kishanganj Water Supply 15.14 3.027 0.00 0.000 8.545 1.816 5.696 0 4.843 0
18 Chhapra Water Supply 28.09 5.618 0.00 0.000 16.877 3.371 11.251 0 8.989 0
19 Siwan Water Supply 18.65 3.730 0.00 0.000 11.154 2.238 7.436 0 5.968 0
20 Darbhanga Water Supply 24.93 4.985 0.00 0.000 20.400 2.991 13.600 0 7.976 0
21 Saharsa Water Supply 0.00 81.76 16.352 0 0.000 0
22 Bhagalpur Drainage 12.00 2.400 0 0.000 0
23 Muzaffarpur Drainage 49.95 9.990 0 0.000 0
24 Patna Parks 0.93 0.186 1.54 0.308 0.112 0 0.298 0
25 Danapur Parks 0.25 0.05 0.000 0.030 0 0.080 0
26 Biharshariff Parks 0.25 0.05 0.50 0.100 0.178 0.030 0.119 0 0.080 0
27 Sasaram Parks 0.25 0.05 0.000 0.146 0.030 0.097 0 0.080 0
28 Dehri Parks 0.25 0.05 0.25 0.050 0.153 0.030 0.102 0 0.080 0
29 Ara Parks 0.25 0.05 0.25 0.050 0.030 0 0.080 0
30 Buxar Parks 0.25 0.05 0.000 0.130 0.030 0.087 0 0.080 0
31 Mujaffarpur Parks 0.25 0.05 1.80 0.360 0.030 0 0.080 0

Bihar State Annual Action Plan under AMRUT
For Remaining Years of Mission Period
Urban Development & Housing Department Page 73
32 Motihari Parks 0.25 0.05 0.31 0.062 0.342 0.030 0.228 0 0.080 0
33 Bettiah Parks 0.25 0.05 0.25 0.050 0.143 0.030 0.095 0 0.080 0
34 Bagha Parks 0.25 0.05 0.000 0.030 0 0.080 0
35 Hajipur Parks 0.25 0.05 0.25 0.050 0.163 0.030 0.109 0 0.080 0
36 Begusarai Parks 0.25 0.05 0.72 0.144 0.030 0 0.080 0
37 Munger Parks 0.5 0.1 0.75 0.150 0.277 0.060 0.185 0 0.160 0
38 Jamalpur Parks 0.25 0.05 0.00 0.000 0.298 0.030 0.199 0 0.080 0
39 Gaya Parks 0.25 0.05 1.41 0.282 1.001 0.030 0.668 0 0.080 0
40 Bodhgaya 0.25 0.050 0 0.000 0
41 Aurangabad Parks 0.25 0.05 0.25 0.050 0.158 0.030 0.105 0 0.080 0
42 Jehanabad Parks 0.25 0.05 0.25 0.050 0.030 0 0.080 0
43 Purnea Parks 0.5 0.1 0.96 0.192 0.866 0.060 0.577 0 0.160 0
44 Katihar Parks 0.5 0.1 0.00 0.000 0.627 0.060 0.418 0 0.160 0
45 Kishanganj Parks 0.25 0.05 0.25 0.050 0.235 0.030 0.157 0 0.080 0
46 Chhapra Parks 0.5 0.1 0.25 0.050 0.326 0.060 0.217 0 0.160 0
47 Siwan Parks 0.25 0.05 0.25 0.050 0.189 0.030 0.126 0 0.080 0
48 Darbhanga Parks 0.25 0.05 0.50 0.100 0.249 0.030 0.166 0 0.080 0
49 Bhagalpur Parks 0.5 0.1 0.75 0.150 0.316 0.060 0.210 0 0.160 0
50 Saharsa Parks 0.25 0.05 0.00 0.000 0.148 0.030 0.099 0 0.080 0
Total 332.100 66.420 387.600 77.520 184.628 39.852 123.085 0.000 106.272 0.000
In how many projects, city-wise, has the full funds been sanctioned and disbursed?

Bihar State Annual Action Plan under AMRUT
For Remaining Years of Mission Period
Urban Development & Housing Department Page 74
Total 13 projects for Water Supply and 21 projects for Development of Parks were approved by the 2nd & 4th Meeting of the High
Powered Steering Committee for the AMRUT Mission based on recommendation of State Level Technical Committee. The GoI share &
State share has been disbursed to all 14 ULBs for Water Supply projects and to all 26 ULBs for development of parks.
Identify projects where delay in funds release led to delay in project implementation?
Work has been awarded for 7 water supply projects approved by SHPSC. The remaining projects approved by SHPSC are in the
tendering process and there seems to be no delay due to release of funds.
Give instances of doing more with less during implementation.
Since implementation of 7 water supply projects has begun recently, such assessment could not be done.
Funds disbursements and Conditions
How many project fund request has been made to the GoI?
The funds released by Govt. of India (1st installment) has not yet been utilized. Therefore, no request has been made for fund against
the projects sanctioned in SAAP 2015-16. Implementation of projects sanctioned in SAAP 2016-17 have not yet started, therefore, no
request has been made for release of funds.
How many installments the GoI has released?

Bihar State Annual Action Plan under AMRUT
For Remaining Years of Mission Period
Urban Development & Housing Department Page 75
The first installment of i.e 20% of central assistance has been released by GoI for the year 2015-16 and 2016-17. The central
assistance and matching state share for the year 2015-16 has been released to ULBs. The central assistance and matching state share
for the year 2017-16 will be released to ULBs shortly.
Is there any observation from the GoI regarding the claims made?
No claim has been submitted by the state to the GoI.
List out the conditions imposed by the Apex Committee, State HPSC and the SLTC. Have all the conditions been complied
with? If, no identify the conditions not complied with and give reasons for non-compliance.
Sl no Conditions imposed/ Points raised by the Apex
Committee (Ref: MoM of 4th Meeting held on
10/12/2015)
Compliance Report Remarks
1 State Govt is not taking up any projects in the
sewerage sector though several AMRUT cities are
covered under Namami Gange Mission. It was
suggested that the sewerage projects in these cities
other than I & D and STP should be taken up in 2nd
and 3rd year of AMRUT Mission.
Although, 9 cities are also
covered in Namami Gange
scheme, sewerage projects are
ongoing in 5 cities (Patna,
Hajipur, Buxar, Begusarai &
Munger). The sewerage is not
the priority of the state as the
water supply service levels have
It was advised in a meeting held in
the Ministry of Water Resources,
River Development & Ganga
Rejuvenation to review the status of
Namami Gange Projects that all
DPRs for Sewerage projects should
be submitted to MoUD separately.

Bihar State Annual Action Plan under AMRUT
For Remaining Years of Mission Period
Urban Development & Housing Department Page 76
not yet been achieved in the
towns. Sewerage Project of
Gaya is being taken up under
ADB funded program.
2. Need of drainage management was emphasized,
Bihar being a flood prone area.
Drainage of Bhagalpur town has
been included as a new
provision in place of deleted
sewerage projects. In SAAP
2016-17, projects for Bhagalpur
and Muzaffarpur have been
approved. In SAAP for
remaining years Patna Drainage
project for flood prone area
during monsoon has been taken
up.
Septage Management project with
fecal Sludge Management system
for Katihar has been proposed in
the SAAP for remaining years.
3 No incomplete projects of JNNURM should be
taken up under AMRUT
Not taken up
4 No projects should be approved by SLTC which Complied while sanctioning

Bihar State Annual Action Plan under AMRUT
For Remaining Years of Mission Period
Urban Development & Housing Department Page 77
do not have land available the 9 WS projects + 14 park
development projects by
SLTC
5 Action plan for recycling/reuse of waste water
should be placed before SLTC at the time of DPR
approval
No Waste water project has
been sanctioned in SAAP
2015-16 & 2016-17.
6 Should try for convergence of AMRUT, Namami
Gange and SBM
Complied. WS projects
ongoing under State Plan
have been shown in
convergence.
7 Break up of coverage with sewerage network and
septage may be clearly brought out
Only one project of septage
management (Fecal Sludge
Management) has been
proposed in current SAAP>
8 SAAP should be based on SSR not market rate Complied The rates of items available in
State SoR have been taken from
SOR and the Non SoR rates from

Bihar State Annual Action Plan under AMRUT
For Remaining Years of Mission Period
Urban Development & Housing Department Page 78
CPWD SoR & Market rate.
9 Water quality should be analyzed at Consumer
end
It will be made part of the
terms of the work contracts.
10. Capacity Building details to be provided to NIUA /
MoUD
Complied
11. Implementation of reforms should be broken up
into activities with Timeline and sent to TCPO by
the State Mission Director.
Action Plan for reforms
implementation is given in
table above under Reforms.
Chapter 3: STATE ANNUAL ACTION PLAN (SAAP) for the Remaining Years of Mission Period
The SAAPs are aggregated from the SLIPs. The Master Plan of projects and the state level plan are filled out as below for achieving service
levels in various sectors.
Table3.5: SAAP- State level Plan for Achieving Service Level Benchmarks
Current Mission period 2015-20 For the Mission Period
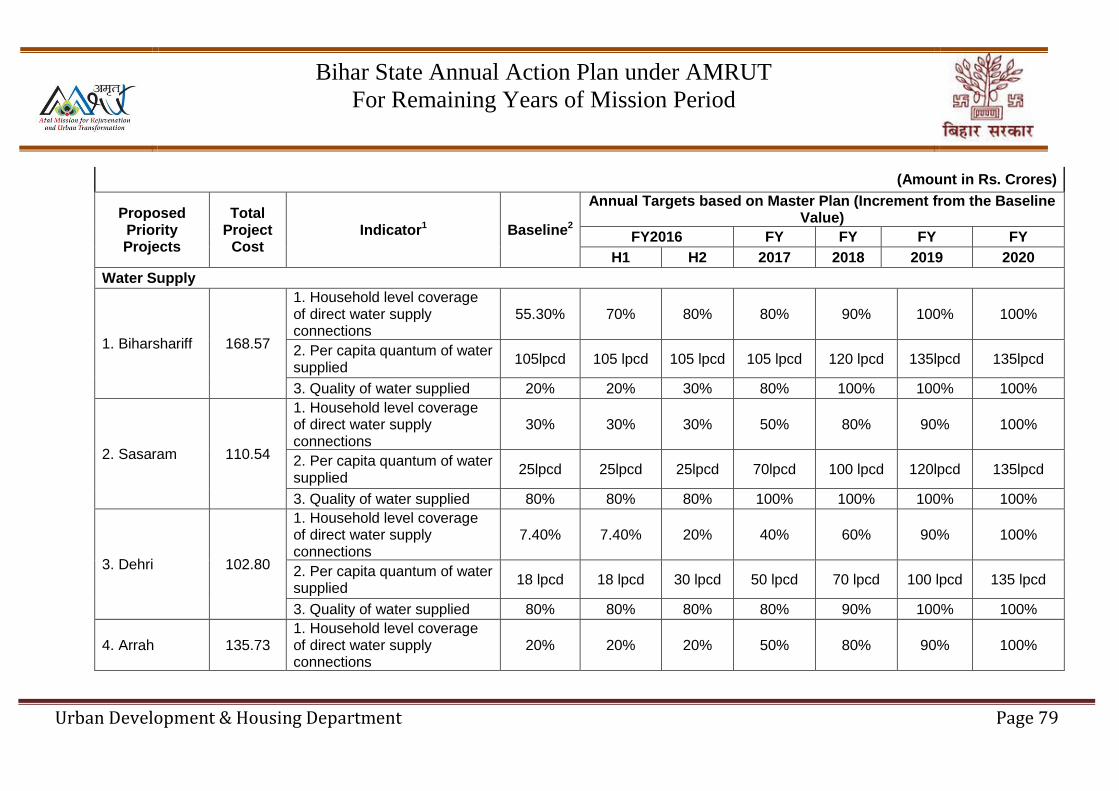
Bihar State Annual Action Plan under AMRUT
For Remaining Years of Mission Period
Urban Development & Housing Department Page 79
(Amount in Rs. Crores)
Proposed Priority Projects
Total Project
Cost Indicator1
Baseline2
Annual Targets based on Master Plan (Increment from the Baseline Value)
FY2016 FY FY FY FY
H1 H2 2017 2018 2019 2020
Water Supply
1. Biharshariff 168.57
1. Household level coverage of direct water supply connections
55.30% 70% 80% 80% 90% 100% 100%
2. Per capita quantum of water supplied
105lpcd 105 lpcd 105 lpcd 105 lpcd 120 lpcd 135lpcd 135lpcd
3. Quality of water supplied 20% 20% 30% 80% 100% 100% 100%
2. Sasaram 110.54
1. Household level coverage of direct water supply connections
30% 30% 30% 50% 80% 90% 100%
2. Per capita quantum of water supplied
25lpcd 25lpcd 25lpcd 70lpcd 100 lpcd 120lpcd 135lpcd
3. Quality of water supplied 80% 80% 80% 100% 100% 100% 100%
3. Dehri 102.80
1. Household level coverage of direct water supply connections
7.40% 7.40% 20% 40% 60% 90% 100%
2. Per capita quantum of water supplied
18 lpcd 18 lpcd 30 lpcd 50 lpcd 70 lpcd 100 lpcd 135 lpcd
3. Quality of water supplied 80% 80% 80% 80% 90% 100% 100%
4. Arrah 135.73 1. Household level coverage of direct water supply connections
20% 20% 20% 50% 80% 90% 100%

Bihar State Annual Action Plan under AMRUT
For Remaining Years of Mission Period
Urban Development & Housing Department Page 80
2. Per capita quantum of water supplied
30lpcd 30lpcd 30lpcd 70lpcd 100 lpcd 120lpcd 135lpcd
3. Quality of water supplied 80% 80% 80% 80% 80% 100% 100%
5. Buxar 76.91
1. Household level coverage of direct water supply connections
60% 60% 80% 90% 100% 100% 100%
2. Per capita quantum of water supplied
51lpcd 100 lpcd 100 lpcd 120 lpcd 135 lpcd 135lpcd 135lpcd
3. Quality of water supplied 100% 100% 100% 100% 100% 100% 100%
6. Motihari 114.07
1. Household level coverage of direct water supply connections
21.80% 22% 40% 50% 80% 90% 100%
2. Per capita quantum of water supplied
19lpcd 19lpcd 45lpcd 75lpcd 100 lpcd 120lpcd 135lpcd
3. Quality of water supplied 70% 70% 70% 100% 100% 100% 100%
7. Bettiah 127.88
1. Household level coverage of direct water supply connections
15.70% 15.70% 40% 60% 80% 100% 100%
2. Per capita quantum of water supplied
40 lpcd 40 lpcd 60 lpcd 80 lpcd 100 lpcd 135 lpcd 135 lpcd
3. Quality of water supplied 100% 100% 100% 100% 100% 100% 100%
8. Bagaha 184.52
1. Household level coverage of direct water supply connections
12% 12% 12% 50% 80% 90% 100%
2. Per capita quantum of water supplied
21lpcd 21lpcd 21lpcd 75lpcd 100 lpcd 120lpcd 135lpcd
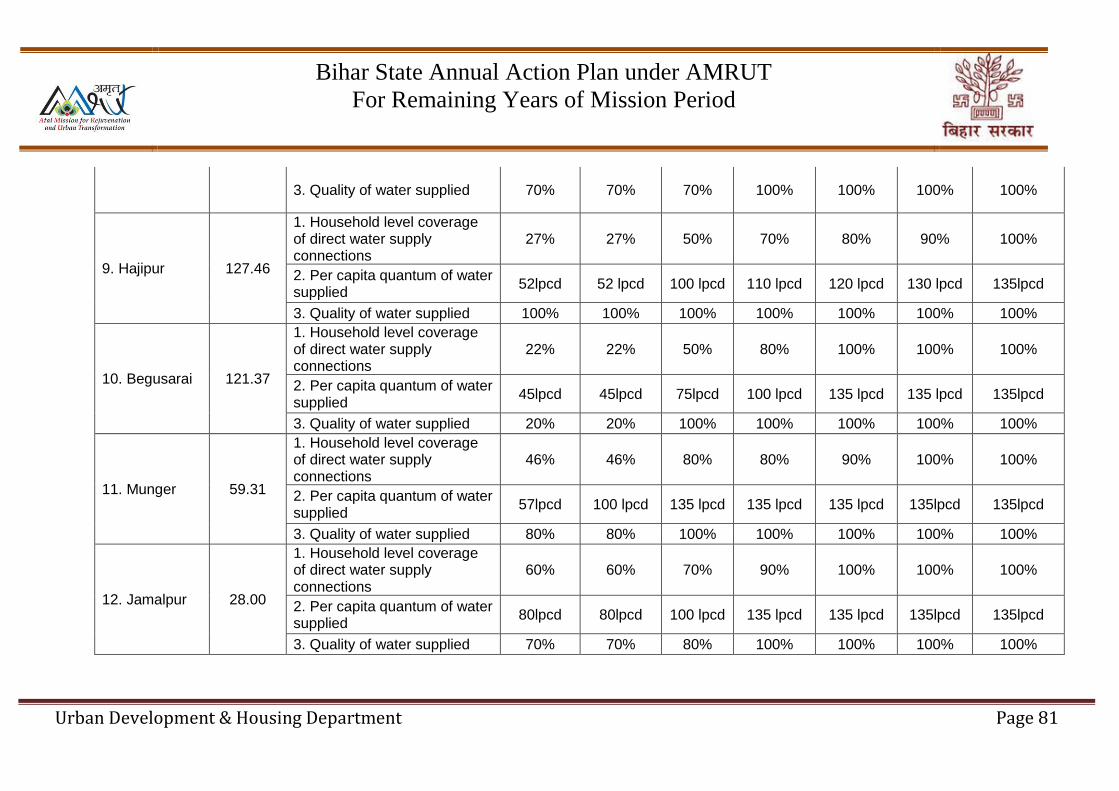
Bihar State Annual Action Plan under AMRUT
For Remaining Years of Mission Period
Urban Development & Housing Department Page 81
3. Quality of water supplied 70% 70% 70% 100% 100% 100% 100%
9. Hajipur 127.46
1. Household level coverage of direct water supply connections
27% 27% 50% 70% 80% 90% 100%
2. Per capita quantum of water supplied
52lpcd 52 lpcd 100 lpcd 110 lpcd 120 lpcd 130 lpcd 135lpcd
3. Quality of water supplied 100% 100% 100% 100% 100% 100% 100%
10. Begusarai 121.37
1. Household level coverage of direct water supply connections
22% 22% 50% 80% 100% 100% 100%
2. Per capita quantum of water supplied
45lpcd 45lpcd 75lpcd 100 lpcd 135 lpcd 135 lpcd 135lpcd
3. Quality of water supplied 20% 20% 100% 100% 100% 100% 100%
11. Munger 59.31
1. Household level coverage of direct water supply connections
46% 46% 80% 80% 90% 100% 100%
2. Per capita quantum of water supplied
57lpcd 100 lpcd 135 lpcd 135 lpcd 135 lpcd 135lpcd 135lpcd
3. Quality of water supplied 80% 80% 100% 100% 100% 100% 100%
12. Jamalpur 28.00
1. Household level coverage of direct water supply connections
60% 60% 70% 90% 100% 100% 100%
2. Per capita quantum of water supplied
80lpcd 80lpcd 100 lpcd 135 lpcd 135 lpcd 135lpcd 135lpcd
3. Quality of water supplied 70% 70% 80% 100% 100% 100% 100%
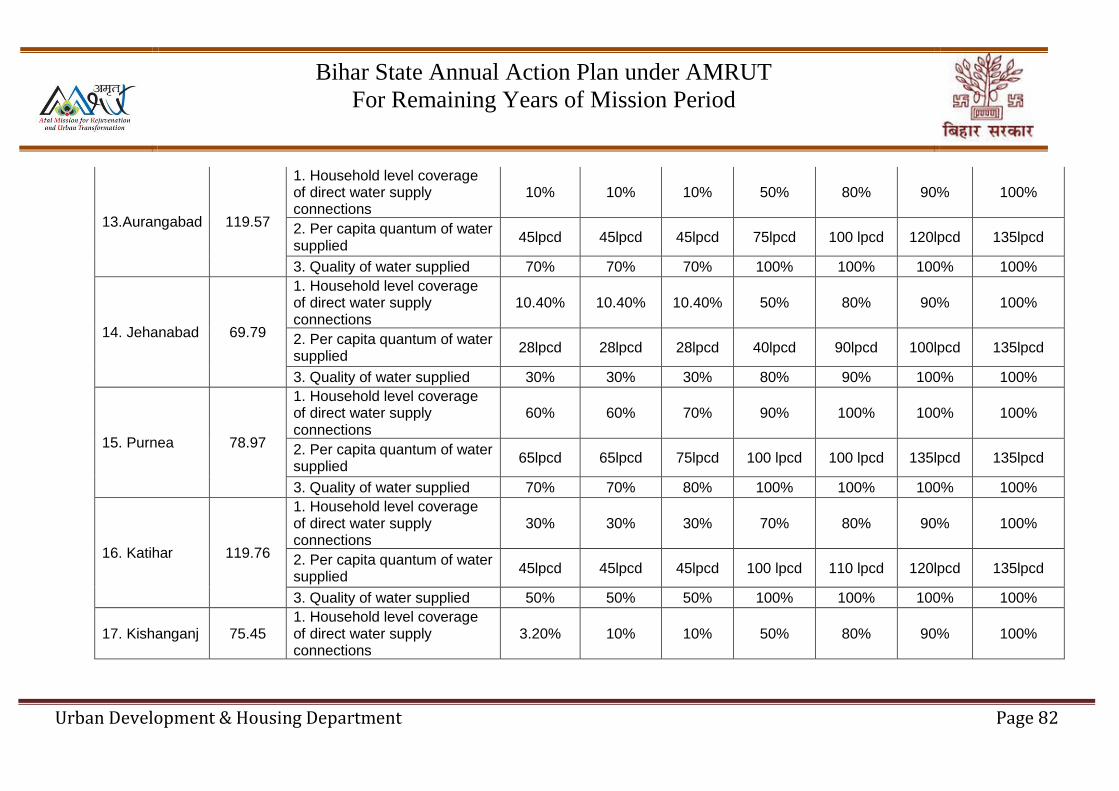
Bihar State Annual Action Plan under AMRUT
For Remaining Years of Mission Period
Urban Development & Housing Department Page 82
13.Aurangabad 119.57
1. Household level coverage of direct water supply connections
10% 10% 10% 50% 80% 90% 100%
2. Per capita quantum of water supplied
45lpcd 45lpcd 45lpcd 75lpcd 100 lpcd 120lpcd 135lpcd
3. Quality of water supplied 70% 70% 70% 100% 100% 100% 100%
14. Jehanabad 69.79
1. Household level coverage of direct water supply connections
10.40% 10.40% 10.40% 50% 80% 90% 100%
2. Per capita quantum of water supplied
28lpcd 28lpcd 28lpcd 40lpcd 90lpcd 100lpcd 135lpcd
3. Quality of water supplied 30% 30% 30% 80% 90% 100% 100%
15. Purnea 78.97
1. Household level coverage of direct water supply connections
60% 60% 70% 90% 100% 100% 100%
2. Per capita quantum of water supplied
65lpcd 65lpcd 75lpcd 100 lpcd 100 lpcd 135lpcd 135lpcd
3. Quality of water supplied 70% 70% 80% 100% 100% 100% 100%
16. Katihar 119.76
1. Household level coverage of direct water supply connections
30% 30% 30% 70% 80% 90% 100%
2. Per capita quantum of water supplied
45lpcd 45lpcd 45lpcd 100 lpcd 110 lpcd 120lpcd 135lpcd
3. Quality of water supplied 50% 50% 50% 100% 100% 100% 100%
17. Kishanganj 75.45 1. Household level coverage of direct water supply connections
3.20% 10% 10% 50% 80% 90% 100%
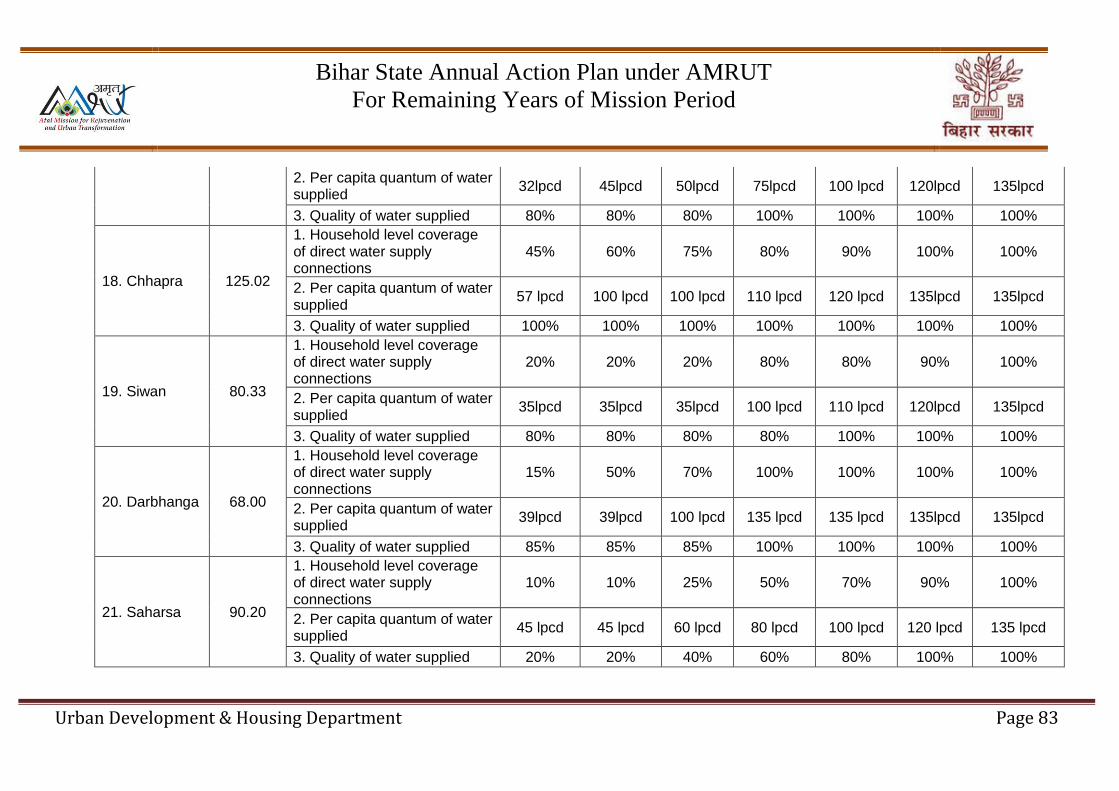
Bihar State Annual Action Plan under AMRUT
For Remaining Years of Mission Period
Urban Development & Housing Department Page 83
2. Per capita quantum of water supplied
32lpcd 45lpcd 50lpcd 75lpcd 100 lpcd 120lpcd 135lpcd
3. Quality of water supplied 80% 80% 80% 100% 100% 100% 100%
18. Chhapra 125.02
1. Household level coverage of direct water supply connections
45% 60% 75% 80% 90% 100% 100%
2. Per capita quantum of water supplied
57 lpcd 100 lpcd 100 lpcd 110 lpcd 120 lpcd 135lpcd 135lpcd
3. Quality of water supplied 100% 100% 100% 100% 100% 100% 100%
19. Siwan 80.33
1. Household level coverage of direct water supply connections
20% 20% 20% 80% 80% 90% 100%
2. Per capita quantum of water supplied
35lpcd 35lpcd 35lpcd 100 lpcd 110 lpcd 120lpcd 135lpcd
3. Quality of water supplied 80% 80% 80% 80% 100% 100% 100%
20. Darbhanga 68.00
1. Household level coverage of direct water supply connections
15% 50% 70% 100% 100% 100% 100%
2. Per capita quantum of water supplied
39lpcd 39lpcd 100 lpcd 135 lpcd 135 lpcd 135lpcd 135lpcd
3. Quality of water supplied 85% 85% 85% 100% 100% 100% 100%
21. Saharsa 90.20
1. Household level coverage of direct water supply connections
10% 10% 25% 50% 70% 90% 100%
2. Per capita quantum of water supplied
45 lpcd 45 lpcd 60 lpcd 80 lpcd 100 lpcd 120 lpcd 135 lpcd
3. Quality of water supplied 20% 20% 40% 60% 80% 100% 100%

Bihar State Annual Action Plan under AMRUT
For Remaining Years of Mission Period
Urban Development & Housing Department Page 84
Total 2184.25
Storm Water Drainage
22. Muzaffarpur
99.90 1. Coverage of storm water
drainage network 30% 30% 30% 30% 60% 80% 100%
23. Bhagalpur 24.00 1. Coverage of storm water
drainage network 50% 50% 50% 60% 80% 100% 100%
24. Patna 58.44 1. Coverage of storm water
drainage network 40% 50% 50% 60% 70% 70% 80%
Total 182.34
Sewerage & Septage Management
25. Katihar 37.75
1. Coverage of latrines (individual or community)
72.22% Funding considered under Swachh Bharat Mission
2. Coverage of sewerage network services
0% 0% 0% 0% 0% 0% 0%
3. Efficiency of Collection of Sewage
0% 0% 0% 10% 50% 70% 90%
4. Efficiency in treatment 0% 0% 0% 30% 100% 100% 100%
Others – Parks and Open Spaces
26. Patna 10.44 1. Per Person Open Space in Plain Areas as per URDPFI
44.17 44.17 44.17 44.17 44.17 44.17 44.17
27. Danapur 0.50 1. Per Person Open Space in Plain Areas as per URDPFI
76.23 76.23 76.23 76.23 76.23 76.23 76.23
28. Biharsharif 3.50 1. Per Person Open Space in Plain Areas as per URDPFI
116.21 116.21 116.21 116.21 116.21 116.21 116.21
29. Sasaram 0.50 1. Per Person Open Space in Plain Areas as per URDPFI
104.56 104.56 104.56 104.56 104.56 104.56 104.56
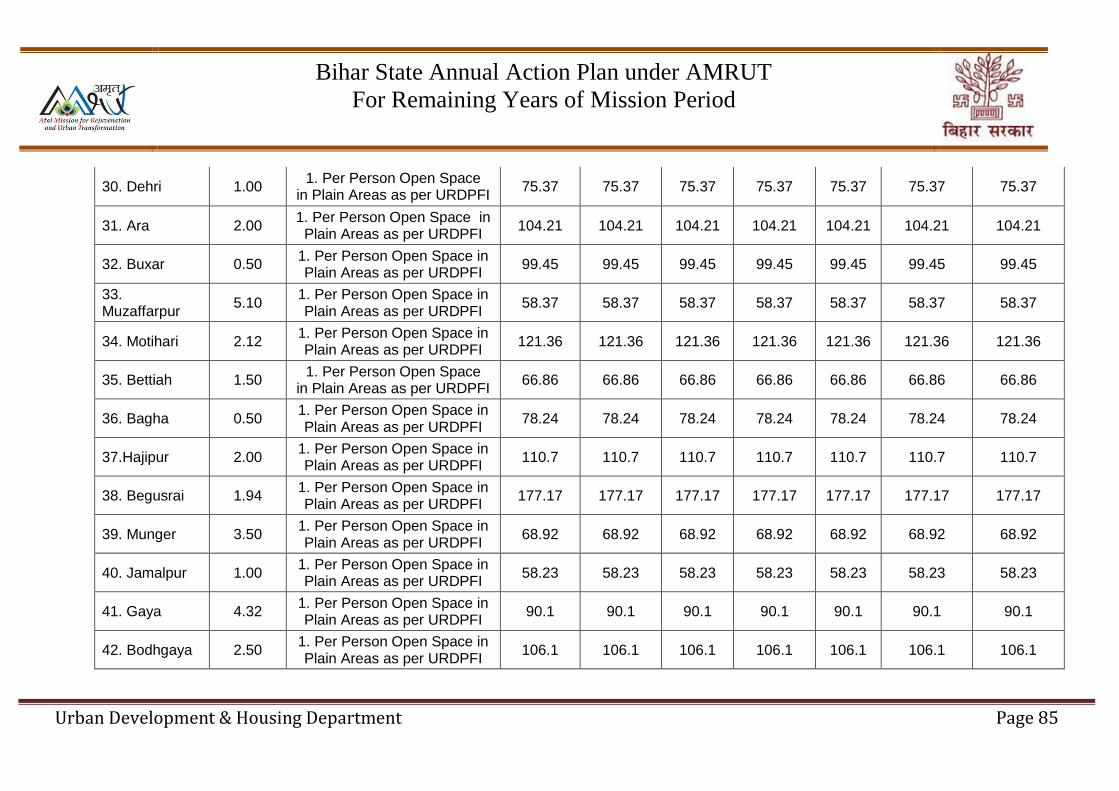
Bihar State Annual Action Plan under AMRUT
For Remaining Years of Mission Period
Urban Development & Housing Department Page 85
30. Dehri 1.00 1. Per Person Open Space
in Plain Areas as per URDPFI 75.37 75.37 75.37 75.37 75.37 75.37 75.37
31. Ara 2.00 1. Per Person Open Space in
Plain Areas as per URDPFI 104.21 104.21 104.21 104.21 104.21 104.21 104.21
32. Buxar 0.50 1. Per Person Open Space in Plain Areas as per URDPFI
99.45 99.45 99.45 99.45 99.45 99.45 99.45
33. Muzaffarpur
5.10 1. Per Person Open Space in Plain Areas as per URDPFI
58.37 58.37 58.37 58.37 58.37 58.37 58.37
34. Motihari 2.12 1. Per Person Open Space in Plain Areas as per URDPFI
121.36 121.36 121.36 121.36 121.36 121.36 121.36
35. Bettiah 1.50 1. Per Person Open Space
in Plain Areas as per URDPFI 66.86 66.86 66.86 66.86 66.86 66.86 66.86
36. Bagha 0.50 1. Per Person Open Space in Plain Areas as per URDPFI
78.24 78.24 78.24 78.24 78.24 78.24 78.24
37.Hajipur 2.00 1. Per Person Open Space in Plain Areas as per URDPFI
110.7 110.7 110.7 110.7 110.7 110.7 110.7
38. Begusrai 1.94 1. Per Person Open Space in Plain Areas as per URDPFI
177.17 177.17 177.17 177.17 177.17 177.17 177.17
39. Munger 3.50 1. Per Person Open Space in Plain Areas as per URDPFI
68.92 68.92 68.92 68.92 68.92 68.92 68.92
40. Jamalpur 1.00 1. Per Person Open Space in Plain Areas as per URDPFI
58.23 58.23 58.23 58.23 58.23 58.23 58.23
41. Gaya 4.32 1. Per Person Open Space in Plain Areas as per URDPFI
90.1 90.1 90.1 90.1 90.1 90.1 90.1
42. Bodhgaya 2.50 1. Per Person Open Space in Plain Areas as per URDPFI
106.1 106.1 106.1 106.1 106.1 106.1 106.1
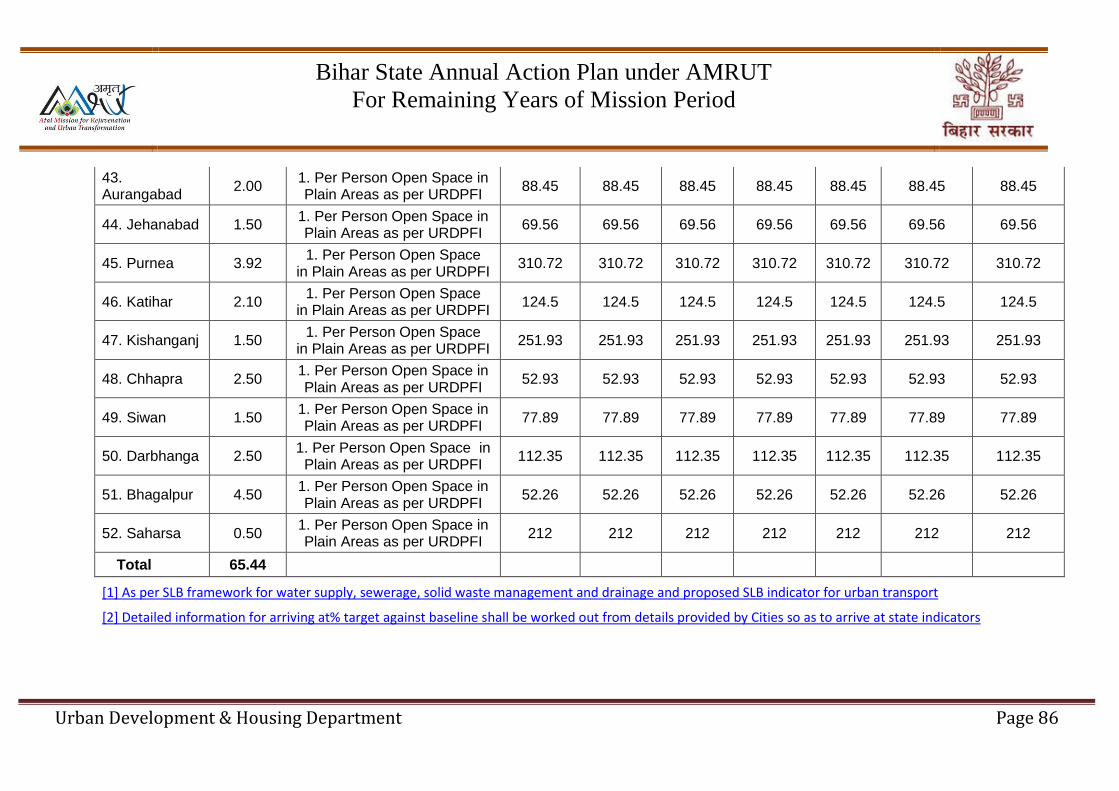
Bihar State Annual Action Plan under AMRUT
For Remaining Years of Mission Period
Urban Development & Housing Department Page 86
43. Aurangabad
2.00 1. Per Person Open Space in Plain Areas as per URDPFI
88.45 88.45 88.45 88.45 88.45 88.45 88.45
44. Jehanabad 1.50 1. Per Person Open Space in Plain Areas as per URDPFI
69.56 69.56 69.56 69.56 69.56 69.56 69.56
45. Purnea 3.92 1. Per Person Open Space
in Plain Areas as per URDPFI 310.72 310.72 310.72 310.72 310.72 310.72 310.72
46. Katihar 2.10 1. Per Person Open Space
in Plain Areas as per URDPFI 124.5 124.5 124.5 124.5 124.5 124.5 124.5
47. Kishanganj 1.50 1. Per Person Open Space
in Plain Areas as per URDPFI 251.93 251.93 251.93 251.93 251.93 251.93 251.93
48. Chhapra 2.50 1. Per Person Open Space in Plain Areas as per URDPFI
52.93 52.93 52.93 52.93 52.93 52.93 52.93
49. Siwan 1.50 1. Per Person Open Space in Plain Areas as per URDPFI
77.89 77.89 77.89 77.89 77.89 77.89 77.89
50. Darbhanga 2.50 1. Per Person Open Space in
Plain Areas as per URDPFI 112.35 112.35 112.35 112.35 112.35 112.35 112.35
51. Bhagalpur 4.50 1. Per Person Open Space in Plain Areas as per URDPFI
52.26 52.26 52.26 52.26 52.26 52.26 52.26
52. Saharsa 0.50 1. Per Person Open Space in Plain Areas as per URDPFI
212 212 212 212 212 212 212
Total 65.44
[1] As per SLB framework for water supply, sewerage, solid waste management and drainage and proposed SLB indicator for urban transport
[2] Detailed information for arriving at% target against baseline shall be worked out from details provided by Cities so as to arrive at state indicators
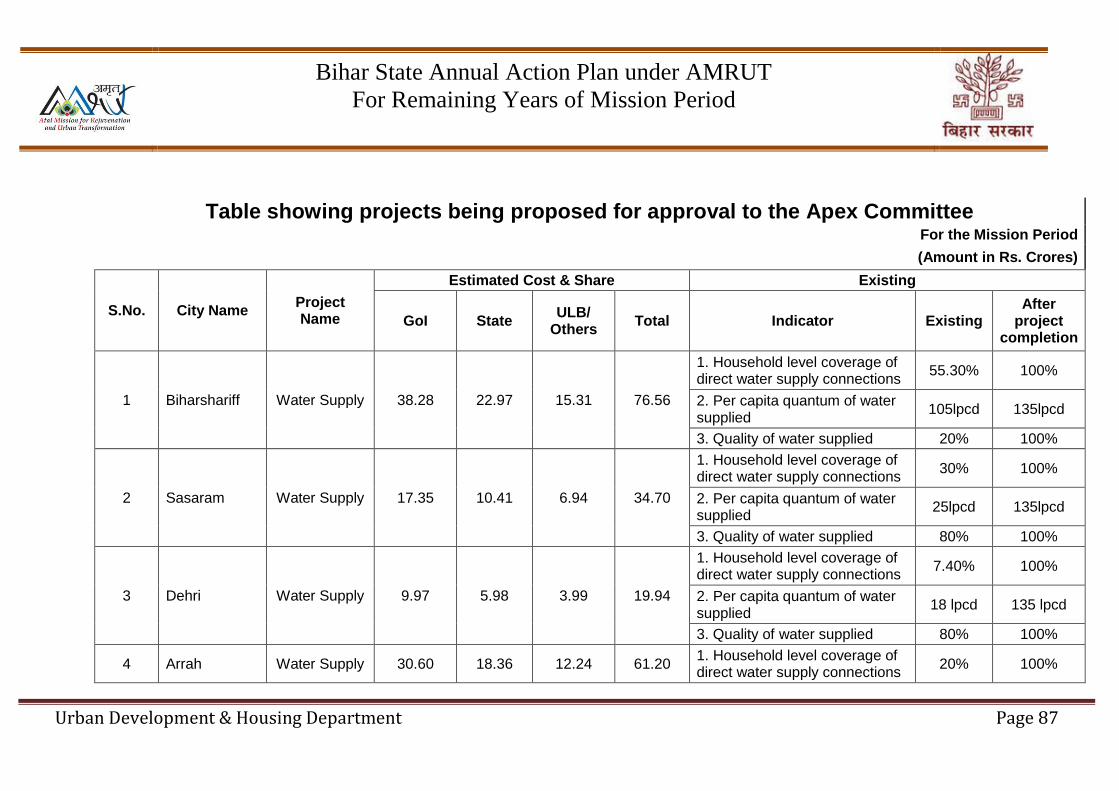
Bihar State Annual Action Plan under AMRUT
For Remaining Years of Mission Period
Urban Development & Housing Department Page 87
Table showing projects being proposed for approval to the Apex Committee For the Mission Period
(Amount in Rs. Crores)
S.No. City Name Project Name
Estimated Cost & Share Existing
GoI State ULB/
Others Total Indicator Existing
After project
completion
1 Biharshariff Water Supply 38.28 22.97 15.31 76.56
1. Household level coverage of direct water supply connections
55.30% 100%
2. Per capita quantum of water supplied
105lpcd 135lpcd
3. Quality of water supplied 20% 100%
2 Sasaram Water Supply 17.35 10.41 6.94 34.70
1. Household level coverage of direct water supply connections
30% 100%
2. Per capita quantum of water supplied
25lpcd 135lpcd
3. Quality of water supplied 80% 100%
3 Dehri Water Supply 9.97 5.98 3.99 19.94
1. Household level coverage of direct water supply connections
7.40% 100%
2. Per capita quantum of water supplied
18 lpcd 135 lpcd
3. Quality of water supplied 80% 100%
4 Arrah Water Supply 30.60 18.36 12.24 61.20 1. Household level coverage of direct water supply connections
20% 100%
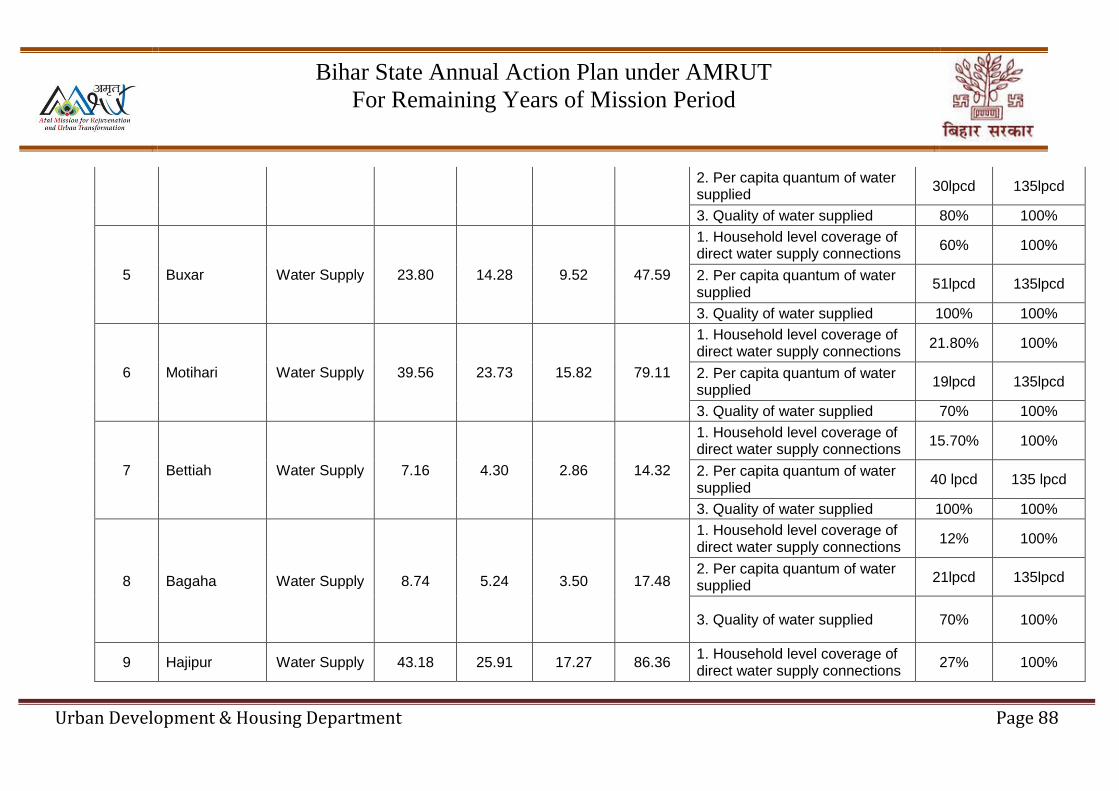
Bihar State Annual Action Plan under AMRUT
For Remaining Years of Mission Period
Urban Development & Housing Department Page 88
2. Per capita quantum of water supplied
30lpcd 135lpcd
3. Quality of water supplied 80% 100%
5 Buxar Water Supply 23.80 14.28 9.52 47.59
1. Household level coverage of direct water supply connections
60% 100%
2. Per capita quantum of water supplied
51lpcd 135lpcd
3. Quality of water supplied 100% 100%
6 Motihari Water Supply 39.56 23.73 15.82 79.11
1. Household level coverage of direct water supply connections
21.80% 100%
2. Per capita quantum of water supplied
19lpcd 135lpcd
3. Quality of water supplied 70% 100%
7 Bettiah Water Supply 7.16 4.30 2.86 14.32
1. Household level coverage of direct water supply connections
15.70% 100%
2. Per capita quantum of water supplied
40 lpcd 135 lpcd
3. Quality of water supplied 100% 100%
8 Bagaha Water Supply 8.74 5.24 3.50 17.48
1. Household level coverage of direct water supply connections
12% 100%
2. Per capita quantum of water supplied
21lpcd 135lpcd
3. Quality of water supplied 70% 100%
9 Hajipur Water Supply 43.18 25.91 17.27 86.36 1. Household level coverage of direct water supply connections
27% 100%
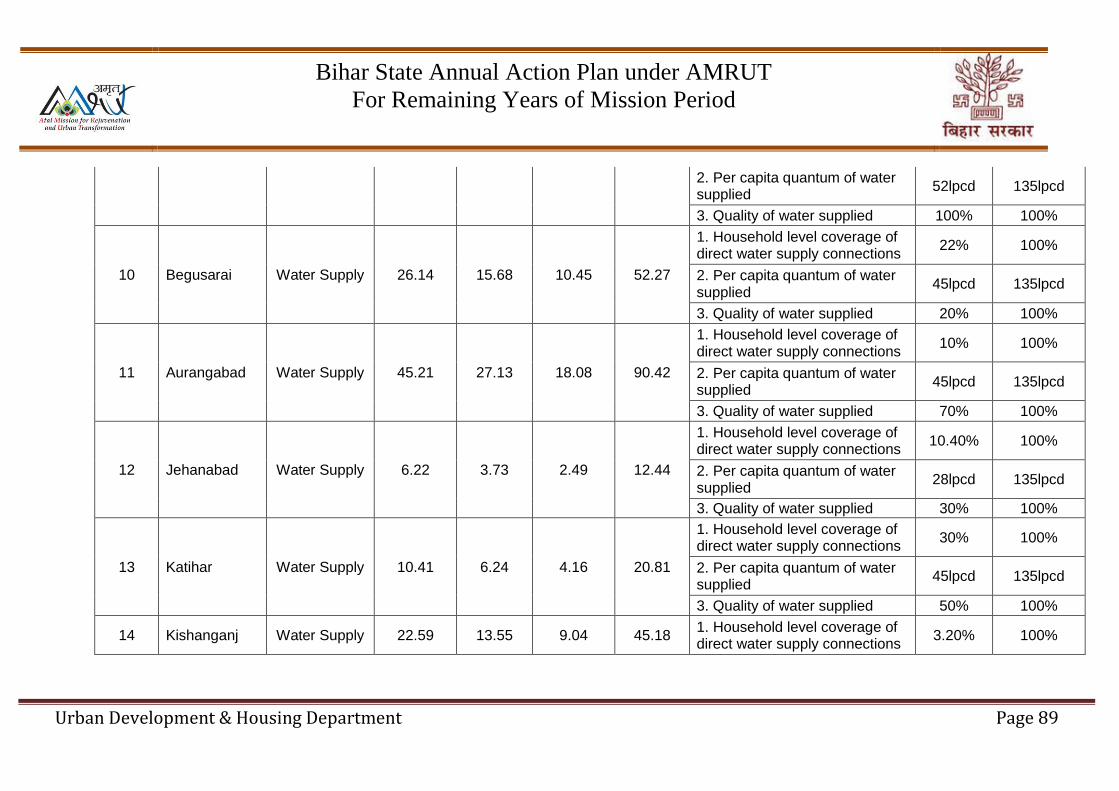
Bihar State Annual Action Plan under AMRUT
For Remaining Years of Mission Period
Urban Development & Housing Department Page 89
2. Per capita quantum of water supplied
52lpcd 135lpcd
3. Quality of water supplied 100% 100%
10 Begusarai Water Supply 26.14 15.68 10.45 52.27
1. Household level coverage of direct water supply connections
22% 100%
2. Per capita quantum of water supplied
45lpcd 135lpcd
3. Quality of water supplied 20% 100%
11 Aurangabad Water Supply 45.21 27.13 18.08 90.42
1. Household level coverage of direct water supply connections
10% 100%
2. Per capita quantum of water supplied
45lpcd 135lpcd
3. Quality of water supplied 70% 100%
12 Jehanabad Water Supply 6.22 3.73 2.49 12.44
1. Household level coverage of direct water supply connections
10.40% 100%
2. Per capita quantum of water supplied
28lpcd 135lpcd
3. Quality of water supplied 30% 100%
13 Katihar Water Supply 10.41 6.24 4.16 20.81
1. Household level coverage of direct water supply connections
30% 100%
2. Per capita quantum of water supplied
45lpcd 135lpcd
3. Quality of water supplied 50% 100%
14 Kishanganj Water Supply 22.59 13.55 9.04 45.18 1. Household level coverage of direct water supply connections
3.20% 100%

Bihar State Annual Action Plan under AMRUT
For Remaining Years of Mission Period
Urban Development & Housing Department Page 90
2. Per capita quantum of water supplied
32lpcd 135lpcd
3. Quality of water supplied 80% 100%
15 Chhapra Water Supply 34.42 20.65 13.77 68.84
1. Household level coverage of direct water supply connections
45% 100%
2. Per capita quantum of water supplied
57 lpcd 135lpcd
3. Quality of water supplied 100% 100%
16 Siwan Water Supply 21.52 12.91 8.61 43.03
1. Household level coverage of direct water supply connections
20% 100%
2. Per capita quantum of water supplied
35lpcd 135lpcd
3. Quality of water supplied 80% 100%
17 Darbhanga Water Supply 9.08 5.45 3.63 18.15
1. Household level coverage of direct water supply connections
15% 100%
2. Per capita quantum of water supplied
39lpcd 135lpcd
3. Quality of water supplied 85% 100%
18 Saharsa Water Supply 0.00 0.00 0.00 0.00
1. Household level coverage of direct water supply connections
10% 100%
2. Per capita quantum of water supplied
45 lpcd 135 lpcd
3. Quality of water supplied 20% 100%
Total 394.20 236.52 157.68 788.40
19 Patna Drainage 19.48 27.27 11.69 58.44 1. Coverage of storm water
drainage network 40% 80%

Bihar State Annual Action Plan under AMRUT
For Remaining Years of Mission Period
Urban Development & Housing Department Page 91
20 Katihar Septage
Management 18.87 11.33 7.56 37.75
1. Coverage of latrines (individual or community)
72.22% 100%
2. Coverage of sewerage network services
0% 0%
3. Efficiency of Collection of Sewage
0% 90%
4. Efficiency in treatment 0% 100%
21 Patna Parks & Open Spaces
2.75 1.65 1.10 5.50 1. Per Person Open Space in Plain Areas as per URDPFI
44.17 44.17
22 Biharsharif Parks & Open Spaces
1.00 0.60 0.40 2.00 1. Per Person Open Space in Plain Areas as per URDPFI
116.21 116.21
23 Ara Parks & Open Spaces
0.50 0.30 0.20 1.00 1. Per Person Open Space in Plain Areas as per URDPFI
104.21 104.21
24 Muzaffarpur Parks & Open Spaces
0.50 0.30 0.20 1.00 1. Per Person Open Space in Plain Areas as per URDPFI
58.37 58.37
25 Motihari Parks & Open Spaces
0.50 0.30 0.20 1.00 1. Per Person Open Space in Plain Areas as per URDPFI
121.36 121.36
26 Bettiah Parks & Open Spaces
0.25 0.15 0.10 0.50 1. Per Person Open Space
in Plain Areas as per URDPFI 66.86 66.86
27 Hajipur Parks & Open Spaces
0.50 0.30 0.20 1.00 1. Per Person Open Space in Plain Areas as per URDPFI
110.7 110.7
28 Munger Parks & Open Spaces
0.50 0.30 0.20 1.00 1. Per Person Open Space in Plain Areas as per URDPFI
68.92 68.92
29 Jamalpur Parks & Open Spaces
0.25 0.15 0.10 0.50 1. Per Person Open Space in Plain Areas as per URDPFI
58.23 58.23
30 Gaya Parks & Open Spaces
0.50 0.30 0.20 1.00 1. Per Person Open Space in Plain Areas as per URDPFI
90.1 90.1

Bihar State Annual Action Plan under AMRUT
For Remaining Years of Mission Period
Urban Development & Housing Department Page 92
31 Bodhgaya Parks & Open Spaces
1.00 0.60 0.40 2.00 1. Per Person Open Space in Plain Areas as per URDPFI
106.1 106.1
32 Aurangabad Parks & Open Spaces
0.50 0.30 0.20 1.00 1. Per Person Open Space in Plain Areas as per URDPFI
88.45 88.45
33 Jehanabad Parks & Open Spaces
0.25 0.15 0.10 0.50 1. Per Person Open Space in Plain Areas as per URDPFI
69.56 69.56
34 Purnea Parks & Open Spaces
0.50 0.30 0.20 1.00 1. Per Person Open Space
in Plain Areas as per URDPFI 310.72 310.72
35 Katihar Parks & Open Spaces
0.55 0.33 0.22 1.10 1. Per Person Open Space
in Plain Areas as per URDPFI 124.5 124.5
36 Kishanganj Parks & Open Spaces
0.25 0.15 0.10 0.50 1. Per Person Open Space
in Plain Areas as per URDPFI 251.93 251.93
37 Chhapra Parks & Open Spaces
0.50 0.30 0.20 1.00 1. Per Person Open Space in Plain Areas as per URDPFI
52.93 52.93
38 Siwan Parks & Open Spaces
0.25 0.15 0.10 0.50 1. Per Person Open Space in Plain Areas as per URDPFI
77.89 77.89
39 Darbhanga Parks & Open Spaces
0.50 0.30 0.20 1.00 1. Per Person Open Space in Plain Areas as per URDPFI
112.35 112.35
40 Bhagalpur Parks & Open Spaces
1.00 0.60 0.40 2.00 1. Per Person Open Space in Plain Areas as per URDPFI
52.26 52.26
Total 12.55 7.53 5.02 25.10
Grand
Total
445.10 282.65 181.95 909.69
Bihar State Annual Action Plan under AMRUT
For Remaining Years of Mission Period
Urban Development & Housing Department Page 93
1. Principles of Prioritization
The states are required to prioritize and recommend projects for selection under AMRUT as per Guidelines in para 7.
While prioritizing projects in the course of preparation of the SLIPs, the ULBs accorded the first priority to water supply, followed by storm
water drainage and sewerage & septage. In cases where ULBs already had committed funds for water supply from other sources or on-
going projects viz. Bhagalpur, Muzaffarpur & Gaya priority has been given to Drainage Projects. Where available funds for on-going water
supply projects are sufficient to provide universal coverage, and land is available, Drainage has been given the top priority.
The four potential Smart Cities – Patna, Bhagalpur, Biharsharif and Muzaffarpur – have been given priority in project selection. Extensive
discussions have been held at ULB and State level as well as with parastatals viz. the Bihar Rajya Ja lParishad and the Bihar Urban
Infrastructure Development Corporation to finalize the priorities. The responses to the specific queries as per the Guidelines are given
below:
Has consultation with local MPs/MLAs, Mayors and Commissioners of the concerned ULBs been carried out prior to allocation
of funding? Please give details.
Informal discussions have been held with all stakeholders. The Commissioners of the concerned ULBs have led on the preparation of
the SLIPs and have sought advice from the Urban Development and Housing Department at the State Level and parastatals as
required. The Commissioners have ensured that progress in the preparation of the SLIPs and the prioritization and funding
commitments have been duly discussed at the ULB Board Meetings to ensure approval and commitment of the Elected
Representatives.
Bihar State Annual Action Plan under AMRUT
For Remaining Years of Mission Period
Urban Development & Housing Department Page 94
Have financially weaker ULBs been given priority for financing? If yes, how?
This has not been consciously followed. Since 24 of the 27 ULBs under the AMRU Mission are also project cities under the on-going
DFID funded SPUR project, they have been implementing municipal financial reforms over the last 5 years. The financial position of the
ULBs has significantly improved with better target setting and monitoring of own revenue collections. The State Government will share
not less than 30% of the project cost and the remaining amount is to be financed from the 14th Finance Commission Grants, allocations
under the 5th State Finance Commission. The balance if any will be from additional state assistance to be decided as required.
Is the ULB with a high proportion of urban poor receiving higher share? If yes, how?
As part of the ongoing DFID funded ‘Support Programme for Urban Reforms’ (SPUR), the state is implementing a programme for
provision of basic infrastructure in slums. The state has made allocations in the budget to share 80% of the total cost of infrastructure
provision in 1402 slums over 3 years. While this support is limited to the SPUR project towns, it should be noted that these project
towns account for 60% of the total urban population of the state therefore the lion’s share of the urban poor reside in these towns. Of the
26 AMRUT Mission cities in Bihar, 23 are also supported under SPUR.
Has the potential Smart Cities been given preference? Please give details.
Bihar has four potential Smart Cities – Patna, Bhagalpur, Biharsharif & Muzaffarpur. Bhagalpur already has an ongoing ADB funded
water supply project and therefore been given a higher priority for Drainage (although this is to be implemented in Phases). Biharsharif
does not have any ongoing infrastructure projects and has therefore been considered for a water supply project. Sewerage & Drainage
has not been considered since the water supply project will be completed in the AMRUT Mission period and investing in a sewerage &
Bihar State Annual Action Plan under AMRUT
For Remaining Years of Mission Period
Urban Development & Housing Department Page 95
drainage project at this stage will lead to un-utilization/underutilization of the infrastructure. Patna and Muzaffarpur have a committed
and ongoing water supply project under UIG & UIDSSMT respectively and have therefore received a priority drainage project.
What is the quantum of Central Assistance (CA) allocated to the State during 2016-17?
As per communication received from Ministry of Urban Development, Govt of India, the State of Bihar has been allocated Rs 445.10
crores as CA with Rs 11.869 crores as the A & OE shares for the remaining years of Mission Period for which SAAP is to be submitted.
Has the allocation to different ULBs within the State been made consistent with the urban profile of the state? How?
Allocations to different ULBs have been made in line with the urban profile of the State. Additionally, various financial options, AMRUT,
Smart Cities, Swachh Bharat Mission, NamamiGange and external financial assistance have been considered for convergence of the
various schemes and funding options.
2. Importance of O&M
The DPRs that have been prepared prior to the AMRUT Mission for these cities include provisions for 5 years of O&M. This will ensure
sustainability of the infrastructure created and result in significant savings for the state. The following are the responses to the various
issues involved in addressing effective O&M.
Have projects being proposed in the SAAP included O&M for at least 5 years?
5 years O&M has been proposed for all the projects being proposed in the SAAP. The O&M arrangements are an integral part of the
DPRs and will be included in the contracts. This arrangement will ensure sustainability and quality of the infrastructure created.
Bihar State Annual Action Plan under AMRUT
For Remaining Years of Mission Period
Urban Development & Housing Department Page 96
How are O&M expenditures proposed to be funded by ULBs/parastatals?
O&M expenditures are proposed to be funded through User Charges and ULB’s own revenues. ULBs are expected to enhance
metering, coverage, billing and connections. Where required, rationalization of user charges may be considered.
Is it by way of levy of user charges or other revenue streams? Please give details.
O&M costs are largely to be met through extending coverage and improving billing and collection. Additionally, municipal financial
reforms are underway in all the project towns and there has been significant growth in self-generated income from all sources including
property tax. Smart solutions that contribute to reduction in manpower and energy savings will be implemented as appropriate.
Has O&M cost been excluded from project cost for the purpose of funding?
O&M costs have not been included in the project cost for funding purposes and have been shown separately. These are to be funded
by the ULBs as described in the previous response.
What kind of model has been proposed by states/ULBs to fund O&M? Please discuss.
It is proposed that ULBs will maintain separate accounts for O&M for effective planning for maintenance of infrastructure and increasing
accountability. All infrastructure contracts will include a 5-year O&M provision that will be met by the ULBs through user charges and
own revenues. In the case of parks and open spaces, the options of involving institutions, neighbor-hood committees and corporates out
of CSR funds will be explored.
Is it through an appropriate cost recovery mechanism in order to make them self-reliant and cost-effective? How?
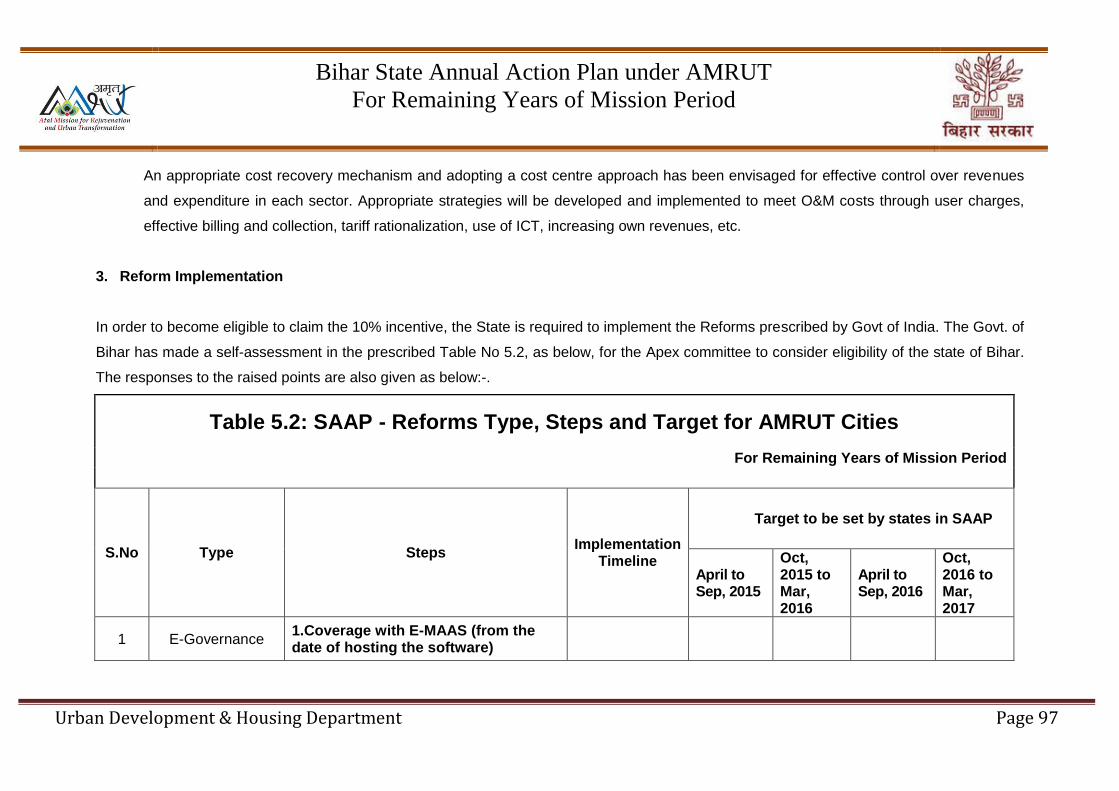
Bihar State Annual Action Plan under AMRUT
For Remaining Years of Mission Period
Urban Development & Housing Department Page 97
An appropriate cost recovery mechanism and adopting a cost centre approach has been envisaged for effective control over revenues
and expenditure in each sector. Appropriate strategies will be developed and implemented to meet O&M costs through user charges,
effective billing and collection, tariff rationalization, use of ICT, increasing own revenues, etc.
3. Reform Implementation
In order to become eligible to claim the 10% incentive, the State is required to implement the Reforms prescribed by Govt of India. The Govt. of
Bihar has made a self-assessment in the prescribed Table No 5.2, as below, for the Apex committee to consider eligibility of the state of Bihar.
The responses to the raised points are also given as below:-.
Table 5.2: SAAP - Reforms Type, Steps and Target for AMRUT Cities
For Remaining Years of Mission Period
S.No Type Steps Implementation
Timeline
Target to be set by states in SAAP
April to Sep, 2015
Oct, 2015 to Mar, 2016
April to Sep, 2016
Oct, 2016 to Mar, 2017
1 E-Governance 1.Coverage with E-MAAS (from the date of hosting the software)
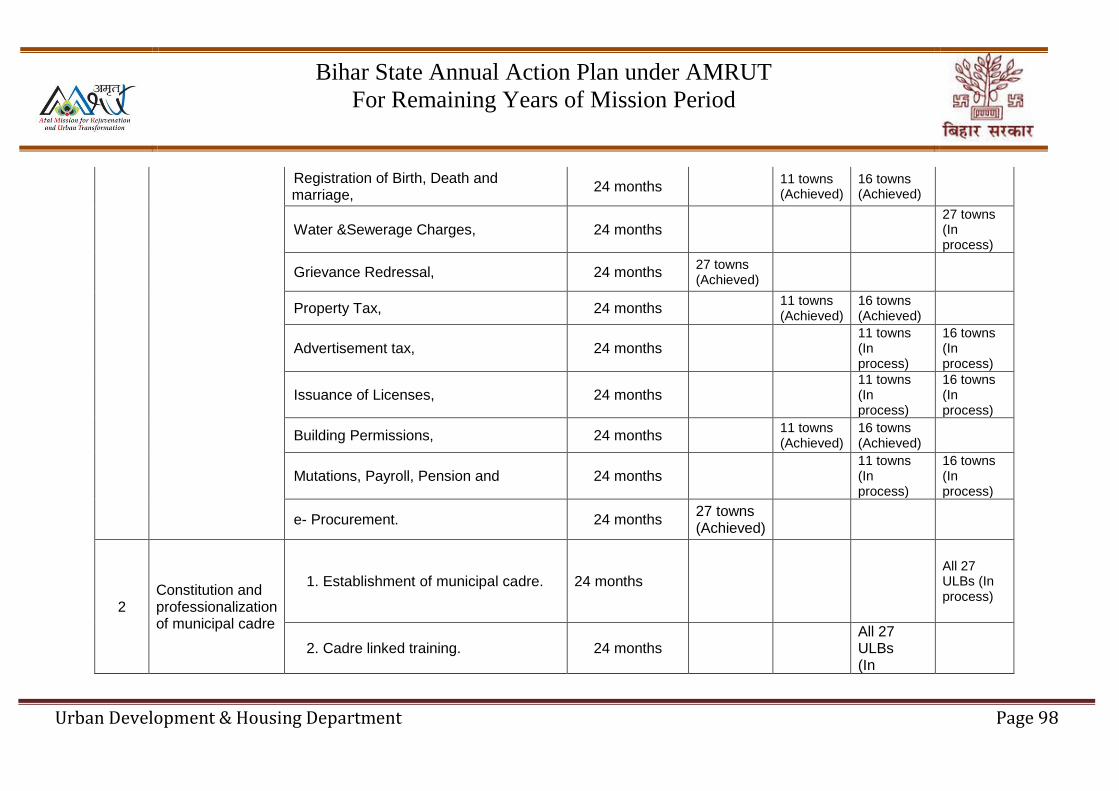
Bihar State Annual Action Plan under AMRUT
For Remaining Years of Mission Period
Urban Development & Housing Department Page 98
Registration of Birth, Death and marriage,
24 months 11 towns (Achieved)
16 towns (Achieved)
Water &Sewerage Charges, 24 months 27 towns (In process)
Grievance Redressal, 24 months 27 towns (Achieved)
Property Tax, 24 months 11 towns (Achieved)
16 towns (Achieved)
Advertisement tax, 24 months 11 towns (In process)
16 towns (In process)
Issuance of Licenses, 24 months 11 towns (In process)
16 towns (In process)
Building Permissions, 24 months 11 towns (Achieved)
16 towns (Achieved)
Mutations, Payroll, Pension and 24 months 11 towns (In process)
16 towns (In process)
e- Procurement. 24 months 27 towns (Achieved)
2 Constitution and professionalization of municipal cadre
1. Establishment of municipal cadre. 24 months All 27 ULBs (In process)
2. Cadre linked training. 24 months All 27 ULBs (In
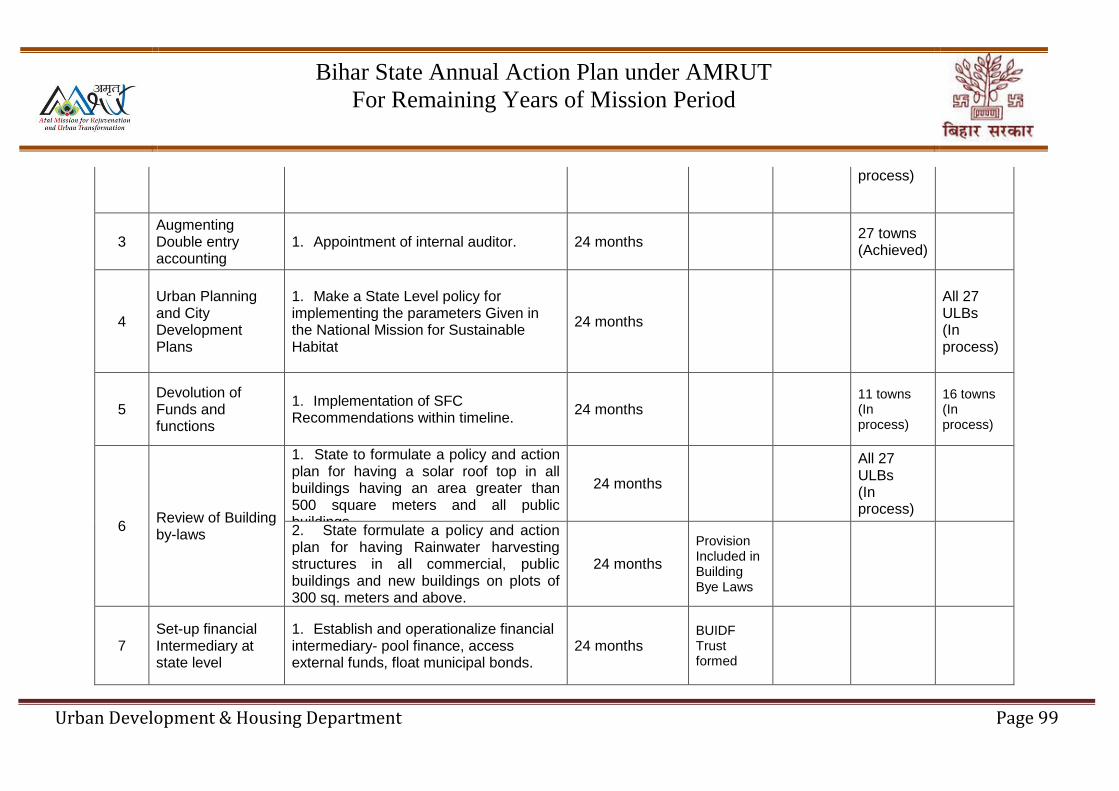
Bihar State Annual Action Plan under AMRUT
For Remaining Years of Mission Period
Urban Development & Housing Department Page 99
process)
3 Augmenting Double entry accounting
1. Appointment of internal auditor. 24 months 27 towns (Achieved)
4
Urban Planning and City Development Plans
1. Make a State Level policy for implementing the parameters Given in the National Mission for Sustainable Habitat
24 months
All 27 ULBs (In process)
5 Devolution of Funds and functions
1. Implementation of SFC Recommendations within timeline.
24 months 11 towns (In process)
16 towns (In process)
6 Review of Building by-laws
1. State to formulate a policy and action plan for having a solar roof top in all buildings having an area greater than 500 square meters and all public buildings.
24 months
All 27 ULBs (In process)
2. State formulate a policy and action plan for having Rainwater harvesting structures in all commercial, public buildings and new buildings on plots of 300 sq. meters and above.
24 months
Provision Included in Building Bye Laws
7 Set-up financial Intermediary at state level
1. Establish and operationalize financial intermediary- pool finance, access external funds, float municipal bonds.
24 months BUIDF Trust formed

Bihar State Annual Action Plan under AMRUT
For Remaining Years of Mission Period
Urban Development & Housing Department Page 100
8 Credit Rating 1. Complete the credit ratings of the ULBs.
24 months
(agency appointed for 21 towns)
All 27 ULBs
9 Energy and Water audit
1. Give incentives for green buildings (e.g. rebate in property tax or charges connected to building permission/ development charges).
24 months
Rebate is given for Rain Water Harvesting structures
Provision of rebate in property tax for roof top solar power system. Amendment in Building Bye Laws is in process.
Some of the criteria that should be considered while preparing the SAAP:
Have any issues been identified during the review by HPSC on Reforms implementation? What are the issues? (250 words)
No
Have these issues been considered while planning for reform implementation? How? (tabular; 250 words)
N.A.
4. Annual Capacity Building Plan
The Capacity Development Plan is submitted herewith for approval by the MoUD, to empower municipal functionaries and lead to timely
completion of projects.

Bihar State Annual Action Plan under AMRUT
For Remaining Years of Mission Period
Urban Development & Housing Department Page 101
Table 7.2: Annual Action Plan for Capacity Building
Form 7.2.1 -Fund Requirement for Individual Capacity Building at ULB level
For Remaining Years
(Amount in Rs. Crores)
Sl. No.
Name of ULB
Total numbers to be trained in the remaining years, department wise Name of the
Training Institution (s) identified
No. of Training
Programmes to be
conducted
Fund Reqd. in
current FY
(₹ in Crore) Elected Reps.
Finance Dept.
Engineering Dept.
Town Planning
Dept.
Admin. Dept.
Total
1 Ara 12 1 4 0 0 17 BIPARD & ASCI 3 0.083
2 Aurangabad 9 1 4 0 0 14 BIPARD & ASCI 3 0.075
3 Bagha 10 1 4 0 0 15 BIPARD & ASCI 3 0.078
4 Begusarai 14 1 4 0 0 19 BIPARD & ASCI 3 0.088
5 Bettiah 12 1 4 0 0 17 BIPARD & ASCI 3 0.083
6 Bhagalpur 13 1 4 0 0 18 BIPARD & ASCI 3 0.085
7 Biharshariff 14 1 4 0 0 19 BIPARD & ASCI 3 0.088
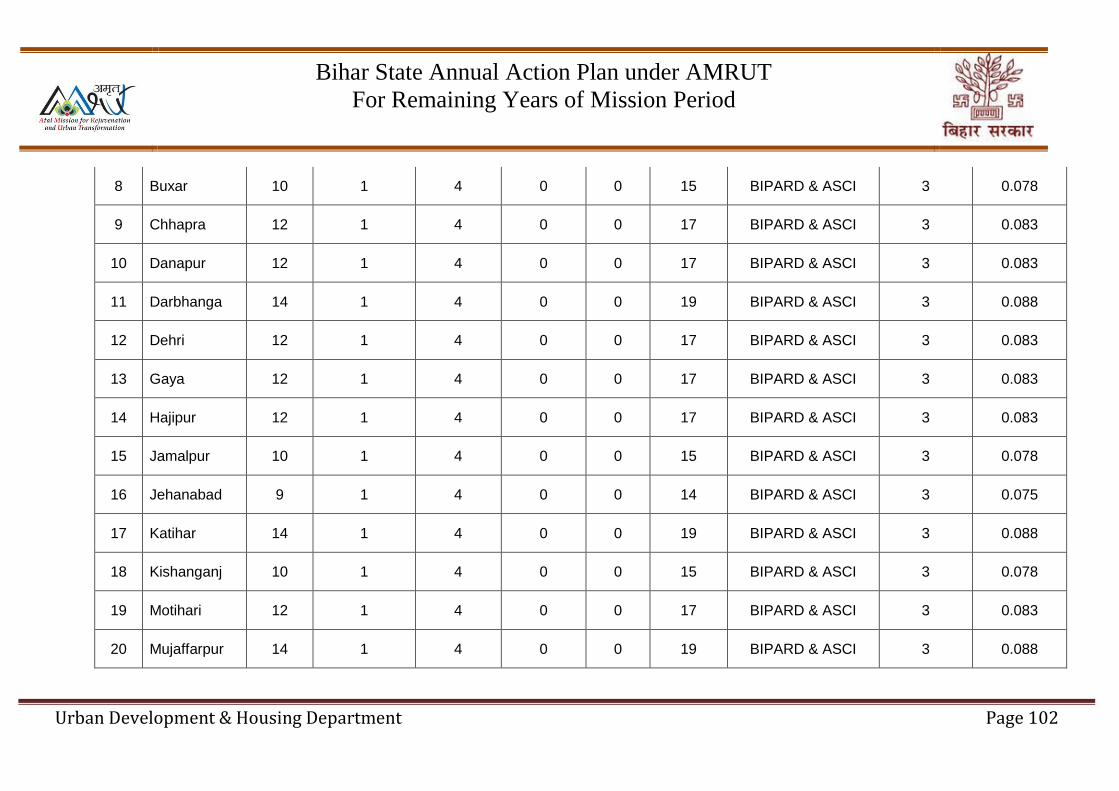
Bihar State Annual Action Plan under AMRUT
For Remaining Years of Mission Period
Urban Development & Housing Department Page 102
8 Buxar 10 1 4 0 0 15 BIPARD & ASCI 3 0.078
9 Chhapra 12 1 4 0 0 17 BIPARD & ASCI 3 0.083
10 Danapur 12 1 4 0 0 17 BIPARD & ASCI 3 0.083
11 Darbhanga 14 1 4 0 0 19 BIPARD & ASCI 3 0.088
12 Dehri 12 1 4 0 0 17 BIPARD & ASCI 3 0.083
13 Gaya 12 1 4 0 0 17 BIPARD & ASCI 3 0.083
14 Hajipur 12 1 4 0 0 17 BIPARD & ASCI 3 0.083
15 Jamalpur 10 1 4 0 0 15 BIPARD & ASCI 3 0.078
16 Jehanabad 9 1 4 0 0 14 BIPARD & ASCI 3 0.075
17 Katihar 14 1 4 0 0 19 BIPARD & ASCI 3 0.088
18 Kishanganj 10 1 4 0 0 15 BIPARD & ASCI 3 0.078
19 Motihari 12 1 4 0 0 17 BIPARD & ASCI 3 0.083
20 Mujaffarpur 14 1 4 0 0 19 BIPARD & ASCI 3 0.088

Bihar State Annual Action Plan under AMRUT
For Remaining Years of Mission Period
Urban Development & Housing Department Page 103
21 Munger 15 1 4 0 0 20 BIPARD & ASCI 3 0.090
22 Patna 10 1 10 0 0 26 BIPARD & ASCI 3 0.093
23 Purnea 10 1 4 0 0 18 BIPARD & ASCI 3 0.078
24 Saharsa 9 1 4 0 0 14 BIPARD & ASCI 3 0.075
25 Sasaram 12 1 4 0 0 17 BIPARD & ASCI 3 0.083
26 Siwan 12 1 4 0 0 17 BIPARD & ASCI 3 0.083
TOTAL 305 26 110 0 0 449 2.147
Table 7.2: Annual Action Plan for Capacity Building Form 7.2.2 -Fund Requirement for State level activities
For Remaining Years
(Amount in Rs. Crores)
Sl. No. State Level activities Total expenditure upto current FY
Unspent funds available from earlier releases
Funds required for the remaining years (In Crore)
1 RPMC (SMMU) 2.5916 4.1584 25.047
2 UMC

Bihar State Annual Action Plan under AMRUT
For Remaining Years of Mission Period
Urban Development & Housing Department Page 104
3 Others (Workshops, Seminars, etc.) are approved by NIUA
7.1523
4 Institutional/ Reform 54.2347
Total 2.5916 4.1584 86.434
Form 7.2.3 -Total Fund Requirement for Capacity Building
FY 2016-17
(Amount in Rs. Crores)
Sl. No.
Fund requirement Individual
(Training & Workshop)
Institutional/ Reform
SMMU/RPMC/CMMU Others Total (In Crore)
1 Total release since
start of Mission (2015)
- - 6.75
2 Total utilisation-Central Share
0.0199 2.5 - 0.0717 2.5916
3 Balance available-
Central Share 1.5831 2.5753 - - 4.1584

Bihar State Annual Action Plan under AMRUT
For Remaining Years of Mission Period
Urban Development & Housing Department Page 105
4 Amount required-
Central Share 2.147 54.2347 25.047 5.0053 86.434
5 Total fund required for capacity building in remaining years
2.147 54.2347 25.047 5.0053 86.434
What is the physical and financial Progress of capacity development at state level? (350 words)
The trainings of two finance personnel in each ULB have been completed by DFID supported TA team. MoU has been done with 5
institutions. Training program to be shared by the institutions.
Do you feel that there is a need to include any other category of official, new department or module? (400 words)
IT personnel & data entry operators and sanitation inspectors/supervisors may also be trained under this program.
What are the issues that are been identified during the review? (350 words)
Due to shortage of manpower in the ULBs, trainings could not be organized.
Have the activities in your current year Capacity Building Plan – training, exposure visits (ULB staff and elected
representatives), seminars/workshops, etc. – been vetted/approved by NIUA?
The training & capacity building plan has not yet been shared with the NIUA.
What is the present institutional capacity in the ULBs of the state; have the RPMC, UMC, etc. been appointed? Are there
other PMUs, PIUs, etc. which are still operational?
DFID technical support is available for 24 ULBs. No RPMC, UMC have been appointed in the ULBs.
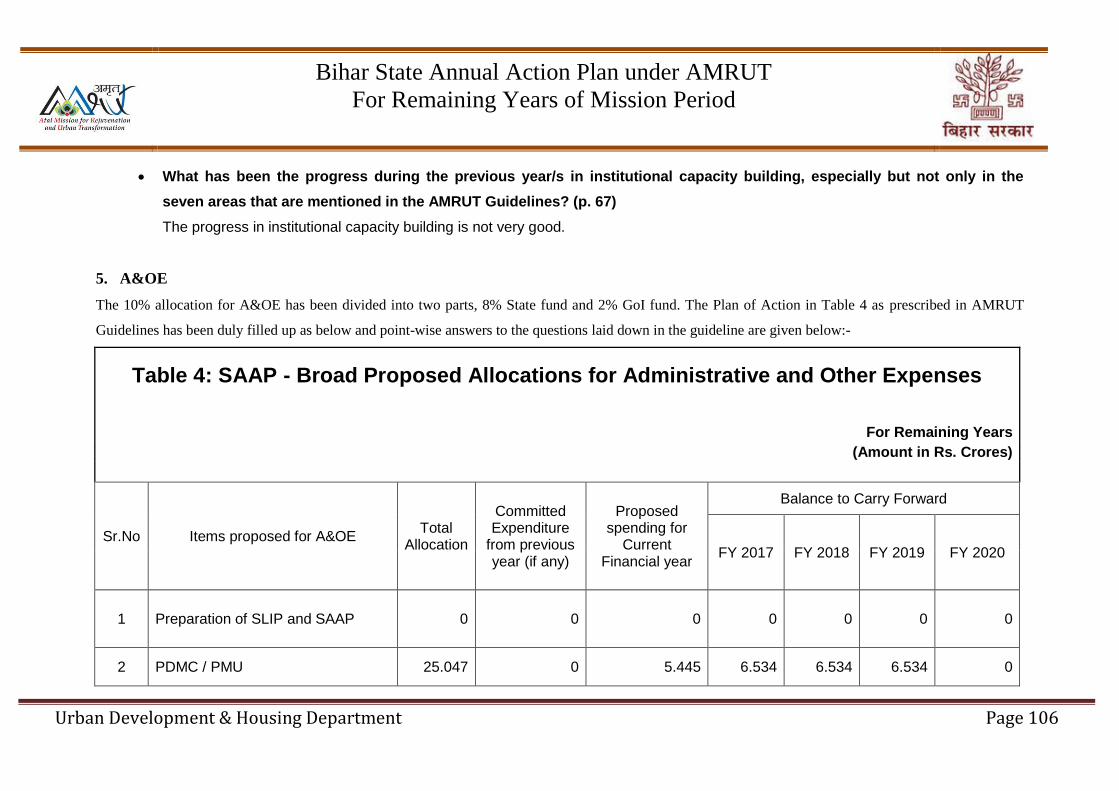
Bihar State Annual Action Plan under AMRUT
For Remaining Years of Mission Period
Urban Development & Housing Department Page 106
What has been the progress during the previous year/s in institutional capacity building, especially but not only in the
seven areas that are mentioned in the AMRUT Guidelines? (p. 67)
The progress in institutional capacity building is not very good.
5. A&OE
The 10% allocation for A&OE has been divided into two parts, 8% State fund and 2% GoI fund. The Plan of Action in Table 4 as prescribed in AMRUT
Guidelines has been duly filled up as below and point-wise answers to the questions laid down in the guideline are given below:-
Table 4: SAAP - Broad Proposed Allocations for Administrative and Other Expenses
For Remaining Years
(Amount in Rs. Crores)
Sr.No Items proposed for A&OE Total
Allocation
Committed Expenditure
from previous year (if any)
Proposed spending for
Current Financial year
Balance to Carry Forward
FY 2017 FY 2018 FY 2019 FY 2020
1 Preparation of SLIP and SAAP 0 0 0 0 0 0 0
2 PDMC / PMU 25.047 0 5.445 6.534 6.534 6.534 0

Bihar State Annual Action Plan under AMRUT
For Remaining Years of Mission Period
Urban Development & Housing Department Page 107
3 Procuring Third Party Independent Review and Monitoring Agency
4.026 0.31 0.929 0.929 0.929 0.929 0
5 Publications (e-Newsletter, guidelines, brochures etc.)
1.051 0 0.262 0.263 0.263 0.263 0
6 Capacity Building and Training CCBP, if applicable- Others
3.75 0.763 0.84 0.818 0.729 0.6 0
7 Reform implementation 59.31 5.223 3.496 8.988 7.9 13.703 20
8 Others 0 0 0 0 0 0 0
Total 93.184 6.296 10.972 17.532 16.355 22.029 20

Bihar State Annual Action Plan under AMRUT
For Remaining Years of Mission Period
Urban Development & Housing Department Page 108
• What is the committed expenditure from previous year? (200 words)
Rs. 6.296 Crore has been the committed expenditure during year 2015-16 of which Rs. 2.50 Crore has been released to e-
municipality vendor in the year 2015-16 and Rs. 9.16 lakh has been spent on training & capacity building and workshops & seminars.
• What are the issues that are been identified during the review? (350 words)
Due to shortage of manpower in the ULBs, trainings could not be organized. Due to administrative reasons, the appointment of
professionals for SMMU & CMMU could not be finalized.
• Have the A&OE fund used only for admissible components? (200 words)
Yes, the funds for A&OE are being specifically utilized on the components approved in the SAAP 2015-16.
• How the ULB/State wants to carry out the implementation of the projects, (establishment of IRMA/PDMC/SMMU/CMMU)? (350 words)
The projects are proposed to be implemented through SMMU & CMMU with additional quality check through IRMA. Individual
professionals for SMMU & CMMU are under the process of appointment and likely to be placed in the month of November, 2016.
3. Financing of Projects
Financing is an important element of the SAAP. The Guidelines define the share of funding between the Central Government, the State
Governments and the ULBs. The following responses to various issues are given below.
What is the State contribution to the SAAP? (It should not be less than 20 percent of the total project cost, Para 7.4 of AMRUT
Guidelines)

Bihar State Annual Action Plan under AMRUT
For Remaining Years of Mission Period
Urban Development & Housing Department Page 109
The State Government’s share will not be less than 20% of the project cost in general. However, the State Government may consider
increasing its contribution to specific ULBs on a case-to-case basis in case there are shortfalls even after taking into account all sources
of ULB funding. The state contribution for Patna Drainage project will be 46.67%.
Fill out Table 3.4 at pg.45 of AMRUT Guideline.How the residual financing (over and above Central Government share) is
shared between the States, ULBs?
The duly filled-up Table 3.4 is given in chapter-1 at page 30.
Funding requirements other than the Central share will be met jointly by the State Government and the concerned ULBs. The State
Government will contribute a minimum 20% share of the total project cost while the ULBs will meet the remaining project cost. ULBs will
utilize the funds available under the 14th Finance Commission Grants, the 5th State Finance Commission Grants, Swachh Bharat
Mission Grants, donor funded projects (ADB, DFID) and user charges. In case of shortfalls after all options have been duly explored, the
State may consider additional funding on a case-to-case basis.
Fill out Table 3.3 at pg.44 of AMRUT Guideline.Have any other sources been identified by the State/ULB (e.g. PPP, market
borrowing)? Please discuss.
The duly filled up Table 3,3 has been given below.
The State will explore alternate funding options at an appropriate time in the Mission period since ULBs need to be financially stronger
to attract funds from the market.
Whether complete project cost is linked with revenue sources in SAAP? How?
Bihar State Annual Action Plan under AMRUT
For Remaining Years of Mission Period
Urban Development & Housing Department Page 110
Project costs have been linked to all possible funding/revenue sources. However, the State Government may step in as required on a
case-to-case basis as the Mission progresses.
Have projects been dovetailed with other sectoral and financial programmes of the Centre and State Governments?
Projects have been dovetailed with other sectoral and financial programmes of the Central Government like the JnNURM, ADB, Swachh
Bharat Mission, Namami Gange, Smart Cities Mission, 14th Finance Commission etc.
Has the state/UT explored the possibility of using Public Private Partnerships (PPP), as a preferred execution model? Please
discuss.
Bihar has very few examples of PPP as a preferred execution model. There are some examples of outsourcing of solid waste collection
but the scale of such operations is very small. The financial weaknesses of the ULBs are not conducive to attracting potential partners
under the PPP arrangement to execute projects. The State has some way to go before this can be considered as an execution model.
Any PPP options included in appropriate Service Level Agreements (SLAs) which may lead to the People Public Private
Partnership (PPPP) model? How?
The SAAP for Bihar does not have a very major focus on this aspect although; it may be explored for the maintenance of parks in some
of the ULBs.
Table 3.3: SAAP- ULB Wise Source of Funds for All Sectors
For Remaining Years of Mission Period
(Amount in Rs. Crores)

Bihar State Annual Action Plan under AMRUT
For Remaining Years of Mission Period
Urban Development & Housing Department Page 111
Name of City
Centre State ULB Convergence Others (e.g.
incentive)
Total
14th
FC
Others Total 14th
FC
Others Total
Patna
22.23 Nil 28.92 28.92 12.79 0.00 12.79 0.00 0.00 63.94
Danapur 0.00 Nil 0.00 0.00 0.00 0.00 0.00 0.00 0.00 0.00
Biharshariff 39.28 Nil 23.57 23.57 0.40 15.31 15.71 17.27 0.00 95.83
Sasaram 17.35 Nil 10.41 10.41 0.00 6.94 6.94 0.00 0.00 34.70
Dehri 9.97 Nil 5.98 5.98 0.00 3.99 3.99 0.00 0.00 19.94
Ara 31.10 Nil 18.66 18.66 0.20 12.24 12.44 0.00 0.00 62.20
Buxar 23.80 Nil 14.28 14.28 0.00 9.52 9.52 0.00 0.00 47.59
Mujaffarpur 0.50 Nil 0.30 0.30 0.20 0.00 0.20 0.00 0.00 1.00
Motihari 40.05 Nil 24.03 24.03 0.20 15.82 16.02 0.00 0.00 80.11
Bettiah 7.41 Nil 4.45 4.45 0.10 2.86 2.96 13.88 0.00 28.70
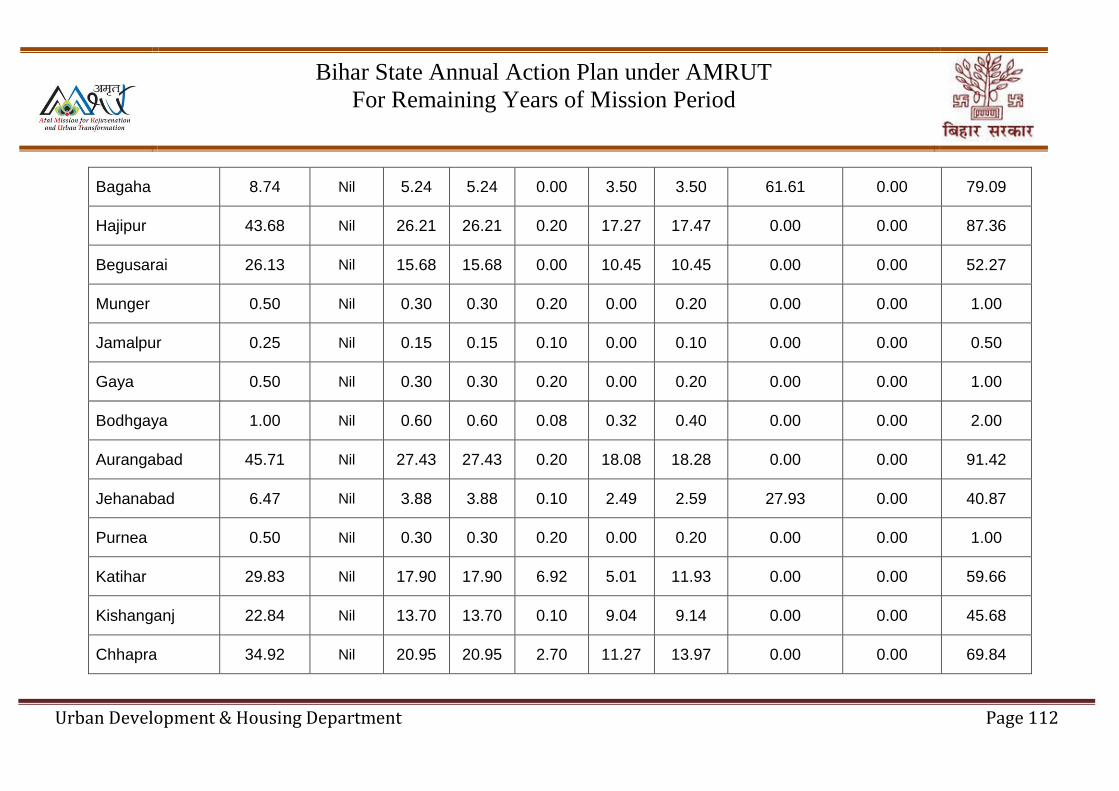
Bihar State Annual Action Plan under AMRUT
For Remaining Years of Mission Period
Urban Development & Housing Department Page 112
Bagaha 8.74 Nil 5.24 5.24 0.00 3.50 3.50 61.61 0.00 79.09
Hajipur 43.68 Nil 26.21 26.21 0.20 17.27 17.47 0.00 0.00 87.36
Begusarai 26.13 Nil 15.68 15.68 0.00 10.45 10.45 0.00 0.00 52.27
Munger 0.50 Nil 0.30 0.30 0.20 0.00 0.20 0.00 0.00 1.00
Jamalpur 0.25 Nil 0.15 0.15 0.10 0.00 0.10 0.00 0.00 0.50
Gaya 0.50 Nil 0.30 0.30 0.20 0.00 0.20 0.00 0.00 1.00
Bodhgaya 1.00 Nil 0.60 0.60 0.08 0.32 0.40 0.00 0.00 2.00
Aurangabad 45.71 Nil 27.43 27.43 0.20 18.08 18.28 0.00 0.00 91.42
Jehanabad 6.47 Nil 3.88 3.88 0.10 2.49 2.59 27.93 0.00 40.87
Purnea 0.50 Nil 0.30 0.30 0.20 0.00 0.20 0.00 0.00 1.00
Katihar 29.83 Nil 17.90 17.90 6.92 5.01 11.93 0.00 0.00 59.66
Kishanganj 22.84 Nil 13.70 13.70 0.10 9.04 9.14 0.00 0.00 45.68
Chhapra 34.92 Nil 20.95 20.95 2.70 11.27 13.97 0.00 0.00 69.84

Bihar State Annual Action Plan under AMRUT
For Remaining Years of Mission Period
Urban Development & Housing Department Page 113
Siwan 21.77 Nil 13.06 13.06 0.10 8.61 8.71 0.00 0.00 43.53
Darbhanga 9.57 Nil 5.74 5.74 0.20 3.63 3.83 0.00 0.00 19.15
Bhagalpur 1.00 Nil 0.60 0.60 0.40 0.00 0.40 0.00 0.00 2.00
Saharsa 0.00 Nil 0.00 0.00 0.00 0.00 0.00 0.00 0.00 0.00
Total 445.10
Nil 282.65 282.65 25.59 156.35 181.94 120.69 0.00 1030.38
URBAN DEVELOPMENY & HOUSING DEPRTMENT First Floor, Vikas Bhawan, New CSecretariat, Belley Road, Patna
Phone : 0612-2215580 website: www.urban.bih.nic.in