GOT IT COVERED? INSURANCE IN A CHANGING...
44
This report assesses the insurance sector response to the recommendations of the Task Force on Climate-related Financial Disclosures ( TCFD) and features an index of the world’s 80 largest insurers rated on their approach to climate-related risks and opportunities. | May 2018 GOT IT COVERED? INSURANCE IN A CHANGING CLIMATE
-
Upload
nguyendang -
Category
Documents
-
view
217 -
download
0
Transcript of GOT IT COVERED? INSURANCE IN A CHANGING...
This report assesses the insurance sector response to the recommendations of the Task Force on Climate-related Financial Disclosures (TCFD) and features an index of the world’s 80 largest insurers rated on their approach to climate-related risks and opportunities. | May 2018
GOT IT COVERED? INSURANCE IN A CHANGING CLIMATE

ShareAction gratefully acknowledges the financial support of the European Climate Foundation, Finance Dialogue, Hewlett Foundation and the KR Foundation for this project. These foundations kindly supported this project, but the views expressed are those of ShareAction. More information is available on request.
We would further like to thank the panel of experts who gave their time to provide guidance to inform this research project, and particularly the development of the methodology and feedback during the review process.
We also acknowledge the efforts made and time given to supply information by individuals who were nominated to represent their companies in this assessment.
Report written and produced by: Toby Belsom, Pavel Kirjanas, Felix Nagrawala, Sam Hayward, and Peter Uhlenbruch of ShareAction, as well as Emily Franklin of the Imperial College Centre for Environmental Technology.
The Asset Owners Disclosure Project (AODP) rates and ranks the world’s largest institutional investors and assesses their response to climate-related risks and opportunities. The ratings are made public, providing much-needed transparency for beneficiaries, clients, investors and stakeholders, and emphasised through advocacy and direct engagement to drive change.
In June 2017, ShareAction announced an agreement to take over the reins of the Asset Owners Disclosure Project (AODP). The intention was to build on the strong foundations established by 10 years of experience carrying out climate-related investor analysis. As the only comprehensive, climate-specific, independent, non-self-selective assessment, AODP prides itself on being the world’s benchmark of climate leadership in the investment system.
ACKNOWLEDGEMENTS
ABOUT AODP AND SHAREACTION

CONTENTS
ABOUT AODP AND SHAREACTION
02 FOREWORD04 EXECUTIVE SUMMARY08 METHODOLOGY 10 KEY FINDINGS 11 AODP GLOBAL CLIMATE INDEX 2018 13 GEOGRAPHIC COVERAGE 18 TCFD – GOVERNANCE & STRATEGY 24 TCFD – RISK MANAGEMENT 30 TCFD – METRICS & TARGETS 35 BAN KI-MOON’S INSURANCE SECTOR CHALLENGE39 APPENDIX41 DISCLAIMER
Climate change poses risks for insurance companies, so do responses to it by markets, businesses, consumers and governments. These risks need to be understood and addressed by insurance companies as well as insurance regulators who are responsible for the stability and soundness of insurance companies and insurance markets.
These risks arise through three channels: the physical effects of climate change, the impact of changes associated with a transition to a lower carbon economy, and potential liability risk for those businesses whose activities have contributed to climate change. All three of these categories of risk can have impacts on the business operations, underwriting and financial reserving of insurance companies.
The financial impacts related to transition risk are of particular concern as they implicate the potential reallocation of tens of trillions of dollars of investments. Insurance companies, insurance regulators, investors and the public need to recognize, disclose and address these climate-related financial risks, as well as the other climate change related risks.
To this end, as California’s Insurance Commissioner overseeing the fourth largest insurance market in
the world and largest in the United States, I have required insurance companies to disclose publicly their investments in oil, gas, coal and utilities so that insurance companies, investors, regulators and the public are better able to consider and address financial risks to fossil fuel investments held by insurers which face the greatest transition risks. We also administer the National Association of Insurance Commissioners (NAIC) Climate Risk Disclosure Survey of insurance companies, helped found and participate in the international Sustainable Insurance Forum which enables insurance regulators to develop and share best practices related to climate risk and insurance supervision, and we engage with insurance companies regarding climate-related risks as we perform our prudential regulatory responsibilities.
We welcome this report by Asset Owners Disclosure Project (AODP), which has collected important information about the 80 largest global insurers’ recognition of and responses to climate-related risk. It is important to note that the AODP report follows the disclosure structure recommended by the Financial Stability Board’s Task Force on Climate-related Financial Disclosures, which was arrived at with input from the financial sector including insurers, as well as investors and regulators.
“We welcome this report by Asset Owners Disclosure Project (AODP), which has collected important information about the 80 largest global insurers’ recognition of and responses to climate related risk.” Dave Jones, California’s Insurance Commissioner
FOREWORD 02

We look forward to using the information contained in the report as we consider insurance companies’ response to climate risk and as we consider additional regulatory steps to make sure that insurers are considering and addressing climate-related risks. Insurance companies, regulators, investors and society at large will need to continue to work together to address the immense challenges of climate change and climate-related risks. This Asset Owners Disclosure Project report makes an important contribution to this effort.
Dave Jones California’s Insurance Commissioner
Dave Jones leads the California Department of Insurance and regulates California’s insurance market – the largest insurance market in the US – where insurers collect $288 billion a year in premiums.
Jones is an international leader on climate change and the regulation of insurance. He was the Founding Chair of the Sustainable Insurance Forum, a network of global insurance regulators.
03

04
The impacts of climate-related risks are a growing reality for the insurance sector. This reality has key implications for that sector's valuation. Weather-related financial losses, regulatory and technological changes, liability risks, and health impacts related to climate change have implications for the business operations, underwriting, and financial reserving of insurance companies.
This survey utilises the framework provided by the Task Force on Climate-related Financial Disclosures (TCFD) to benchmark responses from the world’s 80 largest insurers to our survey on climate-related risks and opportunities. As such, we hope it makes a significant contribution to the debate surrounding the role of the insurance sector in addressing climate change, resulting in real improvements across the sector.
LEADERS AND LAGGARDS
Finding 1, 2, 3, 4 & 5: AXA, Aviva, Allianz SE, and Legal & General are leading the way on climate risk. Tokio Marine, Legal & General, Credit Agricole, Allianz SE, Generali, NN Group, and Swiss Re showing the best year-on-year improvement when compared to the previous AODP 2017 Global Climate survey.
Perhaps unsurprisingly, the wealth of debate around climate disclosures means European insurers continue to dominate the leaderboard.
In contrast, with 43% of the poorly (D or X) rated insurers, the US is home to the most laggards. That said, an assessment of climate disclosure at The Hartford, MetLife, and Travelers provide evidence that certain US insurers are getting serious about tackling these issues. Japanese insurers have seen a notable improvement in climate-related disclosures. Tokio Marine, the leading Japanese insurer, is rated BBB.
The TCFD recommendations provide a framework for our assessment, which looks at the companies' dual role: as insurers and asset owners.
TCFD GOVERNANCE AND STRATEGY
Finding 6: Climate-related issues are primarily viewed as a risk related to underwriting and investment portfolios, not as a business opportunity
“Weather-related financial losses, regulatory and technological changes, liability risks, and health impacts related to climate change have implications for the business operations, underwriting, and financial reserving of insurance companies.”
EXECUTIVE SUMMARY

05
More than two thirds (69%) of the assessed insurers were able to disclose financially material climate-related risks but only 41% were able to identify business opportunities.
Finding 7: Reporting on climate risks differs between business models and area of operations Direct insurers (property, real estate, corporate) and reinsurers have a greater tendency to identify climate-related risks when compared to life insurers.
Finding 8: Just a third of insurers surveyed can say their approach to investing is climate-aware
34% have introduced policies, objectives, and strategies that aim for alignment with the goals of the Paris Agreement on energy transition or have integrated climate risk policy across asset portfolios. Despite these encouraging steps, 41% have not formalised their approach to climate-related risks and portfolio management. A further 25% applied a limited approach that is guided by a broad set of sustainability principles but is not explicit about climate issues.
Finding 9: Among the leaders, commitments on capital allocation are widespread
The most common climate-relevant policy commitments covering portfolio management relate to capital allocation to invest in renewable energy assets, reduce exposure to carbon-intensive assets (e.g. by excluding fossil fuels), or increase involvement in the rapidly growing green bond market.
Finding 10: Ceasing underwriting and investing in thermal coal is becoming a barometer of commitment to climate action
Due to recent high-profile campaigns and corporate failures in the coal sector, insuring, underwriting and investing in thermal coal assets has proved to be controversial for insurers. The survey results show that work needs to be undertaken on formalising approaches and creating a common set of guidelines related to exclusion of thermal coal assets.
Finding 11: The use of climate scenario analysis is still in its infancy
For asset owners, scenario analysis is a key tool given by the TCFD recommendations. However, the use remains in its infancy, and only 10% of the assessed insurers have undertaken scenario analyses, with a further 8% considering their approach.

06
TCFD RISK MANAGEMENT
Finding 12: Engagement with investee companies on climate-related risks is largely limited to improving their disclosures. Few insurers disclose escalation strategies with investee companies
The survey shows that 30% of insurers surveyed use engagement with companies as a risk management or mitigation tool. Promoting improved disclosure is more widespread than promoting actions, such as linking remuneration with climate targets. Few insurers have a clearly identified mechanism to escalate engagement.
Finding 13: There is a variety of approaches to portfolio and insurance risk analysis, with analysis of physical risks in response to weather events being more common. Carbon footprinting is the most commonly reported technique used for portfolio risk analysis.
The analysis of value at risk from weather-related events was commonplace, but few insurers reported assessing their liability risk or other transition risks related to climate change.
TCFD METRICS & TARGETS
Finding 14: Metrics & Targets is a gap in the implementation of the TCFD recommendations.
Relative to other sectors, the insurance sector scored poorly on Metrics & Targets. This is supported by the finding of ShareAction’s recent climate assessment of the European banking sector.
Finding 15 & 16: Less than a third of the largest insurers have measured their portfolio emissions
However, this represents an increase from 11% in 2017. Data quality and coverage remain a key barrier to developing effective decision-making tools in this area.
Finding 17: Low-carbon investment – On average 1% of AUM
56% of assessed insurers report they invested in low-carbon investments (LCI). Our data suggests the range of asset allocation for low-carbon investments varies significantly (from approximately 0% to 3.8% of total AUM). Based on the responses and public information, we calculate that the assessed insurers have allocated approximately 1% of their total internal assets under management to low-carbon investments. US and Canadian insurers have the most low-carbon investments, 23% of assessed insurers have pledged to increase their LCI allocation, but only 8% have set clear targets. EMEA leads on LCI pledges (52% of assessed insurers in EMEA, 15% in Asia Pacific, 3% in the Americas).
BAN KI-MOON’S INSURANCE SECTOR CHALLENGE
The last section of the report reviews sector progress against three of the challenges posed by UN Secretary-General Ban Ki-moon in 2016. Our data indicates that the industry is not on track to meet challenges 1 and 2 in the stated time frame. The challenges were:
Challenge 1: Measure carbon footprint of investment portfolios by 2020, and decarbonise investments;
Challenge 2: Double investments in sustainable energy by 2020;
Challenge 5: Develop auditable standards in the insurance industry that incorporate the Sustainable Development Goals.

Each section of the survey includes a number of specific recommendations. Key overall recommendations include:
Regulators must strengthen regulatory frameworks and mandatory requirements for climate-related disclosure,
Investors should prioritise engaging with the US insurance sector to promote better disclosure and management of climate related risks and opportunities,
To meet the challenges from Ban Ki-moon’s and the goals of the Paris Agreement, insurers need to take a more comprehensive and bold stance on climate change,
To be fully compliant with the TCFD recommendations, insurers need bridge the gap identified in the survey around metrics & targets.
07RECOMMENDATIONS
08METHODOLOGY
The AODP Global Climate Insurance Index rates and ranks the world’s largest insurance companies on their response to climate-related risks and opportunities. The objective of the insurance sector assessment was to identify leading practice, compare approaches and evaluate the level of integration of climate risk into investment and underwriting activities. The underlying analysis was carried out on public disclosures and collected via a dedicated survey.
This survey structure is aligned with the four core elements of the recommendations of the Task Force on Climate-related Financial Disclosures (TCFD): Governance, Strategy, Risk Management and Metrics & Targets. Survey questions further build on existing major reporting frameworks, including SASB (Sustainability Accounting Standards Board), UN Principles for Responsible Investment, NAIC climate risk survey, UNEP Finance Initiative Principles for Sustainable Insurance. The assessment covered insurance activities and proprietary investment portfolios. It assesses top-level strategic responses covering a corporate entity, rather than a subsidiary. This approach allows us to assess a portfolio or business-wide approach, rather than a niche investment choice. The full list of questions and
the maximum scores available in each question and section can be found in the appendix.
SCOPING
The index features the world’s 80 largest insurance companies with a combined AUM of over 15 trillion USD. The assessment scope was determined using two mechanisms: for publicly listed insurers, the 50 largest by market capitalisation were selected from the Bloomberg Industry Classification Systems (BICS), excluding insurance brokers and companies where insurance revenues accounted for less than 40% of total revenues. for mutual and private insurers, inclusion was based upon assets under management. The geographic regions of the Americas, Asia Pacific and EMEA were nearly equally represented by the number of companies as well as their cumulative AUM.
CONSULTATION
A range of stakeholders with relevant expertise and experience were consulted to feed into the design of the underlying survey. This included representatives of global NGOs, leading institutional investors, insurance industry experts, and experts on responsible investment reporting frameworks.
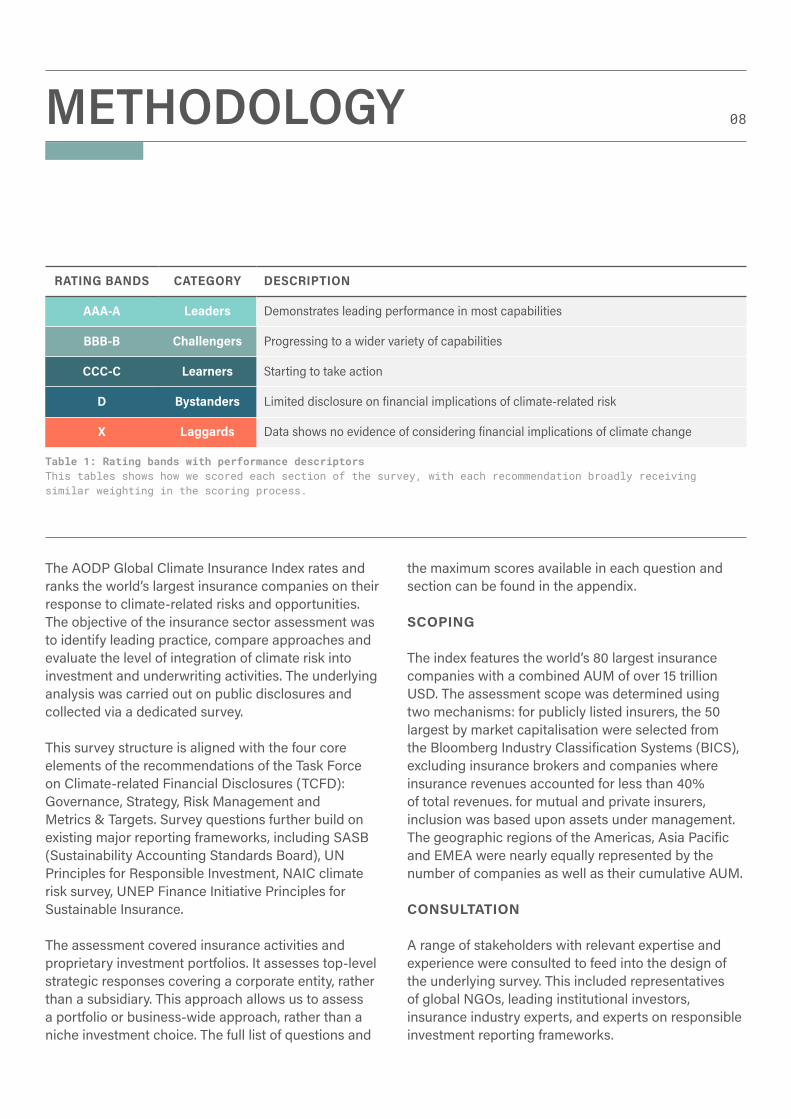
RATING BANDS CATEGORY DESCRIPTION
AAA-A Leaders Demonstrates leading performance in most capabilities
BBB-B Challengers Progressing to a wider variety of capabilities
CCC-C Learners Starting to take action
D Bystanders Limited disclosure on financial implications of climate-related risk
X Laggards Data shows no evidence of considering financial implications of climate change
Table 1: Rating bands with performance descriptors This tables shows how we scored each section of the survey, with each recommendation broadly receiving similar weighting in the scoring process.

09
SURVEY PROCESS
Initial letters were sent to the Chief Executive Officers of the 80 insurers to invite participation in the research process. The survey was then sent via email to the nominated respondent or to a relevant contact in the AODP contact database. Over 3 months was allowed for insurers to complete the survey and submit their disclosure. Extensions were provided for some insurers and feedback was encouraged from participants.
RESEARCH
In the case of insurers who chose not to submit a survey response the AODP research team populated a response based on publicly available information. Key sources included 2016/2017 Annual and Sustainability reports; CDP climate change disclosure; NAIC climate risk survey disclosure; UN PRI transparency reports; UN Principles for Sustainable Insurance disclosure. In instances where information was not available in English, AODP hired external translators to work alongside our research team to populate the survey. Completed responses were then sent to non-disclosers prior to publication for verification and opportunity to provide further disclosure. In 2018, 24 insurance companies participated in the research process.
SECTION DESCRIPTION % WEIGHTING
GovernanceDisclose the organisation’s governance around climate-related risks and opportunities
16%
StrategyDisclose the actual and potential impacts of climate-related risks and opportunities on the organisation’s strategy
32%
Risk Management Disclose how the organisation assesses and manages climate-related risks 28%
Metrics & TargetsDisclose the metrics and targets used to assess and manage relevant climate-related risks and opportunities
23%
Table 2: TCFD core recommendations – Survey section weighting
RATING AND SCORING
The breakdown of question scoring can be seen in the appendix. Where no information was available, a score of zero was given for that question. We acknowledge that different types of insurers operate in different regulatory and policy environments and have different business models. We put effort to account for these differences in our survey design and also in the scoring of certain questions that were not appropriate to certain insurers.Rating bands are determined statistically, and each participant was assigned a rating applicable to their aggregated score, from AAA through to D grade, with an additional X category for those with zero score.
Scoring is not fixed but relative to peers. As a relative measure, year-on-year changes in ratings might be caused by several factors and would not necessarily be an indication of ‘weakened’ approach.
While those in the leadership category show promising policy and practices on climate-related risk relative to their industry peers, best practices continue to develop even for those leaders.
KEY FINDINGS 10
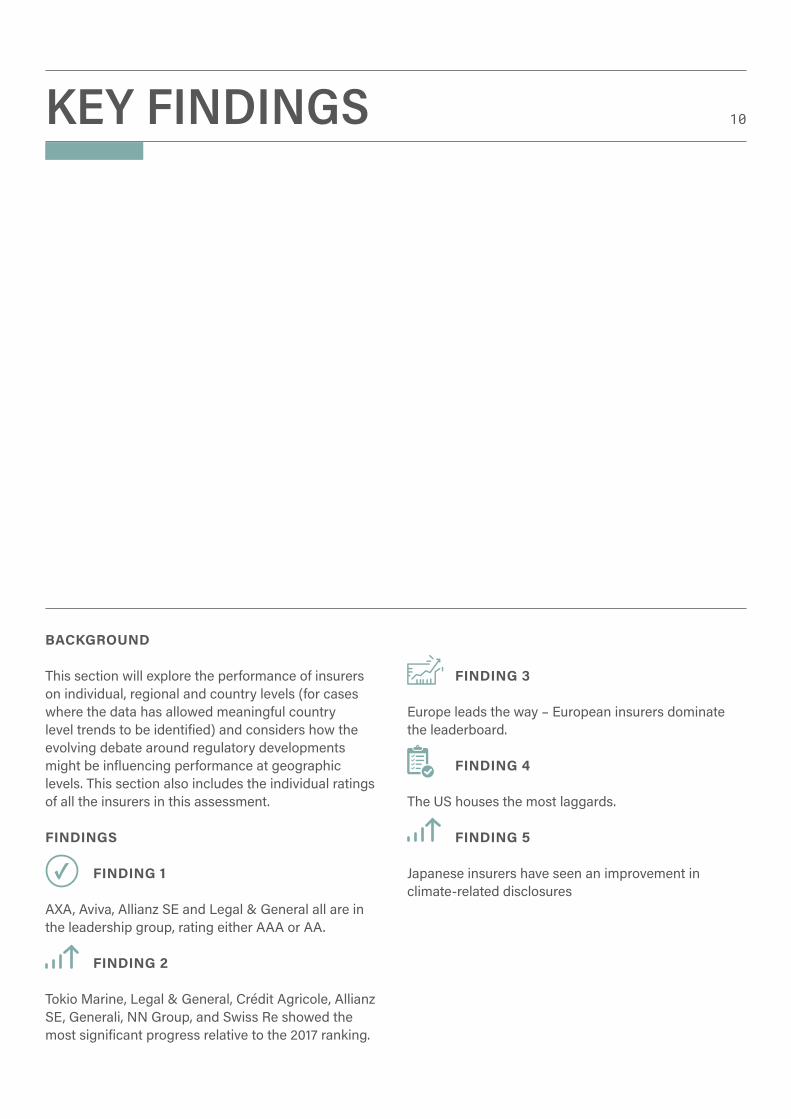
BACKGROUND
This section will explore the performance of insurers on individual, regional and country levels (for cases where the data has allowed meaningful country level trends to be identified) and considers how the evolving debate around regulatory developments might be influencing performance at geographic levels. This section also includes the individual ratings of all the insurers in this assessment.
FINDINGS
FINDING 1
AXA, Aviva, Allianz SE and Legal & General all are in the leadership group, rating either AAA or AA.
FINDING 2
Tokio Marine, Legal & General, Crédit Agricole, Allianz SE, Generali, NN Group, and Swiss Re showed the most significant progress relative to the 2017 ranking.
FINDING 3
Europe leads the way – European insurers dominate the leaderboard. FINDING 4
The US houses the most laggards. FINDING 5
Japanese insurers have seen an improvement in climate-related disclosures
✓

11AODP GLOBAL CLIMATE INDEX 2018
NAME RATING RANK 2017 RATING CHANGE COUNTRYAXA AAA 1 AA ▲ 1 FranceAviva AAA 2 AA ▲ 1 United KingdomAllianz SE AA 3 BB ▲ 3 GermanyLegal & General Group AA 4 D ▲ 8 United KingdomAegon BBB 5 BBB − NetherlandsCNP Assurances BBB 6 CCC ▲ 3 FranceTokio Marine Holdings BBB 7 D ▲ 6 JapanCrédit Agricole Assurances BBB 8 C ▲ 5 FranceZurich Insurance Group BBB 8 B ▲ 2 SwitzerlandFolksam Group BB 10 BBB ▼ 1 SwedenAssicurazioni Generali Group BB 11 D ▲ 5 ItalyNN Group B 12 D ▲ 4 NetherlandsSwiss Re B 12 D ▲ 4 SwitzerlandStorebrand B 14 BBB ▼ 2 NorwayMAIF CCC 15 D ▲ 3 FranceASR Nederland CCC 16 C ▲ 2 NetherlandsSuncorp Group Limited CCC 17 n/a n/a AustraliaNippon Life CCC 18 D ▲ 3 JapanDai-ichi Life CC 19 D ▲ 2 JapanMS&AD Insurance CC 19 C ▲ 1 JapanNatixis Assurances CC 21 D ▲ 2 FranceThe Hartford CC 22 CCC ▼ 1 USASompo Holdings CC 23 D ▲ 2 JapanMunich Re CC 24 C ▲ 1 GermanyHannover Re C 25 D ▲ 1 GermanyManulife C 26 CC ▼ 1 CanadaAMP Limited C 27 D ▲ 1 AustraliaMetLife C 28 D ▲ 1 USATravelers C 29 D ▲ 1 USAPrudential plc C 30 D ▲ 1 United KingdomAchmea C 31 BB ▼ 4 NetherlandsLincoln National Corporation D 32 D − USAAllstate D 33 D − USAGreat-West Lifeco D 34 C ▼ 1 CanadaGroupama SA D 35 D − FranceFubon Financial D 36 D − TaiwanIndustrial Alliance Financial Group D 37 C ▼ 1 CanadaAmerican International Group D 38 n/a n/a USAPrudential Financial D 39 D − USACincinnati Financial D 40 D − USANew York Life D 41 X ▲ 1 USA
TABLE CONTINUES →

12
NAME RATING RANK 2017 RATING CHANGE COUNTRYTalanx D 41 D − GermanySun Life Financial D 41 D − CanadaChubb D 44 D − USASampo Group D 45 D − FinlandNationwide Mutual Insurance Company D 46 D − USAProgressive D 47 X ▲ 1 USAChina Pacific Insurance D 48 D − ChinaAIA D 49 D − Hong KongMeiji Yasuda Life D 50 D − JapanVoya Financial D 50 D − USAGenworth Financial D 50 D − USAPICC Group D 50 D − ChinaAmeriprise Financial D 50 X ▲ 1 USAT/D Holdings D 55 D − JapanCathay Financial Holding D 56 X ▲ 1 TaiwanPing An Insurance D 57 D − ChinaSamsung Life D 57 D − South KoreaMarkel D 57 n/a n/a USASwiss Life Group D 60 X ▲ 1 SwitzerlandFairfax Financial Holdings D 60 D − CanadaPrincipal Financial Group D 62 X ▲ 1 USANorthwestern Mutual D 63 D − USAArch Capital Group D 64 X ▲ 1 USAState Farm Insurance Companies D 65 X ▲ 1 USASumitomo Life D 66 D − JapanCNA Financial Corporation D 66 X ▲ 1 USAJapan Post Insurance D 68 D − JapanAccident Compensation Corporation D 68 D − New ZealandZenkyoren X 70 X − JapanNew China Life Insurance X 70 n/a n/a ChinaChina Life Insurance Company X 70 X − ChinaChunghwa Post X 70 X − TaiwanMassMutual X 70 X − USAAflac X 70 X − USAAgeas Group X 70 X − BelgiumPacific Life X 70 D ▼ 1 USAMitsui Life X 70 X − JapanGreat Eastern Holdings X 70 n/a n/a SingaporeNTUC Income X 70 n/a n/a Singapore
Note on table n/a were not rated by AODP in 2017
Table 3: AODP rating table 2018 – 80 global insurers. Includes change against AODP 2017 index

13
As indicated in the chart above, the assessed insurers are fairly evenly represented across the EMEA, Asia Pacific and the Americas regions. Performance at regional and country levels has been considered by reviewing the averaged insurer scores for each respective geographic segment.
The table below shows that EMEA is the clear regional leader followed by Asia Pacific and the Americas, which displayed the weakest regional performance. The following paragraphs explore how key country performance trends have driven regional performance.
Figure 4: Insurers surveyed in 2018 across regions | *By number of insurers surveyed
AMERICAS
Number of insurers rated
EMEA ASIA PACIFIC
GEOGRAPHIC COVERAGE
29 25 26
14
FINDING 3
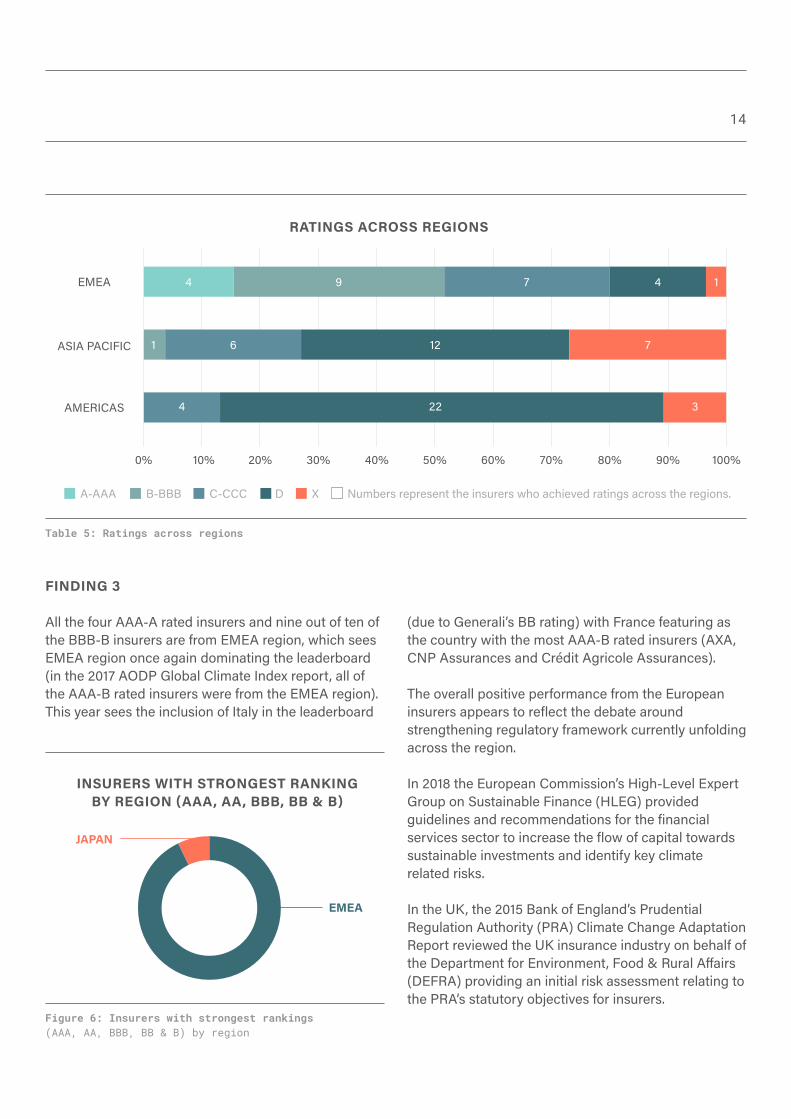
All the four AAA-A rated insurers and nine out of ten of the BBB-B insurers are from EMEA region, which sees EMEA region once again dominating the leaderboard (in the 2017 AODP Global Climate Index report, all of the AAA-B rated insurers were from the EMEA region). This year sees the inclusion of Italy in the leaderboard
INSURERS WITH STRONGEST RANKING BY REGION (AAA, AA, BBB, BB & B)
Figure 6: Insurers with strongest rankings (AAA, AA, BBB, BB & B) by region
Table 5: Ratings across regions
EMEA
4
1
4 9 7 4 1
6 12 7
22 3
RATINGS ACROSS REGIONS
ASIA PACIFIC
AMERICAS
0% 10% 20% 30%
A-AAA B-BBB C-CCC D X Numbers represent the insurers who achieved ratings across the regions.
40% 50% 60% 70% 80% 90% 100%
(due to Generali’s BB rating) with France featuring as the country with the most AAA-B rated insurers (AXA, CNP Assurances and Crédit Agricole Assurances).
The overall positive performance from the European insurers appears to reflect the debate around strengthening regulatory framework currently unfolding across the region.
In 2018 the European Commission’s High-Level Expert Group on Sustainable Finance (HLEG) provided guidelines and recommendations for the financial services sector to increase the flow of capital towards sustainable investments and identify key climate related risks.
In the UK, the 2015 Bank of England’s Prudential Regulation Authority (PRA) Climate Change Adaptation Report reviewed the UK insurance industry on behalf of the Department for Environment, Food & Rural Affairs (DEFRA) providing an initial risk assessment relating to the PRA’s statutory objectives for insurers.
EMEA
JAPAN

15
AMERICASUSA
AMERICASCANADA
ASIA PACIFICCOUNTRIES
EMEACOUNTRIES
INSURERS WITH WEAKEST RANKINGS BY COUNTRY (D & X)
214195
Figure 7: Insurers with D and X rankings by region
In France, 2015 saw the adoption of the French Energy Transition for Green Growth Law (or Energy Transition Law), also known as Article 173. Article 173 is a ‘comply or explain’ mandate that requires institutional investors to report on how ESG factors are integrated into investment decisions, as well as on how investors are supporting the energy transition. The overall positive performance from the European insurers appears to reflect the societal and political momentum in the region on climate change and low carbon transition. At EU level, significant proposals are in under development to strengthen financial supervision of climate related risks as well as regulatory requirements on financial institutions.
FINDING 4
Of the 49 insurers who received a D or X rating, 43%
came from the US, contributing to the overall poor performance of the Americas relative to the Asia Pacific and EMEA regions. There are some exceptions. The Hartford, MetLife and Travelers all gained C grading or above.
In the US, there has been an effort to strengthen oversight of the insurance sector in relation to climate risk and disclosure through the introduction of the National Association of Insurance Commissioners (NAIC) ‘Insurer Climate Risk Disclosure Survey’ (adopted in 2010 by California Department of Insurance). This is a mandatory reporting initiative containing eight climate-related questions that cover investment, mitigation, financial solvency, emissions/carbon footprint and engaging customers. However, due to the structure, the survey allows respondents to avoid recognising climate risk. The NAIC survey in 2016 was administered on a mandatory basis in six states:

16
FINDING 5
We recorded a notable improvement in the rating of Japanese insurers since the last AODP assessment in 2017. Five insurers shifted upwards in the index. Tokio Marine achieved a BBB rating thus joining the leaderboard and becoming the only non-European insurer in the AAA-A and BBB-B rating bands.
It is not immediately clear what has driven the improvement in climate disclosures in Japan. However, we believe changes among major institutional investors might have contributed to this trend. For example, Japan’s largest asset owner, the Government Pension Investment Fund (GPIF), is increasingly taking steps to integrate ESG factors into its investment processes, and this is starting to ripple through Japan’s financial ecosystem, including insurers. Another point of influence could be Japan’s Stewardship Code (a voluntary regulatory tool first published in 2014 and since revised in 2017), which encourages institutional investors to improve and foster their investments’ value and sustainable growth via constructive engagement or purposeful dialogue. The 2017 revisions included new guidance around the role of asset owners in issuing mandates and monitoring their asset managers. Of the 221 institutional signatories, 22 are insurance companies.
California, Connecticut, Minnesota, New Mexico, New York and Washington.
Despite these efforts many US insurers performed poorly with the majority of the assessed US insurers towards the lower end of the index. The mandatory climate survey adopted by NAIC appeared to have provided more information compared to insurers’ financial reports, but levels of disclosure varied. For example, in three cases where insurers NAIC survey responses yielded them no score in our assessment:
1. Insurers who answered NAIC survey questions negatively; AODP assessment gives no score for a negative response, e.g. “The company does not have a climate change policy”.
2. Insurers who answered positively but provided contrary commentary; AODP assessment gives no score for a response where no climate-positive outcome was achieved, e.g. “We considered the impact of climate change on the investment portfolio but identified no significant climate-related risks”.
3. Insurers who viewed climate issues only from an operational perspective; AODP assessment scope covers proprietary investment assets as well as insurance business but gives no score for operational activities such as improving the energy efficiency of a company’s office buildings, supporting environmental charities etc.
As outlined above, insurers receiving no scores in the AODP assessment, despite responding to NAIC, is possibly due are a likely result of the lack of pressure from insurers’ primary interest groups. Unlike Article 173 in France, which requires for climate disclosures to be incorporated into insurers’ annual report, NAIC survey responses are collected in a public database accessible through the California Department of Insurance website which are less visible to both shareholders and policyholders.

FOR REGULATORS AND SUPERVISORS
FOR INVESTORS IN THE INSURANCE SECTOR
We recommend a rapid strengthening of regulation covering insurers’ management of, and disclosures on, climate-related risks and opportunities, including investment risks and opportunities. Insurance supervisors in every region need a clear mandate to drive up standards amongst regulated entities in respect of climate-risk management. This will require that supervisors themselves undergo appropriate training and have the skilled personnel in their teams to assess the risks being run by the entities they supervise.
Institutional investors should focus engagement on US insurers, where the survey has identified weaker rankings on the management of cliamte related risks. They should encourage US insurance companies to improve their management climate-related investment and insurance risks and opportunities.
GEOGRAPHIC COVERAGE: RECOMMENDATIONS 17

18TCFD – GOVERNANCE & STRATEGY
“Just a third of insurers surveyed can say their approach to investing is climate-aware.”
BACKGROUND
This section will review the response to the questions that covered the Governance & Strategy section of the TCFD recommendations. The set of questions related to governance covered 3 topics:
• Board accountability (3 questions);• Executive accountability (1 question);• Education and awareness (3 questions).
The set of questions related to strategy covered 3 topics:
• Identifying risks and opportunities (1 question); • Integration of risks and opportunities into strategy
(6 questions);• Strategy resilience and alignment (2 questions
FINDINGS
FINDING 6
Climate-related issues are primarily viewed as a risk related to underwriting and investment portfolios, not as a business opportunity.
FINDING 7
Reporting climate risks differs between business models and areas of operations. FINDING 8
Just a third of insurers surveyed can say their approach to investing is climate-aware. FINDING 9
Among the leaders, policy commitments on capital allocation are most widespread. FINDING 10
Underwriting and investing in thermal coal is becoming a barometer of commitment to climate action.
FINDING 11
The use of climate scenario analysis is still in its infancy.

19
FINDING 6
More than two thirds (69%) of the assessed insurers were able to identify financially material climate-related risks for their underwriting and investment portfolios. Our assessment shows that insurers are better positioned to disclose business risks posed by climate change rather than identify potential opportunities. Only 41% were able to disclose business opportunities. Though there are some exceptions, a qualitative comparison with ShareAction’s recent assessment of Europe’s leading banks, highlights that the insurance sector lags behind the banking sector in terms of product innovation.
FINDING 7
Direct insurers (property, real estate, corporate) and reinsurers have a greater tendency to identify climate-related risks when compared to life insurers. The latter often refer to the fact that direct insurers have a more obvious exposure to climate-related risks. For direct insurers and reinsurers, the level of weather-related losses clearly has a material and immediate impact on business profitability. However, the Prudential Regulation Authority (PRA) at the Bank of England identified a number of long-term climate-related risks that affect life insurers. Air pollution, diseases, natural disasters, and weather events all could affect health, morbidity, and mortality rates. Following a long-term assessment of mortality rates and the management of assets, the PRA found that life insurers face, in fact, more pressure to meet long-term financial obligations. Such financial liabilities and obligations are subject to unquantifiable changes due to climate change and yet a large share of life insurers have not identified climate-related risks as material to their business, as shown in the graph below.
Figure 9: insurers who identified climate-related risks and opportunities
Figure 10: insurers by type who identified climate-related risks and opportunities
HAVE IDENTIFIED LIFE
MIXED
DIRECT
REINSURANCE
NAMED KEY RISKS
NAMED KEYOPPORTUNITIES 33
49
INSURERS WHO IDENTIFIED CLIMATE-RELATED RISKS AND OPPORTUNITIES
INSURERS BY TYPE WHO IDENTIFIED CLIMATE-RELATED RISKS AND
OPPORTUNITIES
0% 0%20% 20%40% 40%60% 60%
YES YESNO NO
80% 80%100% 100%
5518
29
6
2
20
FINDING 8
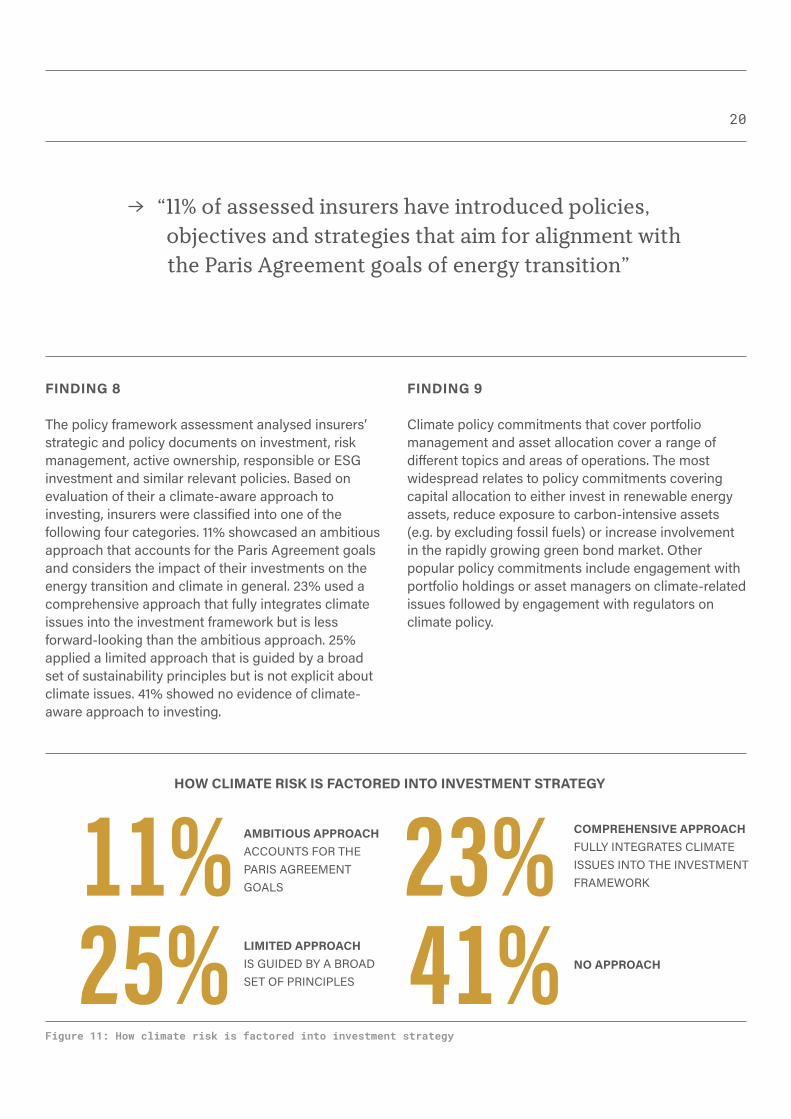
The policy framework assessment analysed insurers’ strategic and policy documents on investment, risk management, active ownership, responsible or ESG investment and similar relevant policies. Based on evaluation of their a climate-aware approach to investing, insurers were classified into one of the following four categories. 11% showcased an ambitious approach that accounts for the Paris Agreement goals and considers the impact of their investments on the energy transition and climate in general. 23% used a comprehensive approach that fully integrates climate issues into the investment framework but is less forward-looking than the ambitious approach. 25% applied a limited approach that is guided by a broad set of sustainability principles but is not explicit about climate issues. 41% showed no evidence of climate-aware approach to investing.
“11% of assessed insurers have introduced policies, objectives and strategies that aim for alignment with the Paris Agreement goals of energy transition”
AMBITIOUS APPROACH ACCOUNTS FOR THE PARIS AGREEMENT GOALS
LIMITED APPROACH IS GUIDED BY A BROAD SET OF PRINCIPLES
NO APPROACH
COMPREHENSIVE APPROACH FULLY INTEGRATES CLIMATE ISSUES INTO THE INVESTMENT FRAMEWORK
HOW CLIMATE RISK IS FACTORED INTO INVESTMENT STRATEGY
11% 23%25% 41%
Figure 11: How climate risk is factored into investment strategy
FINDING 9
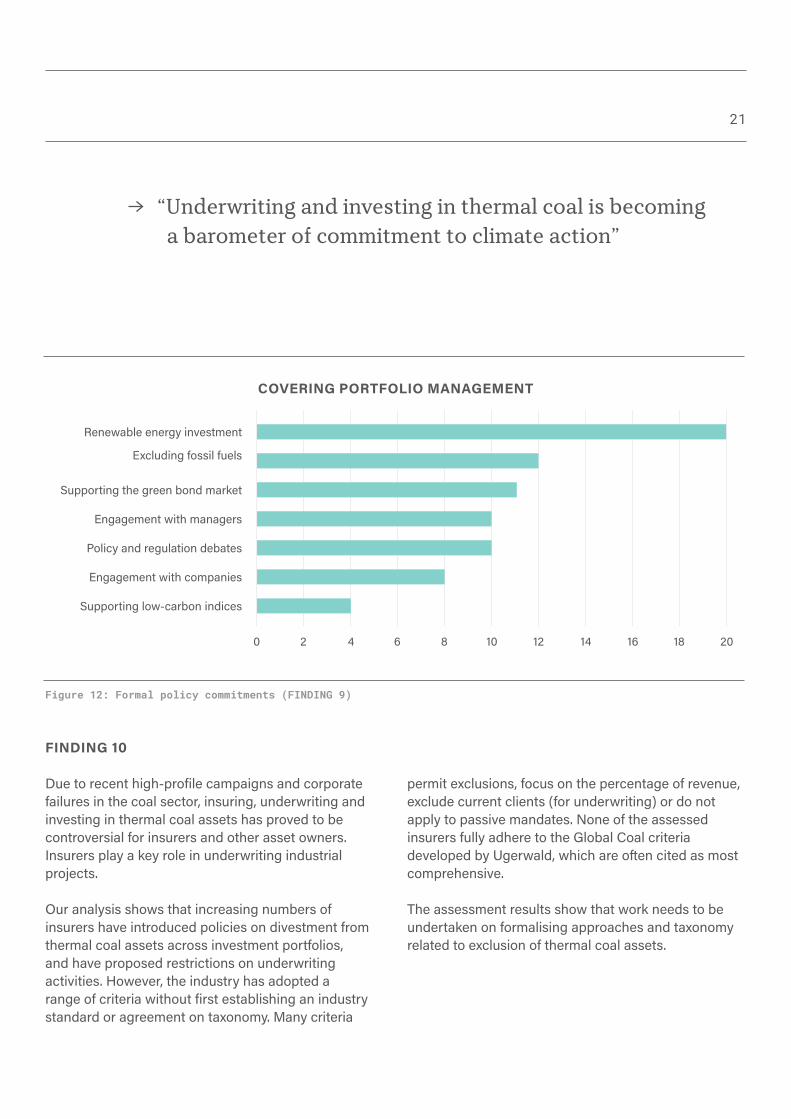
Climate policy commitments that cover portfolio management and asset allocation cover a range of different topics and areas of operations. The most widespread relates to policy commitments covering capital allocation to either invest in renewable energy assets, reduce exposure to carbon-intensive assets (e.g. by excluding fossil fuels) or increase involvement in the rapidly growing green bond market. Other popular policy commitments include engagement with portfolio holdings or asset managers on climate-related issues followed by engagement with regulators on climate policy.
21
FINDING 10
Due to recent high-profile campaigns and corporate failures in the coal sector, insuring, underwriting and investing in thermal coal assets has proved to be controversial for insurers and other asset owners. Insurers play a key role in underwriting industrial projects.
Our analysis shows that increasing numbers of insurers have introduced policies on divestment from thermal coal assets across investment portfolios, and have proposed restrictions on underwriting activities. However, the industry has adopted a range of criteria without first establishing an industry standard or agreement on taxonomy. Many criteria
“Underwriting and investing in thermal coal is becoming a barometer of commitment to climate action”
Figure 12: Formal policy commitments (FINDING 9)
Engagement with companies
Engagement with managers
Renewable energy investment
Excluding fossil fuels
Supporting the green bond market
Supporting low-carbon indices
Policy and regulation debates
COVERING PORTFOLIO MANAGEMENT
2 4 6 8 10 12 14 16 18 200
permit exclusions, focus on the percentage of revenue, exclude current clients (for underwriting) or do not apply to passive mandates. None of the assessed insurers fully adhere to the Global Coal criteria developed by Ugerwald, which are often cited as most comprehensive.
The assessment results show that work needs to be undertaken on formalising approaches and taxonomy related to exclusion of thermal coal assets.

22
FINDING 11
For asset owners, scenario analysis is a key tool covered by the TCFD recommendations. However, it remains in its infancy and only 10% of the assessed insurers have undertaken climate scenario analyses, with a further 8% considering or are developing their approach. Qualitative analysis of the results shows that most of these insurers have undertaken an analysis of how their investment portfolios would be impacted under a two-degree scenario. A range of leading insurers also have undertaken analyses to explore how their portfolio is aligned with the energy transition and develop next steps in order to positively contribute to the energy transition through their portfolio investments.
“Only 10% of the assessed insurers have undertaken scenario analyses, with a further 8% considering their approach.”
8 6 66ASSESSED CONSIDERING NOT ASSESSED
Figure 13: Scenario analysis
SCENARIO ANALYSIS

FOR INDUSTRY
Climate-related issues are primarily viewed as a risk related to underwriting and investment portfolios, not as a business opportunity. Though some insurers have reviewed and developed business opportunities related to climate change, those that have should consider reviewing product innovation in this area.
Scenario analysis remain in its infancy. Though insurers have started to introduce processes and approaches to build and use scenario analysis that will develop over time. Leaders should start to develop forward looking scenario analysis and others should start the internal learning process around the introduction and implementation of scenario analysis.
TCFD – GOVERNANCE & STRATEGY: RECOMMENDATIONS 23

24TCFD – RISK MANAGEMENT
FINDINGS
FINDING 12
Engagement with investee companies on climate-related risks is largely limited to improving their disclosures. Few insurers publish escalation strategies with investee companies
FINDING 13
There is a variety of approaches to portfolio and insurances risk analysis. The most common approach utilised by insurers was to analyse transition risks such as regulatory, technological; and reputational issues on asset portfolios.
“The insurance industry (as asset owners) should do more to develop engagement strategies that go beyond purely requiring improved disclosures and promote on the introduction of science-based targets or linking remuneration with emission reductions.”
BACKGROUND
This section will review the responses to the survey questions that covered the risk management section of the TCFD recommendation. This set of questions covered 3 topics:
• Engagement (4 questions)• Portfolio tools (2 questions)• Insurance risks (2 questions)
As asset owners, insurers have increasing responsibilities and challenges to engage with portfolio holdings, regulators, credit agencies and others. The questions covering engagement covered a number of these topics. For the purposes of this survey, these were incorporated into the risk management section as the ultimate purpose of these engagements was often to alleviate or identify climate-related risks.

25
FINDING 12
AODP’s survey records that 30% of insurers in the survey use engagement with companies as a risk management or mitigation tool. The survey highlighted that engagement with companies, policymakers, industry trade associations is widespread.
Company engagement with investee companies and other third parties is commonly undertaken on better disclosure with few insurers (as asset owners) promoting initiatives which involved actions such as withdrawal from trade bodies or linking remuneration with climate ‘targets’.
Figure 14: Climate-related engagement with third parties
Investee companies
Investment consultants or advisors
Civil society organisations
Industry trade associations
Policymakers
Industry lobby groups
Credit rating agencies
CLIMATE-RELATED ENGAGEMENT WITH THIRD PARTIES
5 10 15 20 25 300
24
12
20
25
8
7
5
An ongoing criticism of much engagement undertaken by asset owners and asset managers is that they lack mechanisms for escalation if results are not forthcoming. The data supports this criticism – few insurers have clearly identified a mechanism to escalate engagement. Where escalation mechanisms have been identified - support of climate-related shareholder resolutions is the most common. A small number of leading insurers also reported time-bound objectives and divestment procedures.
“An ongoing criticism of much engagement undertaken by asset owners and asset managers is that they lack mechanisms for escalation if results are not forthcoming. The data supports this criticism – few insurers have clearly identified a mechanism to escalate engagement.”

26
Figure 16: Climate-related engagement - escalation
CLIMATE-RELATED ENGAGEMENT – ESCALATION
2 4 6 8 10 120
We file or co-file climate- related shareholder resolutions
We vote (or instruct to vote) in support of climate-related shareholder resolutions
We ensure our external managers implement a thorough engagement policy
We set time-bound engagement objectives
We follow a disinvestment procedure
4
4
2
7
10
Improving climate-related disclosure
TCFD aligned disclosure
Emissions reduction
Setting climate-related science-based targets
Scenario stress testing
Strategy alignment with a 2°C or lower scenario
Linking remuneration to climate-related KPIs
Withdrawal from trade associations which lobby against climate action
2 4 6 8 10 12 14 16 180
Figure 15: Climate-related engagement – topics
CLIMATE-RELATED ENGAGEMENT – TOPICS
16
11
6
5
5
4
2
9

27
FINDING 13
This section reviewed how insurers had utilised and developed portfolio and insurance risk analysis tools to assess and manage climate-related risks.
In portfolio risk analysis, unsurprisingly, there was a variety of approaches. The most common approach utilised by insurers was to analyse transition risks such as regulatory, technological; and reputational issues. Others had used various forms of portfolio assessments in order to estimate exposure to climate-related risks across asset classes and portfolios such as stranded assets, carbon liabilities and emerging regulatory/technological environments.
In insurance risk analysis, the survey tried to differentiate between what actions these insurers take to assess and manage climate-related risks in addition to those actions that they take regularly as part of their ongoing risk assessments. Assessment of risks to assets and insurance books was most common. Fewer insurers had started to assess liability risk or other transition risks.
Figure 17: Investment portfolio assessments of risks associated with a low-carbon transition
PORTFOLIO-WIDE ASSESSMENTS OF RISKS ASSOCIATED WITH LOW-CARBON TRANSITION
2 4 6 8 10 1612 140
Stranded assets
Carbon liabilities under carbon price scenarios
Physical risks (acute and chronic)
We expect our managers to measure and manage these risks at the asset level
This has not yet been assessed but is planned to be done
Existing and emerging regulatory requirements related to climate change
Other transition risks (policy and legal, technology, market, reputation)
8
4
3
5
10
10
14

28
Figure 18: Insurance underwriting risks identified
INSURANCE UNDERWRITING RISKS IDENTIFIED
5 10 15 20 25 30 350
Physical risks from changing frequencies and intensities of weather-related perils
caused by climate change
Transition risks resulting from a reduction in insurable interest due to a decline
in value, changing energy costs, or implementation of carbon regulation
Liability risks that could intensify due to a possible increase in litigation
Calculated Probable Maximum Loss (PML) of insured products from weather-related natural
catastrophes caused by climate change
29
7
6
14

FOR INDUSTRY/FOR INVESTORS
The insurance industry (as asset owners) should do more to develop engagement strategies that go beyond purely requiring improved disclosures and promote on the introduction of science-based targets or linking remuneration with emission reductions. Where engagement has been unsuccessful then the industry needs to be more rigorous and clearer on subsequent escalation strategies.
Various portfolio tools are being developed to help asset owners (including insurers) to assess climate-related risk across asset classes and portfolios. We would recommend that insurers look to test and innovate new approaches that incorporate forward-looking indicators.
TCFD – RISK MANAGEMENT: RECOMMENDATIONS 29
30TCFD – METRICS & TARGETS
FINDINGS
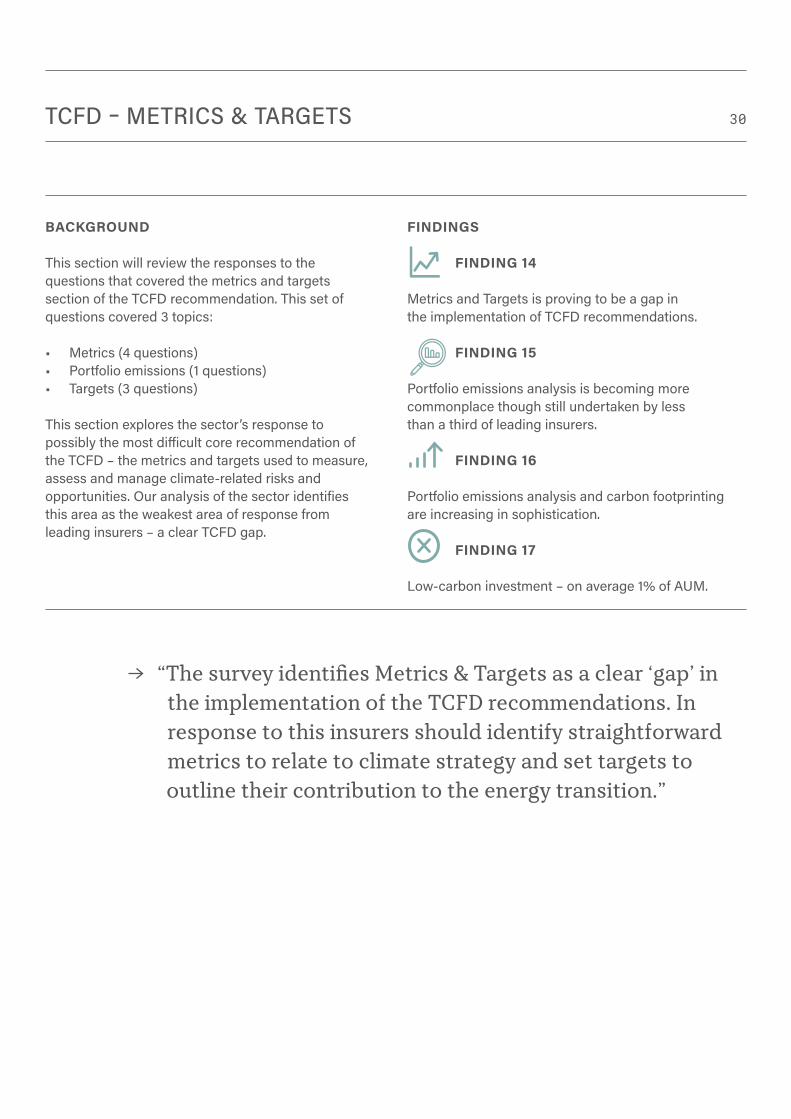
FINDING 14
Metrics and Targets is proving to be a gap in the implementation of TCFD recommendations.
FINDING 15
Portfolio emissions analysis is becoming more commonplace though still undertaken by less than a third of leading insurers. FINDING 16
Portfolio emissions analysis and carbon footprinting are increasing in sophistication. FINDING 17
Low-carbon investment – on average 1% of AUM.
“The survey identifies Metrics & Targets as a clear ‘gap’ in the implementation of the TCFD recommendations. In response to this insurers should identify straightforward metrics to relate to climate strategy and set targets to outline their contribution to the energy transition.”
BACKGROUND
This section will review the responses to the questions that covered the metrics and targets section of the TCFD recommendation. This set of questions covered 3 topics:
• Metrics (4 questions)• Portfolio emissions (1 questions)• Targets (3 questions)
This section explores the sector’s response to possibly the most difficult core recommendation of the TCFD – the metrics and targets used to measure, assess and manage climate-related risks and opportunities. Our analysis of the sector identifies this area as the weakest area of response from leading insurers – a clear TCFD gap.
31
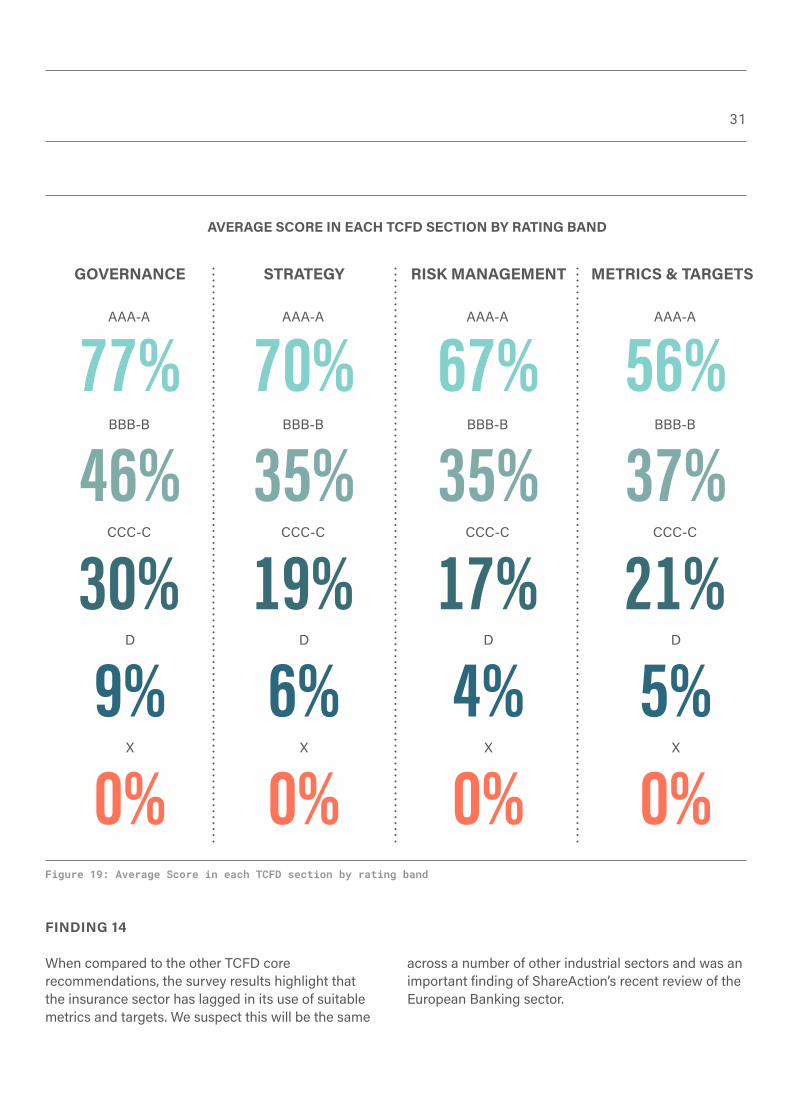
Figure 19: Average Score in each TCFD section by rating band
FINDING 14 When compared to the other TCFD core recommendations, the survey results highlight that the insurance sector has lagged in its use of suitable metrics and targets. We suspect this will be the same
GOVERNANCE
AAA-A AAA-A AAA-A AAA-A
BBB-B BBB-B BBB-B BBB-B
CCC-C CCC-C CCC-C CCC-C
D
X
D
X
D
X
D
X
STRATEGY RISK MANAGEMENT METRICS & TARGETS
AVERAGE SCORE IN EACH TCFD SECTION BY RATING BAND
77% 70% 67% 56%46% 35% 35% 37%30% 19% 17% 21%9%0%
6%0%
4%0%
5%0%
across a number of other industrial sectors and was an important finding of ShareAction’s recent review of the European Banking sector.
32
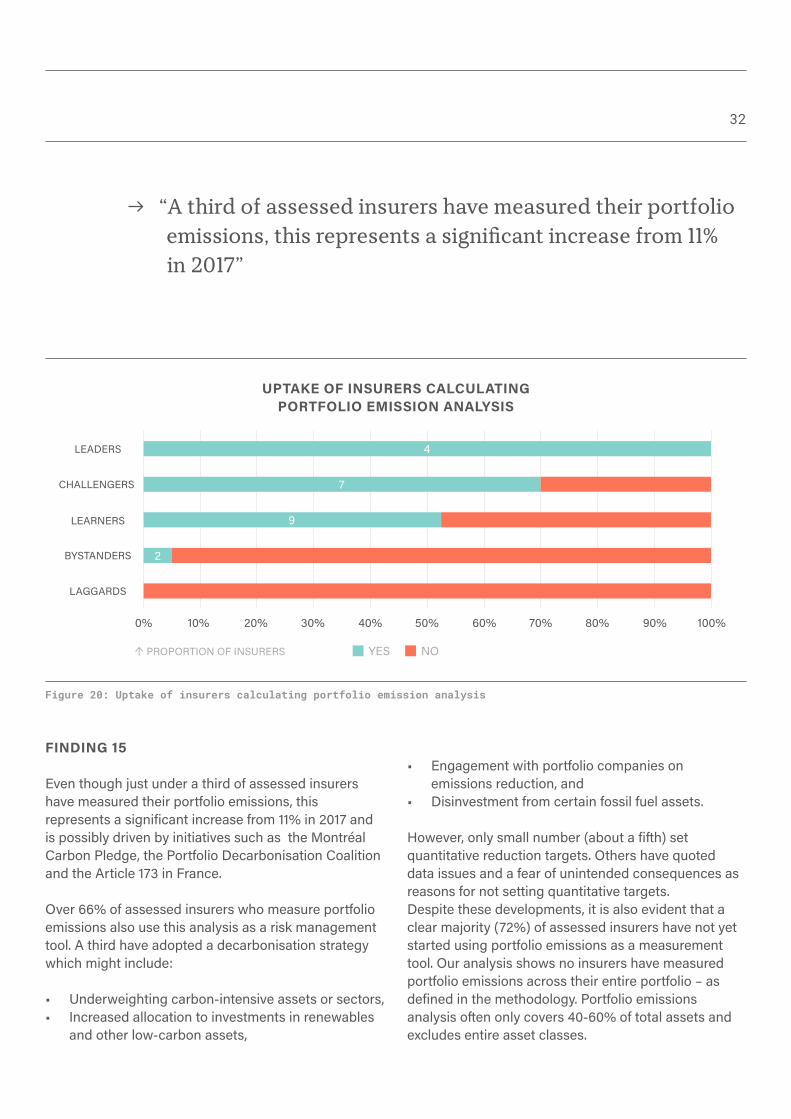
Figure 20: Uptake of insurers calculating portfolio emission analysis
FINDING 15
Even though just under a third of assessed insurers have measured their portfolio emissions, this represents a significant increase from 11% in 2017 and is possibly driven by initiatives such as the Montréal Carbon Pledge, the Portfolio Decarbonisation Coalition and the Article 173 in France.
Over 66% of assessed insurers who measure portfolio emissions also use this analysis as a risk management tool. A third have adopted a decarbonisation strategy which might include:
• Underweighting carbon-intensive assets or sectors, • Increased allocation to investments in renewables
and other low-carbon assets,
“A third of assessed insurers have measured their portfolio emissions, this represents a significant increase from 11% in 2017”
LEADERS
CHALLENGERS
LEARNERS
BYSTANDERS
LAGGARDS
UPTAKE OF INSURERS CALCULATING PORTFOLIO EMISSION ANALYSIS
0%
↑ PROPORTION OF INSURERS
20%10% 40%30% 60%50%
YES NO
80%70% 100%90%
4
7
9
2
• Engagement with portfolio companies on emissions reduction, and
• Disinvestment from certain fossil fuel assets. However, only small number (about a fifth) set quantitative reduction targets. Others have quoted data issues and a fear of unintended consequences as reasons for not setting quantitative targets.Despite these developments, it is also evident that a clear majority (72%) of assessed insurers have not yet started using portfolio emissions as a measurement tool. Our analysis shows no insurers have measured portfolio emissions across their entire portfolio – as defined in the methodology. Portfolio emissions analysis often only covers 40-60% of total assets and excludes entire asset classes.
33
FINDING 16
As data availability improves and new methodologies get developed, this AODP survey shows that metrics are becoming more sophisticated and forward-looking. Leading insurers are now utilizing tools that allow them to evaluate the alignment of an investment portfolio with the low-carbon transition. Tools are also being developed to measure the real impact of investment decisions such as the concept of ‘avoided emissions’.
Data quality and coverage remain a key barrier to developing effective decision-making tools. The survey respondents highlighted that an important data issue surrounding scope 3 emissions/product lifecycle emissions and double counting.
FINDING 17
Increasing allocation to low carbon investments (LCI) is critical to ensure and finance a timely and orderly energy transition. A small number of leading insurers have introduced a stated aim to align portfolios with a two-degree scenario accompanied by policies on asset allocation to low-carbon assets or investments.
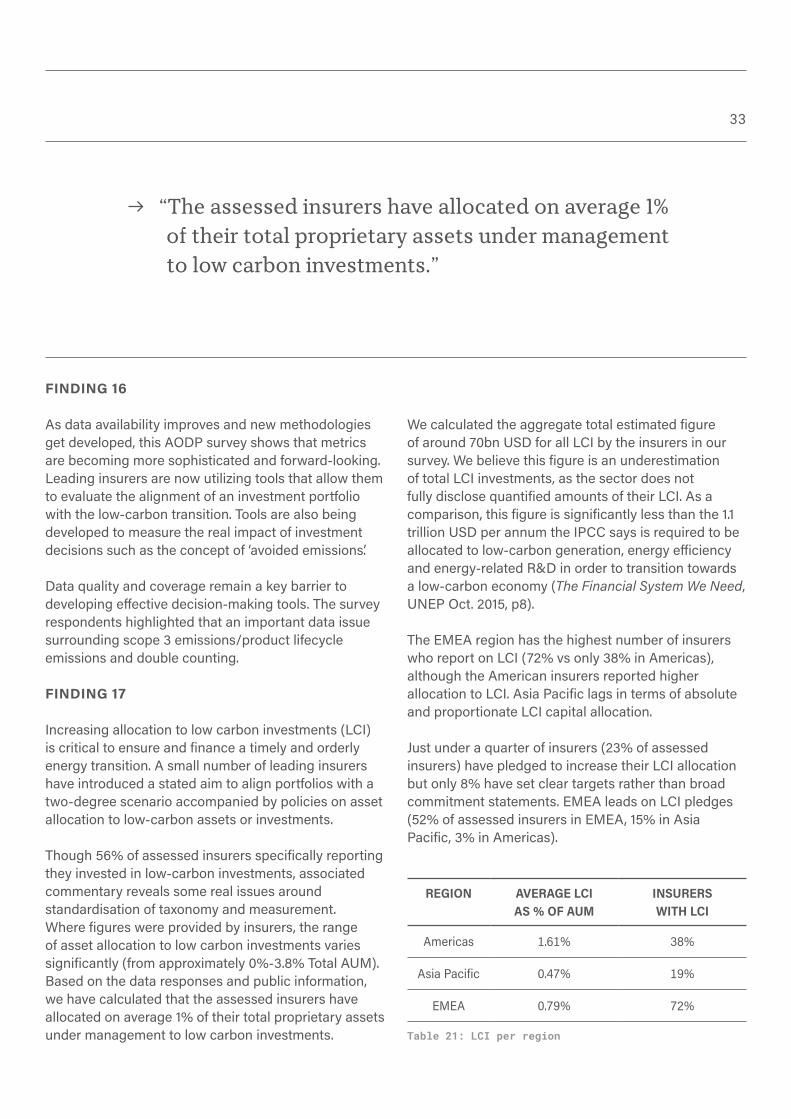
Though 56% of assessed insurers specifically reporting they invested in low-carbon investments, associated commentary reveals some real issues around standardisation of taxonomy and measurement. Where figures were provided by insurers, the range of asset allocation to low carbon investments varies significantly (from approximately 0%-3.8% Total AUM). Based on the data responses and public information, we have calculated that the assessed insurers have allocated on average 1% of their total proprietary assets under management to low carbon investments.
We calculated the aggregate total estimated figure of around 70bn USD for all LCI by the insurers in our survey. We believe this figure is an underestimation of total LCI investments, as the sector does not fully disclose quantified amounts of their LCI. As a comparison, this figure is significantly less than the 1.1 trillion USD per annum the IPCC says is required to be allocated to low-carbon generation, energy efficiency and energy-related R&D in order to transition towards a low-carbon economy (The Financial System We Need, UNEP Oct. 2015, p8).
The EMEA region has the highest number of insurers who report on LCI (72% vs only 38% in Americas), although the American insurers reported higher allocation to LCI. Asia Pacific lags in terms of absolute and proportionate LCI capital allocation.
Just under a quarter of insurers (23% of assessed insurers) have pledged to increase their LCI allocation but only 8% have set clear targets rather than broad commitment statements. EMEA leads on LCI pledges (52% of assessed insurers in EMEA, 15% in Asia Pacific, 3% in Americas).
“The assessed insurers have allocated on average 1% of their total proprietary assets under management to low carbon investments.”
REGION AVERAGE LCI AS % OF AUM
INSURERS WITH LCI
Americas 1.61% 38%
Asia Pacific 0.47% 19%
EMEA 0.79% 72%
Table 21: LCI per region

34
• The survey identifies Metrics & Targets as a clear ‘gap’ in the implementation of the TCFD recommendations. In response to this insurers should identify straightforward metrics to relate to climate strategy and set targets to outline their contribution to the energy transition.
• Assessing portfolio emissions and making allocations to low-carbon investment remain the most transparent strategies in response to climate-related risks. Insurers should increase the adoption of those strategies and extend the application to all portfolio asset classes
• The insurance industry needs to actively contribute to developing and adopting standard taxonomies, but the lack of a standard taxonomy should not slow down capital allocation to climate mitigation and adaption and other low carbon investments.
TCFD – METRICS & TARGETS: RECOMMENDATIONS 34
FOR INDUSTRY/FOR INVESTORS

3535BAN KI-MOON’S INSURANCE SECTOR CHALLENGE
BACKGROUND
It is now two years since the UN Secretary-General issued the challenges in his April 2016 address to the UN High-Level Meeting on Resilience in New York, urging the insurance sector to integrate climate-related considerations across their collective US$25 trillion investment portfolio. This section assesses the insurance industry’s response to those challenges.
The five challenges are outlined below;
1. Measure carbon footprint of investment portfolios by 2020, and decarbonize investments
2. Double investments in sustainable energy by 20203. Work with UN to ensure that early warning and
early action systems are made available to most vulnerable countries by 2020
4. Provide the most vulnerable with greater access to risk transfer mechanisms
5. Develop auditable standards in the insurance industry that incorporate the Sustainable Development Goals.
We reviewed this year’s survey responses to identify what progress insurers have made against these challenges. Our data scope does not cover challenges 3 and 4 and therefore these have not been considered, however, our survey responses do allow for meaningful commentary around progress made on challenges 1, 2 and 5.
“To meet Ban Ki-moon’s challenges 1, 2 and 5 in the given time frame, the insurance industry should: Decarbonise investment portfolios; Increase allocation of capital to low-carbon investments and; Devise and apply investment and insurance metrics that refer to the Sustainable Development Goals.”
FINDINGS
FINDING 18
Insurers found to be failing on three of Ban Ki-moon’s challenges.

36
FINDING 18 Our data has allowed us to draw insight across three of Ban Ki-moon’s challenges to the insurance sector, and as the analysis below indicates, insurers are falling short on each of the key elements referred to in challenges 1, 2 and 5.
Challenge 1: Minority of insurers undertake carbon footprinting across their investment portfolios
“Insurers are falling short on each of the key elements referred to in Ban Ki-moon's challenges 1, 2 and 5.”
Figure 22: Assessing portfolio emissions intensity
The table below shows the majority of insurers are yet to begin undertaking carbon footprinting of their entire investment portfolios or use this information to actively decarbonise their investments. Our data shows that 72% of insurers do not undertake carbon footprinting of their investments, and only 8% undertake carbon footprint assessments that cover more than half of their investment portfolios. These figures indicate that the majority of assessed insurers have not yet met Ban Ki-moon’s first challenge.
DO NOT ASSESS
ASSESS
THE 28% ASSESS LESS THAN
OF TOTAL INVESTMENT PORTFOLIO
ASSESSING PORTFOLIO EMISSIONS INTENSITY
72%28% 50%

37
Challenge 2: Minority of insurers committing to doubling low-carbon investments
The chart above indicates that the vast majority of assessed insurers are yet to make commitments to low-carbon investments. We note that low-carbon investments represent a broader category than the ‘sustainable energy’ metric referenced in Ban Ki-moon’s second challenge, and suggests that the number of insurers committing to double their sustainable energy investments could be lower than the 8% identified in our survey group who have committed to doubling their low-carbon investments.
Challenge 5: Majority of investors yet to integrate SDG goals into metrics
Ban Ki-moon’s fifth challenge asks for insurers to develop auditable standards in the insurance industry that incorporate the Sustainable Development Goals. A review of survey responses related to the use of metrics across their investment and insurance activities reveals that a minority of asset owners are incorporating metrics related to the SDGs.
LOW-CARBON INVESTMENT
COMMITMENTS
DOUBLE OR MORE OTHER COMMITMENT NO COMMITMENTS
Figure 23: Low-carbon investment commitments
62%
6%
12%

38
To meet Ban Ki-moon’s challenges 1, 2 and 5 in the given time frame, the insurance industry should:
1. Decarbonise investment portfolios, using carbon footprinting to assess progress;
2. Allocate capital to low-carbon investments, including clean energy investments; and
3. Devise and apply investment and insurance metrics that refer to the Sustainable Development Goals.
BAN KI-MOON’S INSURANCE SECTOR CHALLENGE: RECOMMENDATIONS 38
FOR INDUSTRY

39APPENDIXSE
CTIO
N
ENTITY* # QUESTIONMAX % SCORE
GO
VERN
ANCE
– 1
6%
G1/ BOARD ACCOUNTABILITY 7% ORG G1.1 Which of the following best describes the board’s oversight of climate-related issues? 3% ORG G1.2 How climate-related issues are integrated into board discussions? 3% ORG G1.3 Has the board identified climate change as a material issue? 2%
G2/ EXECUTIVE ACCOUNTABILITY 3%
ORG G2.1How your organisation has assigned climate-related responsibilities related to investment and underwriting?
3%
G3/ EDUCATION/AWARENESS 6%
INS G3.1Have you publicly supported the adoption of final TCFD recommendations? By when do you intend to fully implement these recommendations for your business?
3%
INS G3.2Has the organisation introduced structured educational/awareness programmes for key internal decision makers on the potential impact of climate-related risks within the business?
2%
INS G3.3Summarize steps the company has taken to educate clients on mitigating climate liability risks and encourage policyholders to reduce the losses caused by climate change-influenced events.
1%
STRA
TEG
Y –
32%
S1/ IDENTIFYING RISKS & OPPORTUNITIES 4%
ORG S1.1Have climate-related risks and opportunities that could have a material financial impact been identified?
4%
S2/ INTEGRATION OF RISKS & OPPORTUNITIES INTO STRATEGY 21%
AO S2.1As an asset owner, how have you factored climate-related risks and opportunities into the group level investment strategy or policy?
7%
AO S2.2For any of the following, do you have climate-related incentives, which are forward-looking and based on long-term investment horizons?
2%
AO S2.3As an asset owner, how is the management of climate-related risks embedded into your contractual agreements with professional service providers (asset managers, proxy voting advisors, investment consultants, etc.)? How do you ensure the requests are being met?
3%
AO S2.4How are climate-related issues factored into asset manager selection process by your investment consultant or internal investment executive?
1%
INS S2.5Do you publish (externally or internally) information on the potential impacts of climate-related risks and opportunities on your core businesses, products, and services?
3%
INS S2.6Are any specific climate-related products or services being offered or are under development?
6%
S3/ STRATEGY RESILIENCE & ALIGNMENT 8%
AO S3.1As an asset owner, have you assessed the resilience and alignment of the organisation’s strategy, taking into consideration different climate-related scenarios?
6%
INS S3.2As an insurer, have you assessed the resilience and alignment of the organisation’s strategy, taking into consideration different climate-related scenarios?
1%
TABLE 1: FULL QUESTION LIST AND SCORING

40
*Whether from an asset owner (AO) or insurer (INS) perspective, or at the group level (ORG)
SECT
ION
ENTITY* # QUESTIONMAX % SCORE
RISK
MAN
AGEM
ENT
– 28
%
RM1/ ENGAGEMENT 12%
AO RM1.1Have you incorporated climate-related issues into your engagement with investee companies, key service providers and external parties?
4%
AO RM1.2Do you encourage any of the following during your engagement with investee companies and corporate borrowers?
5%
AO RM1.3 Do you publish annual voting records on proxy votes? 2%
ORG RM1.4Please select the collaborative engagement initiatives and industry associations you participate in.
1%
RM2/ PORTFOLIO TOOLS 11%
AO RM2.1As an asset owner, has the business undertaken a portfolio-wide assessment of potential systematic risks associated with the transition to a low-carbon economy?
9%
AO RM2.2As an asset owner, has the business developed tools to help identify and assess climate-related risks and opportunities in portfolio construction, stock selection or asset allocation?
2%
RM3/ INSURANCE RISKS 5%
INS RM3.1As an insurer, does the business have a process for identifying and assessing climate-related risks on insurance or reinsurance contracts or agreements?
3%
INS RM3.2Are there geographic locations, perils or coverages for which the company has increased rates, limited sales, or limited or eliminated coverages because of catastrophic events?
2%
MET
RICS
AN
D T
ARG
ETS
– 23
%
MT1/ METRICS 10%
AO MT1.1As an asset owner, has the business developed metrics used to assess climate-related risks and opportunities in investment decisions?
3%
INS MT1.2As an insurer, has the business developed metrics used to assess climate-related risks and opportunities in underwriting decisions?
3%
AO MT1.3 As an asset owner, have you measured low-carbon assets in your portfolio? 3% AO MT1.4 As an asset owner, have you measured high-carbon assets in your portfolio? 1%
MT2/ PORTFOLIO EMISSIONS 8%
AO MT2.1As an asset owner, have you calculated your aggregate or specified portfolio emissions intensity?
8%
MT3/ TARGETS 5% AO MT3.1 As an asset owner, has the business developed climate-related targets? 1% INS MT3.2 As an insurer, has the business developed climate-related targets? 1%
AO MT3.3As an asset owner, have you introduced an asset allocation policy on low-carbon assets? Has this commitment resulted in modifications of asset allocation or stock selection or weighting?
3%

41DISCLAIMER
ABOUT SHAREACTION
ShareAction (Fairshare Educational Foundation) is a registered charity that promotes responsible investment practices. ShareAction believes that responsible investment helps to safeguard investments as well as securing environmental and social benefits. shareaction.org [email protected] +44 (0)20 74037800 16 Crucifix Lane London, UK SE1 3JW
ABOUT AODP
The Asset Owners Disclosure Project (AODP) is a ranking of global asset owners and asset managers that is managed by responsible investment charity ShareAction. The objective of the AODP is to protect retirement savings and other long-term investments from the risks posed by climate change by improving disclosure and industry best practice. CONTACT
Toby Belsom Head of Research [email protected]
Pavel Kirjanas AODP Project Manager [email protected]
The opinions expressed in this publication are based on the documents specified. We encourage readers to read those documents. Online links accessed 23 November 2017. Fairshare Educational Foundation is a company limited by guarantee registered in England and Wales number 05013662 (registered address 16 Crucifix Lane, London, SE1 3JW) and a registered charity number 1117244, VAT registration number GB 211 1469 53
This publication and related materials are not intended to provide and do not constitute financial or investment advice. ShareAction makes no representation regarding the advisability or suitability of investing in any particular company, investment fund or other vehicle or of using the services of any particular entity, pension provider or other service provider for the provision of investment services. A decision to use the services of any pension provider, or other entity should not be made in reliance on any of the statements set forth in this publication. While every effort has been made to ensure the information in this publication is correct, ShareAction and its agents cannot guarantee its accuracy and they shall not be liable for any claims or losses of any nature in connection with information contained in this document, including (but not limited to) lost profits or punitive or consequential damages or claims in negligence. ShareAction did not assess insurers according to financial performance or metrics. The research in this report was carried out between January and April 2018. During the period of analysis, the entities surveyed were informed of the answer options selected for them by email and were given the opportunity to comment on or ask questions on these to make additional disclosures or to provide clarification. Any notifications of changes, information or clarification not drawn to ShareAction’s attention prior to the deadlines are not included in the report.

ShareAction 16 Crucifix Lane London, UK SE1 3JW shareaction.org [email protected] +44 (0)20 74037800