
Goswami D.Y ; et. al. Energy Conversion Mechanical Engineering Handbook ... ENGINEERING HAND… ·...
201
Goswami, D.Y.; et. al. “Energy Conversion” Mechanical Engineering Handbook Ed. Frank Kreith Boca Raton: CRC Press LLC, 1999 c 1999 by CRC Press LLC
-
Upload
truongdang -
Category
Documents
-
view
225 -
download
0
Transcript of Goswami D.Y ; et. al. Energy Conversion Mechanical Engineering Handbook ... ENGINEERING HAND… ·...

Goswami, D.Y.; et. al. “Energy Conversion”Mechanical Engineering HandbookEd. Frank KreithBoca Raton: CRC Press LLC, 1999
c©1999 by CRC Press LLC

Energy Conversion
8.1 Steam Power Plant ...........................................................8-2Introduction ¥ Rankine Cycle Analysis ¥ Topping and Bottoming Cycles ¥ Steam Boilers ¥ Steam Turbines ¥ Heat Exchangers, Pumps, and Other Cycle Components ¥ Generators ¥ Modern Steam Power Plant Ñ An Example
8.2 Gas Turbines...................................................................8-19Overview ¥ History ¥ Fuels and Firing ¥ EfÞciency ¥ Gas Turbine Cycle ¥ Cycle ConÞgurations ¥ Components Used in Complex Cycled ¥ Upper Temperature Limit ¥ Materials ¥ Combustion ¥ Mechanical Product Features ¥ Appendix
8.3 Internal Combustion Engines.........................................8-31Introduction ¥ Engine Types and Basic Operation ¥ Air Standard Power Cycle ¥ Actual Cycles ¥ Combustion in IC Engined ¥ Exhaust Emission ¥ Fuels for SI and CI Engines ¥ Intake Pressurization Ñ Supercharging and Turbocharging
8.4 Hydraulic Turbines.........................................................8-55Introduction ¥ General Description ¥ Principles of Operation ¥ Factors Involved in Selecting a Turbine
8.5 Stirling Engines..............................................................8-67Introduction ¥ Thermodynamic Implementation of the Stirling Cycle ¥ Mechanical Implementation of the Stirling Cycle ¥ Future of the Stirling Engine
8.6 Advanced Fossil Fuel Power Systems...........................8-77Introductions ¥ Clean Coal Technology Development ¥ Pulverized Coal Plants ¥ Emissions Controls for Pulverized Coal Plants ¥ Fluidized Bed Plants ¥ GasiÞcation Plants ¥ Combustion Turbine Plants ¥ Capital and Operating Costs of Power Plants ¥ Summary
8.7 Energy Storage ...............................................................8-98Introduction ¥ Therman Energy Storage ¥ Mechanical Energy Storage ¥ Electrical Energy Storage
8.8 Nuclear Power ..............................................................8-105The Fission Process ¥ Cross Sections ¥ Categories of Nuclear Reactors ¥ Nonnuclear Fuels ¥ Light-Water Reactors
8.9 Nuclear Fusion .............................................................8-113Introduction ¥ Fusion Fuel ¥ ConÞnement Concepts ¥ Tokamak Reactor Development ¥ Fusion Energy Conversion and Transport
8.10 Solar Thermal Energy Conversion...............................8-117Introduction ¥ Collector Thermal Performance ¥ Solar Ponds ¥ Solar Water-Heating Systems ¥ Industrial Process Heat Systems ¥ Space-Heating Systems ¥ Solar Thermal Power
D. Yogi GoswamiUniveristy of Florida
Lawrence ConwayWestinghouse Electric Corporation
Steven I. FreedmanGas Research Institute
David E. KlettNorth Carolina A&T State University
Elsayed M. AfifyNorth Carolina State University
Roger E. A. ArndtUniversity of Minnesota
William B. StineCalifornia State Polytechnic University
Anthony F. ArmorElectric Power Research Institute
Chand K. JotshiUniversity of Florida
Roberto Pagano (deceased)University of Florida
James S. TulenkoUniversity of Florida
Thomas E. ShannonUniversity of Tennessee
Dale E. BergSandia National Laboratories
Carl J. Bliem (deceased)CJB Consulting
Gregory L. MinesIdaho National Engineering Laboratory
Kitt C. ReinhardtWright Laboratory, United States Air Force
8-1© 1999 by CRC Press LLC
8
-2
Section 8
8.11 Wind Energy Conversion .............................................8-129Introduction ¥ Wind Turbine Aerodynamics ¥ Wind Turbine Loads ¥ Wind Turbine Dynamics ¥ Wind Turbine Controls ¥ Wind Turbine Electrical Generators ¥ Wind-Diesel Systems ¥ Water-Pumping Applications
8.12 Energy Conversion of the Geothermal Resource ........8-141Geothermal Resource Characteristics Applicable to Energy Conversion ¥ Electrical Energy Generation from Geothermal Resources ¥ Direct use of the Geothermal Resource
8.13 Direct Energy Conversion............................................8-149Solar Photovoltaic Cells ¥ Fuel Cells ¥ Thermionic Energy Conversion ¥ Thermoelectric Power Conversion ¥ Magnetohydrodynamic Power Conversion
8.14 Ocean Energy Technology ...........................................8-188Introduction ¥ Ocean Thermal Energy Conversion ¥ Tidal Power ¥ Wave Power ¥ Concluding Remarks
8.15 Combined Cycle Power Plants ....................................8-1918.16 EMERGY Evaluation and Transformity .....................8-197
8.1 Steam Power Plant
Lawrence Conway
Introduction
This section provides an understanding, at an overview level, of the steam power cycle. References wereselected for the next level of study if required. There are noteworthy omissions in the section: siteselection, fuel handling, civil engineering-related activities (like foundations), controls, and nuclearpower.
Thermal power cycles take many forms, but the majority are fossil steam, nuclear, simple cycle gasturbine, and combined cycle. Of those listed, conventional coal-Þred steam power is predominant. Thisis especially true in developing third-world countries that either have indigenous coal or can import coalinexpensively. These countries make up the largest new product market. A typical unit is shown in Figure8.1.1.
The Rankine cycle is overwhelmingly the preferred cycle in the case of steam power and is discussedÞrst.
Topping and bottoming cycles, with one exception, are rare and mentioned only for completeness.The exception is the combined cycle, where the steam turbine cycle is a bottoming cycle. In the developedcountries, there has been a move to the combined cycle because of cheap natural gas or oil. Combinedcycles still use a reasonably standard steam power cycle except for the boiler. The complexity of acombined cycle is justiÞed by the high thermal efÞciency, which will soon approach 60%.
The core components of a steam power plant are boiler, turbine, condenser and feedwater pump, andgenerator. These are covered in successive subsections.
The Þnal subsection is an example of the layout/and contents of a modern steam power plant.As a frame of reference for the reader, the following efÞciencies/effectivenesses are typical of modern
fossil fuel steam power plants. The speciÞc example chosen had steam conditions of 2400 psia, 1000°Fmain steam temperature, 1000°F reheat steam temperature: boiler thermal 92; turbine/generator thermal44; turbine isentropic 89; generator 98.5; boiler feedwater pump and turbine combined isentropic 82;condenser 85; plant overall 34 (Carnot 64).
Nuclear power stations are so singular that they are worthy of a few closing comments. Modernstations are all large, varying from 600 to 1500 MW. The steam is both low temperature and low pressure(~600°F and ~1000 psia), compared with fossil applications, and hovers around saturation conditions
Mysore L. RamalingamUES, Inc.
Jean-Pierre FleurialJet Propulsion Laboratory/California Institute of Technology
William D. JacksonHMJ Corporation
Desikan BharatbanNational Renewable Energy Laboratory
Frederica ZangrandoNational Renewable Energy Laboratory
William W. BathieIowa State University
Howard T. OdumUniversity of Florida
© 1999 by CRC Press LLC

Energy Conversion
8
-3
or is slightly superheated. Therefore, the boiler(s), superheater equivalent (actually a combined moistureseparator and reheater), and turbines are unique to this cycle. The turbine generator thermal efÞciencyis around 36%.
Rankine Cycle Analysis
Modern steam power plants are based on the Rankine cycle. The basic, ideal Rankine cycle is shownin Figure 8.1.2. The ideal cycle comprises the processes from state 1:
1Ð2: Saturated liquid from the condenser at state l is pumped isentropically (i.e., S1 = S2) to state 2and into the boiler.
2Ð3: Liquid is heated at constant pressure in the boiler to state 3 (saturated steam).3Ð4: Steam expands isentropically (i.e., S3 = S4) through the turbine to state 4 where it enters the
condenser as a wet vapor.4Ð1: Constant-pressure transfer of heat in the condenser to return the steam back to state 1 (saturated
liquid).
FIGURE 8.1.1 Modern steam turbine generator.
FIGURE 8.1.2 Basic Rankine cycle.
© 1999 by CRC Press LLC

8
-4
Section 8
If changes in kinetic and potential energy are neglected, the total heat added to the rankine cycle canbe represented by the shaded area on the T-S diagram in Figure 8.1.2, while the work done by this cyclecan be represented by the crosshatching within the shaded area. The thermal efÞciency of the cycle (h)is deÞned as the work (WNET) divided by the heat input to the cycle (QH).
The Rankine cycle is preferred over the Carnot cycle for the following reasons:The heat transfer process in the boiler has to be at constant temperature for the Carnot cycle, whereas
in the Rankine cycle it is superheated at constant pressure. Superheating the steam can be achieved inthe Carnot cycle during heat addition, but the pressure has to drop to maintain constant temperature.This means the steam is expanding in the boiler while heat added which is not a practical method.
The Carnot cycle requires that the working ßuid be compressed at constant entropy to boiler pressure.This would require taking wet steam from point 1¢ in Figure 8.1.2 and compressing it to saturated liquidcondition at 2¢. A pump required to compress a mixture of liquid and vapor isentropically is difÞcult todesign and operate. In comparison, the Rankine cycle takes the saturated liquid and compresses it toboiler pressure. This is more practical and requires much less work.
The efÞciency of the Rankine cycle can be increased by utilizing a number of variations to the basiccycle. One such variation is superheating the steam in the boiler. The additional work done by the cycleis shown in the crosshatched area in Figure 8.1.3.
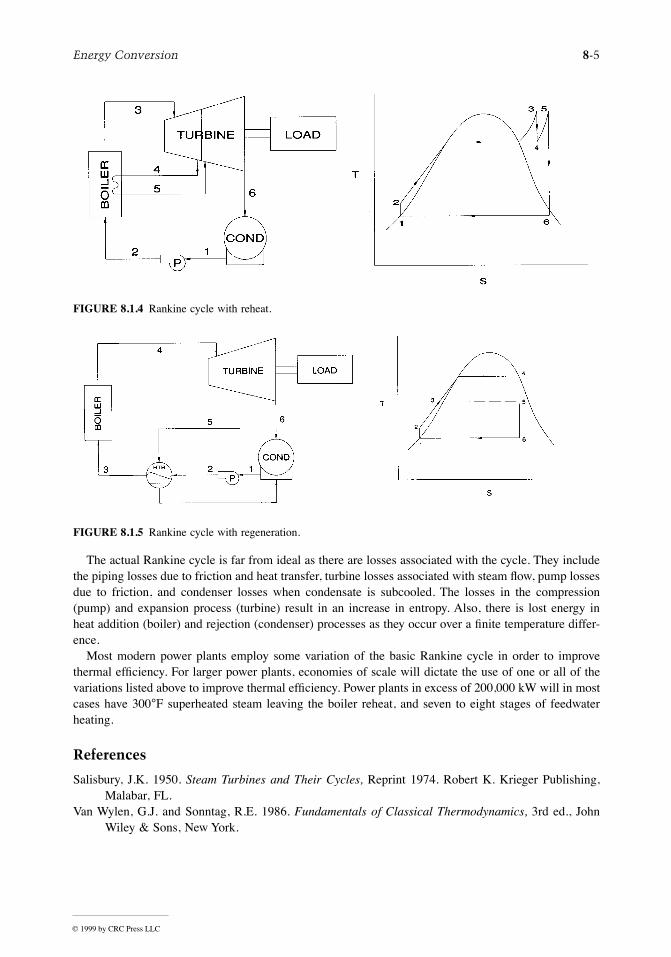
The efÞciency of the Rankine cycle can also be increased by increasing the pressure in the boiler.However, increasing the steam generator pressure at a constant temperature will result in the excessmoisture content of the steam exiting the turbine. In order to take advantage of higher steam generatorpressures and keep turbine exhaust moistures at safe values, the steam is expanded to some intermediatepressure in the turbine and then reheated in the boiler. Following reheat, the steam is expanded to thecycle exhaust pressure. The reheat cycle is shown in Figure 8.1.4.
Another variation of the Rankine cycle is the regenerative cycle, which involves the use of feedwaterheaters. The regenerative cycle regains some of the irreversible heat lost when condensed liquid ispumped directly into the boiler by extracting steam from various points in the turbine and heating thecondensed liquid with this steam in feedwater heaters. Figure 8.1.5 shows the Rankine cycle withregeneration.
FIGURE 8.1.3 Rankine cycle with superheat.
h = = -( ) -( )W Q h h h hHNET 3 4 3 2
© 1999 by CRC Press LLC
Energy Conversion
8
-5
The actual Rankine cycle is far from ideal as there are losses associated with the cycle. They includethe piping losses due to friction and heat transfer, turbine losses associated with steam ßow, pump lossesdue to friction, and condenser losses when condensate is subcooled. The losses in the compression(pump) and expansion process (turbine) result in an increase in entropy. Also, there is lost energy inheat addition (boiler) and rejection (condenser) processes as they occur over a Þnite temperature differ-ence.
Most modern power plants employ some variation of the basic Rankine cycle in order to improvethermal efÞciency. For larger power plants, economies of scale will dictate the use of one or all of thevariations listed above to improve thermal efÞciency. Power plants in excess of 200,000 kW will in mostcases have 300°F superheated steam leaving the boiler reheat, and seven to eight stages of feedwaterheating.
References
Salisbury, J.K. 1950. Steam Turbines and Their Cycles, Reprint 1974. Robert K. Krieger Publishing,Malabar, FL.
Van Wylen, G.J. and Sonntag, R.E. 1986. Fundamentals of Classical Thermodynamics, 3rd ed., JohnWiley & Sons, New York.
FIGURE 8.1.4 Rankine cycle with reheat.
FIGURE 8.1.5 Rankine cycle with regeneration.
© 1999 by CRC Press LLC

8
-6
Section 8
Topping and Bottoming Cycles
Steam Rankine cycles can be combined with topping and/or bottoming cycles to form binary thermo-dynamic cycles. These topping and bottoming cycles use working ßuids other than water. Topping cycleschange the basic steam Rankine cycle into a binary cycle that better resembles the Carnot cycle andimproves efÞciency. For conventional steam cycles, state-of-the-art materials allow peak working ßuidtemperatures higher than the supercritical temperature for water. Much of the energy delivered into thecycle goes into superheating the steam, which is not a constant-temperature process. Therefore, asigniÞcant portion of the heat supply to the steam cycle occurs substantially below the peak cycletemperature. Adding a cycle that uses a working ßuid with a boiling point higher than water allows moreof the heat supply to the thermodynamic cycle to be near the peak cycle temperature, thus improvingefÞciency. Heat rejected from the topping cycle is channeled into the lower-temperature steam cycle.Thermal energy not converted to work by the binary cycle is rejected to the ambient-temperature reservoir.Metallic substances are the working ßuids for topping cycles. For example, mercury was used as thetopping cycle ßuid in the 40-MW plant at Schiller, New Hampshire. This operated for a period of timebut has since been dismantled. SigniÞcant research and testing has also been performed over the yearstoward the eventual goal of using other substances, such as potassium or cesium, as a topping cycle ßuid.
Steam power plants in a cold, dry environment cannot take full advantage of the low heat rejectiontemperature available. The very low pressure to which the steam would be expanded to take advantageof the low heat sink temperature would increase the size of the low-pressure (LP) turbine to such anextent that it is impractical or at least inefÞcient. A bottoming cycle that uses a working ßuid with avapor pressure higher than water at ambient temperatures (such as ammonia or an organic ßuid) wouldenable smaller LP turbines to function efÞciently. Hence, a steam cycle combined with a bottomingcycle may yield better performance and be more cost-effective than a stand-alone Rankine steam cycle.
Further Information
Fraas, A.P. 1982. Engineering Evaluation of Energy Systems, McGraw-Hill, New York.Horlock, J.H. 1992. Combined Power Plants, Including Combined Cycle Gas Turbine (CCGT) Plants,
Pergamon Press, Oxford.
Steam Boilers
A boiler, also referred to as a steam generator, is a major component in the plant cycle. It is a closedvessel that efÞciently uses heat produced from the combustion of fuel to convert water to steam. EfÞciencyis the most important characteristic of a boiler since it has a direct bearing on electricity production.
Boilers are classiÞed as either drum-type or once-through. Major components of boilers include aneconomizer, superheaters, reheaters, and spray attemperators.
Drum-Type Boilers
Drum-type boilers (Figure 8.1.6) depend on constant recirculation of water through some of the com-ponents of the steam/water circuit to generate steam and keep the components from overheating. Drum-type boilers circulate water by either natural or controlled circulation.
Natural Circulation. Natural circulation boilers use the density differential between water in the down-comers and steam in the waterwall tubes for circulation.
Controlled Circulation. Controlled circulation boilers utilize boiler-water-circulating pumps to circulatewater through the steam/water circuit.
Once-Through Boilers
Once-through boilers, shown in Figure 8.1.7, convert water to steam in one pass through the system.
© 1999 by CRC Press LLC

Energy Conversion
8
-7
Major Boiler Components
Economizer. The economizer is the section of the boiler tubes where feedwater is Þrst introduced intothe boiler and where ßue gas is used to raise the temperature of the water.
Steam Drum (Drum Units Only). The steam drum separates steam from the steam/water mixture andkeeps the separated steam dry.
Superheaters. Superheaters are bundles of boiler tubing located in the ßow path of the hot gases thatare created by the combustion of fuel in the boiler furnace. Heat is transferred from the combustiongases to the steam in the superheater tubes.
Superheaters are classiÞed as primary and secondary. Steam passes Þrst through the primary super-heater (located in a relatively cool section of the boiler) after leaving the steam drum. There the steamreceives a fraction of its Þnal superheat and then passes through the secondary superheater for theremainder.
FIGURE 8.1.6 Drum boilers.
FIGURE 8.1.7 Once-through boilers.
© 1999 by CRC Press LLC

8
-8
Section 8
Reheaters. Reheaters are bundles of boiler tubes that are exposed to the combustion gases in the samemanner as superheaters.
Spray Attemperators. Attemperators, also known as desuperheaters, are spray nozzles in the boiler tubesbetween the two superheaters. These spray nozzles supply a Þne mist of pure water into the ßow pathof the steam to prevent tube damage from overheating. Attemperators are provided for both the super-heater and reheater.
Steam Turbines
General
Each turbine manufacturer has unique features in their designs that impact efÞciency, reliability, andcost. However, the designs appear similar to a non-steam-turbine engineer. Steam turbines for powerplants differ from most prime movers in at least three ways. (1) All are extremely high powered, varyingfrom about 70,000 to 2 million hp, and require a correspondingly large capital investment, which putsa premium on reliability. (2) Turbine life is normally between 30 and 40 years with minimal maintenance.(3) Turbines spend the bulk of their life at constant speed, normally 3600 or 1800 rpm for 60 Hz. Thesethree points dominate the design of the whole power station, particularly of the steam turbine arrangementand materials.
In an earlier subsection it was shown that high steam supply temperatures make for more-efÞcientturbines. Even so, the range of steam conditions in modern service has narrowed because of these threepoints. Figure 8.1.8 shows the distribution of steam conditions of one manufacturer for turbines recentlyput in service. They are reasonably typical of the industry. This is one of the primary reasons that thesteam turbines appear similar.
Blading
The most highly stressed component in steam turbines are the blades. Blades are loaded by centrifugaland steam-bending forces and also harmonic excitation (from nonuniform circumferential disturbances
FIGURE 8.1.8 Steam turbine operating conditions.
© 1999 by CRC Press LLC

Energy Conversion
8
-9
in the blade path). All blades are loaded by centrifugal and steam-bending loads, and, in general, bladesare designed to run when the harmonic excitation is resonant with the natural modes of the blade. Ifharmonic excitation is permitted on very long blades, the blades become impractically big. Fortunately,as the turbine runs at constant speed, the blade modes can be tuned away from resonant conditions sothat the harmonic loads are signiÞcantly reduced. This forms a split in blade design, commonly referredto as tuned and untuned blading.
Blades guide steam throughout the turbine in as smooth and collision-free a path as possible. Collisionswith blades (incidence) and sudden expansions reduce the energy available for doing work. Until recently,designers would match ßow conditions with radially straight blades (called parallel sided). Turbinephysics does not recognize this convenience for several reasons. The most visually obvious is thedifference in tangential velocity between blade hub and tip. Twisted blades better match the ßow (andarea) conditions. The manufacturing process was costly and this cost conÞned application to long blades.Now, with numerical control machine tools, twist is being spread throughout the turbine. Twisted bladesare a two-dimensional adjustment for a three-dimensional steam ßow. The latest blades address the fullthree-dimensional nature of the ßow by curving in three dimensions (bowed blades). Examples of allthree classes of blades are shown in Figure 8.1.9.
Rotors
After blades, steam turbine rotors are the second most critical component in the machine. Rotor designmust account for (1) a large forging with uniform chemistry and properties in the high-strength alloysneeded; (2) centrifugal force from the rotor itself and the increase from the centrifugal pull of the blades;(3) resistance to brittle fracture potentially occurring in the LP cylinder when the machine is at highspeed, but the material is still not up to operational temperature; (4) creep of the high-pressure (HP) andintermediate-pressure (IP) rotors under steady high-temperature load. The life cycle is further compli-cated by the various transient fatigue loads occurring during load changes and start-up. Two furtherevents are considered in rotor design: torsional and lateral vibrations caused by both harmonic steamand electrical loads. As with tuned blades, this is normally accommodated by tuning the primary modesaway from running resonance.
Choosing the Turbine Arrangement
The turbine shaft would be too ßexible in one piece if all the blades were to follow sequentially. It istherefore cut up into supportable lengths. The ÒcutsÓ in the shaft result in HP, IP, and LP cylinders.Manufacturers address the grouping of cylinders in many different ways, depending upon steam condi-tions. It is U.S. practice to combine HPs and IPs into one cylinder for the power range of about 250 to600 MW (rare in the rest of the world). One manufacturerÕs grouping, shown in Figure 8.1.10, is fairly
FIGURE 8.1.9 Typical steam turbine blades.
© 1999 by CRC Press LLC

8
-10
Section 8
representative of the industry. So far, the text has discussed the steam ßow as though it expandedmonotonically through the turbine. This is usually not the case for two reasons. The most common steamconditions, shown in Figure 8.1.10, would cause the steam exiting the last row of blades to be very wetand cause excessive erosion. Thermal efÞciency can be raised by removing the steam from the turbine,reheating, and then returning it to the blade path; this increases the ÒaverageÓ heat supply temperature.The turbine position for reheat is normally between the HP and IP turbines.
There is one further geometric arrangement. Cylinders need not be all on one shaft with a singlegenerator at the end. A cross-compound arrangement exists in which the steam path is split into twoseparate parallel paths with a generator on each path. Commonly, the split will be with paths of HP-LP-generator and IP-LP-generator. Torsional and lateral vibration difÞculties are more easily prevented withshorter trains, which make the foundation more compact. The primary shortcoming is the need for twogenerators and resultant controls.
Historically, steam turbines have been split into two classes, reaction and impulse, as explained inBasic Power Cycles. This difference in design makes an observable difference between machines.Impulse turbines have fewer, wider stages than reaction machines. As designs have been reÞned, theefÞciencies and lengths of the machines are now about the same. For a variety of reasons, the longerblades in the LP ends are normally reaction designs. As each stage may now be designed and fabricateduniquely, the line between impulse and reaction turbines will probably disappear. Turbine blading isbroadly split between machines as follows:
Materials
Materials are among the most variable of all turbine parts with each manufacturer striving to improveperformance by using alloying and heat-treatment techniques. It follows that accurate generalizationsare difÞcult. Even so, the following is reasonably representative:
FIGURE 8.1.10 Steam turbine product combinations.
Cylinder
HP LP
Control Stage Remainder IP Short Blades End Blade(s)
Reaction turbines Impulse Reaction Reaction Reaction ReactionImpulse turbines Impulse Impulse Impulse Impulse Reaction
© 1999 by CRC Press LLC

Energy Conversion
8-11
Cylinders and Bolting
These items are relatively straightforward, especially the LP cylinder, except for the very large sizes andprecision required for the castings and fabrications. A large HP-IP cylinder has the temperature andpressure loads split between an inner and outer cylinder. In this case, Þnding space and requisite strengthfor the bolting presents a challenge for the designer.
Valves
The turbine requires many valves for speed control, emergency control, drains, hydraulics, bypasses,and other functions. Of these, there are four valves distinguished by their size and duty. They are throttleor stop, governor or control, reheat stop, and reheat interceptor.
The throttle, reheat stop, and reheat interceptor valves normally operate fully open, except for somecontrol and emergency conditions. Their numbers and design are selected for the appropriate combinationof redundancy and rapidity of action. The continuous control of the turbine is accomplished by throttlingthe steam through the governor valve. This irreversible process detracts from cycle efÞciency. In somecircumstances, the efÞciency detraction is reduced by a combination of throttling and reducing the boilerpressure (normally called sliding pressure).
Further Information
Kutz, M. 1986. Mechanical EngineersÕ Handbook, John Wiley & Sons, New York.Stodola, A. and Loewenstein, L.C. 1927. Steam and Gas Turbines, Reprint of 6th ed. 1945, Peter Smith,
New York.Japikse, D. and Nicholas, C.B. 1994. Introduction to Turbomachinery, Concepts ETI, Norwich, VT.
Heat Exchangers, Pumps, and Other Cycle Components
Heater Exchangers
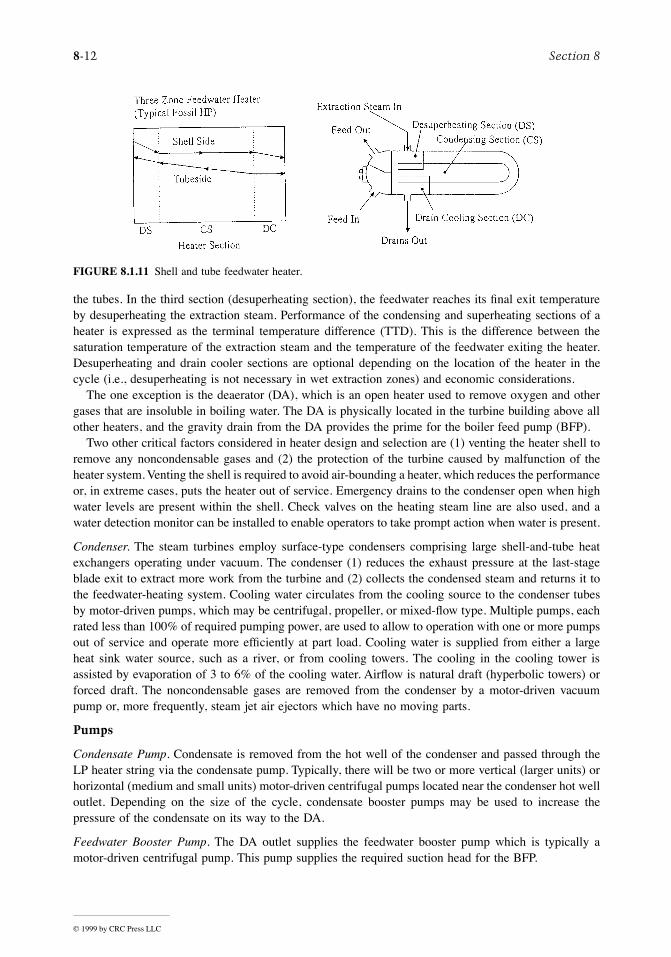
Heaters. There are two classiÞcations of condensate and feedwater heaters: the open or direct contactheater and the closed or tube-and-shell heater.
Open Heaters. In an open heater, the extraction or heating steam comes in direct contact with thewater to be heated. While open heaters are more efÞcient than closed heaters, each requires a pump tofeed the outlet water ahead in the cycle. This adds cost, maintenance, and the risk of water induction tothe turbine, making the closed heater the preferred heater for power plant applications.
Closed Heaters. These employ tubes within a shell to separate the water from the heating steam (seeFigure 8.1.11). They can have three separate sections where the heating of the feedwater occurs. Firstis the drain cooler section where the feedwater is heated by the condensing heating steam before cascadingback to the next-lower-pressure heater. The effectiveness of the drain cooler is expressed as the draincooler approach (DCA), which is the difference between the temperature of the water entering the heaterand the temperature of the condensed heating steam draining from the heater shell. In the second section(condensing section), the temperature of the water is increased by the heating steam condensing around
Item Common Material Description
High-temper-atureHP andIP blades
Moderateand coldtemper-aturestatorblades
Moderatetemper-aturerotating blades
Cold LProtatingblades
Hightemper-aturerotors
Lowtemper-aturerotors
Hot LP High-temper-aturebolting
Cold bolting
ModÕd SS403
SS304 SS403 SS403or 17/4 PH
1CrMoV,occasion-ally12Cr
3.5NiCrMoV
1.25Cr or2.25Cr
Carbon, steel
SS422 B16
© 1999 by CRC Press LLC
8-12 Section 8
the tubes. In the third section (desuperheating section), the feedwater reaches its Þnal exit temperatureby desuperheating the extraction steam. Performance of the condensing and superheating sections of aheater is expressed as the terminal temperature difference (TTD). This is the difference between thesaturation temperature of the extraction steam and the temperature of the feedwater exiting the heater.Desuperheating and drain cooler sections are optional depending on the location of the heater in thecycle (i.e., desuperheating is not necessary in wet extraction zones) and economic considerations.
The one exception is the deaerator (DA), which is an open heater used to remove oxygen and othergases that are insoluble in boiling water. The DA is physically located in the turbine building above allother heaters, and the gravity drain from the DA provides the prime for the boiler feed pump (BFP).
Two other critical factors considered in heater design and selection are (1) venting the heater shell toremove any noncondensable gases and (2) the protection of the turbine caused by malfunction of theheater system. Venting the shell is required to avoid air-bounding a heater, which reduces the performanceor, in extreme cases, puts the heater out of service. Emergency drains to the condenser open when highwater levels are present within the shell. Check valves on the heating steam line are also used, and awater detection monitor can be installed to enable operators to take prompt action when water is present.
Condenser. The steam turbines employ surface-type condensers comprising large shell-and-tube heatexchangers operating under vacuum. The condenser (1) reduces the exhaust pressure at the last-stageblade exit to extract more work from the turbine and (2) collects the condensed steam and returns it tothe feedwater-heating system. Cooling water circulates from the cooling source to the condenser tubesby motor-driven pumps, which may be centrifugal, propeller, or mixed-ßow type. Multiple pumps, eachrated less than 100% of required pumping power, are used to allow to operation with one or more pumpsout of service and operate more efÞciently at part load. Cooling water is supplied from either a largeheat sink water source, such as a river, or from cooling towers. The cooling in the cooling tower isassisted by evaporation of 3 to 6% of the cooling water. Airßow is natural draft (hyperbolic towers) orforced draft. The noncondensable gases are removed from the condenser by a motor-driven vacuumpump or, more frequently, steam jet air ejectors which have no moving parts.
Pumps
Condensate Pump. Condensate is removed from the hot well of the condenser and passed through theLP heater string via the condensate pump. Typically, there will be two or more vertical (larger units) orhorizontal (medium and small units) motor-driven centrifugal pumps located near the condenser hot welloutlet. Depending on the size of the cycle, condensate booster pumps may be used to increase thepressure of the condensate on its way to the DA.
Feedwater Booster Pump. The DA outlet supplies the feedwater booster pump which is typically amotor-driven centrifugal pump. This pump supplies the required suction head for the BFP.
FIGURE 8.1.11 Shell and tube feedwater heater.
© 1999 by CRC Press LLC

Energy Conversion 8-13
Boiler Feed Pump. These pumps are multiple-stage centrifugal pumps, which, depending on the cycle,can be turbine or motor driven. BFP turbines (BFPT), Figure 8.1.12, are single-case units which drawsteam from the main turbine cycle and exhaust to the main condenser. Typical feedpump turbines require0.5% of the main unit power at full-load operation. Multiple pumps rated at 50 to 100% each are typicallyused to allow the plant to operate with one pump out of service.
Further Information
British Electricity International, 1992. Modern Power Station Practice, 3rd ed., Pergammon Press,Oxford.
Lammer, H.B. and Woodruff, 1967. Steam Plant Operation, 3rd ed., McGraw-Hill, New York.Powell, C. 1955. Principles of Electric Utility Operation, John Wiley & Sons, New York.
Generators
The electric generator converts rotating shaft mechanical power of the steam turbine to three-phaseelectrical power at voltages of between 13.8 and 26 kV, depending upon the power rating. The generatorcomprises a system of ventilation, auxiliaries, and an exciter. Figure 8.1.13 shows an installed hydrogen-cooled generator and brushless exciter of about 400 MW. Large generators greater than 25 MW usuallyhave a solid, high-strength steel rotor with a DC Þeld winding embedded in radial slots machined intothe rotor. The rotor assemblage then becomes a rotating electromagnet that induces voltage in stationaryconductors embedded in slots in a laminated steel stator core surrounding the rotor (see Figure 8.1.14).
The stator conductors are connected to form a three-phase AC armature winding. The winding isconnected to the power system, usually through a step-up transformer. Most steam turbines driven byfossil-Þred steam use a two-pole generator and rotate at 3600 rpm in 60-Hz countries and 3000 rpm in
FIGURE 8.1.12 Boiler feed pump turbine.
© 1999 by CRC Press LLC

8-14 Section 8
FIGURE 8.1.13 Generator and exciter.
FIGURE 8.1.14 Generator magnetic paths.
© 1999 by CRC Press LLC

Energy Conversion 8-15
50-Hz countries. Most large steam turbines driven by nuclear steam supplies use a four-pole generatorand rotate at 1800 or 1500 rpm for 60 and 50 Hz, respectively.
Generator Ventilation
Cooling the active parts of the generator is so important that generators are usually classiÞed by thetype of ventilation. Air-cooled generators are used commonly up to 100 MW, though some applicationsexist up to 200 MW. Some use ambient air drawing air through Þlters and others recirculate air throughair-to-water heat exchangers. Above 100 MW, most manufacturers offer hydrogen for the overall cooling,sometimes up to 1400 MW. Hydrogen has 14 times the speciÞc heat of air and is used at lower density.This contributes to much better cooling and much lower windage and blower loss. The frame must bedesigned to withstand the remote circumstance of a hydrogen explosion and requires shaft seals. Hydro-gen is noncombustible with purities greater than 70%. Generator purities are usually maintained wellabove 90%. Depending upon the manufacturer, generators with ratings above 200 to 600 MW may havewater-cooled stator winding, while the remaining components are cooled with hydrogen.
Generator Auxiliaries
Large generators must have a lubrication oil system for the shaft journal bearings. Major componentsof this system are pumps, coolers, and a reservoir. In most cases, the turbine and generator use a combinedsystem. For hydrogen-cooled generators, a shaft seal system and hydrogen supply system are needed.The shaft seal system usually uses oil pumped to a journal seal ring at a pressure somewhat higher thanthe hydrogen pressure. Its major components are pumps, coolers, and reservoir, similar to the lubricationsystem. The hydrogen supply system consists of a gas supply and regulators. A CO2 supply is used topurge the generator when going from air to hydrogen or vice versa to avoid a combustible hydrogen/airmixture. The stator winding water supply again uses pumps, coolers, and a reservoir. It needs deminer-alizers to keep the water nonconducting and provisions to control oxygen content to avoid copper oxidecorrosion which might break off and clog water passages.
Excitation
The rotor Þeld winding must have a DC source. Many generators use rotating ÒcollectorÓ rings withstationary carbon brushes riding on them to transfer DC current from a stationary source, such as athyristor-controlled ÒstaticÓ excitation system, to the rotor winding.
A rotating exciter, known as a brushless exciter, is used for many applications. It is essentially a smallgenerator with a rotating rectiÞer and transfers DC current through the coupling into the rotor windingwithout the need for collectors and brushes.
Further Information
Fitzgerald, A.E., Kingsley, C.F., and Kusko, A. 1971. Electric Machinery, 3rd ed., McGraw-Hill, NewYork.
Modern Steam Power Plant — An Example
The purpose of a power plant is to generate electric power. It does so by converting chemical energycontained in fuel into thermal energy in steam; thermal energy in steam into mechanical energy in theturbine/generator; and mechanical energy in the turbine/generator into electrical energy.
Operating efÞciency of a typical modern steam plant is about 35 to 45%. The primary losses resultfrom (1) heat sink losses in the condenser, (2) boiler losses, and (3) electrical losses.
Steam plant capacities have ranges from 50 to 1600 MW; however, modern plants are being designedfor more than 250 MW due to energy demands, system load requirements, and economies of scale inthe larger centralized stations.
© 1999 by CRC Press LLC

8-16 Section 8
Major Steam Plant Components
Steam plants comprise three major components (1) boiler, (2) turbine, and (3) main steam condenser.The boiler and turbine are covered in earlier subsections and neither will be repeated here. A graphicof the entire ßuid or work cycle is shown in Figure 8.1.15.
Condenser. The condenser (also discussed earlier) is a large heat exchanger that takes the LP turbineexhaust steam and converts it back to water. The steam passes over a bundle of tubes located in thecondenser and is cooled by the circulating water which passes through the tubes. The steam is condensedinto water drops and collected in the condenser hot well. The condensate is delivered from the condenserhot well through the condensate and feedwater systems and back to the boiler where it becomes steamagain.
Fuels. Coal, oil, and gas are used to fuel fossil plants. Although coal possesses the highest carbon content,it also possesses the highest sulfur, nitrogen, and ash content, thereby requiring air pollution-controlequipment. Controlling these pollutants requires the installation of scrubbers for sulfur control; overÞreair or gas recirculation for in-furnace nitrous oxides (NOx) control; selective catalytic reduction (SCR)for post-combustion NOx control; electrostatic precipitators (ESP) or baghouse for ßy ash control; andpneumatic, hydraulic, or mechanical ash-handling systems for bottom ash removal. Fuel oil and naturalgas are chießy composed of compounds of hydrogen and carbon (hydrocarbons) with very low percent-ages of sulfur, nitrogen, and ash and do not require pollution-control equipment.
Power Plant System
Power plants comprise the following main systems: fuel handling, air handling, gas handling, mainsteam, reheat steam, auxiliary steam, extraction steam, condensate, feedwater, circulating water, and airremoval.
FIGURE 8.1.15 Steam power plant schematic.
© 1999 by CRC Press LLC

Energy Conversion 8-17
Fuel-Handling System. The fuel-handling system consists of delivery, transfer, and processing. Fuel isdelivered to the plant from the fuel source by truck, boat, rail (coal and oil), or pipeline (oil and gas).Once delivered, the fuel is transferred from the delivery point to various locations throughout the fuel-handling system. For coal and oil, the fuel is either transferred to storage or sent directly to the boiler.For gas, the fuel is directly transferred to the boiler without any storage. Prior to delivery to the boilerfor burning, the fuel must be processed so that it will readily mix with air and burn completely. Coalmust be broken down into smaller pieces by breakers and crushers. Oil requires steam, air, or mechanicalatomization. Gas requires no processing.
Air/Gas-Handling Systems. Steam plants are classiÞed as either pressurized or balance draft. Pressurizedsystems include forced-draft fans to provide the necessary air for fuel, an air heater to transfer heat fromthe exit gas to the inlet air, and a wind box where the air is stored and then directed to the individualburner ports. A balanced draft system includes all of the components of the pressurized systems andinduced-draft fans to exhaust the combustion products from the boiler, thus maintaining the furnaceunder slightly negative pressure.
Main Steam System. The main steam system controls and regulates the ßow of high-temperature, HPsteam generated in the boiler furnace as it moves from the boiler to the turbine. The components in thissystem include main steam piping, safety valves, main steam stop valve, steam chest, and turbine controlvalve.
Reheat Steam System. The reheat steam system improves overall plant efÞciency by increasing the energyof steam that has been exhausted from the HP turbine. Steam from the hot reheat steam system isdelivered to the IP turbine. The components of the reheat steam system are cold reheat piping, thereheater section of the boiler, hot reheat piping, safety relief valves, reheat stop valves, reheater desu-perheater, and intercept valves.
Auxiliary Steam System. The auxiliary steam system directs and regulates auxiliary steam from the coldreheat line to the auxiliary steam users. The auxiliary steam system users are typically steam/airpreheating coils, outdoor freeze protection/heat tracing, deaerating heater pegging, turbine-driven BFPtesting, turbine seals, and plant heating.
Extraction Steam System. The extraction steam system directs and regulates the ßow of the extractionsteam from the turbine to the feedwater heaters, BFPT, and auxiliary steam system. The extraction steamheats the feedwater that ßows through the heaters, thus improving overall plant efÞciency. In large steamplants, six to eight stages of feedwater heating are typical.
Condensate System. The condensate system consists of condensate pumps, LP feedwater heaters, andDA. The condensate pumps remove condensate from the main condenser hot well, increase condensatepressure, and deliver it through the LP heaters to the DA. During this process, the condensate is heated,deaerated, and chemically treated.
Feedwater System. The feedwater system consists of BFPs, HP feedwater heaters, piping, and valves.The boiler feedwater pumps deliver water from the DA storage tank, through the HP heaters, and intothe boiler. Feedwater is supplied at sufÞcient quantities and pressure to satisfy unit demands duringstartups, shutdowns, and normal operation. The BFP is also the primary source of spray water for thesuperheater and reheater desuperheaters for control of the main and reheat steam temperatures,respectively.
BFPs can either be turbine or motor driven. Booster pumps may be required to provide additional netpositive suction head (NPSH) to the main and start-up BFPs for plants designed with a low DA setting.
Circulating Water System. The circulating water system pumps cooling water through the condensertubes at sufÞcient capacity, temperature, and pressure to absorb the latent heat in the LP exhaust steam.
© 1999 by CRC Press LLC
8-18 Section 8
Circulating water systems are classiÞed as once-through systems, when a large water source isavailable, or recirculating systems employing cooling towers. In once-through systems, circulating waterpumps deliver water from the plant water supply (river, lake, or ocean) through the condenser tubes toabsorb latent heat in the exhaust steam. Water ßows through the system once and is returned to its source.The major parts of this system are screens, pumps, expansion joints, valves, and piping. In recirculatingsystems, the cooling tower cools the heated circulating water from the main condenser by exposing itto air. The cooled water is stored in a basin located below the tower and is then circulated back throughthe system by the circulating water pumps.
Air Evacuation System. The air evacuation system removes air and noncondensable gases in the mainsteam condenser and helps maintain the vacuum created by the volume reduction of the condensingsteam during normal operation. The system also establishes a normal vacuum in the condenser prior toturbine start-up.
Further Information
Baumeister, T. and Marks, L.S. 1958. Standard Handbook for Mechanical Engineers, 8th ed., McGraw-Hill, New York.
Singer, J.G., Ed. 1991. Combustion Fossil Power, 4th ed., Combustion Engineering, Inc., Windsor, CN.
© 1999 by CRC Press LLC

Energy Conversion 8-19
8.2 Gas Turbines
Steven I. Freedman
Overview
Gas turbines are steady-ßow power machines in which a gas (usually air) is compressed, heated, andexpanded for the purpose of generating power. The term turbine is the component which delivers powerfrom the gas as it expands; it is also called an expander. The term gas turbine refers to a complete powermachine. The term gas turbine is often shortened to simply turbine, which can lead to confusion withthe term for an expander.
The basic thermodynamic cycle on which the gas turbine is based is known as the Brayton cycle. Gasturbines may deliver their power in the form of torque or one of several manifestations of pneumaticpower, such as the thrust produced by the high-velocity jet of an aircraft propulsion gas turbine engine.
Gas turbine machines vary in size from large, 250,000-hp utility machines, to small automobile, truck,and motorcycle turbochargers producing as little as 5 hp.
Gas turbines are used in electric power generation, propulsion, and compressor and pump drives. Themost efÞcient power generation systems in commercial service are gas turbine combined cycle plantswith power-to-fuel energy efÞciencies of more than 50% (higher heating value basis) or 55% (lowerheating value basis). Systems Þve points higher in efÞciency are now under development and are beingoffered commercially, and systems of even higher efÞciency are considered feasible.
History
The fourth quarter of the 19th century was one of great innovation in power machinery. Along withthe spark-ignited gasoline engine, the compression-ignited diesel engine, and the steam turbine, engineersapplied their skills to several hot-air engines. Charles Curtis received the Þrst U.S. patent for a completegas turbine on June 24, 1895. Aegidius Elling built the Þrst gas turbine in 1903, which produced 11 hp.
The Þrst commercial stationary gas turbine engineered for power generation was a 4000-kW machinebuilt by the Brown Boverei Company in Switzerland in 1939.
Aviation provided the impetus for gas turbine development in the 1930s. In Germany, Hans vonOhainÕs Þrst engine ran in March 1937. Frank WhittleÕs Þrst engine ran in England in April 1937. TheÞrst airplane ßight powered by a gas turbine jet engine was in Germany on August 27, 1939. The ÞrstBritish airplane powered by a gas turbine ßew on May 15, 1941.
A Swiss railway locomotive using a gas turbine was Þrst run in 1941. The Þrst automobile poweredby a gas turbine was a British Rover, which ran in 1950. And, in 1956, a gas turbine-powered Plymouthcar drove over 3000 miles on a coast-to-coast exhibition trip in the United States.
Fuels and Firing
The Þrst heat engines were external combustion steam engines. The combustion products never camein contact with the working ßuid, so ash, corrosive impurities, and contaminants in the fuel or exhaustdid not affect the internal operation of the engine. Later, internal combustion (piston) engines weredeveloped. In these engines, a mixture of air and fuel burned in the space enclosed by the piston andcylinder walls, thereby heating the air. The air and combustion products formed the working ßuid, andcontacted internal engine parts.
Most gas turbines in use today are internal combustion engines and consequently require clean fuelsto avoid corrosion and erosion of critical turbine components. Efforts were made to develop gas turbinesrugged enough to burn residual or crude oil. However, due to the higher efÞciencies obtainable byburning extremely clean fuel at higher temperatures, there is little current interest in using liquid fuelother than (clean) distillate oil in gas turbines. Interest in the use of residual oil is now centered ongasifying and cleaning these fuels prior to use.
© 1999 by CRC Press LLC

8-20 Section 8
A few externally heated gas turbines have been built for use with heavy oil, coal, nuclear reactor,radioisotope, and solar heat sources. However, none of these has become commercial. The added costand pressure drop in the externally Þred heater make externally Þred gas turbines expensive. Becausethe working ßuid temperature cannot be greater than that of the walls of the Þred heater, externally Þredgas turbines are substantially less efÞcient than modern internal combustion gas turbines with internallycooled blades.
The only internal combustion coal-Þred gas turbine entering commercial service is the pressurizedßuidized bed (PFB) combustion system. In the PFB, air discharged from the compressor of the turbineis used to ßuidize a bed of limestone or dolomite in which coal is burned. The bed is maintained atmodest temperature so that the ash in the coal does not form sticky agglomerates. Fortuitously, thistemperature range also minimizes NOx formation and allows capture of sulfur dioxide (SO2) in the bed.Bed temperature is maintained in the desired range by immersed boiler tubes. Carryover ßy ash isseparated from gaseous combustion products by several stages of cyclone inertial separators and, insome cases, ceramic Þlters. The power turbine is modiÞed to accommodate the combustion products,which after mechanical cleanup may still contain particles as large as 3 to 5 mm.
The most common gas turbine fuels today are natural gas and distillate oil. To avoid hot corrosionby alkali metal sulfates, the total sodium and potassium content of the fuel is typically limited to lessthan 5 ppm. Liquid fuels may also contain vanadium, which also causes corrosion. Fuels must be ash-free because particles larger than 3 to 5 mm rapidly erode blades and vanes. Experimental prototype gasturbines using pulverized coal pressurized combustors have not demonstrated adequate life. Hybridsystems Ñ in which the moderate-temperature coal combustion products are mechanically cleaned andheated to higher temperature by use of a clean fuel such as natural gas or distillate oil Ñ are the subjectof ongoing development.
Efficiency
The term efÞciency is applied not only to complete power generation machines but also to the individualcompression, expansion, and combustion processes that make up the gas turbine operating cycle. Dif-ferent deÞnitions of efÞciency apply in each case. In an expansion process, the turbine efÞciency isthe ratio of the actual power obtained to the maximum power that could have been obtained by expandingthe gas reversibly and adiabatically between the same initial and Þnal pressures.
Gas turbines typically involve high-speed gas ßows, so appreciable differences exist between the staticpressure and temperature and the total (or stagnation) pressure and temperature. Care must be taken ininterpreting data to be sure that the pressure condition Ñ static or stagnation Ñ at each componentinterface is properly used.
Irreversible losses in one stage of an expansion process show up as heat (increased temperature) inlater stages and add to the power delivered by such stages. Hence, a distinction exists between thepolytropic efÞciency (used to describe the efÞciency of a process of differential pressure change) andthe adiabatic (complete pressure change) efÞciency. The efÞciency of compressors and turbines basedon their inlet and outlet pressures is called the isentropic or adiabatic efÞciency. Unfortunately, bothterms are reported in the literature, and confusion can exist regarding the meaning of the term efÞciency .
Combustion efÞciency in well-engineered and well-built internal combustion gas turbines is almostalways close to 100%. The combustion losses appear as carbon monoxide, unburned hydrocarbons, andsoot, which are typically below 100 ppm, with clean fuels.
The gas turbine or engine efÞciency is the ratio of the net power produced to the energy in the fuelconsumed. The principal gas turbine fuels are liquid and gaseous hydrocarbons (distillate oil and naturalgas) which have high hydrogen content. Consequently, the term engine efÞciency needs to be qualiÞedas to whether it is based on the higher or the lower heat content of the fuel (the difference between thetwo being the latent heat of condensation of the water vapor in the products of combustion). Utility fueltransactions are traditionally based on higher heating values, and most engine publications presume thelower heating value of the fuel as the efÞciency basis.
© 1999 by CRC Press LLC
Energy Conversion 8-21
Engineers analyze gas turbine machines to evaluate improvements in component performance, inhigher temperature and pressure ratio designs, and in innovative cycles. Ideal case cycle calculationsgenerally assume the following:
¥ Air (with either constant or temperature-dependent speciÞc heats) is the working ßuid in bothturbine and compressor (with equal mass ßows);
¥ Air is the working ßuid in both turbine and compressor but with the turbine mass ßow greaterby the amount of fuel used.
Components are modeled with or without frictional pressure drops, and heat transfer effectivenessmay be ideal (unity) or actual, depending on the purpose of the analysis. Use of compressor air forcooling of high-temperature structure, nozzles, and blades are modeled in varying degrees of complexity.Two-dimensional temperature proÞles or pattern factors exist. Component inlet and exit total pressurelosses should be included in cycle analyses.
Gas Turbine Cycles
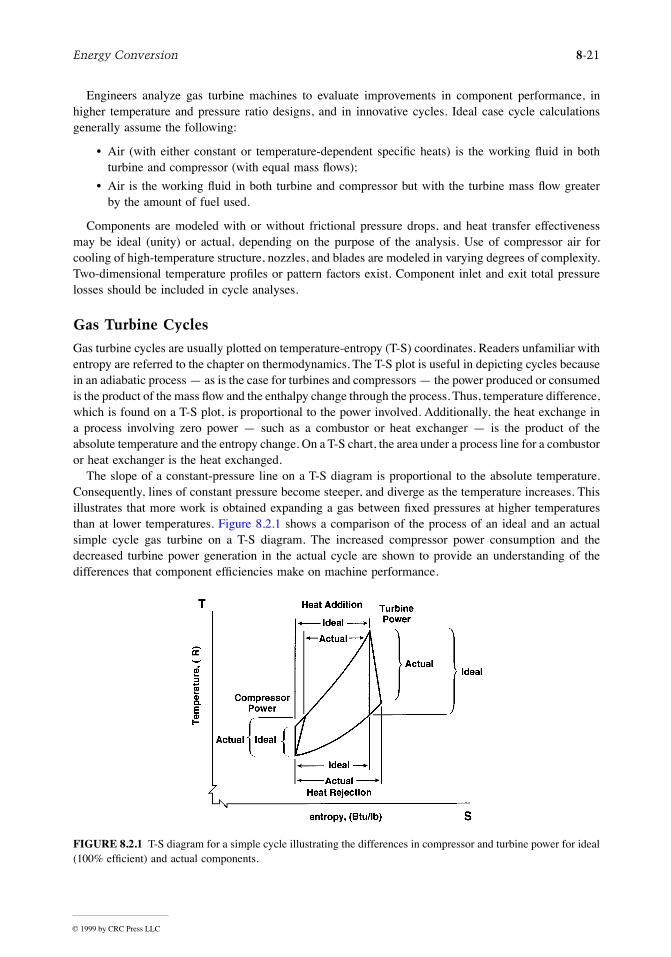
Gas turbine cycles are usually plotted on temperature-entropy (T-S) coordinates. Readers unfamiliar withentropy are referred to the chapter on thermodynamics. The T-S plot is useful in depicting cycles becausein an adiabatic process Ñ as is the case for turbines and compressors Ñ the power produced or consumedis the product of the mass ßow and the enthalpy change through the process. Thus, temperature difference,which is found on a T-S plot, is proportional to the power involved. Additionally, the heat exchange ina process involving zero power Ñ such as a combustor or heat exchanger Ñ is the product of theabsolute temperature and the entropy change. On a T-S chart, the area under a process line for a combustoror heat exchanger is the heat exchanged.
The slope of a constant-pressure line on a T-S diagram is proportional to the absolute temperature.Consequently, lines of constant pressure become steeper, and diverge as the temperature increases. Thisillustrates that more work is obtained expanding a gas between Þxed pressures at higher temperaturesthan at lower temperatures. Figure 8.2.1 shows a comparison of the process of an ideal and an actualsimple cycle gas turbine on a T-S diagram. The increased compressor power consumption and thedecreased turbine power generation in the actual cycle are shown to provide an understanding of thedifferences that component efÞciencies make on machine performance.
FIGURE 8.2.1 T-S diagram for a simple cycle illustrating the differences in compressor and turbine power for ideal(100% efÞcient) and actual components.
© 1999 by CRC Press LLC

8-22 Section 8
The incremental amount of power produced per differential pressure change in the gas is given by
d(Power/mass ßow) = ÐRT dp/p
Two phenomena are illustrated by this equation. First, power is proportional to the absolute temperatureof the gas. Second, power is proportional to the percent change in pressure. This latter point is importantin understanding the effect of pressure losses in cycle components. In heat exchangers, the proper measureof power lost is the percent pressure drop.
Cycle Configurations
The basic Brayton cycle consists of a compressor, a combustor or burner, and an expander. ThisconÞguration is known as the simple cycle. In idealizing the actual cycle, combustion is replaced byconstant-pressure heat addition, and the cycle is completed by the assumption that the exhaust to ambientpressure could be followed by a zero-pressure-loss cooling to inlet conditions.
A T-S diagram of the simple cycle gas turbine with an upper temperature limit set by metallurgicalconditions is illustrated in Figure 8.2.2 for cycles of low, medium, and high pressure ratios. The heataddition is only by fuel combustion, simpliÞed here to be without mass addition or change in speciÞcheat of the working ßuid.
It is seen that the low-pressure-ratio cycle requires a large heat addition, which leads to a low efÞciency,and the high-pressure-ratio cycle has turbine power output barely greater than the compressor powerrequirement, thereby leading to low net output and low efÞciency. At intermediate pressure ratios, theturbine power output is substantially higher than the compressor power requirement, and the heat additionis modest in comparison with the difference between the turbine and compressor powers. There is anoptimum pressure ratio for maximum efÞciency, which is a function mainly of the maximum gastemperature in the machine, and to a lesser extent, by the component efÞciencies, internal pressure losses,and the isentropic exponent. There is another optimum pressure ratio for maximum speciÞc power (powerper unit mass ßow).
As the achievable turbine inlet temperature increases, the optimum pressure ratios (for both maximumefÞciency and maximum speciÞc power) also increase. The optimum pressure ratio for maximum speciÞcpower is at a lower pressure level than that for maximum efÞciency for all cycles not employing arecuperator. For cycles with a recuperator, the reverse is true: maximum efÞciency occurs at a lower
FIGURE 8.2.2 T-S diagram illustrating the power and heat (fuel) requirements at low, best, and high cycle pressures.
© 1999 by CRC Press LLC

Energy Conversion 8-23
pressure ratio than maximum speciÞc power. Heavy-duty utility and industrial gas turbines are typicallydesigned to operate near the point of maximum speciÞc power, which approximates lowest equipmentcost, while aeroderivative gas turbines are designed to operate near the point of maximum efÞciency,approximating highest thrust. Figure 8.2.3 shows a performance map (efÞciency as a function of powerper unit of air ßow) for a simple cycle gas turbine for two turbine inlet temperatures. It is seen that athigher temperature, both the efÞciency and speciÞc power increase, as well as the optimum pressureratios for both the maximum efÞciency and maximum speciÞc power conditions.
Aircraft gas turbines operate at temperatures above the limit of turbine materials by using blades andvanes with complex internal cooling passages. The added cost is economically justiÞed because thesemachines can command high prices in the aircraft propulsion marketplace. Aeroderivative engines havehigher pressure ratios, higher efÞciencies, and lower exhaust temperatures than heavy-duty machines.The stationary power markets served by aeroderlvative gas turbines are principally pipeline compressorstations and oil/gas production wells. Aeroderivative gas turbines also are economically advantageousfor intermediate-duty applications.
Components Used in Complex Cycles
Recuperators and regenerators recover heat from the turbine exhaust and use it to preheat the air fromthe compressor before it enters the combustor, thereby saving fuel. This heat transfer is shown in Figure8.2.4. While recuperators and regenerators are quite similar thermodynamically, they are totally differentin design. Recuperators are conventional heat exchangers in which hot and cold gases ßow steadily onopposite sides of a solid (usually metal) wall.
Regenerators are periodic-ßow devices. Fluid streams ßow in opposite directions through passagesin a wheel with heat storage walls. The wheel rotates, transferring heat from one stream to the other.Regenerators usually use a nest of very small parallel passages oriented axially on a wheel which rotatesbetween hot and cold gas manifolds. Such regenerators are sometimes used in industrial processes forfurnace heat recovery, where they are referred to as heat wheels. Because regenerators are usually morecompact than recuperators, they are used in automotive gas turbines (under development). The difÞcultyin using regenerators on gas turbines intended for long life is that the two gas streams are at very differentpressures. Consequently, the seals between the manifolds and the wheel must not leak excessively overthe maintenance overhaul interval of the engine. If they do, the power loss due to seal leakage willcompromise engine power and efÞciency. Figure 8.2.5 shows a performance map for the regenerative
FIGURE 8.2.3 Performance map of a simple cycle gas turbine.
© 1999 by CRC Press LLC

8-24 Section 8
gas turbine cycle for two temperatures. It is seen that as the temperature increases, the efÞciency, speciÞcpower, and optimum pressure ratio all increase.
Current research on the recovery of gas turbine exhaust heat includes examination of thermochemicalrecuperation, where exhaust heat is used to effect a chemical reaction (reforming) of the fuel with steam,thereby increasing the heating value of the fuel. Although this process is feasible, research is underwayto determine if it is practical and economic.
Industrial process compressors frequently use intercoolers to reduce compressor power when thecompressor has a high pressure ratio and operates for a large number of hours per year. When analyzingcycles with intercoolers, the added pressure drops in the compressor interstage entrance and exit diffuserand scroll and the pressure drop in the intercooler itself should be included.
In a similar manner, turbine reheat can be used to increase the power output of a large-pressure-ratioturbine. This is the thermodynamic principle in turbojet afterburner Þring. Turbine reheat increases
FIGURE 8.2.4 T-S diagram illustrating the heat transfer from the turbine exhaust to the compressor dischargeaccomplished by a recuperator/regenerator.
FIGURE 8.2.5 Performance map of a regenerative cycle gas turbine.
© 1999 by CRC Press LLC

Energy Conversion 8-25
power, but decreases efÞciency unless the turbine exhaust heat is used for additional power generation,as is the case with a combined cycle, or is used with a recuperator to preheat combustor inlet air.
Intercoolers and reheat burners increase the temperature difference between the compressor and turbinedischarges, thereby increasing the opportunity to use a recuperator to preheat the burner air with exhaustheat. An intercooled recuperated (ICR) machine is at present in development. The efÞciency decreaseat part load of an ICR gas turbine is much less than of conventional simple cycle machines.
Small gas turbines have uncooled turbine blades as a result of the difÞculty in manufacturing extremelysmall cooling passages in small blades. This results in low efÞciencies, making it difÞcult for suchturbines to compete with high-volume production (low-cost) reciprocating (piston) engines. The low-pressure-ratio recuperated cycle has greater efÞciency, although at higher cost. The recuperated cycle isÞnding favor in programs for small (under 300-kW) gas turbines used for stationary power. The recu-perated cycle is efÞcient enough in comparison with piston engines (Otto cycles) to be of interest toautomotive power plant engineers. Current designs of automotive gas turbines (AGT) have ceramicturbines and combustors and use ceramic regenerators made from a spirally wound corrugated structurewith gas passages about a millimeter in diameter.
Because of their compact size, low emissions, and light weight, gas turbines are also being consideredfor hybrid engine-battery vehicles. Proponents are pursuing the low-pressure-ratio recuperated gas turbineas the way to obtain high efÞciency and low emissions in a compact power plant.
An ingenious gas turbine cycle is the closed cycle in which the working ßuid is sealed in the system.Heat is added to the ßuid with an externally Þred heater and extracted from the ßuid through heatexchangers. The working ßuid may be any gas, and the density of the gas may be varied Ñ to vary thepower delivered by the machine Ñ by using a gas storage cylinder connected to the compressor dischargeand inlet. The gas storage system is at an intermediate pressure so that it can discharge gas into thelowest pressure point in the cycle and receive gas from the highest pressure point in the cycle. Aboutten such units were built between 1938 and 1968; however, in spite of its sophistication, the added costand low efÞciency prevented this system from becoming economic.
The exhaust from a gas turbine is quite hot and can be used to raise steam, which can then be usedto generate additional power with a steam turbine. Such a compound gas turbine-steam turbine systemis referred to as a combined cycle. Figure 8.2.6 shows a schematic diagram of the equipment in acombined cycle. Because the exhaust of heavy-duty machines is hotter than that of aeroderivativemachines, the gain in combined cycle system efÞciency through use of the steam bottoming cycledescribed above is greater for heavy-duty machines than for aeroderivatives. Indeed, heavy-duty machinesare designed with two criteria in mind: achieving lowest cost for peaking (based on the simple cycleconÞguration) and achieving highest efÞciency in combined cycle conÞguration for baseload use. Theoptimum pressure ratios for these two system conÞgurations are very close. Steam bottoming cyclesused in combined cycles usually use steam at multiple pressure levels to increase efÞciency.
FIGURE 8.2.6 Combined (Brayton-Rankine) cycle.
© 1999 by CRC Press LLC

8-26 Section 8
Another system in which the power and efÞciency of a gas turbine is increased through the use ofsteam is the steam-injected gas turbine. Figure 8.2.7 shows a schematic diagram of a steam-injectedgas turbine cycle. Here the turbine exhaust ßows into a heat recovery steam generator (HRSG) operatingat a pressure somewhat higher than the compressor discharge pressure. The steam is introduced into thegas turbine at the combustor. The steam-air mixture then passes into the turbine, where the augmentedmass ßow increases the power produced by the turbine. Additional fuel is required by the combustorbecause the steam must be heated from the HRSG delivery temperature to the combustor dischargetemperature. Typical turbines can accommodate only a limited additional mass ßow Ñ from 5 to 15%,depending on the design of the original gas turbine. Steam-injected gas turbines enable the host to usethe steam for industrial purposes, space heating, or for the generation of additional power.
A group of cycles under consideration for development involve the use of adiabatic saturators toprovide steam at compressor discharge pressure to augment greatly the mass ßow through the turbine,and consequently increase cycle power and efÞciency. In the adiabatic saturator, water ßows in acountercurrent path to the compressor discharge air in a mass transfer tower. Such equipment is oftenused in the chemical processing industries. The saturated air is preheated in a turbine exhaust heatrecuperator. This cycle is called the humid air turbine, or HAT, cycle. The HAT cycle is particularlyuseful in using the low-temperature heat generated in coal-gasiÞcation-fueled gas turbine power plants.As the mass ßow through the turbine is signiÞcantly augmented, engineers can no longer use theexpansion turbine which was matched to the compressor in a conventional simple cycle gas turbine.
Figure 8.2.8 shows performance maps for the gas turbine cycles of major interest for a turbine inlettemperature typical of new products. Intercooling increases the speciÞc power appreciably when com-pared with a simple cycle; however, such improvement requires an increase in pressure ratio. Recuperatedcycles have considerably higher efÞciency than similar cycles without recuperation. The effect of pressureratio on the performance of recuperated cycles is opposite to that of similar cycles without recuperation.For recuperated cycles, the pressure ratio for maximum efÞciency is considerably lower than for max-imum speciÞc power. Performance maps such as these are used in screening cycle alternatives forimproved performance. Individual curves are generated for speciÞc component performance values foruse as a guide in developing new or improved machines.
Upper Temperature Limit
Classically, gas turbine engineers often spoke of a metallurgical limit in reference to maximum turbineinlet temperature. Later, turbine vane and blade cooling became standard on large machines. This situationcreates a temperature difference between the combustion products ßowing through the turbine and theturbine blade wall. Thus, because heat can be removed from the blades, the turbine can be operated witha combustion gas temperature higher than the metallurgical limit of the blade material. As a rule, theblades and vanes in new large gas turbines contain complex internal passages, through which up to 20%of compressor discharge air is directed. The cooling air Þrst ßows through internal convective cooling
FIGURE 8.2.7 Steam-injected gas turbine.
© 1999 by CRC Press LLC

Energy Conversion 8-27
passages, then through impingement passages, where the air is directed at the blade and vane walls, andÞnally through small holes in the blade, where it is used to provide a low-temperature Þlm over theblade surface. This Þlm cooling of the surface reduces heat transfer to the blade.
The design of blade and vane cooling passages is an extremely competitive endeavor because greatercooling enables use of higher combustion temperatures without exceeding the metallurgical limit of theblade material. However, a balance between air ßow for cooling and air ßow for power must be achieved;the cooling air ßowing within a blade drops in pressure without producing any power within that stage(although it is available for power in later stages). In the newest gas turbines, blade cooling, the differencebetween turbine inlet gas temperature and blade metal temperature, is around 1000°F.
Some of the latest large gas turbines being introduced to the market in the 1997 to 2000 period arebeing offered for combined cycle application with closed-circuit steam cooling of selected hot sectionparts. Steam cooling reduces the need for air cooling, so that more of the compressor discharge air canbe used for NOx reduction in the combustor and for power generation. The heat transferred to the steamincreases the efÞciency of the bottoming cycle. The additional combustion products which ßow throughthe high-pressure portions of the turbine generate substantially more power, thereby increasing both thepower output and the efÞciency of the machine. With more air for combustion, the fuel can be burnedas a leaner mixture, with either less NOx produced, or, as is preferred, with higher-temperature gasesgoing to the turbine and the same NOx (or a combination of these beneÞts).
Materials
The high-technology parts of a gas turbine are its hot section parts: blades, vanes, combustors andtransition pieces. Gas turbine power, efÞciency, and economics increase with the temperature of the gasßowing through the turbine blade passages. It is in the fabrication of these hot section parts thatmanufacturers are most competitive. Materials are selected to survive in serviceable condition for over50,000 hr and associated numbers of thermal cycles. Ceramic coatings protect materials from oxidationand corrosion and provide thermal insulation, permitting higher gas temperatures.
Gas turbine alloys are frequently referred to as superalloys because of their extremely high strengthat high temperatures. These superalloys are nickel based (such as IN 738), cobalt based (such as FSX-414), or with a nickel-iron base such as Inconel 718. Nickel resists oxidation and is creep resistant, butis subject to corrosive sulÞdation. Alloy and manufacturing advancements have been led by the needsof military aircraft engines. Coating developments for corrosion resistance have been led by the needs
FIGURE 8.2.8 SpeciÞc power (Btu/lb).
© 1999 by CRC Press LLC
8-28 Section 8
of stationary power for overhaul intervals as large as 50,000 hr. The developmental needs of automotivegas turbines have led to signiÞcant advances in strength and reliability of high-temperature ceramiccomponents, including radial inßow turbines. Ceramic materials, principally silicon nitride, are expectedto enter service soon in small gas turbines.
Combustion
Gas turbine combustors appear to be simple in design, yet they solve several difÞcult engineeringchallenges. Until relatively recently, gas turbine combustors employed a (turbulent) diffusion ßamedesign approach, which created the most compact ßame. European heavy-duty gas turbine manufacturersÑ with substantial interest in burning heavy fuel oils Ñ preferred large, off-engine combustors, oftencalled silo combustors because of their appearance, in order to obtain lower ßame velocities and longerresidence times. American heavy-duty gas turbine manufacturers use compact on-engine combustorsand design for gaseous and clean (distillate) liquid fuels. Aeropropulsion gas turbines require the smallestpossible frontal area and use only clean liquid fuels; hence, they use on-engine combustors.
Recently, stationary engines have been required to reduce NOx emissions to the greatest extent possible,and combustors on stationary gas turbines Þrst modiÞed their diffusion ßame combustors and employedwater and steam injection to quench ßame hot spots. Most recently, designs changed to the lean-premixedprocess. With the improved blade cooling, materials, and coatings now in use, the material limits onturbine inlet temperature and the NOx emission limits on combustor temperature appear to be convergingon a combustion-temperature asymptote around 2700°F (1482°C). This may be increased if catalyticcombustors prove practical.
Mechanical Product Features
In view of the need to achieve all the performance features described above, one must keep in mind thata gas turbine is a high-speed dynamic machine with numerous machine design, materials, and fabricationfeatures to consider. Major issues include the following: critical shaft speed considerations, bearingrotational stability, rotor balancing, thrust bearing design, bearing power loss, oil lubrication system, oilselection, air Þlter design and minimization of inlet and exhaust diffuser pressure drops, instrumentation,controls, diagnostic systems, scheduled service and inspection, overhaul, and repair. All of these topicsmust be addressed to produce a cost-effective, reliable, long-lived, practical gas turbine product that willsatisfy users while also returning to investors sufÞcient proÞt for them to continue to offer better powergeneration products of still higher performance.
Defining Terms
Adiabatic saturator: A combined heat-and-mass-exchanger whereby a hot gas and a volatile liquidpass through a series of passages such that the liquid is heated and evaporates into the gas stream.
Combined cycle: An arrangement of a gas turbine and a stream turbine whereby the heat in the exhaustfrom the gas turbine is used to generate steam in a heat recovery boiler which then ßows througha steam turbine, thereby generating additional power from the gas turbine fuel.
Combustion efÞciency: Ratio of rate of heat delivered in a device which burns fuel to the rate of energysupplied in the fuel.
Expansion process: Process of power generation whereby a gas passes through a machine while goingfrom a condition of high pressure to one of low pressure, usually the machine produces power.
Gas turbine or engine efÞciency: The ratio of the net power delivered (turboexpander power minuscompressor and auxiliary power) to the rate of energy supplied to the gas turbine or engine in theform of fuel, or, in certain cases such as solar power, heat.
Humid air turbine: A gas turbine in which the ßow through the expander is augmented by large amountsof steam generated by use of an adiabatic saturator.
© 1999 by CRC Press LLC

Energy Conversion 8-29
Intercooler: A heat exchanger used to cool the ßow between sections of a compressor such that thehigh pressure section acts on a stream of reduced volumetric ßow rate, thereby requiring lessoverall power to compress the stream to the Þnal pressure.
Recuperator: A heat exchanger in which the hot and cold streams pass on opposite sides of a wallthrough which heat is conducted.
Regenerator: A heat exchanger in which the hot and cold streams alternately heat and cool a wall whosetemperature rises and falls, thereby transferring heat between the streams.
Steam cooling: A process in which steam is used as the heat transfer ßuid to cool a hot component.Steam-injected gas turbine: A system in which the gas turbine ßow is augmented by steam, thereby
generating additional power.Turbine efÞciency: Ratio of the power delivered in an expansion process employing a turbine as the
expander to the maximum power which could be produced by expanding the gas in a reversibleadiabatic (isentropic) process from its initial pressure and temperature to its Þnal pressure to theactual power.
Further Information
Wilson, D.G. 1984. The Design of High-EfÞciency Turbomachinery and Gas Turbines, MIT Press,Cambridge, MA.
Kerrebrock, J. 1992. Aircraft Engines and Gas Turbines, MIT Press, Cambridge, MA.Boyce, M.P. 1982. Gas Turbine Engineering Handbook, Gulf Publishing, Houston, TX.SawyerÕs Gas Turbine Engineering Handbook, Vol. 1: Theory and Design, Vol. 2: Section and Applica-
tion, Vol. 3: Accessories and Support, Turbomachinery International Publications, Norwalk, CT,1985.
Appendix
Equations for gas turine calculations based on the use of a perfect gas as the working ßuid.
Perfect gas law pv = RTGas constant R = ÿR/molecular weightFor air (molecule weight of 28.97) R = 286.96 J/kg á K
= 0.06855 Btu/lbm á °R= 53.32 ft á lbf/lbm á °R
Universal gas constant ÿR = 8313 J/kg á mol á K
= 1.986 Btu/lb á mol á °R= 1545 ft á lbf/lb á mol á °R
Relationships of properties cp = cv + RIsentropic exponet g = cp/cv (air, g = 1.4)
(g Ð 1)/g = R/cp
Isentropic process pvg = constantP2/P1 = (T2/T1)g/(gÐ1)
Prolytropic process pvn = constantP2/P1 = (T2/T1)n/(nÐ1)
Pressure ratio r = P2/P1
Ratio of stagnation T° and p° to static T and p
Mach number
Gravitational constant gc = ma/FSubscripts t = turbine
c = compressor
T
TM
°= +
-1
1
22g
p
pM
°= +
-æè
öø
-( )1
1
22
1g g g
M V g RTc= g
© 1999 by CRC Press LLC

8-30 Section 8
f = fueli = inlete = exit
Cycle efÞciency:
where HV = heating value of fuel.For speciÞc heat independent of temperature and small mass ßow of fuel in comparison to air:
Isentropic efÞciency (Þnite pressure ratio):
or
and
or
Polytropic efÞciency (differential pressure ratio):
and
Relationships between isentropic and polytropic efÞcencies:
h =-Ç Ç
Çm h m h
m HVt t c c
f
D D
h =-D D
D
T T
Tt c
b
ht T T= D D actual isentropic
hg gte iT T
r=
-
- -( )1
1 1
hg gt
n nr
r=
-
-
-( )
-( )1
1
1
1
hc T T= D D isentropic actual
hg g
ce i
r
T T=
--
-( )1 11
hg g
h hc
r
r=
-
-
-( )
-( )
1
1
1
1
hg gt
n n=
-( )-( )
1
1
hg g
c n n=
-( )-( )
1
1
h
h
g g
g g h
g g h
g g
s c
s t
r
r
r
r
pc
p t
,
,
,
=-
-
=-
-
-( )
-( )
-( )
-( )
1
1
1
1
1
1
1
1
h
h
hh
g g
g g
g g
g g
p c
s c
p t
s t
r
r
r
r
,
,
,
,
ln
ln
ln
ln
=-
+é
ëêê
ù
ûúú
=- -( )[ ]
-( )
-( )
-( )
-( )
1
1
1
1
11
1 1
© 1999 by CRC Press LLC

Energy Conversion 8-31
8.3 Internal Combustion Engines
David E. Klett and Elsayed M. Afify
Introduction
This section discusses the two most common reciprocating internal combustion (IC) engine types incurrent use; the spark ignition (SI) and the compression ignition (CI or diesel) engine. Both the Stirlingengine (technically, an external combustion engine) and the gas turbine engine are covered in othersections of this chapter. Space limitations do not permit detailed coverage of the very broad Þeld of ICengines. For a more detailed treatment of SI and CI engines and for information on variations, such asthe Wankel rotary engine and the Miller cycle engine (a variation on the reciprocating four-stroke SIengine introduced in production by Mazda in 1993), the reader is referred to the several excellenttextbooks on the subject, technical papers, and other sources that are included in the list of referencesand the Further Information section.
Basic SI and CI engines have not fundamentally changed since the early 1900s with the possibleexception of the introduction of the Wankel rotary SI engine in the 1960s (Norbye, 1971). However,major advances in the areas of materials, manufacturing processes, electronic controls, and computer-aided design have led to signiÞcant improvements in dependability, longevity, thermal efÞciency, andemissions during the past decade. Electronic controls, in particular, have played a major role in efÞciencygains in SI automotive engines through improved control of the fuel injection and ignition systems thatcontrol the combustion process. Electronic control of diesel fuel injection systems is also becomingmore common and is producing improvements in diesel emissions and fuel economy.
This section presents the fundamental theoretical background of IC engine function and performance,including four-stroke and two-stroke SI and CI engines. Sections on combustion, emissions, fuels, andintake pressurization (turbocharging and supercharging) are also included.
Engine Types and Basic Operation
IC engines may be classiÞed by a wide variety of characteristics, the primary ones being SI vs. CI, four-stroke vs. two-stroke, and reciprocating vs. rotary. Other possible categories of classiÞcation includeintake type (naturally aspirated vs. turbocharged or supercharged), number of cylinders, cylinder arrange-ment (in-line, vee, opposed), cooling method (air vs. water), fueling system (injected vs. carbureted),valve gear arrangement (overhead cam vs. pushrod), type of scavenging for two-stroke engines (cross,loop, or unißow), and type of injection for diesel engines (direct vs. indirect).
Four-Stroke SI Engine
Figure 8.3.1 is a cross-section schematic of a four-stroke SI engine. The SI engine relies on a spark plugto ignite a volatile air-fuel mixture as the piston approaches top dead center (TDC) on the compressionstroke. This mixture may be supplied from a carburetor, a single throttle-body fuel injector, or byindividual fuel injectors mounted in the intake port of each cylinder. One combustion cycle involves tworevolutions of the crankshaft and thus four strokes of the piston, referred to as the intake, compression,power, and exhaust strokes. Intake and exhaust valves control the ßow of mixture and exhaust gasesinto and out of the cylinder, and an ignition system supplies a spark-inducing high voltage to the sparkplug at the proper time in the cycle to initiate combustion. On the intake stroke, the intake valve opensand the descending piston draws a fresh combustible charge into the cylinder. During the compressionstroke, the intake valve closes and the fuel-air mixture is compressed by the upward piston movement.The mixture is ignited by the spark plug, typically somewhat before TDC. The rapid premixed homo-geneous combustion process causes a sharp increase in cylinder temperature and pressure that forcesthe piston down for the power stroke. Near bottom dead center (BDC) the exhaust valve opens andthe cylinder pressure drops rapidly to near atmospheric. The piston then returns to TDC, expelling the
© 1999 by CRC Press LLC
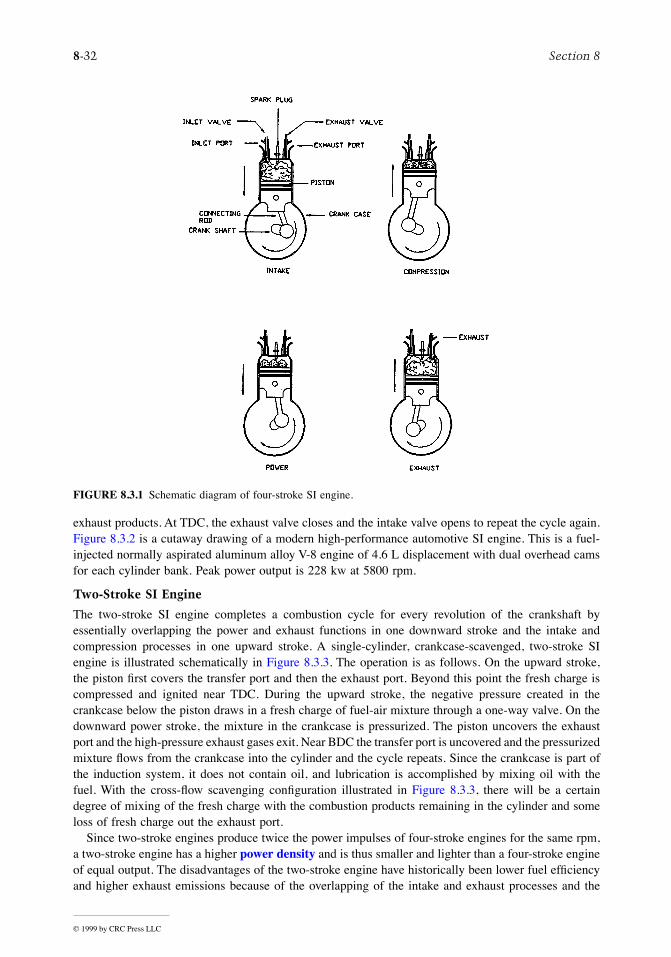
8-32 Section 8
exhaust products. At TDC, the exhaust valve closes and the intake valve opens to repeat the cycle again.Figure 8.3.2 is a cutaway drawing of a modern high-performance automotive SI engine. This is a fuel-injected normally aspirated aluminum alloy V-8 engine of 4.6 L displacement with dual overhead camsfor each cylinder bank. Peak power output is 228 kw at 5800 rpm.
Two-Stroke SI Engine
The two-stroke SI engine completes a combustion cycle for every revolution of the crankshaft byessentially overlapping the power and exhaust functions in one downward stroke and the intake andcompression processes in one upward stroke. A single-cylinder, crankcase-scavenged, two-stroke SIengine is illustrated schematically in Figure 8.3.3. The operation is as follows. On the upward stroke,the piston Þrst covers the transfer port and then the exhaust port. Beyond this point the fresh charge iscompressed and ignited near TDC. During the upward stroke, the negative pressure created in thecrankcase below the piston draws in a fresh charge of fuel-air mixture through a one-way valve. On thedownward power stroke, the mixture in the crankcase is pressurized. The piston uncovers the exhaustport and the high-pressure exhaust gases exit. Near BDC the transfer port is uncovered and the pressurizedmixture ßows from the crankcase into the cylinder and the cycle repeats. Since the crankcase is part ofthe induction system, it does not contain oil, and lubrication is accomplished by mixing oil with thefuel. With the cross-ßow scavenging conÞguration illustrated in Figure 8.3.3, there will be a certaindegree of mixing of the fresh charge with the combustion products remaining in the cylinder and someloss of fresh charge out the exhaust port.
Since two-stroke engines produce twice the power impulses of four-stroke engines for the same rpm,a two-stroke engine has a higher power density and is thus smaller and lighter than a four-stroke engineof equal output. The disadvantages of the two-stroke engine have historically been lower fuel efÞciencyand higher exhaust emissions because of the overlapping of the intake and exhaust processes and the
FIGURE 8.3.1 Schematic diagram of four-stroke SI engine.
© 1999 by CRC Press LLC

Energy Conversion 8-33
FIGURE 8.3.2 Ford 4.6-L aluminum V-8 SI engine. (Courtesy of Ford Motor Company.)
FIGURE 8.3.3 Schematic drawing of two-stroke SI engine.
© 1999 by CRC Press LLC

8-34 Section 8
loss of some fresh intake mixture with the exhaust products. For this reason, two-stroke SI engines havelargely been conÞned to small-displacement applications, such as motorcycles, outboard marine engines,and small equipment. Several manufacturers have addressed these shortcomings in recent years and haveachieved signiÞcant improvements in two-stroke engine fuel economy and emissions (Blair, 1988). TheOrbital OCP (Orbital Combustion Process) engine, illustrated in Figure 8.3.4, is a modern two-strokeengine that utilizes direct injection of fuel into the cylinder in conjunction with a high-turbulencecombustion chamber design and an electronically controlled exhaust port scavenging control valve toachieve very favorable fuel economy and signiÞcantly reduced levels of NOx and hydrocarbon emissions.This engine, in three and six cylinder versions, is currently being used in automotive and marineapplications.
Compression Ignition Engine
The basic valve and piston motions are the same for the CI, or diesel, engine as discussed above for theSI engine. The CI engine relies on the high temperature and pressure of the cylinder air resulting fromthe compression process to cause autoignition of the fuel, which is injected directly into the combustionchamber of direct injection (DI) engines or into the prechamber of indirect injection (IDI) engines,when the piston approaches TDC on the compression stroke. The compression ratios are typically muchhigher for CI than for SI engines to achieve the high air temperatures required for autoignition, and thefuels used must have favorable autoignition qualities.
The time period between the start of fuel injection and the occurrence of autoignition is called theignition delay period. Long ignition delay periods allow more time for fuel vaporization and fuel-airmixing, resulting in objectionable diesel knock when this larger premixed charge ignites. Combustionchambers and fuel injection systems must be designed to avoid extended ignition delay periods. Diesel
FIGURE 8.3.4 Orbital OCP two-stroke SI engine. (Courtesy of Orbital Engine Company.)
© 1999 by CRC Press LLC

Energy Conversion 8-35
engines may be classiÞed as DI or IDI. In DI engines, the combustion chamber consists of a bowl formedin the top of the piston and the fuel is injected into this volume. The injector tip generally has from fourto eight holes to form multiple spray cones. Two variations are illustrated in Figure 8.3.5. The quiescentchamber engine utilizes a large-diameter shallow bowl shape that produces low swirl and low turbulenceof the air during compression. Fuel is injected at high pressure through a multihole nozzle, and mixingof the fuel and air relies primarily on the energy of the injected fuel to cause air entrainment in the spraycone and diffusion of vaporized fuel into the air. This system is suited to large slow-speed engines thatare operated with signiÞcant excess air.
The toroidal bowl combustion chamber is used in conjunction with intake ports and/or valve shroudsdesigned to produce air swirl to enhance fuel-air mixing. The swirl ratio is deÞned by swirl ratio =swirl speed (rpm)/engine speed (rpm). The swirl velocity component is normal to the fuel spray directionand tends to promote mixing in the regions between the individual spray cones. This system makesbetter use of the available air and is utilized extensively in moderate-speed engines such as over-the-road truck engines. DI does not lend itself well to high-speed operation, as the time available for propermixing and combustion is less. Diesel engines for passenger car applications are generally designed forhigher-speed operation to produce higher speciÞc output, and typically utilize IDI combustion systems,two of which are illustrated in Figure 8.3.6.
IDI systems make use of small prechambers incorporated in the cylinder head to promote rapid mixingof fuel and air and shorten the ignition delay period. Swirl chambers are designed to produce a strongvortex in the prechamber during compression. The fuel is sprayed into the chamber through a single-hole nozzle and the high vorticity promotes rapid mixing and short ignition delay periods. Precombustionchambers do not attempt to generate an orderly vortex motion within the chamber, but instead rely ona high level of turbulence, created by the rush of air into the chamber during compression, to promotemixing. Both types of prechambers generally include a lining of low-conductivity material (ceramic) toincrease the surface temperature to promote further fuel evaporation. Prechambers can be used in small-displacement diesel engines to achieve operating speeds up to 5000 rpm. Disadvantages of the IDI systeminclude poor cold-start characteristics due to high heat-transfer rates from the compressed air to thechamber wall that result from the high velocities and turbulence levels in the chamber. Glow plugs areoften installed in each prechamber to heat the air to improve cold starting. Higher compression ratiosare also used for IDI engines to further improve cold starting. The compression ratios, typically 18 to24, are higher than the optimum for fuel efÞciency (due to decreased mechanical efÞciency), and IDI
FIGURE 8.3.5 Examples of DI diesel combustion chamber design.
© 1999 by CRC Press LLC
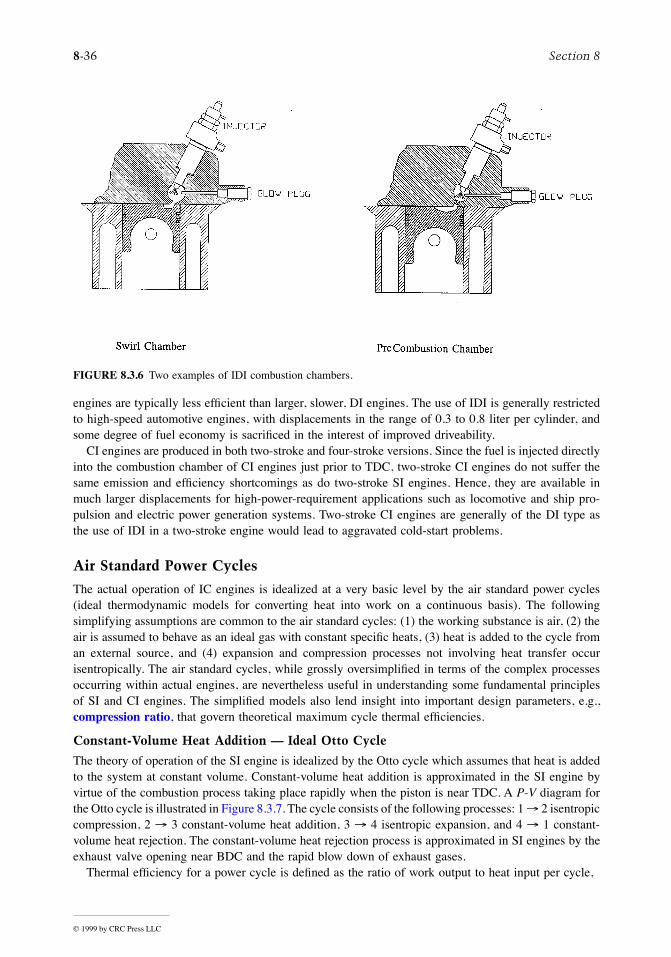
8-36 Section 8
engines are typically less efÞcient than larger, slower, DI engines. The use of IDI is generally restrictedto high-speed automotive engines, with displacements in the range of 0.3 to 0.8 liter per cylinder, andsome degree of fuel economy is sacriÞced in the interest of improved driveability.
CI engines are produced in both two-stroke and four-stroke versions. Since the fuel is injected directlyinto the combustion chamber of CI engines just prior to TDC, two-stroke CI engines do not suffer thesame emission and efÞciency shortcomings as do two-stroke SI engines. Hence, they are available inmuch larger displacements for high-power-requirement applications such as locomotive and ship pro-pulsion and electric power generation systems. Two-stroke CI engines are generally of the DI type asthe use of IDI in a two-stroke engine would lead to aggravated cold-start problems.
Air Standard Power Cycles
The actual operation of IC engines is idealized at a very basic level by the air standard power cycles(ideal thermodynamic models for converting heat into work on a continuous basis). The followingsimplifying assumptions are common to the air standard cycles: (1) the working substance is air, (2) theair is assumed to behave as an ideal gas with constant speciÞc heats, (3) heat is added to the cycle froman external source, and (4) expansion and compression processes not involving heat transfer occurisentropically. The air standard cycles, while grossly oversimpliÞed in terms of the complex processesoccurring within actual engines, are nevertheless useful in understanding some fundamental principlesof SI and CI engines. The simpliÞed models also lend insight into important design parameters, e.g.,compression ratio, that govern theoretical maximum cycle thermal efÞciencies.
Constant-Volume Heat Addition — Ideal Otto Cycle
The theory of operation of the SI engine is idealized by the Otto cycle which assumes that heat is addedto the system at constant volume. Constant-volume heat addition is approximated in the SI engine byvirtue of the combustion process taking place rapidly when the piston is near TDC. A P-V diagram forthe Otto cycle is illustrated in Figure 8.3.7. The cycle consists of the following processes: 1 ® 2 isentropiccompression, 2 ® 3 constant-volume heat addition, 3 ® 4 isentropic expansion, and 4 ® 1 constant-volume heat rejection. The constant-volume heat rejection process is approximated in SI engines by theexhaust valve opening near BDC and the rapid blow down of exhaust gases.
Thermal efÞciency for a power cycle is deÞned as the ratio of work output to heat input per cycle,
FIGURE 8.3.6 Two examples of IDI combustion chambers.
© 1999 by CRC Press LLC

Energy Conversion 8-37
(8.3.1)
For the Otto cycle, the basic efÞciency expression can be manipulated into the form
(8.3.2)
where g is the ratio of speciÞc heats (g = Cp/Cv) and r is the compression ratio, or ratio of the maximumto minimum cycle volumes (r = V1/V2). In actual IC engines, the minimum cycle volume is referred toas the clearance volume and the maximum cycle volume is the cylinder volume. The ideal Otto cycleefÞciency for air, with g = 1.4, is shown plotted in Figure 8.3.8. The theoretical efÞciency of the constantvolume heat addition cycle increases rapidly with compression ratio, up to about r = 8. Further increasesin compression ratio bring moderate gains in efÞciency. Compression ratios in practical SI engines arelimited because of autoignition (knock) and high NOx emission problems that accompany high com-pression ratios. Production SI automotive engines typically have compression ratios in the range 8 to10, whereas high-performance normally aspirated racing engines may have compression ratios as highas 14, but they require the use of special fuels to avoid autoignition.
Constant-Pressure Heat Addition — Ideal Diesel Cycle
The air standard diesel cycle is the idealized cycle underlying the operation of CI or diesel engines. Thediesel cycle, illustrated by the P-V diagram in Figure 8.3.9, consists of the following processes: 1 ® 2isentropic compression from the maximum to the minimum cycle volume, 2 ® 3 constant-pressure heataddition during an accompanying increase in volume to V3, 3 ® 4 isentropic expansion to the maximumcycle volume, and 4 ® 1 constant-volume heat rejection.
Actual diesel engines approximate constant-volume heat addition by injecting fuel for a Þnite durationwhich continues to burn and release heat at a rate that tends to maintain the pressure in the cylinderover a period of time during the expansion stroke. The efÞciency of the ideal diesel cycle is given by
FIGURE 8.3.7 Schematic pressure-volume diagram for the ideal Otto cycle.
h = out
in
W
Q
h g= 1 - -
11r
© 1999 by CRC Press LLC

8-38 Section 8
(8.3.3)
The efÞciency of the ideal diesel cycle depends not only on the compression ratio, r, but also on thecut-off ratio, rc = V3/V2, the ratio of the volume when heat addition ends to the volume when it begins.Equation (8.3.3) is shown plotted in Figure 8.3.10 for several values of rc and for g = 1.4. An rc valueof 1 is equivalent to constant-volume heat addition, i.e., the Otto cycle. The efÞciency of the ideal Dieselcycle is less than the efÞciency of the ideal Otto cycle for any given compression ratio and any valueof the cut-off ratio greater than 1. The fact that CI engines, by design, operate at much higher compressionratios than SI engines (generally between 12 and 24) accounts for their typically higher operatingefÞciencies relative to SI engines.
Actual Cycles
IC engines do not operate on closed thermodynamic cycles, such as the air standard power cycles, butrather on open mechanical cycles, and heat addition occurs neither at constant volume or constant
FIGURE 8.3.8 EfÞciency of the ideal Otto cycle.
FIGURE 8.3.9 Schematic pressure-volume diagram of ideal diesel cycle.
hgg
g
= 1 --
-( )é
ëêê
ù
ûúú
-
1 1
11r
r
rc
c
© 1999 by CRC Press LLC

Energy Conversion 8-39
pressure. Figure 8.3.11 is a schematic representation of an indicator diagram (pressure-volume history)of a four-stroke IC engine; it could be either SI or CI. The pressure changes during the intake and exhauststrokes are exaggerated in the diagram. The indicated work performed per cycle can be calculated bytaking the integral of PdV for the complete cycle. The indicated mean effective pressure, imep, isdeÞned as the ratio of the net indicated work output to the displacement volume:
(8.3.4)
The shaded area in Figure 8.3.11 thus represents the net indicated work output per cycle. Duringintake and exhaust, the negative work performed represents pumping losses and acts to decrease the network output of the engine. The magnitude of the pumping losses depends on the ßow characteristics ofthe intake and exhaust systems including the valves, ports, manifolds, piping, mufßers, etc. The more
FIGURE 8.3.10 EfÞciency of the ideal diesel cycle.
FIGURE 8.3.11 Schematic indicator diagram.
imepindicated work output per cycle
displacement volume=
© 1999 by CRC Press LLC

8-40 Section 8
restrictive these passages, the higher will be the pumping losses. SI engines control power output bythrottling the intake air. Thus, under partial-load conditions, the pressure drop resulting from the airthrottling represents a signiÞcant increase in pumping loss with a corresponding decrease in operatingefÞciency. SI engines are therefore less efÞcient at partial-load operation than at full load. The powerlevel of CI engines, on the other hand, is controlled by varying the amount of fuel injected, as opposedto throttling the intake air, making them signiÞcantly more efÞcient than SI engines under partial-loadconditions.
Brake work (or power) is the actual work (or power) produced at the output shaft of an engine, asmeasured by a dynamometer. The brake work will be less than the indicated work due to friction lossesand any parasitic power requirements for oil pumps, water pumps, etc. The brake mean effectivepressure, bmep, is deÞned as
(8.3.5)
The mechanical efÞciency can then be deÞned as
(8.3.6)
Engine thermal efÞciency can be determined from the ratio of power output to rate of fuel energyinput, or
(8.3.7)
where mf is the rate of fuel consumption per unit time and Qc is the heat of combustion per unit massof fuel. The thermal efÞciency in Equation (8.3.7) could be either indicated or brake depending on thenature of the power used in the calculation. Uncertainty associated with variations of energy content offuels may present a practical difÞculty with determining engine thermal efÞciency. In lieu of thermalefÞciency, brake speciÞc fuel consumption (bsfc), is often used as an efÞciency index.
(8.3.8)
The efÞciency of engines operating on the same fuel may be directly compared by their bsfc.Volumetric efÞciency, hv, is an important performance parameter for four-stroke engines deÞned as
(8.3.9)
where mactual is the mass of intake mixture per cycle at inlet conditions (pressure and temperature nearthe inlet port) and md is the mass of mixture contained in the displacement volume at inlet conditions.For SI engines the mixture mass includes both air and fuel; for CI engines only air is present duringintake. With the intake mixture density determined at inlet conditions, hv accounts for ßow lossesassociated with the intake ports, valves, and cylinder. Sometimes, for convenience, the mixture densityis taken at ambient conditions. In this case, hv is called the overall volumetric efÞciency and includesthe ßow performance of the entire intake system. Since a certain minimum amount of air is required forcomplete combustion of a given amount of fuel, it follows that the maximum power output of an engine
bmepbrake work output per cycle
displacement volume=
hm =brake work power
indicated work powerbmepimep
( )( )
=
htf cm Q
=Power
bsfc =fuel consumption rate kg hr
brake power kW
( )( )
hvd
m
m= actual
© 1999 by CRC Press LLC

Energy Conversion 8-41
is directly proportional to its air-ßow capacity. Thus, while not affecting in any way the thermal efÞciencyof the engine, the volumetric efÞciency directly affects the maximum power output for a given displace-ment, and thus can affect the efÞciency of the overall system in which the engine is installed becauseof the effect on system size and weight. Volumetric efÞciency is affected primarily by intake and exhaustvalve geometry, valve lift and timing, intake port and manifold design, mixing of intake charge withresidual exhaust gases, engine speed, ratio of inlet pressure to exhaust back pressure, and heat transferto the intake mixture from warmer ßow passages and combustion chamber surfaces. For further infor-mation on the fundamentals of IC engine design and operation see Taylor (1985), Ferguson (1986),Heywood (1988), and Stone (1993).
Combustion in IC Engines
Combustion in Spark Ignition Engines
Background. In SI engines, combustion of the fuel-air mixture is initiated by a spark generated betweenthe electrodes of a spark plug. The intake and compression strokes are designed to prepare the mixturefor combustion by completely vaporizing the fuel and heating the mixture to just below its autoignitiontemperature. This is one reason, in addition to controlling emissions, for the current practice of limitingthe maximum compression ratio of SI engines to about 10:1. Near the end of compression, the mixtureis well conditioned for combustion and the spark is discharged to initiate the combustion process. Forbest fuel economy, the combustion process must be completed as close as possible to TDC. This requiresthat the spark timing be controlled for varying operating speed and load conditions of the engine. Fuelmetering and control, according to the engine load requirements, and with minimum variation fromcylinder to cylinder and cycle to cycle, is essential for good fuel economy, power output, and emissioncontrol of the engine.
Both carburetors and fuel injection systems are used for fuel-metering control. Because of the superiorcontrol capabilities of fuel injection systems, they are nearly universally used today in productionautomotive applications. Carburetors are used for applications with less-stringent emission requirements,e.g., small engines for lawn and garden equipment. Figure 8.3.12 illustrates the effect of fuel-air ratioon the indicated performance of an SI engine. The equivalence ratio (g) is deÞned by the ratio Fuel-Airactual/Fuel-Airstoichiometric. Rich mixtures have fuel-air ratios greater than stoichiometric (g > 1) and leanmixtures have fuel-air ratios less than stoichiometric (g < 1). Optimum fuel economy, coinciding withmaximum thermal efÞciency, is obtained at part throttle with a lean mixture as a result of the fact thatthe heat release from lean mixtures suffers minimal losses from dissociation and variation of speciÞcheat effects when compared with stoichiometric and rich fuel-air ratios. Maximum power is obtained atfull throttle with a slightly rich mixture, an indication of the full utilization of the air inside the cylinders.Idling, with a nearly closed throttle, requires a rich mixture because of the high percentage of exhaustgas residuals that remains in the cylinders. The fuel-air mixture requirement under transient operation,such as acceleration, requires a rich mixture to compensate for the reduced evaporation caused by thesudden opening of the throttle. Cold starting also requires a rich mixture to ensure the vaporization ofsufÞcient amounts of the highly volatile components in the fuel to achieve proper ignition.
Normal Combustion Process. The combustion processes in SI engines can be divided into two categories,normal and abnormal. The normal combustion process occurs in three stages: initiation of combustion,ßame propagation, and termination of combustion. Combustion normally starts across the spark pluggap when the spark is discharged. The fuel molecules in and around the spark discharge zone are ignitedand a small amount of energy is released. The important criterion for the initial reaction to be self-sustaining is that the rate of heat release from the initial combustion be larger than the rate of heattransfer to the surroundings. The factors that play an important role in making the initial reaction self-sustaining, and thereby establishing a ßame kernel, are the ignition energy level, the spark plug gap, thefuel-air ratio, the initial turbulence, and the condition of the spark plug electrodes.
© 1999 by CRC Press LLC

8-42 Section 8
After a ßame kernel is established, a thin spherical ßame front advances from the spark plug regionprogressively into the unburned mixture zone. Flame propagation is supported and accelerated by twoprocesses. First, the combined effect of the heat transfer from the high-temperature ßame region andthe bombardment by the active radicals from the ßame front into the adjacent unburned zone raises thetemperature and accelerates the rate of reactivity of the unburned mixture region directly adjacent to theßame front. This helps condition and prepare this zone for combustion. Second, the increase in thetemperature and pressure of the burned gases behind the ßame front will cause it to expand andprogressively create thermal compression of the remaining unburned mixture ahead of the ßame front.It is expected that the ßame speed will be low at the start of combustion, reach a maximum at abouthalf the ßame travel, and decrease near the end of combustion. Overall, the ßame speed is stronglyinßuenced by the degree of turbulence in the combustion chamber, the shape of the combustion chamber,the mixture strength, the type of fuel, and the engine speed.
When the ßame front approaches the walls of the combustion chamber, the high rate of heat transferto the walls slows down the ßame propagation and Þnally the combustion process terminates close tothe walls because of surface quenching. This leaves a thin layer of unburned fuel close to the combustionchamber walls which shows up in the exhaust as unburned hydrocarbons.
Abnormal Combustion. Abnormal combustion may occur in SI engines associated with two combustionphenomena: knock and surface ignition. Knock occurs near the end of the combustion process if theend portion of the unburned mixture, which is being progressively subjected to thermal compression,autoignites prematurely before the ßame front reaches it. As a result of the sudden energy release, aviolent pressure wave propagates back and forth across the combustion chamber, causing the walls orother parts of the engine to vibrate, producing a sharp metallic noise called knock. If knock persists fora period of time, the high rate of heat transfer caused by the traveling high pressure and temperaturewave may overheat the spark plug electrode or ignite carbon deposits that may be present in the
FIGURE 8.3.12 Effect of fuel-air mixture on indicated performance of an SI engine.
© 1999 by CRC Press LLC
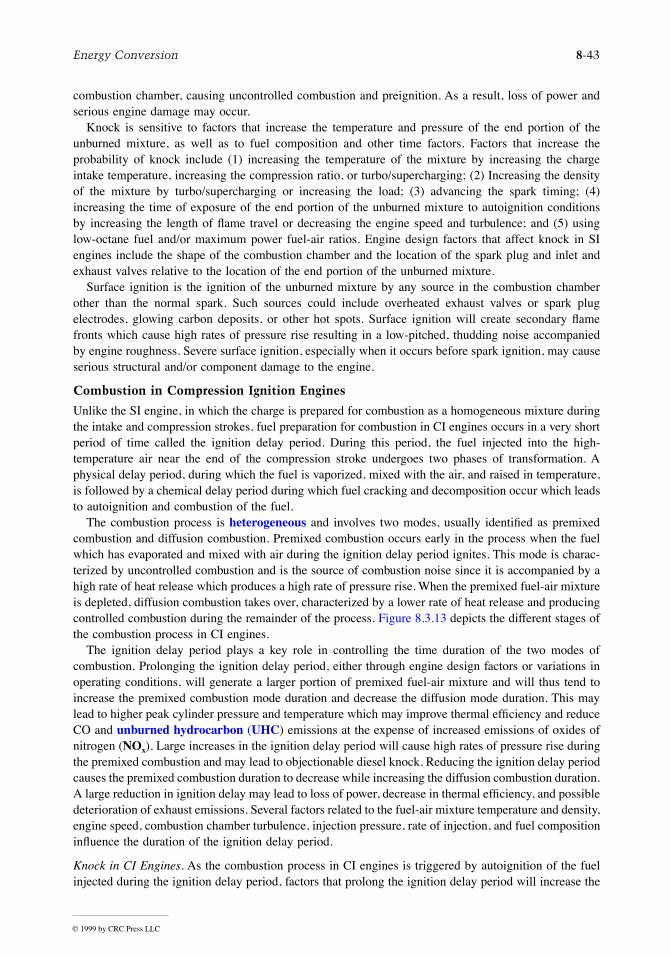
Energy Conversion 8-43
combustion chamber, causing uncontrolled combustion and preignition. As a result, loss of power andserious engine damage may occur.
Knock is sensitive to factors that increase the temperature and pressure of the end portion of theunburned mixture, as well as to fuel composition and other time factors. Factors that increase theprobability of knock include (1) increasing the temperature of the mixture by increasing the chargeintake temperature, increasing the compression ratio, or turbo/supercharging; (2) Increasing the densityof the mixture by turbo/supercharging or increasing the load; (3) advancing the spark timing; (4)increasing the time of exposure of the end portion of the unburned mixture to autoignition conditionsby increasing the length of ßame travel or decreasing the engine speed and turbulence; and (5) usinglow-octane fuel and/or maximum power fuel-air ratios. Engine design factors that affect knock in SIengines include the shape of the combustion chamber and the location of the spark plug and inlet andexhaust valves relative to the location of the end portion of the unburned mixture.
Surface ignition is the ignition of the unburned mixture by any source in the combustion chamberother than the normal spark. Such sources could include overheated exhaust valves or spark plugelectrodes, glowing carbon deposits, or other hot spots. Surface ignition will create secondary ßamefronts which cause high rates of pressure rise resulting in a low-pitched, thudding noise accompaniedby engine roughness. Severe surface ignition, especially when it occurs before spark ignition, may causeserious structural and/or component damage to the engine.
Combustion in Compression Ignition Engines
Unlike the SI engine, in which the charge is prepared for combustion as a homogeneous mixture duringthe intake and compression strokes, fuel preparation for combustion in CI engines occurs in a very shortperiod of time called the ignition delay period. During this period, the fuel injected into the high-temperature air near the end of the compression stroke undergoes two phases of transformation. Aphysical delay period, during which the fuel is vaporized, mixed with the air, and raised in temperature,is followed by a chemical delay period during which fuel cracking and decomposition occur which leadsto autoignition and combustion of the fuel.
The combustion process is heterogeneous and involves two modes, usually identiÞed as premixedcombustion and diffusion combustion. Premixed combustion occurs early in the process when the fuelwhich has evaporated and mixed with air during the ignition delay period ignites. This mode is charac-terized by uncontrolled combustion and is the source of combustion noise since it is accompanied by ahigh rate of heat release which produces a high rate of pressure rise. When the premixed fuel-air mixtureis depleted, diffusion combustion takes over, characterized by a lower rate of heat release and producingcontrolled combustion during the remainder of the process. Figure 8.3.13 depicts the different stages ofthe combustion process in CI engines.
The ignition delay period plays a key role in controlling the time duration of the two modes ofcombustion. Prolonging the ignition delay period, either through engine design factors or variations inoperating conditions, will generate a larger portion of premixed fuel-air mixture and will thus tend toincrease the premixed combustion mode duration and decrease the diffusion mode duration. This maylead to higher peak cylinder pressure and temperature which may improve thermal efÞciency and reduceCO and unburned hydrocarbon (UHC) emissions at the expense of increased emissions of oxides ofnitrogen (NOx). Large increases in the ignition delay period will cause high rates of pressure rise duringthe premixed combustion and may lead to objectionable diesel knock. Reducing the ignition delay periodcauses the premixed combustion duration to decrease while increasing the diffusion combustion duration.A large reduction in ignition delay may lead to loss of power, decrease in thermal efÞciency, and possibledeterioration of exhaust emissions. Several factors related to the fuel-air mixture temperature and density,engine speed, combustion chamber turbulence, injection pressure, rate of injection, and fuel compositioninßuence the duration of the ignition delay period.
Knock in CI Engines. As the combustion process in CI engines is triggered by autoignition of the fuelinjected during the ignition delay period, factors that prolong the ignition delay period will increase the
© 1999 by CRC Press LLC

8-44 Section 8
premixed combustion duration causing very high rates of energy release and thus high rates of pressurerise. As a result, diesel knock may occur. The phenomenon is similar to knock in SI engines except thatit occurs at the beginning of the combustion process rather than near the end, as observed in SIcombustion. Factors that reduce the ignition delay period will reduce the possibility of knock in dieselengines. Among them are increasing the compression ratio, supercharging, increasing combustion cham-ber turbulence, increasing injection pressure, and using high-cetane-number (CN) fuel. For a moredetailed discussion of the combustion process in IC engines, see Henein (1972), Lenz (1992), and Keating(1993).
Exhaust Emissions
Harmful Constituents
The products of combustion from IC engines contain several constituents that are considered hazardousto human health, including CO, UHCs NOx, and particulates (from diesel engines). These emissionproducts are discussed brießy below followed by a description of the principal schemes for theirreduction.
Carbon Monoxide. CO is a colorless, odorless, and tasteless gas that is highly toxic to humans. Breathingair with a small volumetric concentration (0.3%) of CO in an enclosed space can cause death in a shortperiod of time. CO results from the incomplete combustion of hydrocarbon fuels. One of the mainsources of CO production in SI engines is the incomplete combustion of the rich fuel mixture that ispresent during idling and maximum power steady state conditions and during such transient conditionsas cold starting, warm-up, and acceleration. Fuel maldistribution, poor condition of the ignition system,very lean combustion, and slow CO reaction kinetics also contribute to increased CO production in SIengines. CO production is not as signiÞcant in CI engines since these engines are always operated withsigniÞcant excess air.
Unburned Hydrocarbons. When UHCs combine with NOx (see below) in the presence of sunlight, ozoneand photochemical oxidants form that can adversely affect human health. Certain UHCs are also
FIGURE 8.3.13 Combustion process in a CI engine.
© 1999 by CRC Press LLC

Energy Conversion 8-45
considered to be carcinogenic. The principal cause of UHC in SI engines is incomplete combustion ofthe fuel-air charge, resulting in part from ßame quenching of the combustion process at the combustionchamber walls, and engine misÞring. Additional sources in four-stroke engines may include fuel mixturetrapped in crevices of the top ring land of the piston and outgassed fuel during the expansion (power)stroke that was absorbed into the lubricating oil Þlm during intake. In two-stroke SI engines, thescavenging process often results in a portion of the fresh mixture exiting the exhaust port before it closes,resulting in large UHC emissions.
The presence of UHC in CI engines is related to the heterogeneous nature of the fuel-air mixture.Under certain conditions, fuel-air mixtures that lie outside the ßammability limits at both the lean andrich extremes can exist in portions of the combustion chamber and escape combustion, thus contributingsigniÞcantly to UHC in the exhaust. Fuel injected near the end of the combustion process, and fuelremaining in the nozzle sac volume at the end of injection, both contribute to UHC emission in CIengines. Engine variables that affect UHC emissions include the fuel-air ratio, intake air temperature,and cooling water temperature.
Oxides of Nitrogen. Nitric oxide (NO) is formed from the combination of nitrogen and oxygen presentin the intake air under the high-temperature conditions that result from the combustion process. As thegas temperature drops during the expansion stroke, the reaction is frozen, and levels of NO persist inthe exhaust products far in excess of the equilibrium level at the exhaust temperature. In the presenceof additional oxygen in the air, some NO transforms to nitrogen dioxide (NO2), a toxic gas. The NOand NO2 combined are referred to as oxides of nitrogen or NOx. The production of NOx is in generalaggravated by conditions that increase the peak combustion temperature. In SI engines the most importantvariables that affect NOx production are the air/fuel ratio, spark timing, intake air temperature, andamount of residual combustion products remaining in the cylinder after exhaust. In CI engines, ignitiondelay, which affects the degree of premixed combustion, plays a key role in NOx formation. A largerpremixed combustion fraction will produce higher combustion temperatures and higher levels of NOx.
Particulates. Particulates are a troublesome constituent in the exhaust from CI engines. Particulates aredeÞned by the US Environmental Protection Agency (EPA) as any exhaust substance (other than water)that can be trapped on a Þlter at a temperature of 325 K or below. Particulates trapped on a Þlter maybe classiÞed as soot plus an organic fraction of hydrocarbons and their partial oxidation products. Sootconsists of agglomerates of solid uncombusted carbon particles. Particulates are of concern because theirsmall size permits inhalation and entrapment in the lung walls, making them potential lung carcinogens.
Soot is formed in CI engines under conditions of heavy load when the gas temperature is high andthe concentration of oxygen is low. Smoke production is affected by such parameters as fuel CN, rateof fuel injection, inlet air temperature, and the presence of secondary injection.
Control of Emissions from IC Engines
Figure 8.3.14 depicts the relative concentrations of CO, NOx, and UHC in the exhaust products of anSI engine as a function of the fuel-air mixture. Lean mixture combustion, which promotes good thermalefÞciency, also results in low UHC and CO production but causes high levels of NOx emission. Increasingthe fuel/air ratio to reduce NOx results in increased CO and UHC emission. Approaches to reduce totalemissions fall under two categories; the Þrst concentrates on engine design and fuel modiÞcations andthe second involves treatment of exhaust gases after leaving the engine. In SI engines, the Þrst approachfocuses on addressing engine variables and design modiÞcations which improve in-cylinder mixing andcombustion in an effort to reduce CO and UHC emissions. To reduce NOx, attention is focused on factorsthat reduce peak combustion temperature and reduce the oxygen available in the ßame front. Designand operating parameters that have been implemented or modiÞed for decreased emissions includecompression ratio reduction, increased coolant temperature, modiÞcation of the combustion chambershape to minimize surface-to-volume ratio and increase turbulence, improvement of intake manifolddesign for better charge distribution, use of fuel injection instead of carburetors for better mixture control,
© 1999 by CRC Press LLC
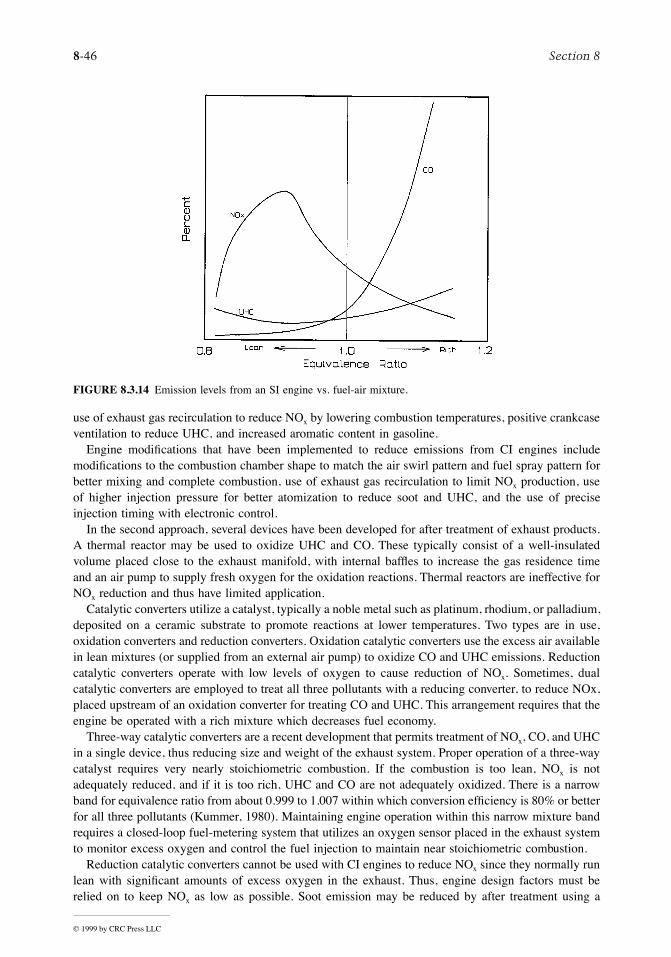
8-46 Section 8
use of exhaust gas recirculation to reduce NOx by lowering combustion temperatures, positive crankcaseventilation to reduce UHC, and increased aromatic content in gasoline.
Engine modiÞcations that have been implemented to reduce emissions from CI engines includemodiÞcations to the combustion chamber shape to match the air swirl pattern and fuel spray pattern forbetter mixing and complete combustion, use of exhaust gas recirculation to limit NOx production, useof higher injection pressure for better atomization to reduce soot and UHC, and the use of preciseinjection timing with electronic control.
In the second approach, several devices have been developed for after treatment of exhaust products.A thermal reactor may be used to oxidize UHC and CO. These typically consist of a well-insulatedvolume placed close to the exhaust manifold, with internal bafßes to increase the gas residence timeand an air pump to supply fresh oxygen for the oxidation reactions. Thermal reactors are ineffective forNOx reduction and thus have limited application.
Catalytic converters utilize a catalyst, typically a noble metal such as platinum, rhodium, or palladium,deposited on a ceramic substrate to promote reactions at lower temperatures. Two types are in use,oxidation converters and reduction converters. Oxidation catalytic converters use the excess air availablein lean mixtures (or supplied from an external air pump) to oxidize CO and UHC emissions. Reductioncatalytic converters operate with low levels of oxygen to cause reduction of NOx. Sometimes, dualcatalytic converters are employed to treat all three pollutants with a reducing converter, to reduce NOx,placed upstream of an oxidation converter for treating CO and UHC. This arrangement requires that theengine be operated with a rich mixture which decreases fuel economy.
Three-way catalytic converters are a recent development that permits treatment of NOx, CO, and UHCin a single device, thus reducing size and weight of the exhaust system. Proper operation of a three-waycatalyst requires very nearly stoichiometric combustion. If the combustion is too lean, NOx is notadequately reduced, and if it is too rich, UHC and CO are not adequately oxidized. There is a narrowband for equivalence ratio from about 0.999 to 1.007 within which conversion efÞciency is 80% or betterfor all three pollutants (Kummer, 1980). Maintaining engine operation within this narrow mixture bandrequires a closed-loop fuel-metering system that utilizes an oxygen sensor placed in the exhaust systemto monitor excess oxygen and control the fuel injection to maintain near stoichiometric combustion.
Reduction catalytic converters cannot be used with CI engines to reduce NOx since they normally runlean with signiÞcant amounts of excess oxygen in the exhaust. Thus, engine design factors must berelied on to keep NOx as low as possible. Soot emission may be reduced by after treatment using a
FIGURE 8.3.14 Emission levels from an SI engine vs. fuel-air mixture.
© 1999 by CRC Press LLC

Energy Conversion 8-47
device called a trap oxidizer. A trap oxidizer Þlters particulate matter from the exhaust stream andoxidizes it, usually with the aid of a catalyst for reducing the oxidation temperature. They have beenused on small, high-speed automotive diesel engines, but their application to larger, slower-speed enginesis limited because of the higher level of particulate production and the lower exhaust temperature. Foradditional information on emissions see Henein (1972), Obert (1973), and SAE Surface Vehicle EmissionsStandards Manual (1993).
Fuels for SI and CI Engines
Background
The primary distinguishing factor between SI and CI engines is the fundamental difference in thecombustion process. SI engines rely on homogeneous, premixed combustion, while CI engines aredesigned for heterogeneous combustion with a premixed combustion period followed by a diffusioncombustion period. The differences in the combustion process call for quite different qualities in thefuels to achieve optimum performance.
By far the most common fuel for SI engines is gasoline, although other fuels can be used in specialcircumstances including alcohol, natural gas, and propane. Even such low-grade fuels as wood gas andcoal gas have been used to fuel SI engines during wartime when conventional fuels were in short supply.Diesel fuel is the predominant fuel for CI engines, but they too can be designed to operate on a varietyof other fuels, such as natural gas, bio-gas, and even coal slurries. This discussion is conÞned to gasolineand diesel fuel, both of which are distilled from crude oil.
Crude oil is composed of several thousand different hydrocarbon compounds, which upon heatingare vaporized at different temperatures. In the distillation process, different ÒfractionsÓ of the originalcrude are separated according to the temperatures at which they vaporize. The more volatile fraction,naphtha, is followed in order of increasing temperature of vaporization by fractions called distillate, gasoil, reduced crude, and residual oil. These fractions may be further subdivided into light, middle, andheavy classiÞcations. Light virgin naphtha can be used directly as gasoline, although it has relativelypoor antiknock quality. The heavier fractions can be chemically processed through coking and catalyticcracking to produce additional gasoline. Diesel fuel is derived from the light to heavy virgin gas oilfraction and from further chemical processing of reduced crude.
Gasoline
Gasoline fuels are mixtures of hydrocarbon compounds with boiling points in the range of 32 to 215°C.The two most important properties of gasoline for SI engine performance are volatility and octane rating.Adequate volatility is required to ensure complete vaporization, as required for homogeneous combus-tion, and to avoid cold-start problems. If the volatility is too high, however, vapor locking in the fueldelivery system may become a problem. Volatility may be speciÞed by the distillation curve (thedistillation temperatures at which various percentages of the original sample have evaporated). Higher-volatility fuels will be characterized by lower temperatures for given Þxed percentages of evaporatedsample, or conversely, by higher percentages evaporated at or below a given temperature. Producersgenerally vary the volatility of gasoline to suit the season, increasing the volatility in winter to improvecold-start characteristics and decreasing it in summer to reduce vapor locking.
The octane rating of a fuel is a measure of its resistance to autoignition or knocking; higher-octanefuels are less prone to autoignition. The octane rating system assigns the value of 100 to iso-octane(C8H18, a fuel that is highly resistant to knock) and the value 0 to n-heptane (C7H16, a fuel that is proneto knock). Two standardized methods are employed to determine the octane rating of fuel test samples,the research method and the motor method; see ASTM Standards Part 47 Ñ Test Methods for RatingMotor, Diesel and Aviation Fuels (ASTM, 1995). Both methods involve testing the fuel in a specialvariable-compression-ratio engine (cooperative fuels research or CFR engine). The test engine is operatedon the fuel sample and the compression ratio is gradually increased to obtain a standard knock intensityreading from a knock meter. The octane rating is obtained from the volumetric percentage of iso-octane
© 1999 by CRC Press LLC

8-48 Section 8
in a blend of iso-octane and n-heptane that produces the same knock intensity at the same compressionratio. The principal differences between the research method and the motor method are the higheroperating speed, higher mixture temperature, and greater spark advance employed in the motor method.Ratings obtained by the research method are referred to as the research octane number (RON), whilethose obtained with the motor method are called the motor octane number (MON). MON ratings arelower than RON ratings because of the more stringent conditions, i.e., higher thermal loading of thefuel. The octane rating commonly advertised on gasoline pumps is the antiknock index, (R + M)/2,which is the average of the values obtained by the two methods. The typical range of antiknock indexfor automotive gasolines currently available at the pump is 87 to 93. In general, higher compression SIengines require higher-octane fuels to avoid autoignition and to realize full engine performance potentialfrom engines equipped with electronic control systems incorporating a knock sensor.
Straight-run gasoline (naphtha) has a poor octane rating on the order of 40 to 50 RON. Higher-octanefuels are created at the reÞnery by blending with higher-octane components produced through alkylationwherein light oleÞn gases are reacted with isobutane in the presence of a catalyst. Iso-octane, for example,is formed by reacting isobutane with butene. Aromatics with double carbon bonds shared between morethan one ring, such as naphthalene and anthracene, serve to increase octane rating because the moleculesare particularly difÞcult to break.
Additives are also used to increase octane ratings. In the past, a common octane booster added toautomotive fuels was lead alkyls, either tetraethyl or tetramethyl lead. For environmental reasons, leadhas been removed from automotive fuels in most countries. It is, however, still used in aviation fuel.Low-lead fuel has a concentration of about 0.5 g/L which boosts octane rating by about Þve points. Theuse of leaded fuel in an engine equipped with a catalytic converter to reduce exhaust emissions willrapidly deactivate the catalyst (typically a noble metal such as platinum or rhodium), quickly destroyingthe utility of the catalytic converter. Octane-boosting additives that are in current use include theoxygenators methanol, ethanol, and methyl tertiary butyl ether (MTBE).
RON values of special-purpose high-octane fuels for racing and aviation purposes can exceed 100and are arrived at through an extrapolation procedure based on the knock-limited indicated mean effectivepressure (klimep). The klimep is determined by increasing the engine intake pressure until knock occurs.The ratio of the klimep of the test fuel to that for iso-octane is used to extrapolate the octane ratingabove 100.
Diesel Fuels
Diesel fuels are blends of hydrocarbon compounds with boiling points in the range of 180 to 360°C.Properties that are of primary importance for CI fuels include the density, viscosity, cloud point, andignition quality (CN). Diesel fuel exhibits a much wider range of variation in properties than doesgasoline. The density of diesel fuels tends to vary according to the percentages of various fractions usedin the blend. Fractions with higher distillation temperatures tend to increase the density. Variations indensity result in variations in volumetric energy content and hence fuel economy, since fuel is sold byvolume measure. Higher-density fuel will also result in increased soot emission. Viscosity is importantto proper fuel pump lubrication. Low-viscosity fuel will tend to cause premature wear in injection pumps.Too high viscosity, on the other hand, may create ßow problems in the fuel delivery system. Cloud pointis the temperature at which a cloud of wax crystals begins to form in the fuel. This property is criticalfor cold-temperature operation since wax crystals will clog the Þltration system. ASTM does not specifymaximum cloud point temperatures, but rather recommends that cloud points be no more than 6°C abovethe tenth percentile minimum ambient temperature for the region for which the fuel is intended; seeASTM D 975 (ASTM 1995).
CN provides a measure of the autoignition quality of the fuel and is the most important property forCI engine fuels. The CN of a fuel sample is obtained through the use of a CI CFR engine in a manneranalogous to the determination of octane rating. The test method for CN determination is speciÞed instandard ASTM D 613. n-Cetane (same as hexadecane, C16H34) has good autoignition characteristicsand is assigned the cetane value of 100. The bottom of the cetane scale was originally deÞned in terms
© 1999 by CRC Press LLC

Energy Conversion 8-49
of a-methyl naphthalene (C11H10) which has poor autoignition characteristics and was assigned the value0. In 1962, for reasons of availability and storability, the poor-ignition-quality standard fuel used toestablish the low end of the cetane scale was changed to heptamethylnonane (HMN), with an assignedCN of 15. The CN of a fuel sample is determined from the relative volumetric percentages of cetaneand HMN in a mixture that exhibits the same ignition delay characteristics as the test sample using therelation
(8.3.10)
ASTM standard D 976 (ASTM, 1995) provides the following empirical correlation for calculatingthe cetane index of straight petroleum distillate fuels (no additives) as an approximation to the measuredCN:
Cetane Index = 454.74 Ð 1641.416D + 774.74D2 Ð 0.554B + 97.803 (logB)2 (8.3.11)
where D = density at 15°C (g/mL) and B = mid-boiling temperature (°C).ASTM standard D 975 (ASTM, 1995) establishes three classiÞcation grades for diesel fuels (No. 1-
D, No. 2-D, and No. 4-D) and speciÞes minimum property standards for these grades. No. 1-D is avolatile distillate fuel for engines that must operate with frequent changes in speed and load. No. 2-Dis a lower-volatility distillate fuel for industrial and heavy mobile service engines. No. 4-D is a heavyfuel oil for low- and medium-speed engines. Nos. 1-D and 2-D are principally transportation fuels, whileNo. 4-D is for stationary applications. The ASTM minimum CN for No. 1-D and No. 2-D is 40, andfor No. 4-D the minimum is 30. Typical CNs for transportation fuels lie in the range 40 to 55. Use ofa low-cetane fuel aggravates diesel knock because of the longer ignition delay period which creates ahigher fraction of premixed combustion.
Antiknock quality (octane number) and ignition quality (CN) are opposing properties of distillatefuels. The CN increases with decreasing octane rating of various fuels. Gasoline, with good antiknockquality, has a CN of approximately 10, while a diesel fuel with a CN of 50 will have an octane numberof about 20. Thus, gasoline is not a suitable fuel for CI engines because of its poor autoignition quality,and diesel fuel is inappropriate for use in SI engines as a result of its poor antiknock quality. For additionalinformation on fuels for IC engines see Owen and Coley (1995) and the SAE Fuels and LubricantsStandards Manual (1993).
Intake Pressurization — Supercharging and Turbocharging
Backround
Pressurizing the intake air (or mixture) by means of a compressor may be used to boost the speciÞcpower output of both SI and CI engines. Supercharging generally refers to the use of compressors thatare mechanically driven from the engine crankshaft, while turbocharging refers to compressors poweredby a turbine which extracts energy from the exhaust stream. Increasing the intake pressure increases thedensity and hence the mass ßow rate of the intake mixture, allowing an increase in the fueling rate,thereby producing additional power. The mere process of increasing the cylinder pressure results inincreased work output per cycle, as illustrated in the P-V diagram in Figure 8.3.15 which comparessupercharged and naturally aspirated, air standard Otto cycles having the same compression ratio. Thework done for the compressed intake cycle (Area 1,2,3,4,1 and Area 5,6,7,1,5) is greater than that forthe naturally aspirated cycle (Area 1¢,2¢,3¢,4¢,1¢) due to the boost of the intake pressure. Positive-displacement superchargers are capable of producing higher boost pressures than turbochargers, whichare nearly always centrifugal-type fans. From a practical standpoint, the maximum useful boost pressurefrom either system is limited by the onset of autoignition in SI engines, and by the permissible mechanicaland thermal stresses in CI engines.
CN = % -cetane HMNn + ( )0 15. %
© 1999 by CRC Press LLC

8-50 Section 8
Supercharging
The principal applications of supercharging of SI engines are in high-output drag-racing engines and inlarge aircraft piston engines to provide high speciÞc output at takeoff and to improve power output athigh altitudes. For diesel applications, supercharging is used mainly in marine and land-transportationapplications. It is common to use either supercharging or turbocharging to improve the scavengingprocess in two-stroke diesel engines. Figure 8.3.16 is a schematic of an engine with a mechanicallydriven supercharger. Superchargers may be belt, chain, or gear driven from the engine crankshaft.
Two types of superchargers are in use: the positive displacement type (Roots blower) and the centrif-ugal type. Roots blowers may be classiÞed as: (1) straight double lobe, (2) straight triple lobe, and (3)helix triple lobe (twisted 60%). The helix-triple-lobe-type runs quieter than the others and is generallyrecommended, especially for diesel engines operating under high torque at various speed conditions.The centrifugal-type, because of its high capacity and small weight and size, is best suited for applicationswhere power and volumetric efÞciency improvement are required at high engine speed, e.g., with aircraftengines. A centrifugal blower will also survive a backÞre more readily than a Roots blower in SIapplications. Since superchargers are directly driven from the engine output shaft, there is no inherentlag in the rate of pressure increase with engine speed, as is typically the case with turbochargers.
Turbocharging
Turbochargers utilize a centrifugal compressor that is directly connected to a turbine which extractsenergy from the exhaust gases of the engine and converts it to the shaft work necessary to drive thecompressor. Turbocharging is widely used to increase power output in automotive and truck applicationsof four-stroke SI and CI engines and to improve scavenging of two-stroke CI engines.
There are three methods of turbocharging: the constant-pressure, the pulse, and the pulse convertermethods. In the constant-pressure method, as illustrated in Figure 8.3.17, the exhaust pressure is main-
FIGURE 8.3.15 Comparison of supercharged and naturally aspirated Otto cycle.
© 1999 by CRC Press LLC

Energy Conversion 8-51
tained at a nearly constant level above atmospheric. To accomplish this, the exhaust manifold must belarge enough to damp out the pressure ßuctuations caused by the unsteady ßow characteristic of theengine exhaust process. In this method, the turbine operates efÞciently under steady-ßow conditions;however, some engine power is lost because of the increased backpressure in the exhaust manifold.
The pulse turbocharger, as illustrated in Figure 8.3.18, utilizes the kinetic energy generated by theexhaust blow-down process in each cylinder. This is accomplished by using small exhaust lines groupedtogether in a common manifold to receive the exhaust from the cylinders which are blowing downsequentially. In this method, the pressure at the turbine inlet tends to ßuctuate, which is not conduciveto good turbine efÞciency. This is offset to a large degree, however, by improved engine performanceas a result of the lower exhaust backpressure relative to the constant-pressure method. The pulse convertermethod represents a compromise between the previous two techniques. In principle, this is accomplishedby converting the kinetic energy in the blow-down process into a pressure rise at the turbine by utilizingone or more diffusers. Details of the different methods of turbocharging may be found in Watson andJanota (1982).
Recent advances in turbocharging technology have focused mainly on (1) improvement of the turbinetransient response (turbo-lag), (2) improvement of the torque-speed characteristics of the engine, and(3) increasing the power output by increasing the boost pressure and using charge cooling (intercooling).
FIGURE 8.3.16 Schematic diagram of supercharged engine.
FIGURE 8.3.17 Schematic diagram of a constant-pressure turbocharger.
© 1999 by CRC Press LLC
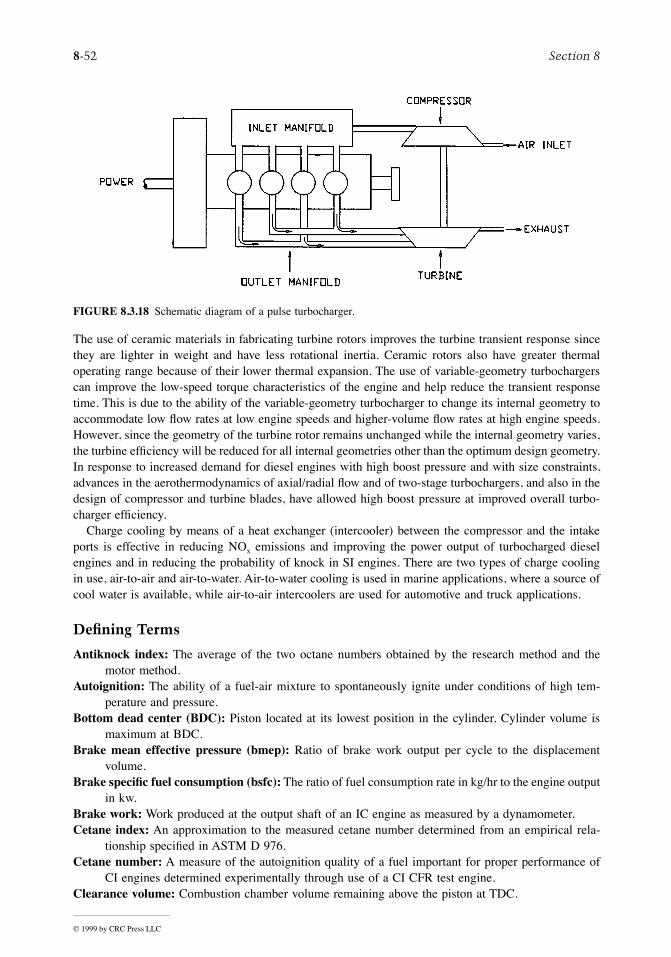
8-52 Section 8
The use of ceramic materials in fabricating turbine rotors improves the turbine transient response sincethey are lighter in weight and have less rotational inertia. Ceramic rotors also have greater thermaloperating range because of their lower thermal expansion. The use of variable-geometry turbochargerscan improve the low-speed torque characteristics of the engine and help reduce the transient responsetime. This is due to the ability of the variable-geometry turbocharger to change its internal geometry toaccommodate low ßow rates at low engine speeds and higher-volume ßow rates at high engine speeds.However, since the geometry of the turbine rotor remains unchanged while the internal geometry varies,the turbine efÞciency will be reduced for all internal geometries other than the optimum design geometry.In response to increased demand for diesel engines with high boost pressure and with size constraints,advances in the aerothermodynamics of axial/radial ßow and of two-stage turbochargers, and also in thedesign of compressor and turbine blades, have allowed high boost pressure at improved overall turbo-charger efÞciency.
Charge cooling by means of a heat exchanger (intercooler) between the compressor and the intakeports is effective in reducing NOx emissions and improving the power output of turbocharged dieselengines and in reducing the probability of knock in SI engines. There are two types of charge coolingin use, air-to-air and air-to-water. Air-to-water cooling is used in marine applications, where a source ofcool water is available, while air-to-air intercoolers are used for automotive and truck applications.
Defining Terms
Antiknock index: The average of the two octane numbers obtained by the research method and themotor method.
Autoignition: The ability of a fuel-air mixture to spontaneously ignite under conditions of high tem-perature and pressure.
Bottom dead center (BDC): Piston located at its lowest position in the cylinder. Cylinder volume ismaximum at BDC.
Brake mean effective pressure (bmep): Ratio of brake work output per cycle to the displacementvolume.
Brake speciÞc fuel consumption (bsfc): The ratio of fuel consumption rate in kg/hr to the engine outputin kw.
Brake work: Work produced at the output shaft of an IC engine as measured by a dynamometer.Cetane index: An approximation to the measured cetane number determined from an empirical rela-
tionship speciÞed in ASTM D 976.Cetane number: A measure of the autoignition quality of a fuel important for proper performance of
CI engines determined experimentally through use of a CI CFR test engine.Clearance volume: Combustion chamber volume remaining above the piston at TDC.
FIGURE 8.3.18 Schematic diagram of a pulse turbocharger.
© 1999 by CRC Press LLC

Energy Conversion 8-53
Compression ignition (CI) engine: Air alone is compressed in the cylinder and fuel is injected nearTDC. Combustion results from autoignition of the fuel-air mixture due to the high temperatureof the air.
Compression ratio: The ratio of the cylinder volume at BDC to the volume at TDC.Cut-off ratio: Ratio of cylinder volume at the end of heat addition to the volume at the start of heat
addition in the ideal diesel cycle.Cylinder volume: Volume above piston at BDC. Equals displacement volume plus clearance volume.Direct injection (DI): Method of fuel injection in low- and medium-speed CI engines wherein fuel is
injected into the main combustion chamber which is formed by a bowl in the top of the piston.Displacement volume: Difference in cylinder volume between TDC and BDC.Equivalence ratio: Actual fuel-air ratio divided by stoichiometric fuel-air ratio.Four-stroke engine: Entire cycle completed in two revolutions of the crankshaft and four strokes of the
piston.Fuel-air ratio: Ratio of mass of fuel to mass of air in the cylinder prior to combustion.Glow plug: Electric heater installed in prechamber of an IDI diesel engine to aid cold starting.Heterogeneous combustion: Refers to the mixture of liquid fuel droplets and evaporated fuel vapor
and air mixture that is present in CI engine combustion chambers prior to ignition.Ignition delay period: Period between start of injection and onset of autoignition in a CI engine.Indicated mean effective pressure (imep): Ratio of net indicated work output of an IC engine to the
displacement volume.Indicated work: Work output of an IC engine cycle determined by an area calculation from an indicator
diagram.Indicator diagram: Pressure-volume trace for an IC engine cycle. Area enclosed by diagram represents
work.Indirect injection (IDI): Method of fuel injection used in high-speed CI engines wherein the fuel is
injected into a precombustion chamber to promote fuel-air mixing and reduce ignition delay.Knock: In SI engines: the noise that accompanies autoignition of the end portion of the uncombusted
mixture prior to the arrival of the ßame front. In CI engines: The noise that accompanies auto-ignition of large premixed fractions that are generated during prolonged ignition delay periods.Knock is detrimental to either type of engine.
NOx: Harmful oxides of nitrogen (NO and NO2) appearing in the exhaust products of IC engines.Octane number: Antiknock rating for fuels important for prevention of autoignition in SI engines.Particulates: Any exhaust substance, other than water, that can be collected on a Þlter. Harmful exhaust
product from CI engines.Power density: Power produced per unit of engine mass.Premixed homogeneous combustion: Fuel and air are mixed in an appropriate combustible ratio prior
to ignition process. This is the combustion mode for SI engines and for the initial combustionphase in CI engines.
Sac volume: Volume of nozzles below the needle of a diesel fuel injector that provides a source of UHCemissions in CI engines.
Scavenging: The process of expelling exhaust gases and Þlling the cylinder with fresh charge in two-stroke engines. This is often accomplished in SI engines by pressurizing the fresh mixture in thecrankcase volume beneath the piston and in CI engines by using a supercharger or turbocharger.
Spark ignition (SI) engine: Homogeneous charge of air-fuel mixture is compressed and ignited by aspark.
Stroke: Length of piston movement from TDC to BDC, equal to twice the crankshaft throw.Supercharging: Pressurizing the intake of an IC engine using a compressor that is mechanically driven
from the crankshaft.Surface ignition: A source of autoignition in SI engines caused by surface hot spots.Swirl: Circular in-cylinder air motion designed into CI engines to promote fuel-air mixing.Swirl ratio: Ratio of rotational speed of in-cylinder air (rpm) to engine speed (rpm).
© 1999 by CRC Press LLC

8-54 Section 8
Top dead center (TDC): Piston located at its uppermost position in the cylinder. Cylinder volume(above the piston) is minimum at TDC.
Turbocharging: Pressurizing the intake of an IC engine with a compressor that is driven by a turbinewhich extracts energy from the exhaust gas stream.
Two-stroke engine: Entire cycle completed in one revolution of the crankshaft and two strokes of thepiston.
Unburned hydrocarbons (UHC): Harmful emission product from IC engines consisting of hydrocarboncompounds that remain uncombusted.
Volumetric efÞciency: Ratio of the actual mass of air intake per cycle to the displacement volume massdetermined at inlet temperature and pressure.
References
ASTM, 1995. Annual Book of ASTM Standards. American Society for Testing and Materials, Philadelphia.Blair, G.P. Ed. 1988. Advances in Two Stroke Cycle Engine Technology. Society of Automotive Engineers,
Inc., Warrendale, PA.Ferguson, C.R. 1986. Internal Combustion Engines, Applied Thermosciences. John Wiley & Sons, New
York.Henein, N.A. 1972. Emissions from Combustion Engines and Their Control. Ann Arbor Science Pub-
lishers, Ann Arbor, MI.Heywood, J.B. 1988. Internal Combustion Engine Fundamentals. McGraw-Hill, New York.Keating, E.L. 1993. Applied Combustion. Marcel Dekker, New York.Kummer, J.T. 1980. Catalysts for automobile emission control. Prog. Energy Combust. Sci. 6:177Ð199.Lenz, H.P. 1992. Mixture Formation in Spark-lgnition Engines. Springer-Verlag, New York.Norbye, J.P. 1971. The Wankel Engine. Chilton Press, Philadelphia.Obert, E.F. 1973. Internal Combustion Engines and Air Pollution, 3rd ed. Harper & Row, New York.Owen, K. and Coley, T. 1995. Automotive Fuels Reference Book, 2nd ed. Society of Automotive
Engineers, Inc., Warrendale, PA.SAE Fuels and Lubricants Standards Manual. 1993. Society of Automotive Engineers, Inc., Warrendale,
PA.SAE Surface Vehicle Emissions Standards Manual. 1993. Society of Automotive Engineers, Inc., War-
rendale, PA. Stone, R. 1993. Introduction to Internal Combustion Engines, 2nd ed. Society of Automotive Engineers,
Inc., Warrendale, PA.Taylor, C.F. 1985. The Internal Combustion Engine in Theory and Practice, 2nd ed. Vol. I and II. MIT
Press, Cambridge, MA.Watson, N. and Janota, M.S. 1982. Turbocharging the Internal Combustion Engine, John Wiley & Sons,
New York.
Further Information
The textbooks on IC engines by Ferguson (1986), Heywood (1988), Obert (1973), Stone (1993), andTaylor (1985) listed under the references all provide excellent treatments of this subject. The book byStone, in particular, is up-to-date and informative. The Handbook of Engineering (1966) by CRC Press,Boca Raton, FL, contains a chapter on IC Engines by A. Kornhauser. The Society of AutomotiveEngineers (SAE) publishes transactions, proceedings, and books related to all aspects of automotiveengineering, including IC engines. Two very comprehensive handbooks distributed by SAE are the BoschAutomotive Handbook, and the SAE Automotive Handbook. For more information contact: SAE Publi-cations, 400 Commonwealth Drive, Warrendale, PA, 15096Ð0001. (412)776-4970.
© 1999 by CRC Press LLC
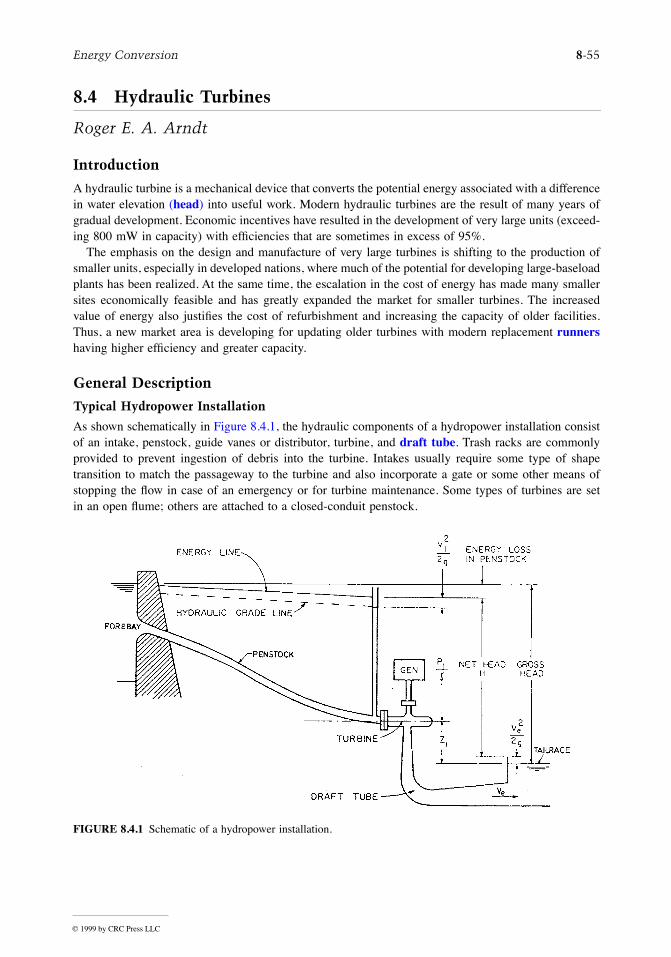
Energy Conversion 8-55
8.4 Hydraulic Turbines
Roger E. A. Arndt
Introduction
A hydraulic turbine is a mechanical device that converts the potential energy associated with a differencein water elevation (head) into useful work. Modern hydraulic turbines are the result of many years ofgradual development. Economic incentives have resulted in the development of very large units (exceed-ing 800 mW in capacity) with efÞciencies that are sometimes in excess of 95%.
The emphasis on the design and manufacture of very large turbines is shifting to the production ofsmaller units, especially in developed nations, where much of the potential for developing large-baseloadplants has been realized. At the same time, the escalation in the cost of energy has made many smallersites economically feasible and has greatly expanded the market for smaller turbines. The increasedvalue of energy also justiÞes the cost of refurbishment and increasing the capacity of older facilities.Thus, a new market area is developing for updating older turbines with modern replacement runnershaving higher efÞciency and greater capacity.
General Description
Typical Hydropower Installation
As shown schematically in Figure 8.4.1, the hydraulic components of a hydropower installation consistof an intake, penstock, guide vanes or distributor, turbine, and draft tube. Trash racks are commonlyprovided to prevent ingestion of debris into the turbine. Intakes usually require some type of shapetransition to match the passageway to the turbine and also incorporate a gate or some other means ofstopping the ßow in case of an emergency or for turbine maintenance. Some types of turbines are setin an open ßume; others are attached to a closed-conduit penstock.
FIGURE 8.4.1 Schematic of a hydropower installation.
© 1999 by CRC Press LLC

8-56 Section 8
Turbine Classification
There are two types of turbines, denoted as impulse and reaction. In an impulse turbine, the availablehead is converted to kinetic energy before entering the runner; the power available is extracted fromthe ßow at approximately atmospheric pressure. In a reaction turbine, the runner is completely submergedand both the pressure and the velocity decrease from inlet to outlet. The velocity head in the inlet to theturbine runner is typically less than 50% of the total head available.
Impulse Turbines. Modern impulse units are generally of the Pelton type and are restricted to relativelyhigh-head applications (Figure 8.4.2). One or more jets of water impinge on a wheel containing manycurved buckets. The jet stream is directed inward, sideways, and outward, thereby producing a force onthe bucket, which in turn results in a torque on the shaft. All kinetic energy leaving the runner is Òlost.ÓA draft tube is generally not used since the runner operates under approximately atmospheric pressureand the head represented by the elevation of the unit above tailwater cannot be utilized.* Since this is ahigh-head device, this loss in available head is relatively unimportant. As will be shown later, the Peltonwheel is a low-speciÞc-speed device. SpeciÞc speed can be increased by the addition of extra nozzles,the speciÞc speed increasing by the square root of the number of nozzles. SpeciÞc speed can also beincreased by a change in the manner of inßow and outßow. Special designs such as the Turgo or cross-ßow turbines are examples of relatively high speciÞc speed impulse units (Arndt, 1991).
Most Pelton wheels are mounted on a horizontal axis, although newer vertical-axis units have beendeveloped. Because of physical constraints on orderly outßow from the unit, the maximum number ofnozzles is generally limited to six or fewer. While the power of a reaction turbine is controlled by thewicket gates, the power of the Pelton wheel is controlled by varying the nozzle discharge by means ofan automatically adjusted needle, as illustrated in Figure 8.4.2. Jet deßectors, or auxiliary nozzles areprovided for emergency unloading of the wheel. Additional power can be obtained by connecting twowheels to a single generator or by using multiple nozzles. Since the needle valve can throttle the ßowwhile maintaining essentially constant jet velocity, the relative velocities at entrance and exit remainunchanged, producing nearly constant efÞciency over a wide range of power output.
* In principle, a draft tube could be used, which requires the runner to operate in air under reduced pressure.Attempts at operating an impulse turbine with a draft tube have not met with much success.
FIGURE 8.4.2 Cross section of a single wheel, single jet Pelton turbine. This is the third-highest-head pelton turbinein the world, H = 1447 m, n = 500 rpm, P = 35.2 MW, Ns ~ 0.038. (Courtesy of Vevey Charmilles EngineeringWorks, Adapted from J. Raabe, Hydro Power: The Design, Use, and Function of Hydromechanical, Hydraulic, andElectrical Equipment, VDI Verlag, Dusseldorf, Germany.)
© 1999 by CRC Press LLC
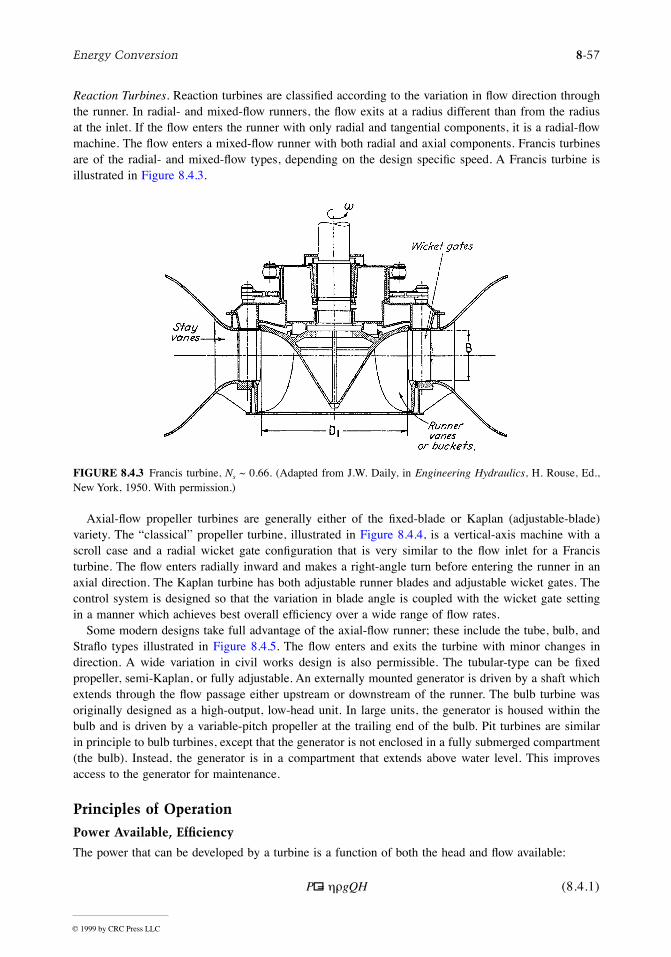
Energy Conversion 8-57
Reaction Turbines. Reaction turbines are classiÞed according to the variation in ßow direction throughthe runner. In radial- and mixed-ßow runners, the ßow exits at a radius different than from the radiusat the inlet. If the ßow enters the runner with only radial and tangential components, it is a radial-ßowmachine. The ßow enters a mixed-ßow runner with both radial and axial components. Francis turbinesare of the radial- and mixed-ßow types, depending on the design speciÞc speed. A Francis turbine isillustrated in Figure 8.4.3.
Axial-ßow propeller turbines are generally either of the Þxed-blade or Kaplan (adjustable-blade)variety. The ÒclassicalÓ propeller turbine, illustrated in Figure 8.4.4, is a vertical-axis machine with ascroll case and a radial wicket gate conÞguration that is very similar to the ßow inlet for a Francisturbine. The ßow enters radially inward and makes a right-angle turn before entering the runner in anaxial direction. The Kaplan turbine has both adjustable runner blades and adjustable wicket gates. Thecontrol system is designed so that the variation in blade angle is coupled with the wicket gate settingin a manner which achieves best overall efÞciency over a wide range of ßow rates.
Some modern designs take full advantage of the axial-ßow runner; these include the tube, bulb, andStraßo types illustrated in Figure 8.4.5. The ßow enters and exits the turbine with minor changes indirection. A wide variation in civil works design is also permissible. The tubular-type can be Þxedpropeller, semi-Kaplan, or fully adjustable. An externally mounted generator is driven by a shaft whichextends through the ßow passage either upstream or downstream of the runner. The bulb turbine wasoriginally designed as a high-output, low-head unit. In large units, the generator is housed within thebulb and is driven by a variable-pitch propeller at the trailing end of the bulb. Pit turbines are similarin principle to bulb turbines, except that the generator is not enclosed in a fully submerged compartment(the bulb). Instead, the generator is in a compartment that extends above water level. This improvesaccess to the generator for maintenance.
Principles of Operation
Power Available, Efficiency
The power that can be developed by a turbine is a function of both the head and ßow available:
(8.4.1)
FIGURE 8.4.3 Francis turbine, Ns ~ 0.66. (Adapted from J.W. Daily, in Engineering Hydraulics, H. Rouse, Ed.,New York, 1950. With permission.)
P gQH= hr
© 1999 by CRC Press LLC

8-58 Section 8
where h is the turbine efÞciency, r is the density off water (kg/m3), g is the acceleration due to gravity(m/sec2), Q is the ßow rate (m3/sec), and H is the net head in meters. Net head is deÞned as the differencebetween the total head at the inlet to the turbine and the total head at the tailrace as illustrated in Figure8.4.1. Different deÞnitions of net head are used in practice, which depend on the value of the exit velocityhead, used in the calculation. The International Electrotechnical Test Code uses the velocityhead at the draft tube exit.
The efÞciency depends on the actual head and ßow utilized by the turbine runner, ßow losses in thedraft tube, and the frictional resistance of mechanical components.
Similitude and Scaling Formulae
Under a given head, a turbine can operate at various combinations of speed and ßow depending on theinlet settings. For reaction turbines, the ßow into the turbine is controlled by the wicket gate angle, a.The ßow is typically controlled by the nozzle opening in impulse units. Turbine performance can bedescribed in terms of nondimensional variables:
FIGURE 8.4.4 Smith-Kaplan axial ßow turbine with adjustable-pitch runner blades Ns ~ 2.0. (From J.W. Daily, inEngineering Hydraulics, H. Rouse, Ed., New York, 1950. With permission.)
V ge2 2/ ,
© 1999 by CRC Press LLC

Energy Conversion 8-59
(8.4.2)
(8.4.3)
where w is the rotational speed of the turbine in radians per second and D is the diameter of the turbine.The hydraulic efÞciency of the runner alone is given by
(8.4.4)
where C1 and C2 are constants that depend on the speciÞc turbine conÞguration and a1 and a2 are theinlet and outlet angles that the absolute velocity vectors make with the tangential direction. The valueof cosa2 is approximately zero at peak efÞciency. The terms f, y, a1, and a2 are interrelated. By usingmodel test data, isocontours of efÞciency can be mapped in the f-y plane. This is typically referred toas a hill diagram as shown in Figure 8.4.6.
The speciÞc speed is deÞned as
(8.4.5)
A given speciÞc speed describes a speciÞc combination of operating conditions that ensures similar ßowpatterns and same efÞciency in geometrically similar machines regardless of size and rotational speedof the machine. It is customary to deÞne the design speciÞc speed in terms of the value at the designhead and ßow where peak efÞciency occurs. The value of speciÞc speed so deÞned permits a classiÞcationof different turbine types.
FIGURE 8.4.5 Comparison between bulb (upper) and Straßow (lower) turbines. (Courtesy of U.S. Department ofEnergy.)
yw
=2
2 2
gH
D
f =Q
gHD2 2
hf
ya ah C C= -( )1 1 2 2cos cos
NQ
gHs º
( )=
w fy2
3 4
© 1999 by CRC Press LLC
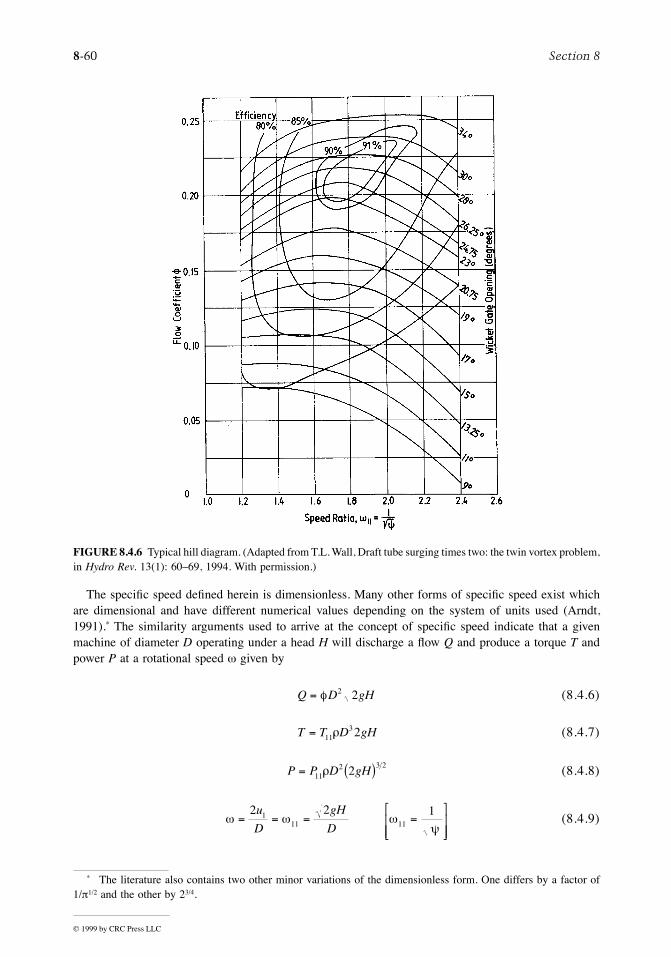
8-60 Section 8
The speciÞc speed deÞned herein is dimensionless. Many other forms of speciÞc speed exist whichare dimensional and have different numerical values depending on the system of units used (Arndt,1991).* The similarity arguments used to arrive at the concept of speciÞc speed indicate that a givenmachine of diameter D operating under a head H will discharge a ßow Q and produce a torque T andpower P at a rotational speed w given by
(8.4.6)
(8.4.7)
(8.4.8)
(8.4.9)
* The literature also contains two other minor variations of the dimensionless form. One differs by a factor of1/p1/2 and the other by 23/4.
FIGURE 8.4.6 Typical hill diagram. (Adapted from T.L. Wall, Draft tube surging times two: the twin vortex problem,in Hydro Rev. 13(1): 60Ð69, 1994. With permission.)
Q D gH= f 2 2
T T D gH= 113 2r
P P D gH= ( )112 3 2
2r
w w wy
= = = =é
ëêê
ù
ûúú
2 2 1111 11
u
D
gH
D
© 1999 by CRC Press LLC
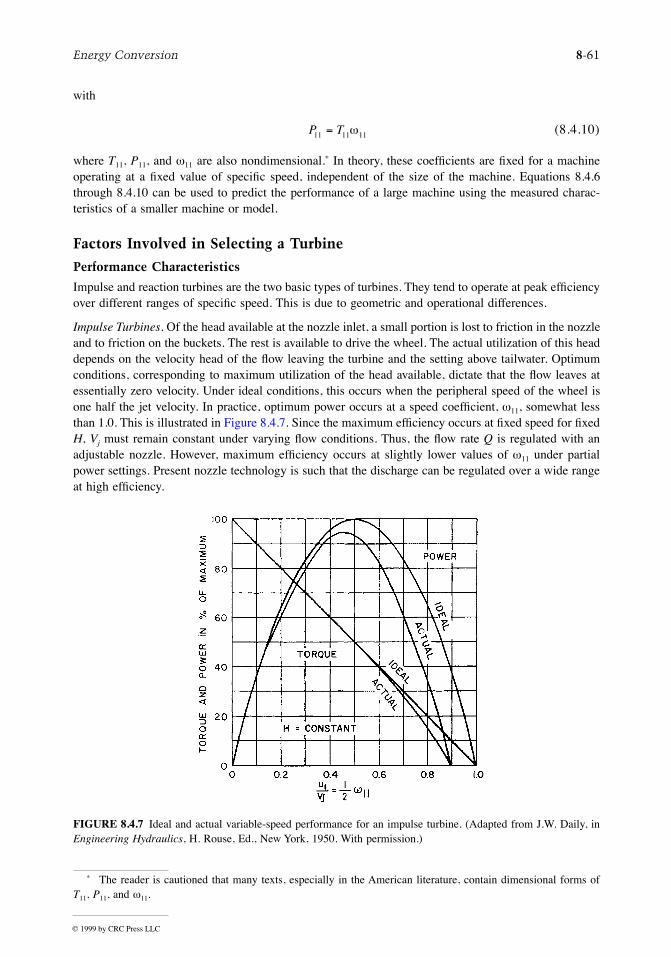
Energy Conversion 8-61
with
(8.4.10)
where T11, P11, and w11 are also nondimensional.* In theory, these coefÞcients are Þxed for a machineoperating at a Þxed value of speciÞc speed, independent of the size of the machine. Equations 8.4.6through 8.4.10 can be used to predict the performance of a large machine using the measured charac-teristics of a smaller machine or model.
Factors Involved in Selecting a Turbine
Performance Characteristics
Impulse and reaction turbines are the two basic types of turbines. They tend to operate at peak efÞciencyover different ranges of speciÞc speed. This is due to geometric and operational differences.
Impulse Turbines. Of the head available at the nozzle inlet, a small portion is lost to friction in the nozzleand to friction on the buckets. The rest is available to drive the wheel. The actual utilization of this headdepends on the velocity head of the ßow leaving the turbine and the setting above tailwater. Optimumconditions, corresponding to maximum utilization of the head available, dictate that the ßow leaves atessentially zero velocity. Under ideal conditions, this occurs when the peripheral speed of the wheel isone half the jet velocity. In practice, optimum power occurs at a speed coefÞcient, w11, somewhat lessthan 1.0. This is illustrated in Figure 8.4.7. Since the maximum efÞciency occurs at Þxed speed for ÞxedH, Vj must remain constant under varying ßow conditions. Thus, the ßow rate Q is regulated with anadjustable nozzle. However, maximum efÞciency occurs at slightly lower values of w11 under partialpower settings. Present nozzle technology is such that the discharge can be regulated over a wide rangeat high efÞciency.
* The reader is cautioned that many texts, especially in the American literature, contain dimensional forms ofT11, P11, and w11.
FIGURE 8.4.7 Ideal and actual variable-speed performance for an impulse turbine. (Adapted from J.W. Daily, inEngineering Hydraulics, H. Rouse, Ed., New York, 1950. With permission.)
P T11 11 11= w
© 1999 by CRC Press LLC

8-62 Section 8
A given head and penstock conÞguration establishes the optimum jet velocity and diameter. The sizeof the wheel determines the speed of the machine. The design speciÞc speed is approximately
(8.4.11)
Practical values of dj/D for Pelton wheels to ensure good efÞciency are in the range 0.04 to 0.1,corresponding to Ns values in the range 0.03 to 0.08. Higher speciÞc speeds are possible with multiple-nozzle designs. The increase is proportional to the square root of the number of nozzles. In consideringan impulse unit, one must remember that efÞciency is based on net head; the net head for an impulseunit is generally less than the net head for a reaction turbine at the same gross head because of the lackof a draft tube.
Reaction Turbines. The main difference between impulse and reaction turbines is the fact that a pressuredrop takes place in the rotating passages of the reaction turbine. This implies that the entire ßow passagefrom the turbine inlet to the discharge at the tailwater must be completely Þlled. A major factor in theoverall design of modern reaction turbines is the draft tube. It is usually desirable to reduce the overallequipment and civil construction costs by using high-speciÞc speed runners. Under these circumstancesthe draft tube is extremely critical both ßow-stability and efÞciency viewpoints.* At higher speciÞc speed,a substantial percentage of the available total energy is in the form of kinetic energy leaving the runner.To recover this efÞciently, considerable emphasis should be placed on the draft tube design.
The practical speciÞc speed range for reaction turbines is much broader than for impulse wheels. Thisis due to the wider range of variables which control the basic operation of the turbine. The pivoted guidevanes allow for control of the magnitude and direction of the inlet ßow. Because there is a Þxedrelationship among blade angle, inlet velocity, and peripheral speed for shock-free entry, this requirementcannot be completely satisÞed at partial ßow without the ability to vary blade angle. This is the distinctionbetween the efÞciency of Þxed-propeller and Francis-types at partial loads and the fully adjustable Kaplandesign.
Referring to Equation 8.4.4, optimum hydraulic efÞciency of the runner would occur when a2 is equalto 90°. However, the overall efÞciency of the turbine is dependent on the optimum performance of thedraft tube as well, which occurs with a little swirl in the ßow. Thus, the best overall efÞciency occurswith a2 » 75° for high-speciÞc speed turbines.
The determination of optimum speciÞc speed in a reaction turbine is more complicated than for animpulse unit since there are more variables. For a radial-ßow machine, an approximate expression is
(8.4.12)
where Cv is the fraction of net head that is in the form of inlet velocity head and B is the height of theinlet ßow passage (Figure 8.4.3). Value of Ns for Francis units is normally found to be in the range 0.3to 2.5.
Standardized axial-ßow machines are available in the smaller sizes. These units are made up ofstandard components, such as shafts and blades. For such cases,
(8.4.13)
* This should be kept in mind when retroÞtting an older, low-speciÞc-speed turbine with a new runner of highercapacity.
Nd
Dsj= ( )0 77. Pelton turbines
N CB
Ds v=é
ëê
ù
ûú ( )1 64 1
1
1 2
11. sina w Francis turbines
NnsB
~tanb
3 4 propeller turbines( )
© 1999 by CRC Press LLC

Energy Conversion 8-63
where b is the blade pitch angle and nB is the number of blades. The advantage of controllable pitch isalso obvious from this formula, the best speciÞc speed simply being a function of pitch angle.
It should be further noted that w11 is approximately constant for Francis units and Ns is proportionalto (B/D1)1/2. It can be also shown that velocity component based on the peripheral speed at the throat,w11e, is proportional to Ns. In the case of axial-flow machinery, w11 is also proportional to Ns. For minimumcost, peripheral speed should be as high as possible, consistent with cavitation-free performance. Underthese circumstances, Ns would vary inversely with the square root of head:
(8.4.14)
where the range of C is 21 to 30 for Þxed propeller units, 21 to 32 for Kaplan units, and 16 to 25 forFrancis units.
Performance Comparison. The physical characteristics of various runner conÞgurations are summarizedin Figure 8.4.8. It is obvious that the conÞguration changes with speed and head. Impulse turbines areefÞcient over a relatively narrow range of speciÞc speed, whereas Francis and propeller turbines have awider useful range. An important consideration is whether or not a turbine is required to operate overa wide range of load. Pelton wheels tend to operate efÞciently over a wide range of power loadingbecause of their nozzle design. In the case of reaction machines that have Þxed geometry, such as Francisand propeller turbines, efÞciency can vary widely with load. However, Kaplan and Deriaz* turbines canmaintain high efÞciency over a wide range of operating conditions. The decision of whether to select asimple conÞguration with a relatively ÒpeakyÓ efÞciency curve or go to the added expense of installinga more complex machine with a broad efÞciency curve will depend on the expected operation of theplant and other economic factors.
Note in Figure 8.4.8 that there is an overlap in the range of application of various types of equipment.This means that either type of unit can be designed for good efÞciency in this range, but other factors,such as generator speed and cavitation, may dictate the Þnal selection.
Speed Regulation
The speed regulation of a turbine is an important and complicated problem. The magnitude of the problemvaries with size, type of machine and installation, type of electrical load, and whether or not the plantis tied into an electrical grid. Note that runaway or no-load speed can be higher than design speed byfactors as high as 2.6. This is an important design consideration for all rotating parts, including thegenerator.
The speed of a turbine has to be controlled to a value that matches the generator characteristics andthe grid frequency:
(8.4.15)
where n is turbine speed in rpm, f is the required grid frequency in Hz, and Np is the number of polesin the generator. Typically, Np is in multiples of 4. There is a tendency to select higher speed generatorsto minimize weight and cost. However, consideration has to be given to speed regulation.
It is beyond the scope of this section to discuss the question of speed regulation in detail. Regulationof speed is normally accomplished through ßow control. Adequate control requires sufÞcient rotationalinertia of the rotating parts. When load is rejected, power is absorbed, accelerating the ßywheel; andwhen load is applied, some additional power is available from deceleration of the ßywheel. Response
* An adjustable blade mixed-ßow turbine (Arndt, 1991).
NC
HHs = ( ) is in meters
nf
Np
=120
© 1999 by CRC Press LLC
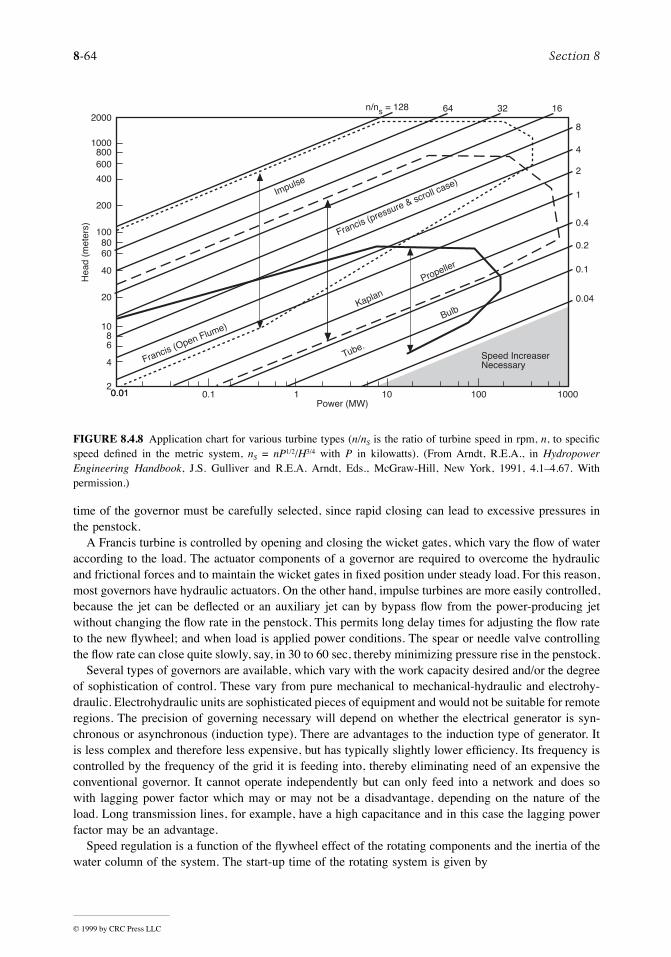
8-64 Section 8
time of the governor must be carefully selected, since rapid closing can lead to excessive pressures inthe penstock.
A Francis turbine is controlled by opening and closing the wicket gates, which vary the ßow of wateraccording to the load. The actuator components of a governor are required to overcome the hydraulicand frictional forces and to maintain the wicket gates in Þxed position under steady load. For this reason,most governors have hydraulic actuators. On the other hand, impulse turbines are more easily controlled,because the jet can be deßected or an auxiliary jet can by bypass ßow from the power-producing jetwithout changing the ßow rate in the penstock. This permits long delay times for adjusting the ßow rateto the new ßywheel; and when load is applied power conditions. The spear or needle valve controllingthe ßow rate can close quite slowly, say, in 30 to 60 sec, thereby minimizing pressure rise in the penstock.
Several types of governors are available, which vary with the work capacity desired and/or the degreeof sophistication of control. These vary from pure mechanical to mechanical-hydraulic and electrohy-draulic. Electrohydraulic units are sophisticated pieces of equipment and would not be suitable for remoteregions. The precision of governing necessary will depend on whether the electrical generator is syn-chronous or asynchronous (induction type). There are advantages to the induction type of generator. Itis less complex and therefore less expensive, but has typically slightly lower efÞciency. Its frequency iscontrolled by the frequency of the grid it is feeding into, thereby eliminating need of an expensive theconventional governor. It cannot operate independently but can only feed into a network and does sowith lagging power factor which may or may not be a disadvantage, depending on the nature of theload. Long transmission lines, for example, have a high capacitance and in this case the lagging powerfactor may be an advantage.
Speed regulation is a function of the ßywheel effect of the rotating components and the inertia of thewater column of the system. The start-up time of the rotating system is given by
FIGURE 8.4.8 Application chart for various turbine types (n/nS is the ratio of turbine speed in rpm, n, to speciÞcspeed deÞned in the metric system, nS = nP1/2/H3/4 with P in kilowatts). (From Arndt, R.E.A., in HydropowerEngineering Handbook, J.S. Gulliver and R.E.A. Arndt, Eds., McGraw-Hill, New York, 1991, 4.1Ð4.67. Withpermission.)
2000
1000
1000800600
400
200
1008060
40
20
1086
4
20.010.01 1001010.1
Power (MW)
Hea
d (m
eter
s)
8
4
2
1
0.4
0.2
0.1
0.04
163264n/ns = 128
Impulse
Francis (pressure & scroll case)
Propeller
Kaplan
Bulb
Tube.Francis (Open Flume)
Speed IncreaserNecessary
© 1999 by CRC Press LLC

Energy Conversion 8-65
(8.4.16)
where I = moment of inertia of the generator and turbine, kg á m2 (Bureau of Reclamation, 1966).The start-up time of the water column is given by
(8.4.17)
where L = length of water columnV = velocity in each component of the water column
For good speed regulation, it is desirable to keep ts/tp > 4. Lower values can also be used, althoughspecial precautions are necessary in the control equipment. Higher ratios of ts/tp can be obtained byincreasing I or decreasing tp. Increasing I implies a larger generator, which also results in higher costs.The start-up time of the water column can be reduced by reducing the length of the ßow system, byusing lower velocities, or by adding surge tanks, which essentially reduce the effective length of theconduit. A detailed analysis should be made for each installation, since for a given length, head, anddischarge the ßow area must be increased to reduce tp, which leads to associated higher construction costs.
Cavitation and Turbine Setting
Another factor that must be considered prior to equipment selection is the evaluation of the turbine withrespect to tailwater elevations. Hydraulic turbines are subject to pitting due to cavitation (Arndt, 1981,1991). For a given head, smaller, lower-cost, high-speed runner must be set lower (i.e, closer to tailwateror even below tailwater) than a larger, higher-cost, low-speed turbine runner. Also, atmospheric pressureor elevation above sea level is a factor, as are tailwater elevation ion variations and operating requirements.This is a complex concept which can only be accurately resolved by model tests. The runner design willhave different cavitation characteristics. Therefore, the anticipated turbine location or setting with respectto tailwater elevations is an important consideration in turbine selection.
Cavitation is not normally a problem with impulse wheels. However, by the very nature of theiroperation, cavitation is an important factor in reaction turbine installations. The susceptibility for cavi-tation to occur is a function of the installation and the turbine design. This can be expressed convenientlyin terms of ThomaÕs sigma deÞned as
(8.4.18)
where Ha is the atmospheric pressure head, HV is the vapor pressure need (generally negligible), and zis the elevation of a turbine reference plane above the tailwater (see Figure 8.4.1). Draft tube losses andthe exit velocity head have been neglected.
sT must be above a certain value to avoid cavitation problems. The critical value of sT is a functionof speciÞc speed (Arndt, 1991). The Bureau of Reclamation (1966) suggests that cavitation problemscan be avoided when
(8.4.19)
Equation 8.4.19 does not guarantee total elimination of cavitation, only that cavitation is withinacceptable limits. Cavitation can be totally avoided only if the value sT at an installation is much greaterthan the limiting value given in Equation 8.4.19. The value of sT for a given installation is known as
tI
Ps =w2
tLV
gHp =å
sTa vH H z
H=
- -
sT sN> 0 26 1 64. .
© 1999 by CRC Press LLC

8-66 Section 8
the plant sigmas, sp. Equation 8.4.19 should only be considered as a guide in selecting sp, which isnormally determined by a model test in the manufacturerÕs laboratory. For a turbine operating under agiven head, the only variable controlling sp is the turbine setting z. The required value of sp then controlsthe allowable setting above tailwater:
(8.4.20)
It must be borne in mind that Ha varies with elevation. As a rule of thumb, Ha decreases from the sea-level value of 10.3 m by 1.1 m for every 1000 m above sea level.
Defining Terms
Draft tube: The outlet conduit from a turbine which normally acts as a diffuser. This is normallyconsidered to be an integral part of the unit.
Forebay: The hydraulic structure used to withdraw water from a reservoir or river. This can be positioneda considerable distance upstream from the turbine inlet.
Head: The speciÞc energy per unit weight of water. Gross head is the difference in water surfaceelevation between the forebay and tailrace. Net head is the difference between total head (the sumof velocity head V2/2g, pressure head p/rg, and elevation head z at the inlet and outlet of a turbine.Some European texts use speciÞc energy per unit mass, e.g., speciÞc kinetic energy is V2/2.
Runner: The rotating component of a turbine in which energy conversion takes place.SpeciÞc speed: A universal number for a given machine design.Spiral case: The inlet to a reaction turbine.Surge tank: A hydraulic structure used to diminish overpressures in high-head facilities due to water
hammer resulting from the sudden stoppage of a turbineWicket gates: Pivoted, streamlined guide vanes that control the ßow of water to the turbine.
References
Arndt, R.E.A. 1981. Cavitation in ßuid machinery and hydraulic structures. Ann. Rev. Fluid Mech.13:273Ð328.
Arndt, R.E.A. 1991. Hydraulic turbines, in Hydropower Engineering Handbook, J.S. Gulliver and R.E.A.Arndt, Eds., pp. 4.1Ð4.67 McGraw-Hill, New York.
Bureau of Reclamation. 1966. Selecting Hydraulic Reaction Turbines, Engineering Monograph No. 20.Daily, J.W. 1950. Hydraulic machinery, in H. Rouse, Ed., Engineering Hydraulics, New York.International Code for the Field Acceptance Tests of Hydraulic Turbines, 1963. International Electro-
technical Commission, Publication 41.Raabe, J. 1985. Hydro Power: The Design, Use, and Function of Hydromechanical, Hydraulic, and
Electrical Equipment. VDI Verlag, Dusseldorf, Germany.Wahl, T.L. 1994. Draft tube surging times two: The twin vortex problem. Hydro Rev. 13(1):60Ð69.
Further Information
J. Fluids Eng, published quarterly by the ASME.ASME Symposia Proc. on Fluid Machinery and Cavitation, published by the Fluids Eng. Div.Hydro Review, published eight times per year by HCI Publications, Inc., Kansas City, MO.L.F. Moody and T. Zowski, Hydraulic machinery, in Handbook of Applied Hydraulics, C.V. Davis and
K.E. Sorenson, Eds., McGraw-Hill, New York, 1992. Waterpower and Dam Construction, published monthly by Reed Business Publishing, Surrey, U.K.
z H H Ha v pallow = - - s
© 1999 by CRC Press LLC

Energy Conversion 8-67
8.5 Stirling Engines
William B. Stine
Introduction
The Stirling engine was patented in 1816 by Rev. Robert Stirling, a Scottish minister (Figure 8.5.1).Early Stirling engines were coal-burning, low-pressure air engines built to compete with saturated steamengines for providing auxiliary power for manufacturing and mining. In 1987, John Ericsson built anenormous marine Stirling engine with four 4.2-m-diameter pistons. Beginning in the 1930s, the Stirlingengine was brought to a high state of technology development by Philips Research Laboratory inEindhoven, The Netherlands with the goal of producing small, quiet electrical generator sets to be usedwith high-power-consuming vacuum tube electronic devices. Recently, interest in Stirling engines hasresurfaced, with solar electric power generation (Stine and Diver, 1994) and hybrid automotive applica-tions in the forefront.
In theory, the Stirling cycle engine can be the most efÞcient device for converting heat into mechanicalwork with high efÞciencies requiring high-temperatures. In fact, with regeneration, the efÞciency of theStirling cycle equals that of the Carnot cycle, the most efÞcient of all ideal thermodynamic cycles. (SeeWest, 1986 for further discussion of the thermodynamics of Stirling cycle machines.)
Since their invention, prototype Stirling engines have been developed for automotive purposes; theyhave also been designed and tested for service in trucks, buses, and boats (Walker, 1973). The Stirlingengine has been proposed as a propulsion engine in yachts, passenger ships, and road vehicles such ascity buses (Meijer, 1992). The Stirling engine has also been developed as an underwater power unit forsubmarines, and the feasibility of using the Stirling for high-power space-borne systems has beenexplored by NASA (West, 1986). The Stirling engine is considered ideal for solar heating, and the Þrstsolar application of record was by John Ericsson, the famous British-American inventor, in 1872 (Stineand Diver, 1994).
Stirling engines are generally externally heated engines. Therefore, most sources of heat can be usedto drive them, including combustion of just about anything, radioisotopes, solar energy, and exothermic
FIGURE 8.5.1 The original patent Stirling engine of Rev. Robert Stirling.
© 1999 by CRC Press LLC

8-68 Section 8
chemical reactions. High-performance Stirling engines operate at the thermal limits of the materials usedfor their construction. Typical temperatures range Þom 650 to 800°C (1200 to 1470°F), resulting inengine conversion efÞciencies of around 30 to 40%. Engine speeds of 2000 to 4000 rpm are common
Thermodynamic Implementation of the Stirling Cycle
In the ideal Stirling cycle, a working gas is alternately heated and cooled as it is compressed andexpanded. Gases such as helium and hydrogen, which permit rapid heat transfer and do not changephase, are typically used in the high-performance Stirling engines. The ideal Stirling cycle combinesfour processes, two constant-temperature heat-exchange processes and two constant-volume heat-exchange processes. Because more work is done by expanding high-temperature, high-pressure gas thanis required to compress low-temperature, low-pressure gas, the Stirling cycle produces net work, whichcan drive an electric alternator or other mechanical devices.
Working Gases
In the Stirling cycle, the working gas is alternately heated and cooled in constant-temperature andconstant-volume processes. The traditional gas for Stirling engines has been air at atmospheric pressure.At this pressure, air has a reasonably high density and therefore can be used directly in the cycle withloss of working gas through seals a minor problem. However, internal component temperatures arelimited because of the oxygen in air which can degrade materials rapidly.
Because of their high heat-transfer capabilities, hydrogen and helium are used for high-speed, high-performance Stirling engines. To compensate for the low density of these gases, the mean pressure ofthe working gas is raised by charging the gas spaces in the engine to high pressures. Compression andexpansion vary above and below this charge pressure. Hydrogen, thermodynamically a better choice,generally results in more-efÞcient engines than does helium (Walker, 1980). Helium, on the other hand,has fewer material-compatibility problems and is safer to work with. To maximize power, high-perfor-mance engines typically operate at high pressure, in the range of 5 to 20 MPa (725 to 2900 psi). Operationat these high gas pressures makes sealing difÞcult, and seals between the high-pressure region of theengine and those parts at ambient pressure have been problematic in some engines. New designs toreduce or eliminate this problem are currently being developed.
Heat Exchange
The working gas is heated and cooled by heat exchangers that add heat from an external source, or rejectheat to the surroundings. Further, in most engines, an internal heat storage unit stores and rejects heatduring each cycle.
The heater of a Stirling engine is usually made of many small-bore tubes that are heated externallywith the working gas passing through the inside. External heat transfer by direct impingement ofcombustion products or direct adsorption of solar irradiation is common. A trade-off between high heat-transfer rate using many small-bore tubes with resulting pumping losses, and fewer large-bore tubes andlower pumping losses drives the design. A third criterion is that the volume of gas trapped within theseheat exchangers should be minimal to enhance engine performance. In an attempt to provide moreuniform and constant-temperature heat transfer to the heater tubes, reßux heaters are being developed(Stine and Diver, 1994). Typically, by using sodium as the heat-transfer medium, liquid is evaporatedat the heat source and is then condensed on the outside surfaces of the engine heater tubes.
The cooler is usually a tube-and-shell heat exchanger. Working gas is passed through the tubes, andcooling water is circulated around the outside. The cooling water is then cooled in an external heatexchanger. Because all of the heat rejected from the power cycle comes from the cooler, the Stirlingengine is considered ideal for cogeneration applications.
Most Stirling engines incorporate an efÞciency-enhancing regenerator that captures heat from theworking gas during constant-volume cooling and replaces it when the gas is heated at constant volume.Heating and cooling of the regenerator occurs at over 60 times a second during high-speed engineoperation. In the ideal cycle, all of the heat-transferred during the constant volume heating and cooling
© 1999 by CRC Press LLC

Energy Conversion 8-69
processes occurs in the regenerator, permitting the external heat addition and rejection to be efÞcientconstant-temperature heat-transfer processes. Regenerators are typically chambers packed with Þne-meshscreen wire or porous metal structures. There is enough thermal mass in the packing material to storeall of the heat necessary to raise the temperature of the working gas from its low to its high temperature.The amount of heat stored by the regenerator is generally many times greater than the amount addedby the heater.
Power Control
Rapid control of the output power of a Stirling engine is highly desirable for some applications such asautomotive and solar electric applications. In most Stirling engine designs, rapid power control isimplemented by varying the density (i.e., the mean pressure) of the working gas by bleeding gas fromthe cycle when less power is desired. To return to a higher power level, high-pressure gas must bereintroduced into the cycle. To accomplish this quickly and without loss of working gas, a complexsystem of valves, a temporary storage tank, and a compressor are used.
A novel method of controlling the power output is to change the length of stroke of the power piston.This can be accomplished using a variable-angle swash plate drive as described below. Stirling ThermalMotors, Inc., uses this method on their STM 4-120 Stirling engine (Figure 8.5.2).
Mechanical Implementation of the Stirling Cycle
Piston/Displacer Configurations
To implement the Stirling cycle, different combinations of machine components have been designed toprovide for the constant-volume movement of the working gas between the high- and low-temperatureregions of the engine, and compression and expansion during the constant-temperature heating and
FIGURE 8.5.2 Stirling Thermal Motors 4-120 variable swash plate Rinia conÞguration engine. (Courtesy StirlingThermal Motors, Ann Arbor, Michigan.)
© 1999 by CRC Press LLC
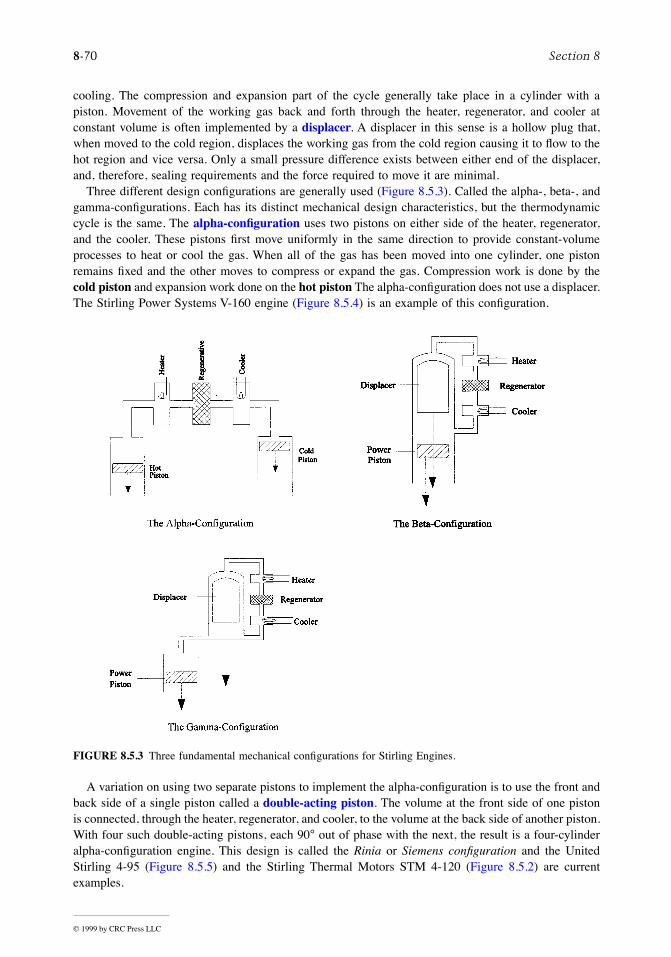
8-70 Section 8
cooling. The compression and expansion part of the cycle generally take place in a cylinder with apiston. Movement of the working gas back and forth through the heater, regenerator, and cooler atconstant volume is often implemented by a displacer. A displacer in this sense is a hollow plug that,when moved to the cold region, displaces the working gas from the cold region causing it to ßow to thehot region and vice versa. Only a small pressure difference exists between either end of the displacer,and, therefore, sealing requirements and the force required to move it are minimal.
Three different design conÞgurations are generally used (Figure 8.5.3). Called the alpha-, beta-, andgamma-conÞgurations. Each has its distinct mechanical design characteristics, but the thermodynamiccycle is the same. The alpha-conÞguration uses two pistons on either side of the heater, regenerator,and the cooler. These pistons Þrst move uniformly in the same direction to provide constant-volumeprocesses to heat or cool the gas. When all of the gas has been moved into one cylinder, one pistonremains Þxed and the other moves to compress or expand the gas. Compression work is done by thecold piston and expansion work done on the hot piston The alpha-conÞguration does not use a displacer.The Stirling Power Systems V-160 engine (Figure 8.5.4) is an example of this conÞguration.
A variation on using two separate pistons to implement the alpha-conÞguration is to use the front andback side of a single piston called a double-acting piston. The volume at the front side of one pistonis connected, through the heater, regenerator, and cooler, to the volume at the back side of another piston.With four such double-acting pistons, each 90° out of phase with the next, the result is a four-cylinderalpha-conÞguration engine. This design is called the Rinia or Siemens conÞguration and the UnitedStirling 4-95 (Figure 8.5.5) and the Stirling Thermal Motors STM 4-120 (Figure 8.5.2) are currentexamples.
FIGURE 8.5.3 Three fundamental mechanical conÞgurations for Stirling Engines.
© 1999 by CRC Press LLC

Energy Conversion 8-71
FIGURE 8.5.4 Stirling Power Systems/Solo Kleinmotoren V-160 alpha-conÞguration Stirling engine.
FIGURE 8.5.5 The 4-95 high-performance Siemens conÞguration Rinia engine by United Stirling (Malmo, Sweden).
© 1999 by CRC Press LLC

8-72 Section 8
The beta-conÞguration is a design incorporating a displacer and a power piston in the same cylinder.The displacer shuttles gas between the hot end and the cold end of the cylinder through the heater,regenerator, and cooler. The power piston, usually located at the cool end of the cylinder, compressesthe working gas when the gas is in the cool end and expands the working gas when the gas has beenmoved to the hot end. The original patent engine by Robert Stirling and most free-piston Stirling enginesdiscussed below are of the beta-conÞguration.
The third conÞguration, using separate cylinders for the displacer and the power piston, is called thegamma-conÞguration. Here, the displacer shuttles gas between the hot end and the cold end of acylinder through the heater, regenerator, and cooler, just as with the beta-conÞguration. However, thepower piston is in a separate cylinder, pneumatically connected to the displacer cylinder.
Piston/Displacer Drives
Most Stirling engine designs dynamically approximate the Stirling cycle by moving the piston anddisplacer with simple harmonic motion, either through a crankshaft, or bouncing as a spring/masssecond-order mechanical system. For both, a performance penalty comes from the inability of simpleharmonic motion to perfectly follow the desired thermodynamic processes. A more desirable dynamicfrom the cycle point of view, called overdriven or bang-bang motion, has been implemented in somedesigns, most notably the Ringbom conÞguration and engines designed by Ivo Kolin (West, 1986).
Kinematic Engines. Stirling engine designs are usually categorized as either kinematic or free-piston.The power piston of a kinematic Stirling engine is mechanically connected to a rotating output shaft.In typical conÞgurations, the power piston is connected to the crankshaft with a connecting rod. In orderto eliminate side forces against the cylinder wall, a cross-head is often incorporated, where the connectingrod connects to the cross-head, which is laterally restrained so that it can only move linearly in the samedirection as the piston. The power piston is connected to the cross-head and therefore experiences nolateral forces. The critical sealing between the high-pressure and low-pressure regions of the engine cannow be created using a simple linear seal on the shaft between the cross-head and the piston. Thisdesign also keeps lubricated bearing surfaces in the low-pressure region of the engine, reducing thepossibility of fouling heat-exchange surfaces in the high-pressure region of the engine. If there is aseparate displacer piston as in the beta- and gamma conÞgurations, it is also mechanically connected tothe output shaft.
A variation on crankshaft/cross-head drives is the swash plate or wobble-plate drive, used withsuccess in some Stirling engine designs. Here, a drive surface afÞxed to the drive shaft at an angle,pushes Þxed piston push rods up and down as the slanted surface rotates beneath. The length of strokefor the piston depends on the angle of the plate relative to the axis of rotation. The STM 4-120 engine(Figure 8.5.2) currently being commercialized by Stirling Thermal Motors incorporates a variable-angleswash plate drive that permits variation in the length of stroke of the pistons.
Free-Piston Engine/Converters. An innovative way of accomplishing the Stirling cycle is employed inthe free-piston engine. In this conÞguration, the power piston is not mechanically connected to an outputshaft. It bounces alternately between the space containing the working gas and a spring (usually a gasspring). In many designs, the displacer is also free to bounce on gas springs or mechanical springs(Figure 8.5.6). This conÞguration is called the Beale free-piston Stirling engine after its inventor, WilliamBeale. Piston stroke, frequency, and the timing between the two pistons are established by the dynamicsof the spring/mass system coupled with the variations in cycle pressure. To extract power, a magnet canbe attached to the power piston and electric power generated as it moves past stationary coils. TheseStirling engine/alternator units are called free-piston Stirling converters. Other schemes for extractingpower from free-piston engines, such as driving a hydraulic pump, have also been considered.
Free-piston Stirling engines have only two moving parts, and therefore the potential advantages ofsimplicity, low cost, and ultra-reliability. Because electricity is generated internally, there are no dynamicseals between the high-pressure region of the engine and ambient, and no oil lubrication is required.This design promises long lifetimes with minimal maintenance. A number of companies are currently
© 1999 by CRC Press LLC

Energy Conversion 8-73
developing free-piston engines including Sunpower, Inc. (Figure 8.5.7), and Stirling Technology Com-pany.
Seals and Bearings
Many proposed applications for Stirling engine systems require long-life designs. To make systemseconomical, a system lifetime of at least 20 years with minimum maintenance is generally required.Desired engine lifetimes for electric power production are 40,000 to 60,000 hr Ñ approximately tentimes longer than that of a typical automotive internal combustion engine. Major overhaul of engines,including replacement of seals and bearings, may be necessary within the 40,000- to 60,000-hr lifetime,which adds to the operating cost. A major challenge, therefore, in the design of Stirling engines is toreduce the potential for wear in critical components or to create novel ways for them to perform theirtasks.
FIGURE 8.5.6 Basic components of a Beale free-piston Stirling converter incorporating a sodium heatpipe receiver for heating with concentrated solar energy.
FIGURE 8.5.7 The Sunpower 9-kWe free-piston beta-conÞguration Stirling engine.
© 1999 by CRC Press LLC
8-74 Section 8
Piston seals differ from those used in internal combustion engines in a number of ways. Sealing ofthe power piston is critical since blow-by loss of the hydrogen or helium working gas must be capturedand recompressed, or replaced from a high-pressure cylinder. Displacer sealing is less critical and onlynecessary to force most of the working gas through the heater, regenerator, and cooler. Oil for frictionreduction or sealing cannot be used because of the danger of it getting into the working gas and foulingthe heat-exchange surfaces. This leads to two choices for sealing of pistons, using polymer sealingrings or gas bearings (simply close tolerance Þtting between piston and wall).
Free-piston engines with gas springs have special internal sealing problems. Small leakage can changethe force-position characteristics of the ÒspringÓ and rapidly upset the phase and displacement dynamicsdesigned into the engine. In order to prevent this, centering ports are used to ensure that the piston staysat a certain location; however, these represent a loss of potential work from the engine.
Materials
Materials used in Stirling engines are generally normal steels with a few exceptions. Materials that canwithstand continuous operation at the cycle high temperature are required for the heater, regenerator,and the hot side of the displacement volume. Because most engines operate at high pressure, thick wallsare often required. In the hot regions of the engine, this can lead to thermal creep due to successiveheating and cooling. In the cool regions, large spaces for mechanical linkages can require heavy, thickwalls to contain the gas pressure. Use of composite structure technology or reducing the size of thepressurized space can eliminate these problems.
Future of the Stirling Engine
The principal advantages of the Stirling engine, external heating and high efÞciency, make this the engineof the future, replacing many applications currently using internal combustion engines and providingaccess to the sun as an inexpensive source of energy (Figure 8.5.6). For hybrid-electric automotiveapplications, the Stirling engine is not only almost twice as efÞcient as modern spark-ignition engines,but because of the continuous combustion process, it burns fuel more cleanly and is not sensitive to thequality or type of fuel. Because of the simplicity of its design, the Stirling engine can be manufacturedas an inexpensive power source for electricity generation using biomass and other fuels available indeveloping nations.
Most importantly, the Stirling engine will provide access to inexpensive solar energy. Because it canreceive its heat from a resource 93 million miles away using concentrating solar collectors, and becauseits manufacture is quite similar to the gasoline or diesel engine, and because economies of scale arecertain when producing thousands of units per year, the Stirling engine is considered to be the leastexpensive alternative for solar energy electric generation applications in the range from 1 kWe to 100MWe.
Defining Terms
Alpha-conÞguration: Design of a Stirling engine where two pistons moving out of phase, and causethe working gas between them to go through the four processes of the Stirling cycle.
Beale free-piston Stirling engine: Stirling engine conÞguration where the power piston and displacerin a single cylinder are free to bounce back and forth along a single axis, causing the enclosedworking gas to go through the four processes of the Stirling cycle. Restoration forces are providedby the varying pressure of the working gas, springs (gas or mechanical), and the external loadwhich can be a linear alternator or a ßuid pump.
Beta-conÞguration: Design of a Stirling engine where the displacer and power piston are located inthe same cylinder and cause the enclosed working gas to go through the four processes of theStirling cycle.
Blow-by: The gas that leaks past a seal, especially a piston-to-cylinder seal.Charge pressure: Initial pressure of the working gas.
© 1999 by CRC Press LLC

Energy Conversion 8-75
Cooler: Heat exchanger that removes heat from the working ßuid and transfers it out of the cycle.Cross-head: A linear sliding bearing surface connected to a crankshaft by a connecting rod. It is purpose
is to provide linear reciprocating motion along a single line of action.Displacer: Closed volume ÔplugÕ that forces the working ßuid to move from one region of the engine
to another by displacing it.Double-acting piston: A piston in an enclosed cylinder where pressure can be varied on both sides of
the piston, resulting a total amount of work being the sum of that done on or by both sides.Dynamic seals: Seals that permit transfer of motion without permitting gas or oil leakage. These can
be either linear seals permitting a shaft to move between two regions (i.e., the piston rod seals ina Stirling engine), or rotating seals that permit rotating motion to be transmitted from one regionto another (i.e., the output shaft of a Stirling engine).
Free-piston Stirling converters: A name given to a hermetically sealed free-piston Stirling engineincorporating an internal alternator or pump.
Gamma-conÞguration: A design of a Stirling engine where the displacer and power piston are locatedin separate, connected cylinders and cause the enclosed working gas to go through the fourprocesses of the Stirling cycle.
Gas bearing: A method of implementing the sliding seal between a piston and cylinder as opposed tousing piston rings. Uses a precision-Þtting piston that depends on the small clearance and longpath for sealing and on the viscosity of the gas for lubrication.
Gas spring: A piston that compresses gas in a closed cylinder where the restoration force is linearlyproportional to the piston displacement. This is a concept used in the design of free-piston Stirlingengines.
Heater: A heat exchanger which adds heat to the working ßuid from an external source.Kinematic stirling engine: Stirling engine design that employ physical connections between the power
piston, displacer, and a mechanical output shaft.Linear seal: see dynamic seals.Overdriven (bang-bang) motion: Linear motion varying with time as a square-wave function. An
alternative to simple harmonic motion and considered a better motion for the displacer of a Stirlingengine but difÞcult to implement.
Phase angle: The angle difference between displacer and power piston harmonic motion with a completecycle representing 360°. In most Stirling engines, the harmonic motion of the power piston follows(lags) the motion of the displacer by approximately 90°.
Push rod: A thin rod connected to the back of the piston that transfers linear motion through a dynamiclinear seal, between the low- and high-pressure regions of an engine.
Reßux: A constant-temperature heat-exchange process where a liquid is evaporated by heat additionand then condensed as a result of cooling.
Regenerator: A heat-transfer device that stores heat from the working gas during part of a thermody-namic cycle and returns it during another part of the cycle. In the Stirling cycle the regeneratorstores heat from one constant-volume process and returns it in the other constant-volume process.
Ringbom conÞguration: A Stirling engine conÞguration where the power piston is kinematicallyconnected to a power shaft, and the displacer is a free piston that is powered by the difference inpressure between the internal gas and atmospheric pressure.
Simple harmonic motion: Linear motion varying with time as a sine function. Approximated by apiston connected to a crankshaft or a bouncing of a spring mass system.
Stirling cycle: A thermodynamic power cycle with two constant-volume heat addition and rejectionprocesses and two constant-temperature heat-addition and rejection processes.
Swash plate drive: A disk on a shaft, where the plane of the disk is tilted away from the axis of rotationof the shaft. Piston push rods that move parallel to the axis of rotation but are displaced from theaxis of rotation, slide on the surface of the rotating swash plate and therefore move up and down.
Variable-angle swash plate drive: A swash plate drive where the tilt angle between the drive shaft andthe plate can be varied, resulting in a change in the displacement of the push rods.
© 1999 by CRC Press LLC

8-76 Section 8
Wobble plate drive: Another name for a swash plate drive.Working gas: Gas within the engine that exhibits pressure and temperature change as it is heated or
cooled and/or compressed or expanded.
References
Meijer, R.F. 1992. Stirling engine, in McGraw-Hill Encyclopedia of Science and Technology, 7th ed.,pp. 440Ð445, McGraw-Hill, New York.
Stine, W.B. and Diver, R.E. 1994. A Compendium of Solar Dish Stirling Technology, Report SAND94-7026, Sandia National Laboratories, Albuquerque, NM 87185.
Walker, G. 1973. The Stirling engine, Sci. Am., 229(2):80Ð87.Walker, G. 1980. Stirling Engines, Clarendon Press, Oxford.West, C.D. 1986. Principles and Applications of Stirling Engines, Van Nostrand Reinhold, New York.
Further Information
Books
Hargraves, C.M. The Philips Stirling Engine, Elsevier Press, London, 1991.Organ, A.J. Thermodynamics and Gas Dynamics of the Stirling Cycle Machine, Cambridge University
Press, Cambridge, 1992.Senft, J.R. Ringbom Stirling Engines, Oxford University Press, Oxford, 1993.Stine, W.B. and R.E. Diver, A Compendium of Solar Dish/Stirling Technology, SAND93-7026, Sandia
National Laboratory, Albuquerque, 1994.Urieli, I. and D.M. Berchowitz, Stirling Cycle Engine Analysis, Adam Hilger, Bristol, 1984Walker, G. Stirling Engines, Clarendon Press, Oxford, 1980.Walker, G. and J.R. Senft, Free-Piston Stirling Engines, Springer-Verlag, New York, 1985.Walker, G., G. Reader, O.R. Fauvel, E.R. Bingham, The Stirling Alternative, Bordon & Breach, New
York, 1994.West, C.D. Principles and Applications of Stirling Engines, Van Nostrand Reinhold, New York, 1986.
Periodicals
Proceedings of the Intersociety Energy Conversion Engineering Conference (IECEC), published annu-ally.
Stirling Machine World, a quarterly newsletter devoted to advancements in Stirling engines, edited byBrad Ross, 1823 Hummingbird Court, West Richland, WA 99353-9542.
Stirling Engine Developers
Stirling Technology Company, 4208B W. Clearwater Ave., Kennewick, WA 99336.Stirling Thermal Motors, 275 Metty Drive, Ann Arbor, MI 48103.Sunpower Incorporated, 6 Byard Street, Athens, OH 45701.Clever Fellows Innovation Consortium, 302 Tenth St., Troy, NY 12180.Mechanical Technologies Inc., 968 Albany-Shaker Rd., Latham, NY 12110.Solo Kleinmotoren GmbH, Postfach 60 0152; D-71050 SindelÞngen; Germany.Aisin-Seiki Ltd., 1, Asahi-Mach: 2-chome; Kariya City Aich: Pref 448; Japan.
© 1999 by CRC Press LLC

Energy Conversion 8-77
8.6 Advanced Fossil Fuel Power Systems
Anthony F. Armor
Introduction
The generation of electric power from fossil fuels has undergone signiÞcant and, in some cases, dramaticchanges over the last 20 years or so. Technology improvements in fossil fuel combustion have beenlargely driven by environmental issues, by the need to conserve fossil fuel resources, and by theeconomics of the competitive marketplace. The importance of fossil fuel-Þred electric generation to theworld is undeniable Ñ more than 70% of all power in the U.S. is fossil fuel based, and worldwide thepercentage is higher and growing. Today, most power plants worldwide burn coal, but increasinglygenerating companies are turning to natural gas, as the cost of gas-Þred generation and the long-termsupply of gas appear favorable. This section reviews the current status and likely future deployment ofcompeting generation technologies based on fossil fuels.
It is likely, particularly in the developed world, that gas turbine-based plants will dominate the newgeneration market in the immediate future. The most advanced combustion turbines (CTs) now achievemore than 40% lower heating value (LHV) efÞciency in simple cycle mode and greater than 50%efÞciency in combined cycle (CC) mode. In addition, combustion turbine/combined cycle (CT/CC)plants offer siting ßexibility, swift construction schedules, and capital costs between $400/kW and$800/kW. These advantages, coupled with adequate natural gas supplies and the assurance, in the longerterm, of coal gasiÞcation backup, make this technology currently the prime choice for green Þeld andrepowered plants in the United States and in Europe.
But for the developing world, particularly China and India, there is good reason why the direct coal-Þred power plant may still be the primary choice for many generation companies. Fuel is plentiful andinexpensive, and sulfur dioxide scrubbers have proved to be more reliable and effective than early plantsindicated. In fact, as high as 99% SO2 removal efÞciency is now possible.
Combustion of coal can occur in three basic forms, direct combustion of pulverized coals (PC),combustion of coal in a suspended bed of coal and inert matter, and coal gasiÞcation. The pulverizedcoal (PC) plant, the most common form of coal combustion, has the capability for much improvedefÞciency even with full ßue gas desulfurization (FGD), because materials technology has now advancedto the point where higher steam pressures and temperatures are possible. In the United States, Europe,Japan, and Russia, the advanced superÞcial PC plant is moving ahead commercially.
Worldwide, the application of atmospheric and pressurized ßuidized bed combustion (FBC) plantshas increased, and such plants offer reductions in both SO2 and NOx while permitting the efÞcientcombustion of vast deposits of low-rank fuels such as lignites. In the United States, there are now over150 large operating units for power generation, and throughout Europe, China, and the former SovietUnion countries small FBC units have been extensively deployed.
Coal gasiÞcation power plants exist at the 100 and 160 MW levels and are planned up to 450 MW.Much of the impetus is now coming from the U.S. Department of Energy (DOE) clean coal programwhere three gasiÞcation projects are in progress and four more are planned, and gasiÞcation plants areunder construction in Europe and Japan. GasiÞcation not only leads to minimum atmospheric and solidemissions, but also provides an opportunity to take advantage of gas turbine advances. With the rapida, advances now being introduced in CT technology, the coal gasiÞcation option is a leading turn-of-the-century candidate for new plant construction.
Clean Coal Technology Development
At an increasing rate in the last few years, innovations have been developed and tested that are aimedat reducing emissions through improved combustion and environmental control, in the near term, and,in the longer term, through fundamental changes in the way coal is preprocessed before converting its
© 1999 by CRC Press LLC

8-78 Section 8
chemical energy to electricity. Such technologies are referred to as Òclean coal technologiesÓ describedas a family of precombustion, combustion/conversion, and postcombustion technologies (Torrens, 1990).They are designed to provide the coal user with added technical capabilities and ßexibility and the worldwith an opportunity to exploit our most abundant fossil source. They can be categorized as
¥ Precombustion, where sulfur and other impurities are removed from the fuel before it is burned;
¥ Combustion, where techniques to prevent pollutant emissions are applied in the boiler while thecoal burns;
¥ Postcombustion, where the ßue gas released from the boiler is treated to reduce its content ofpollutants;
¥ Conversion, where coal, rather than being burned, is changed into a gas or liquid that can becleaned and used as a fuel.
Coal Cleaning
Cleaning of coal to remove sulfur and ash is well established in the United States with more than 400operating plants, mostly at the mine. Coal cleaning removes primarily pyritic sulfur (up to 70% SO2
reduction is possible) and in the process increases the heating value of the coal, typically about 10%but occasionally 30% or higher. Additionally, if slagging is a limiting item, increased megawatts maybe possible, as occurred at one station which increased generation from 730 to 779 MW. The removalof organic sulfur, chemically part of the coal matrix, is more difÞcult, but may be possible usingmicroorganisms or through chemical methods; research is underway (Couch, 1991). Finally, heavy metaltrace elements can be removed also, conventional cleaning removing (typically) 30 to 80% of arsenic,mercury, lead, nickel, antimony, selenium, and chromium.
Cleaning of Low-Rank Coal
With large deposits of high-moisture, and sometimes high-ash, low-rank coals and lignites, there isinterest, but as yet no large-scale activity, in cleaning these coals. Improvement in heating value andreduction of boiler slagging and fouling problems are outcomes. Economics will decide whetherprecleaning or direct combustion (perhaps in a ßuidized bed) will be the future choice. Large subbitu-minous and lignite Þelds exist in the United States, the former U.S.S.R., Germany, and Eastern Europe,as Table 8.6.1 indicates.
TABLE 8.6.1 World Coal Production
Country
Total Coal Production,
MtBituminous,
Mt
Subbituminous and Lignite,
Mt
Approximate Amount
Bituminous Cleaned, %
China 1018 985 33 20United States 833 581 252 55Former U.S.S.R. 760 550 210 60Germany 487 77 410 95Poland 266 193 73 40Australia 224 179 45 75South Africa 214 214 0 ÑIndia 191 180 11 20Czechoslovakia 126 26 100 ÑU.K. 100 100 0 75Canada 61 33 28 Ñ
Source: World Energy Conference, 1989.
© 1999 by CRC Press LLC

Energy Conversion 8-79
Pulverized Coal Plants
There has been a perception that the PC power plant has come to the end of the road, that advancedcoal technologies will quite soon make obsolete the PC plant with a scrubber, whose efÞciency hoversaround 35%. This perception may be premature. In fact, the PC plant has the capability for muchimproved heat rate (about 8500 Btu/kWh) even with full FGD. Beyond these units, the PC-Þred CCwith topping turbine (Figure 8.6.1) has a projected heat rate of 7200 Btu/kWhr, which includes fullscrubbing capability. The PC plant is a proven, reliable power source with unit capabilities demonstratedat more than to 1000 MW using a single-shaft steam turbine. One plant, commercially available now,uses steam at 4500 psig and 1100°F, all ferritic materials for major boiler and turbine components,leading-edge technology in environmental controls, and the latest techniques in waste heat utilization(Poe et al., 1991). It is modular, fuel ßexible, and designed for on/off cycling capability.
Higher steam temperatures (to 1150°F) and supercritical steam pressures are an important aspectof the modern advanced PC plant. They are possible now because of advances in ferritic materialstechnology that will extend life, provide greater creep and fatigue strength, and be resistant to temperembrittlement and, in the boiler, to coal ash corrosion (Armor et al., 1988).
Of particular note are
¥ Coextruded tubing or monotubing for superheaters and reheaters, resistant to coal ash corrosion.
¥ Super-9-chrome steel (P91), for steam piping, valves, headers, casings.
¥ Improved creep-resistant 12-chrome forgings for high-pressure/intermediate-pressure (HP/IP)turbines.
¥ ÒSupercleanÓ 3.5 NiCrMoV rotors for low-pressure (LP) turbines, resistant to temper embrittle-ment.
Built in 1959, Eddystone 1 at PECO Energy was, and still is, the supercritical power unit with thehighest steam conditions in the world. When constructed in the early 1960s, Eddystone 1 had a mainsteam pressure of 5000 psi, and main steam temperature of 1200°F. Double reheat of the steam wasemployed. PECO Energy continues to operate Eddystone 1, an impressive achievement for a prototypeunit. More-recent advanced plants include the Chuba Electric Kawagoe unit in Japan, a 700-MW double-reheat supercritical with steam conditions of 4750 psi, 1050°F, and the Esbjerg unit of Elsam in Denmark,a 400-MW supercritical with steam conditions of 3700 psi, 1040°F. Both plants use advanced ferriticsteels for turbine and boiler thick wall components. There are over 170 supercritical units in the UnitedStates, more than 220 in Russia (Oliker and Armor 1992), and over 60 in Japan. A number are installedin Germany, Denmark, Holland, and other European countries, and increasingly in the Far East.
FIGURE 8.6.1 A PC CC with topping steam turbine has a projected heat rate of 7200 Btu/kWhr. The air turbineuses 1800°F air, or 2300°F air with supplemental Þring. The topping turbine uses steam at 1300°F.
© 1999 by CRC Press LLC
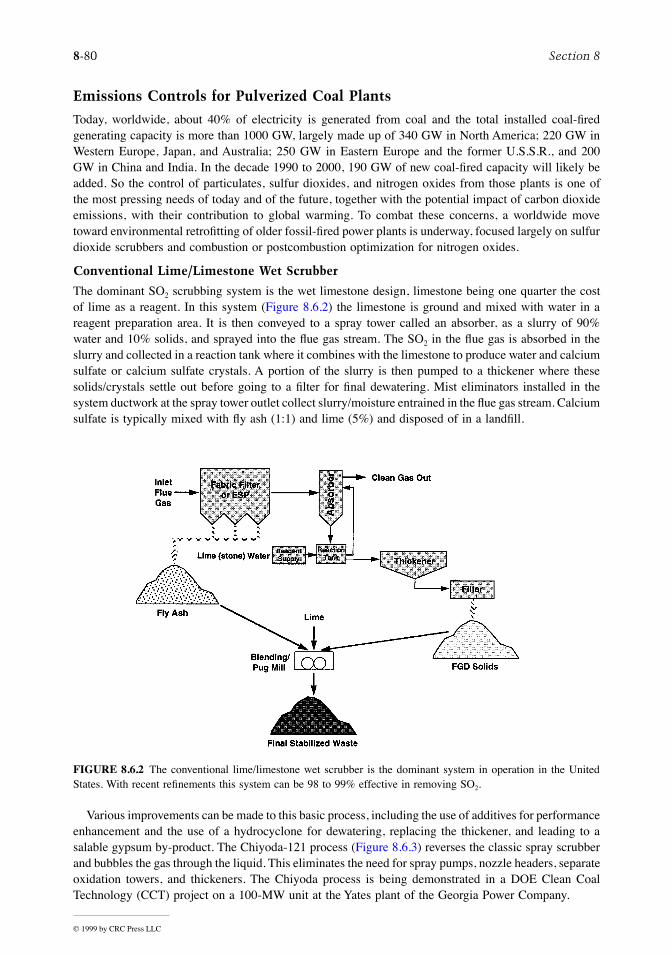
8-80 Section 8
Emissions Controls for Pulverized Coal Plants
Today, worldwide, about 40% of electricity is generated from coal and the total installed coal-Þredgenerating capacity is more than 1000 GW, largely made up of 340 GW in North America; 220 GW inWestern Europe, Japan, and Australia; 250 GW in Eastern Europe and the former U.S.S.R., and 200GW in China and India. In the decade 1990 to 2000, 190 GW of new coal-Þred capacity will likely beadded. So the control of particulates, sulfur dioxides, and nitrogen oxides from those plants is one ofthe most pressing needs of today and of the future, together with the potential impact of carbon dioxideemissions, with their contribution to global warming. To combat these concerns, a worldwide movetoward environmental retroÞtting of older fossil-Þred power plants is underway, focused largely on sulfurdioxide scrubbers and combustion or postcombustion optimization for nitrogen oxides.
Conventional Lime/Limestone Wet Scrubber
The dominant SO2 scrubbing system is the wet limestone design, limestone being one quarter the costof lime as a reagent. In this system (Figure 8.6.2) the limestone is ground and mixed with water in areagent preparation area. It is then conveyed to a spray tower called an absorber, as a slurry of 90%water and 10% solids, and sprayed into the ßue gas stream. The SO2 in the ßue gas is absorbed in theslurry and collected in a reaction tank where it combines with the limestone to produce water and calciumsulfate or calcium sulfate crystals. A portion of the slurry is then pumped to a thickener where thesesolids/crystals settle out before going to a Þlter for Þnal dewatering. Mist eliminators installed in thesystem ductwork at the spray tower outlet collect slurry/moisture entrained in the ßue gas stream. Calciumsulfate is typically mixed with ßy ash (1:1) and lime (5%) and disposed of in a landÞll.
Various improvements can be made to this basic process, including the use of additives for performanceenhancement and the use of a hydrocyclone for dewatering, replacing the thickener, and leading to asalable gypsum by-product. The Chiyoda-121 process (Figure 8.6.3) reverses the classic spray scrubberand bubbles the gas through the liquid. This eliminates the need for spray pumps, nozzle headers, separateoxidation towers, and thickeners. The Chiyoda process is being demonstrated in a DOE Clean CoalTechnology (CCT) project on a 100-MW unit at the Yates plant of the Georgia Power Company.
FIGURE 8.6.2 The conventional lime/limestone wet scrubber is the dominant system in operation in the UnitedStates. With recent reÞnements this system can be 98 to 99% effective in removing SO2.
© 1999 by CRC Press LLC
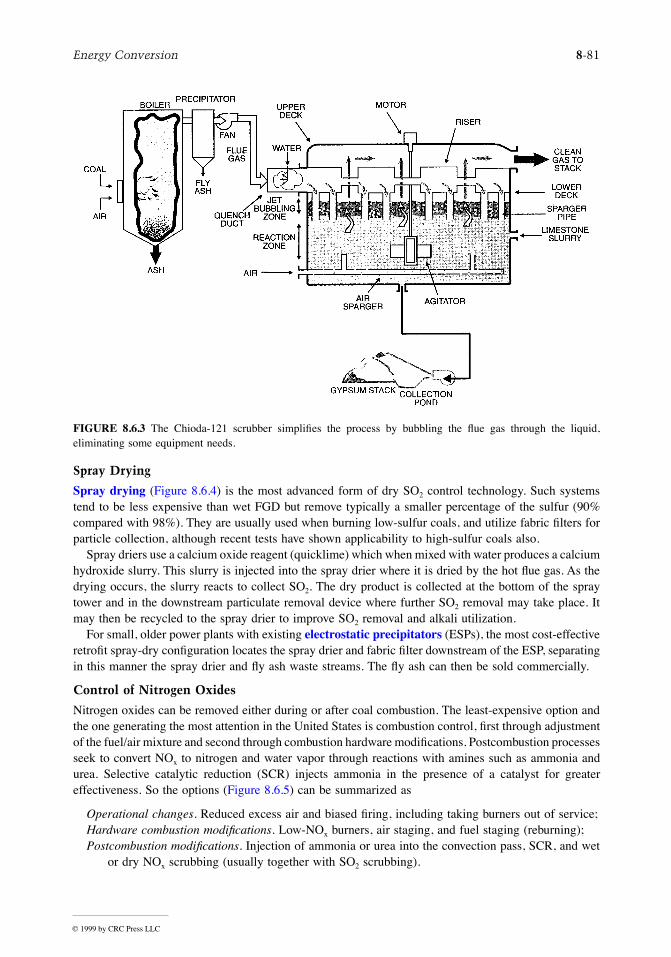
Energy Conversion 8-81
Spray Drying
Spray drying (Figure 8.6.4) is the most advanced form of dry SO2 control technology. Such systemstend to be less expensive than wet FGD but remove typically a smaller percentage of the sulfur (90%compared with 98%). They are usually used when burning low-sulfur coals, and utilize fabric Þlters forparticle collection, although recent tests have shown applicability to high-sulfur coals also.
Spray driers use a calcium oxide reagent (quicklime) which when mixed with water produces a calciumhydroxide slurry. This slurry is injected into the spray drier where it is dried by the hot ßue gas. As thedrying occurs, the slurry reacts to collect SO2. The dry product is collected at the bottom of the spraytower and in the downstream particulate removal device where further SO2 removal may take place. Itmay then be recycled to the spray drier to improve SO2 removal and alkali utilization.
For small, older power plants with existing electrostatic precipitators (ESPs), the most cost-effectiveretroÞt spray-dry conÞguration locates the spray drier and fabric Þlter downstream of the ESP, separatingin this manner the spray drier and ßy ash waste streams. The ßy ash can then be sold commercially.
Control of Nitrogen Oxides
Nitrogen oxides can be removed either during or after coal combustion. The least-expensive option andthe one generating the most attention in the United States is combustion control, Þrst through adjustmentof the fuel/air mixture and second through combustion hardware modiÞcations. Postcombustion processesseek to convert NOx to nitrogen and water vapor through reactions with amines such as ammonia andurea. Selective catalytic reduction (SCR) injects ammonia in the presence of a catalyst for greatereffectiveness. So the options (Figure 8.6.5) can be summarized as
Operational changes. Reduced excess air and biased Þring, including taking burners out of service;Hardware combustion modiÞcations. Low-NOx burners, air staging, and fuel staging (reburning);Postcombustion modiÞcations. Injection of ammonia or urea into the convection pass, SCR, and wet
or dry NOx scrubbing (usually together with SO2 scrubbing).
FIGURE 8.6.3 The Chioda-121 scrubber simpliÞes the process by bubbling the ßue gas through the liquid,eliminating some equipment needs.
© 1999 by CRC Press LLC

8-82 Section 8
Low-NOx burners can reduce NOx by 50% and SCR by 80%, but the low-NOx burner option is muchmore cost-effective in terms of cost per ton of NOx removed. Reburning is intermediate in cost perremoved ton and can reduce NOx 50 or 75% in conjunction with low-NOx burners.
Fluidized Bed Plants
Introduced nearly 30 years ago, the ßuidized bed combustion boiler has found growing application forpower generation. From the Þrst FBC boiler, generating 5000 lb/hr of steam in 1967, the technologyhas matured to the 250-MW-size units available today. In North America more than 170 units now
FIGURE 8.6.4 Spray driers use a calcium oxide reagent mixed with water, which is dried by the ßue gas. A dryproduct is collected in a fabric Þlter.
FIGURE 8.6.5 Control options for NOx include operational, hardware, and postcombustion modiÞcations.
© 1999 by CRC Press LLC

Energy Conversion 8-83
generate in excess of 6000 MW. Burning coal in a suspended bed with limestone or dolomite permitseffective capture of sulfur, and fuel ßexibility allows a broad range of opportunity fuels. These fuelsmight include coal wastes (culm from anthracite, gob from bituminous coal), peat, petroleum coke, anda wide range of coals from bituminous to lignite. A low (1500°F) combustion temperature leads to lowNOx formation. The salient features of atmospheric ßuidized bed boilers, compared with a PC boiler,are shown in Figure 8.6.6.
Utility-size demonstration projects at the Tennessee Valley Authority in 1989 (Shawnee, 160 MW)(Manaker, 1992) and Northern States Power in 1986 (Black Dog, 133 MW) (Hinrichsen, 1989) areexamples of successful atmospheric bubbling bed units. The Black Dog unit has been dispatched in adaily cycling mode and has successfully Þred a blend of coal and petroleum coke. But the focus ofatmospheric FBC (AFBC) in the United States is now on the circulating ßuid bed (CFB). In fact, morethan 70% of operating ßuid bed boilers in the United States are of the circulating type. The CFB unitat Nucla (Tri-State G&T Association) (Blunder, 1989) has been successful in demonstrating the tech-nology at the 110-MW level, and commercial CFB plants have now reached 250 MW in size. Mostßuidized bed units for electricity generation are being installed by independent power producers in the50- to 100-MW-size range, where the inherent SO2 and NOx advantages over the unscrubbed PC planthave encouraged installations even in such traditional non-coal arenas as California (Melvin and Fried-man, 1994). Worldwide, the AFBC boiler is employed largely for steam heat, with hundreds of them inoperation in Russia and India, and thousands in China. The extension of the concept of ßuidized bedsto units where the fuel mixture is burned under several atmospheres pressure (PFBC) has now openedthe way to smaller modular units with opportunities to move to efÞcient PFBC CCs.
Atmospheric Fluidized Bed Combustion
In the bubbling bed version of the AFBC, the fuel and inert matter, together with limestone or dolomitefor SO2 capture, is suspended through the action of ßuidizing air, which ßows at a velocity of 3 to 8ft/sec in essentially a one-pass system. CFBs differ from bubbling beds in that much of the bed materialpasses through a cyclone separator before being circulated back to the boiler (Figure 8.6.7). In-bed tubesare generally not used for CFB units, permitting a much higher ßuidizing velocity of 16 to 26 ft/sec.Since the early AFBC designs, attention has been directed toward increasing unit efÞciency, and reheatdesigns are now usual in large units. When SO2 capture is important, a key parameter is the ratio ofcalcium in the limestone to sulfur in coal. Typical calcium-to-sulfur ratios for 90% SO2 reduction are
FIGURE 8.6.6 An illustration of the distinguishing features of PC and ßuidized bed boilers. Noticeable in thisdiagram are the in-bed tubes characteristic of bubbling beds and the cyclone separator of the circulating bed.
© 1999 by CRC Press LLC

8-84 Section 8
in the range of 3.0 to 3.5 for bubbling beds and 2.0 to 2.5 for circulating beds. This depends on the fuel,however, and the 200-MW CFB units at the Conoco/Entergy plant in Lake Charles, Louisiana burning100% petroleum coke (4.5% S), have a Ca/S ratio of below 1.7 for more than 90% sulfur capture. NOx
levels in AFBCs are inherently low and nominally less than 0.2 lb/MM Btu.It is important to note that for CFBs, boiler efÞciencies can be as high as a PC unit (Table 8.6.2). In
fact, designs now exist for AFBCs with supercritical steam conditions, with prospects for cycles up to4500 psia, 1100°F with double reheat (Skowyra et al., 1995).
FIGURE 8.6.7 A Pyropower circulating ßuid bed boiler installed at the ACE Cogeneration Company at Trona,California. This 108-MW unit burns low sulfur, western bituminous coal with limestone in a bed which circulatesback to the boiler after passing through a cyclone separator.
© 1999 by CRC Press LLC

Energy Conversion 8-85
Pressurized Fluidized Bed Combustion
In a PFBC CC unit (Figure 8.6.8), coal in a ßuid bed is burned with dolomite or limestone in a pressurizedsteel chamber, raising steam for a steam turbine generator. The pressurized ßue gases are expandedthrough a gas turbine. Commercial plants at about the 80-MW level in Sweden, the United States, andSpain have demonstrated that bubbling bed PFBC plants with a calcium-to-sulfur molar ratio of about1.5 offer sulfur capture up to 95%, together with inherently low NOx emissions due to low combustiontemperatures. Cleanup of the ßue gas before entry to the gas turbines is a key technical objective, andÞrst-generation units have used cyclones together with gas turbines ruggedized with special bladecoatings. For more-advanced, higher-efÞciency PFBC systems, hot-gas cleanup technology, where thegas is directed through large ceramic Þlter units, will likely be needed.
To date, the 80-MW units at Vaertan (Sweden) and Escatron (Spain) and the 70-MW unit at Tidd(AEP) have operated satisfactorily, and larger units up to 350 MW are now under development. Themodular aspect of the PFBC unit is a particularly attractive feature leading to short construction cyclesand low-cost power. This was particularly evident in the construction of the Tidd plant, which Þrstgenerated power from the CC on November 29, 1990. The heat rate and capital cost of the PFBC plantare forecast to reach very competitive levels which, when combined with shortened construction sched-ules, will position the technology for a role in future generation plans, particularly where modularadditions have advantages.
One promising use for PFBC units is for small in-city cogeneration plants where the inherent sizeadvantages, high efÞciencies, and effective coal gas cleanup approach permit compact plants to beretroÞtted in place of heating boilers, while the small steam turbines can be easily adapted to bothelectricity and hot water supply (Olesen, 1985).
Advanced PFBCs
In conventional PFBC plants, the overall cycle efÞciency is limited to less than 42%. That is becausethe operating temperature of the combustor Ñ which must be held to 1650°F (900°C) or less to avoidsintering the ash and releasing alkali metals that could foul or corrode the gas turbine Ñ in effect setsthe gas turbine inlet temperature far below the 2350°F (1290°C) or so featured in the most-efÞcientheavy-frame machines currently in use Þring natural gas or oil.
TABLE 8.6.2 Typical Boiler EfÞciencies, PC and Fluidized Beds
Calculated Heat Loss %
Loss/Gain Parameter PC
Highest-EfÞciency
CFB
Lowest- EfÞciency
CFBBubbling
Bed
Moisture in limestone NA 0.06 0.10 0.10Calcination NA 1.02 1.69 2.70Sulfation credit NA Ð1.60 Ð1.60 Ð1.60Unburned carbon 0.25 0.50 2.0 4.0Heat in dry ßue gas 5.28 5.57 5.60 5.75Moisture in fuel 1.03 1.03 1.03 1.03Moisture from burning H2 41.9 4.19 4.19 4.19Radiation and convection 0.30 0.30 0.80 0.30Moisture in air 0.13 0.14 0.14 0.14Sensible heat in boiler ash 0.03 0.09 0.76 0.50Bottom ash 0.05 NA NA NAFan-power credit Ð0.25 Ð0.75 Ð0.40 Ð0.50Pulverizer/crusher power gain Ð0.20 NA NA NATotal losses/gains 10.81 10.55 14.31 16.51
Overall boiler efÞciency, % 89.19 89.45 85.69 83.49
Source: POWER, January 1987.
© 1999 by CRC Press LLC

8-86 Section 8
Increasing the inlet temperature of the gas turbine, which typically provides 20 to 25% of the powerin a PFBC plant, could raise the overall cycle efÞciency to more than 45%. A simple means of boostingthe ßue gas temperature would be to Þre a topping fuel, such as natural gas, ahead of the gas turbine.But 2350°F would be well above the ash-softening temperature, so high temperature, HP Þltrationsystems would be essential to remove all particulate matter before Þring the natural gas.
A further advance would be to use gas from coal rather than natural gas as the topping fuel. The coalwould be pyrolyzed in a low-oxygen environment under pressure to produce both a low-Btu fuel gasand a residual char. The fuel gas would be passed through its own hot-gas cleanup Þlters before beingÞred in a topping combustor ahead of the gas turbine; the char would be burned in a circulating bedPFBC, from which the ßue gas would also be Þltered and then combined with the topping cycle gasstream. (Or the char could be simply Þred in an AFBC.) With net heat rates below 7600 Btu/kWhr (45%efÞciency), carbon dioxide emissions would be correspondingly low.
A U.S. DOE CCT project known as the Four Rivers Energy Modernization Project, involves buildinga Foster-Wheeler 95-MW advanced circulating-type PFBC unit at the Air Products chemical manufac-turing facility in Calvert City, Kentucky. Steam from the unit, which will feature a coal-gas-Þred toppingcombustor and a hot-gas cleanup system, will be used in chemical production, and the power will besold to the Tennessee Valley Authority. The project is scheduled to begin commercial operation inOctober, 1998 (Carpenter and DelleÞeld, 1994).
Gasification Plants
One option of growing interest to coal-burning utilities is that of coal gasiÞcation. After the EPRI CoolWater demonstration in 1984 at the 100-MW level, the technology has moved ahead in the United Stateslargely through demonstrations under the CCT program (U.S. DOE, 1994). Overseas, the 250-MWBuggenham plant in Holland is now operational, and the PSI/Destec 262-MW and TECO Energy 250-MW gasiÞcation plant demonstrations are also on-line. Beyond this, there is a 300-MW gasiÞcation unitscheduled for Endesa, Spain and a 330-MW unit for RWE in Germany (Figure 8.6.9).
FIGURE 8.6.8 Pressurized ßuidized bed with combined cycle. This 70-MW system has operated at the Tidd plantof American Electric Power.
© 1999 by CRC Press LLC

Energy Conversion 8-87
GasiÞcation-based plants have among the lowest emissions of pollutants of any central station fossiltechnology. Through use of the efÞciency advantages of CCs, CO2 emissions are also low. Fuel ßexibilityis an additional beneÞt since the gasiÞer can accommodate a wide range of coals, plus petroleum coke.Integrated gasiÞcation CC (IGCC) plants permit a hedge against long-term increases in natural gas pricessince natural gas-Þred CTs can be installed initially, and gasiÞers at a later time when a switch to coalbecomes prudent (Douglas, 1986).
The pioneering Cool Water plant, the Þrst of its kind in the world, operated for more than 4 years,gasifying 1.1 million tons of coal and producing 2.8 million MWhr of electricity. The project was acollaborative effort of the industry involving the utility (Southern California Edison), equipment man-ufacturers (Texaco, General Electric), and consultants/research consortia (Bechtel, EPRI, and others).Particularly notable was the achievement of exceptionally low levels of emissions of SO2, NOx, andparticulates, as shown in Figure 8.6.10.
Basically, IGCC plants replace the traditional coal combustor with a gasiÞer and gas turbine. Ultra-low emissions are realized, over 99% of the sulfur in the coal being removed before the gas is burnedin the gas turbine. A gasiÞcation cycle can take advantage of all the technology advances being madein CTs and steam turbines, so as to enhance overall cycle efÞciency. Net system efÞciencies of 45% areexpected to be demonstrated by the turn of the century, and when, in the next decade, the fuel cell beginsto replace the gas turbine, plant efÞciencies will climb to the 60% level. Major demonstrations areunderway, as part of the CCT program, at Sierra PaciÞc Power, Pinon Pine (a KRW 99-MW air-blown,pressurized, ßuidized bed coal gasiÞer); Tampa Electric, Polk County (a Texaco, 250-MW oxygen-blown,entrained-ßow gasiÞer); at Tamco Power, Toms Creek (a 190-MVV joint gasiÞcation/PC plant with aTampella Power ßuidized bed gasiÞer); and at PSI Energy/Destec Energy, Wabash River (a 262-MWplant based on the Destec two-stage, entrained-ßow, oxygen-blown gasiÞer). More-detailed descriptionsof the Pinon Pine and Polk County gasiÞcation systems follow.
Pinon Pine IGCC
At the Sierra PaciÞc Power Pinon Pine plant (Figure 8.6.11), dried and crushed coal is introduced intoa pressurized, air-blown, ßuidized bed gasiÞer. Crushed limestone is added to the gasiÞer to capture aportion of the sulfur and to inhibit conversion of fuel nitrogen to ammonia. The sulfur reacts with thelimestone to form calcium sulÞde, which, after oxidation, exits along with the coal ash in the form ofagglomerated particles suitable for landÞll.
FIGURE 8.6.9 By building on the early success of the 100-MW Cool Water gasiÞcation-CC plant in California,demonstrations in the 250 to 350 MW range will be carried out in the 1995 to 2000 time frame.
© 1999 by CRC Press LLC

8-88 Section 8
Hot, low-Btu coal gas leaving the gasiÞer passes through cyclones, which return most of the entrainedparticulate matter to the gasiÞer. The gas, which leaves the gasiÞer at about 1700°F, is cooled to about1100°F before entering the hot-gas cleanup system. During cleanup, virtually all of the remainingparticulates are removed by ceramic candle Þlters, and Þnal traces of sulfur are removed by reactionwith metal oxide sorbent.
The hot, cleaned gas then enters the CT, which is coupled to a generator designed to produce 61 MW.Exhaust gas is used to produce steam in a heat-recovery steam generator. Superheated HP steam drivesa condensing steam turbine/generator designed to produce about 46 MW.
Owing to the relatively low operating temperature of the gasiÞer and the injection of steam into thecombustion fuel stream, the NOx emissions are likely to be below 0.053 lb/M Btu. Because of thecombination of in-bed sulfur capture and hot-gas cleanup, SO2 emissions will be below 0.045 lb/M Btu(98% reduction).
FIGURE 8.6.10 Tests at Cool Water on four coals show emissions of SO2, NOx, and particulates substantially belowthe Federal New Source Performance Standards.
© 1999 by CRC Press LLC

Energy Conversion 8-89
At Pinon Pine, 880 ton/day of coal are converted into 107 MW (gross), or 99 MW (net), for exportto the grid. Western bituminous coal (0.5 to 0.9% sulfur) from Utah is the design coal although testswill be done using West Virginia or Pennsylvania bituminous coal containing 2 to 3% sulfur.
Polk County IGCC
The Texaco pressurized, oxygen-blown, entrained-ßow gasiÞer will be used at the Tampa ElectricPolk County plant to produce a medium-Btu fuel gas (Figure 8.6.12). Coal/water slurry and oxygen arecombined at high temperature and pressure to produce a high-temperature syngas. Molten coal ash ßowsout of the bottom of the vessel and into a water-Þlled quench tank, where it is turned into a solid slag.The syngas from the gasiÞer moves to a high-temperature heat-recovery unit which cools the gases.
The cooled gases ßow to a particulate-removal section before entering gas cleanup trains. A portionof the syngas is passed through a moving bed of metal oxide absorbent to remove sulfur. The remainingsyngas is further cooled through a series of heat exchangers before entering a conventional gas cleanuptrain where sulfur is removed by an acid-gas removal system. These cleanup systems combined areexpected to maintain sulfur levels below 0.21 lb/M Btu (96% capture). The cleaned gases are then routedto a CC system for power generation. A gas turbine generates about 192 MW. Thermally generated NOx
is controlled to below 0.27 lb/M Btu by injecting nitrogen as a diluent in the combustion section of theturbine. A heat-recovery steam generator uses heat from the gas turbine exhaust to reduce HP steam.This steam, along with the steam generated in the gasiÞcation process, is routed to the steam turbine togenerate an additional 120 MW. The IGCC heat rate for this demonstration is expected to be approxi-mately 8600 Btu/kWhr (40% efÞcient).
The demonstration project involves only the Þrst 250-MW portion of the planned 1150-MW PolkCounty power station. Coals being used in the demonstration are Illinois 6 and Pittsburgh 8 bituminouscoals having sulfur contents ranging from 2.5 to 3.5%.
FIGURE 8.6.11 Integrated gasiÞcation CC at Sierra PaciÞc Power, Pinon Pine plant. This uses a KRW air-blown,pressurized ßuidized bed coal gasiÞer, and produces 99 MW (net).
© 1999 by CRC Press LLC

8-90 Section 8
By-products from the process Ñ sulfuric acid and slag Ñ can be sold commercially, sulfuric acidby-products as a raw material to make agricultural fertilizer and the nonleachable slag for use in rooÞngshingles and asphalt roads and as a structural Þll in construction projects.
Buggenum IGCC
Meanwhile, tests are in progress on the 250-MW IGCC plant in Buggenum, Netherlands. After successfuloperations running on natural gas, a switch was made to coal gas using Columbia coals. Buggenumcomprises a 2000-ton/day single reactor coal gasiÞcation unit and an air separation plant able to produce1700 ton/day of 95% pure oxygen. Syngas drives a Siemens CC power unit, including a 156-MW V94.2gas turbine and a 128-MW steam turbine. The gasiÞer, operating at 28 bar pressure and 2700°F isdesigned to produce syngas containing 42% nitrogen, 25% carbon monoxide, and 12% hydrogen, witha combustion value of 4.3 MJ/kg.
The environmental constraints are deÞned by permit requirements Þxing upper limits of SO2 at 0.22g/kWhr, NOx at 0.62g/kWhr, and particulates at 0.007 g/kWhr.
Key steps for limiting emissions include
¥ Removing ßy ash with cyclone and candle Þlters after gas cooling;
¥ Removing halogens and other soluble pollutants with water scrubbing;
¥ Desulfurizing gas by catalytic and chemical processes. Sulfur is Þxed in sulÞnol-M solvent, whichis further treated to produce elemental sulfur; and
¥ Desulfurized gas is mixed with nitrogen from the air separation units and saturated with watervapor to reduce its lower heating value from about 11,000 to 4300 kJ/kg greatly reducing NOx
production.
FIGURE 8.6.12 Integrated gasiÞcation CC at Tampa Electric, Polk County plant. A Texaco oxygen-blown gasiÞeris used. Total net generation is 250 MW.
© 1999 by CRC Press LLC

Energy Conversion 8-91
Combustion Turbine Plants
CT-based plants are the fastest growing technology in power generation. Through the turn of the centurynatural gas-Þred CTs and CCs burning gas will account for 50 to 70% of the 900 to 1000 GW of newgeneration to be ordered worldwide. Almost all of these CT and CC plants will be gas Þred, leading toa major expansion of gas for electricity generation (Armor et al., 1992).
It is likely that CTs and CCs will grow steadily more important in all generation regimes, peaking,midrange, and base load. If the present 2300°F Þring temperature machines operate reliably and durably,CT and CC plants will begin to replace older steam plants and uneconomic nuclear plants. So until theemergence of large-scale fuel cells, CT plants will be a competitive choice for new fossil generation,and advanced CT cycles, with intercooling, reheat, possibly chemical recuperation, and most likely withhumidiÞcation, will spearhead the drive to higher efÞciencies and lower capital costs. GasiÞcation, whichguarantees a secure bridge to coal in the near term, will come into its own if natural gas prices riseunder demand pressure, and by 2015 coal through gasiÞcation may be the economic fuel for a signiÞcantfraction of new base-load generation. The rate at which these trends develop depends in large measureon the speed of deregulation and advent of competition in the electricity industry.
Modern gas turbines for power generation are mostly heavy-frame machines, with ratings in a simplecycle conÞguration around 150 to 170 MW for the high Þring temperatures (~2300°F) of the ÒF-classÓmachines. EfÞciencies (LHV) are 36 to 38% in simple cycles. In CCs, the units are 220 to 350 MW insize and 53 to 55% efÞcient. The next generation of CTs, with efÞciencies from 57 to 60% has recentlybeen announced (Table 8.6.3). Smaller-scale aeroderivative machines have beneÞted from turbofanengines designed for wide-body aircraft and today are available in ratings of 35 to 65 MW and withefÞciencies of 40% or more for turbine inlet temperatures around 2250°F. Beyond this, work is underwayto design and build an advanced aeroderivative turbine, and three teams are involved: United Tech-nologies/Fluor Daniel is looking at a humid air turbine at 200 MW and 55% efÞciency; Rolls-Royce/Bechtel is studying an intercooled, regenerative design based on the Aero-Trent machine; andGeneral Electric/Bechtel is melding the GE LM 6000 and the GE heavy-frame designs to achieve closeto 60% efÞciency in a 100-MW combined cycle.
Recently, General Electric announced a new concept which uses steam from the steam turbine to coolthe gas turbine blades permitting a Þring temperature of 2600°F. This avoids the losses due to the normalmethod of diverting compressor air for cooling. This ÒHÓ class turbine, it is said, will break the 60%barrier for a 400-MW CC. Comparison of the F- and H-class machines for General Electric is shownin Table 8.6.4.
TABLE 8.6.3 Modern Gas Turbine SpeciÞcations
Large Heavy-Frame Machines
Simple Cycle Combined Cycle
Turbine MWEfÞciency %
(LHV) MWEfÞciency %
(LHV)
Current
GE GE7FA/9FA 168/227 36.0 253/351 55.0W/MHI W501F/701F 164/237 38.1 236/337 53.7Siemens V84.3/94.3 154/222 36.2 227/328 54.5
New
ABB GT24/26 165/240 37.6 250/365 57.2Siemens V84.3A/94.3A 170/240 38.0 254/359 57.0W/MHI W501G/701G 230/255 38.5 345/380 58.0GE GE7G/9G 240/282 39.5 350/420 58.0GE GE7H/9H Ñ Ñ 400/480 60.0
© 1999 by CRC Press LLC
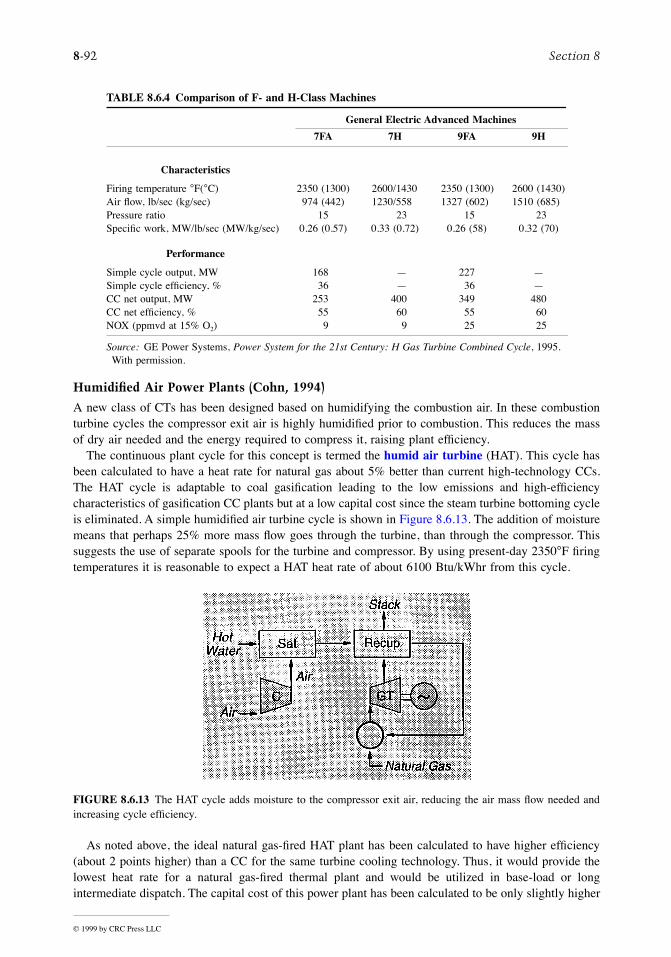
8-92 Section 8
Humidified Air Power Plants (Cohn, 1994)
A new class of CTs has been designed based on humidifying the combustion air. In these combustionturbine cycles the compressor exit air is highly humidiÞed prior to combustion. This reduces the massof dry air needed and the energy required to compress it, raising plant efÞciency.
The continuous plant cycle for this concept is termed the humid air turbine (HAT). This cycle hasbeen calculated to have a heat rate for natural gas about 5% better than current high-technology CCs.The HAT cycle is adaptable to coal gasiÞcation leading to the low emissions and high-efÞciencycharacteristics of gasiÞcation CC plants but at a low capital cost since the steam turbine bottoming cycleis eliminated. A simple humidiÞed air turbine cycle is shown in Figure 8.6.13. The addition of moisturemeans that perhaps 25% more mass ßow goes through the turbine, than through the compressor. Thissuggests the use of separate spools for the turbine and compressor. By using present-day 2350°F Þringtemperatures it is reasonable to expect a HAT heat rate of about 6100 Btu/kWhr from this cycle.
As noted above, the ideal natural gas-Þred HAT plant has been calculated to have higher efÞciency(about 2 points higher) than a CC for the same turbine cooling technology. Thus, it would provide thelowest heat rate for a natural gas-Þred thermal plant and would be utilized in base-load or longintermediate dispatch. The capital cost of this power plant has been calculated to be only slightly higher
TABLE 8.6.4 Comparison of F- and H-Class Machines
General Electric Advanced Machines
7FA 7H 9FA 9H
Characteristics
Firing temperature °F(°C) 2350 (1300) 2600/1430 2350 (1300) 2600 (1430)Air ßow, lb/sec (kg/sec) 974 (442) 1230/558 1327 (602) 1510 (685)Pressure ratio 15 23 15 23SpeciÞc work, MW/lb/sec (MW/kg/sec) 0.26 (0.57) 0.33 (0.72) 0.26 (58) 0.32 (70)
Performance
Simple cycle output, MW 168 Ñ 227 ÑSimple cycle efÞciency, % 36 Ñ 36 ÑCC net output, MW 253 400 349 480CC net efÞciency, % 55 60 55 60NOX (ppmvd at 15% O2) 9 9 25 25
Source: GE Power Systems, Power System for the 21st Century: H Gas Turbine Combined Cycle, 1995. With permission.
FIGURE 8.6.13 The HAT cycle adds moisture to the compressor exit air, reducing the air mass ßow needed andincreasing cycle efÞciency.
© 1999 by CRC Press LLC

Energy Conversion 8-93
than that of a CC. However, the anticipated development cost for the ideal turbomachinery has beenestimated to be very high, in excess of $250 million.
In contrast, the CHAT (cascaded humid air turbine) plant utilizes turbine components, which are nowavailable, with few exceptions, in a cascade arrangement that allows them to match together. Thedevelopment cost of the CHAT equipment is currently estimated to be only in the $5 to 10 million range,making its development much more practical.
The HAT and CHAT cycles can be integrated with gasiÞcation. Because these cycles directly incor-porate humidiÞcation, they can make direct use of hot water generated in the gasiÞcation plant, butcannot readily utilize steam. Thus, they match well with the lower-capital-cost, but lower-efÞciency,quench types of gasiÞer. This provides an overall power plant with efÞciency about the same as anIGCC. Moreover, the capital cost of the IGHAT plant has been calculated to be about $150/kW lessthan an IGCC plant. These humidiÞcation cycles have yet to be offered commercially. The main obstacleis the need to demonstrate experimentally low-emission, high-efÞciency, full-scale combustors utilizingvery humid air.
Other Combustion Turbine Cycle Enhancements
There are several variants of the CT-based Brayton cycle which increase plant efÞciency and capacity(Lukas, 1986). Regenerative cycles use storage-type heat exchangers, where porous or honeycomb wallstructures store energy from the hot gases. This is released later to the cold gases. A recuperative cycleuses a heat exchanger where the hot and cold streams are separated by walls through which heat transferoccurs. This is the approach commonly used in CTs allowing gains in efÞciency and reduced fuelconsumption, but no speciÞc output increase.
Intercooling between compressor stages increases useful output by about 30% for a given air massßow, by reducing the volume ßow and increasing available energy to the power turbine. It has minimaleffect on efÞciency, since heat removed must be added back in the combustion chamber, but is commonlyused in conjunction with recuperation.
In a reheat cycle the fuel is introduced at two locations, increasing the total energy available to producework. A combination of intercooling, reheat, and recuperation is shown in Figure 8.6.14.
Steam injection, where the steam is injected directly into the combustion chamber, increases themass ßow through the turbine and results in increased output power. Steam-injected gas turbine (SIGT)cycles have been compared from the viewpoints of efÞciency, power generation, capital and operatingcosts, and environmental impacts with CC systems (Esposito, 1989). Above 50-MW size, it was foundthat CC plants were more economical and achieved signiÞcantly better heat rates, although cooling towerfog, visible plumes, and drift deposition favored SIGT plants for a ßat site.
Capital and Operating Costs of Power Plants
Table 8.6.5 lists typical costs for constructing and operating fossil fuel plants as of 1993. These costsare variable depending on plant design and location; the table assumes a plant in the Northeast UnitedStates burning Pittsburgh bituminous coal. Fuel costs, not listed explicitly, will be affected by the plantefÞciency, listed in the table.
Costs will vary according to type of coal burned, the size of the unit, the plant location in the UnitedStates, and the extent of environmental control employed. In this table, Pittsburgh bituminous coal isassumed, which has 7% ash, 2% sulfur, 5% moisture, and a higher heating value of 13,395 Btu/lb. Wetscrubbers for PC plants use limestone-forced oxidation. Fixed O&M costs include labor, maintenance,and overhead. Variable O&M costs are largely consumables: water, chemicals, other materials.
Summary
The preceding section has described how the future for electric power generation will increasingly bedominated by environmental control needs, putting an emphasis on the base efÞciency of new generationand on heat rate recovery for existing units. The PC-Þred power plant with FGD will remain a focus of
© 1999 by CRC Press LLC

8-94 Section 8
most near-term activity related to upgrades and retroÞts. But new technology, based on coal gasiÞcation,is under development and being tested in a growing number of demonstration plants which promiseextremely low emissions.
FIGURE 8.6.14 Improvement in CT performance is illustrated in this schematic, which combines an intercoolerfor the compressor, with a recuperator using CT exhaust heat, and a reheat cycle for the turbine to improve efÞciency.
TABLE 8.6.5 Cost Projections for Representative Generation Technologies for a Plant in the Northeast U.S.
PC Plants
Plants
Subcritical Wet Scrubber,
300 MWSupercritical Wet
Scrubber, 400 MWAFBC Circulating
Bed, 200 MWPFBC CC, 340 MW
Capital cost (1993),a $/kW 1607 1600 1805 1318Nonfuel O&M costs
Variable, MILLS/kWhr 3.0 2.8 5.4 1.8Fixed, $/kWáyear 46.6 43.1 37.0 37.6
EfÞciency, % (HHV) 36 39 35 41
Coal GasiÞcation CC, 500 MW
Coal GasiÞcation Humid Air Turbine,
500 MW
Coal GasiÞcation Molten Carbonate Fuel Cell, 400 MW
Gas-Fired CC, 225 MW
Capital cost (1993),a $/kW 1648 1447 2082 595Nonfuel O&M costs
Variable, MILLS/kWhr 0.5 1.3 1.1 0.4Fixed, $/kWáyear 49.9 40.4 57.2 26.5
EfÞciency, % (HHV) 42 42 50 46
a Costs of new plants are likely to reduce, in real terms, over the next 10 years due to technology developments and increased worldwide competition for markets in the developing countries. New technologies (PFBC, IGCC, fuel cells) will lower capital costs as production capacity grows.
Source: Technical Assessment Guide, EPRI TR-102275-V1R7, Electrical Power Research Institute, Palo Alto, CA, June, 1993. With permission.
© 1999 by CRC Press LLC

Energy Conversion 8-95
The future for many nations will be based on exploiting the opportunities offered by clean and efÞcientuse of coal. This implies access to the range of new technologies now being tested at large scale in theUnited States and other developed nations. This strategy is both timely and prudent on a global basis,as the world increasingly voices concerns related to carbon combustion.
Base-load, central generation plants will largely be focused in the immediate future on the rapidlydeveloping areas of the world Ñ Asia (particularly China and India) and Latin America. In these areasthe fuel of choice will likely be coal, particularly in Asia, and the generating unit most often will be aconventional PC unit, but also could be an atmospheric or pressurized ßuidized bed unit. In NorthAmerica, Europe, and Japan, gas-Þred central plants using CTs, often in a CC, will dominate throughthe next decade. As the cost of natural gas, relative to coal, increases, this will then encourage theinstallation of gasiÞcation units enabling the enormous world coal reserves to be utilized. Then, sometimeafter the turn of the century, smaller distributed generating sources will begin to emerge, based on gas-Þred fuel cells, small CTs, or possibly photovoltaics. As the economics for the distributed option becomefavorable, these smaller generating units could encourage broad electriÞcation of the developing countriesof the world.
Defining Terms
Aeroderivative turbine: In the 1960s gas turbines derived from military jet engines formed a sourceof utility peaking capacity. Now, modern airline fan-jets are being converted to utility service.These lighter CTs are highly efÞcient and can have low NOx emissions, high pressure ratios, andlow capital cost.
Ash-softening temperature: The tendency for ßy ash to adhere to tube banks is increased as the ashsoftens and melts. The point at which the ash begins to soften is dependent on the type of coaland is difÞcult to predict, depending on the many coal constituents. Slagging and fouling of tubescan lead to severe tube corrosion.
Coal gasiÞcation: Coal can be converted into a mixture of carbon monoxide and hydrogen by burningit with a controlled deÞciency of oxygen. Use of pure oxygen produces a medium-caloriÞc-valuegas, and air a low caloriÞc value gas. This ÒsyngasÓ can then be used to power a CT.
Coextruded tubing: Tubing for superheaters and reheaters must be strong enough to withstand thepressures and temperatures expected, and also corrosion resistant to depositions of ßy ash. Bymaking tubing with a strong inner layer and corrosion-resistant outer layer through an extrusionprocess, both concerns can be dealt with.
Cogeneration: Cogeneration refers to the production of multiple products from a power plant. Typically,process steam, or hot water for heating, is produced in addition to electricity. This approach leadsto high plant utilization, the ÒeffectiveÓ heat rate being 70% or more.
Combined cycle: Power stations which employ both CTs (Brayton cycle) and condensing steam turbines(Rankine cycle) where the waste heat from the CTs generates steam for the steam turbines, arecalled combined cycle plants. Overall plant efÞciency improves.
Electrostatic precipitators: Flue gas particles, when electrically charged in an ionized gas ßow, collecton electrodes in the presence of a strong electrostatic Þeld. Collected dust is discharged by rappinginto hoppers. A collection efÞciency above 99% is possible.
Double reheat: Modern designs of fossil steam-generating units remove a portion of the steam beforefull expansion through the turbine and reheat it in the boiler before returning it to the turbine.This enhances the thermal efÞciency of the cycle by up to 5%. For supercritical cycles two stagesof reheat can be justiÞed Ñ double reheat.
F-class machines: Recent designs of CTs have increased efÞciencies resulting from increased Þringtemperatures. The Þrst generation of these machines has Þring temperatures of about 2300°F. Theyhave been termed F-class machines (for example the GE 7F). Even higher temperatures have nowbeen incorporated into ÒG-classÓ turbines.
© 1999 by CRC Press LLC

8-96 Section 8
Flue gas desulfurization: Removal of sulfur dioxide, SO2, from combustion gases is accomplished ina number of FGD methods. Most of these involve wet ÒscrubbingÓ of the gas using lime orlimestone and result in a calcium sulfate waste product. A 95% removal efÞciency, or higher, ispossible.
Fluidized bed: A process of burning solid fuels, particularly coal, by suspending the fuel within acolumn of air supplied from below the furnace. This method permits effective combustion of poor-quality fuels, lowers NOx emissions due to low combustion temperatures, and captures sulfur inthe bed by mixing limestone or dolomite in with the fuel.
Fuel cell: Fuel cells convert gaseous or liquid fuels directly to electricity without any combustion process.Like a continuous battery, the fuel cell has electrodes in an electrolyte medium. Typically, hydrogenand air are supplied and DC electricity, water, and carbon dioxide are produced. They are currentlyhigh-cost, low-size devices, but with minimum environmental emissions.
Hot-gas cleanup: Cycles which use gas from the combustion of coal, typically pressurized ßuidizedbed or gasiÞcation cycles, need to clean up the ash particles before passing them through a gasturbine. This prevents severe erosion of the turbine blades and other components. Hot-gas cleanupcan involve the application of hanging particulate traps, using ceramic Þlters.
Humid air turbine: A new type of CT uses humidiÞed compressor exit air for the combustor. The massof dry air needed is thus lessened for a given mass ßow, and turbine efÞciency increases. Severalapplications of this HAT appear attractive in gasiÞcation and compressed air storage cycles.
Intercooling: Increased output from a CT can be obtained by cooling the air between compressor stages.This reduces volume ßow and increases energy to the power turbine.
Lower heating value: Fuels containing hydrogen produce water vapor as a product of combustion. Thefuel heating value is said to be ÒlowerÓ if the combustion process leaves all products in the gaseousstate, but ÒhigherÓ if the fuel heating value includes the latent heat of vaporization. Practice inthe United States is to use the higher value.
On/off cycling capability: Generating units are often not required on a 24-hr basis. Some are shut downduring low-demand times and started up perhaps hours later. This form of on/off cycling imposesthermal stresses on the equipment, leading to premature equipment failure unless special measuresare taken to deal with this.
Petroleum coke: Petroleum coke is a residual product of the oil-reÞning process, and in its fuel-gradeform is an almost pure carbon by-product. About 19 million tons of fuel-grade pet coke is producedeach year in the United States. It is inexpensive although it may have high sulfur and vanadiumcontent.
Recuperative cycle: Recuperative cycles for CTs use walls between the hot and cold streams throughwhich heat is transferred. This improves efÞciency and reduces fuel consumption.
Regenerative cycles: Combustion turbine cycles using heat exchangers to store and transfer heat fromthe hot gases to the cold gases are termed regenerative cycles.
Slagging and fouling: The mineral matter in coal can attach itself following combustion to the boilerwalls and heat-exchanger surfaces. Oxides of silicon, aluminum, iron, calcium, and magnesiumcan foul all boiler surfaces, requiring soot blowers for cleaning. Hot ash can melt, becoming stickyand sometimes coalescing in the furnace to cause slagging problems.
Spray drying: Spray driers, for desulfurization, used typically when burning lower-sulfur coals, use aspray of quicklime which is dried by the hot ßue gas and results in a dry solid product. A 90%removal efÞciency is typical.
Steam injection: Injecting stream directly into the combustion chamber of a CT increases turbine massßow and thus increases the output power.
Temper embrittlement: Tempering of steel in the manufacturing process removes some of the brittlenessand is carried out by a heating and cooling process. During operation, though, it is possible thatductility can worsen close to speciÞc tempering temperatures. The material is then said to betemper embrittled, and premature cracking may follow.
© 1999 by CRC Press LLC

Energy Conversion 8-97
References
Armor, A.F., Generation technologies through the year 2005, in The Electric Industry in Transition,Public Utilities Reports, Inc., December 1994.
Armor, A.F. et al., Improved materials for life extension of coal-Þred power plants, in Proceedings,International Conference on Life Extension and Assessment, Nederlands Instituut Voor Lastech-niek, The Hague, Holland, June 13Ð15, 1988.
Armor, A.F., Touchton, G.L., and Cohn, A., Powering the future: advanced combustion turbines andEPRIÕs program, paper presented at EPRI Coal GasiÞcation Conference, San Francisco, October1992.
Blunden, W.E., Colorado-UTEÕs Nucla Circulating AFBC Demonstration Project, EPRI Report CS-5831,February 1989.
Carpenter, L.K. and DelleÞeld, R.J., The U.S. Department of Energy PFBC perspective, paper presentedat EPRI Fluidized Bed Combustion for Power Generation Conference, Atlanta, Georgia, May17Ð19, 1994.
Cohn, A., HumidiÞed power plant options, in AFPS Developments, Electric Power Research Institute,Spring 1994.
Couch, G., Advanced coal cleaning technology, IEACR/44, London, IEA Coal Research, December 1991.Douglas, J., IGCC: Phased construction for ßexible growth,Ó EPRI Journal, September 1986.Esposito, N.T., A Comparison of Steam-lnjected Gas Turbine and Combined Cycle Power Plants, EPRI
Report GS-6415, June 1989.Hinrichsen, D., AFBC Conversion at Northern States Power Company, EPRI Report CS-5501, April,
1989.Lucas, H., Survey of Alternative Gas Turbine and Cycle Designs, EPRI Report AP-4450, February 1986.Manaker, A.M., TVA 160-MWe Atmospheric Fluidized-Bed Combustion Demonstration Project, EPRI
Report TR-100544, December 1992.Melvin, R.H. and Friedman, M.A., Successful Coal-Fired AFBC Cogeneration in California: 108 MW
ACE Cogeneration Facility, paper presented at EPRI Fluidized Bed Combustion Conference,Atlanta, May 17Ð19, 1994.
Olesen, C., Pressurized ßuidized bed combustion for power generation, in EPRI CS-4028, Proceedings:Pressurized Fluidized-Bed Combustion Power Plants, May 1985.
Oliker, I. and Armor, A.F., Supercritical Power Plants in the U.S.S.R., EPRI Report TR-100364, February1992.
Poe, G.G. et al., EPRIÕs state-of-the-art power plant, in Proceedings, Third International Conference onImproved Coal-Fired Power Plants, San Francisco, April 2Ð4, 1991.
Skowyra, et al., Design of a supercritical sliding pressure circulating ßuidized bed boiler with verticalwaterwalls, in Proceedings of 13th International Conference on Fluidized Bed Combustion, ASME,New York, 1995.
Torrens, I.M., Developing clean coal technologies, Environment, 32(6):11Ð33, July/August 1990.U.S. Department of Energy, Clean Coal Technology Demonstration Program, DOE/FE-0299P, March
1994.
Further Information
Steam, Its Generation and Use, Babcock and Wilcox, New York.Combustion: Fossil Power Systems, Combustion Engineering, Inc., Windsor, CT.Tapping global expertise in coal technology, EPRI J., Jan/Feb., 1986.IGCC: new fuels, new players, EPRI J., July/Aug., 1994.A brighter future for PFBC, EPRI J., Dec. 1993.Fuel cells for urban power, EPRI J., Sept. 1991.Distributed generation, EPRI J., April/May, 1993.
© 1999 by CRC Press LLC

8-98 Section 8
8.7 Energy Storage
Chand K. Jotshi and D. Yogi Goswami
Introduction
Energy storage is very important for utility load leveling, electrical vehicles, solar energy systems,uninterrupted power supply, and energy systems at remote locations. Two important parameters forenergy storage are duration of storage and speciÞc energy or energy density. Duration of energy storagemay vary from many years to a fraction of a second. In a nuclear power plant, nuclear fuel is storedwithin a reactor for a year. Coal piles, gas and oil storage tanks, or pumped hydro are kept by powerutilities for several days use, depending upon the need. Similarly for a solar energy system, requirementof energy storage may be on an hourly, daily, or weekly basis. SpeciÞc energy or energy density is acritical factor for the size of a storage system.
Energy can be stored as mechanical, thermal, chemical, electrical, or magnetic energy. In this section,storage of thermal, mechanical, and electrical energy are described.
Thermal Energy Storage (TES)
Thermal energy can be stored as sensible heat, latent heat, or as the heat of chemical reaction (thermo-chemical).
Sensible heat, Q, is stored in a material of mass m and speciÞc heat Cp by raising the temperature ofthe storage material and is expressed by Equation (8.7.1):
(8.7.1)
Most common sensible heat storage materials are water, organic oils, rocks, ceramics, and molten salts.Some of these materials along with their physical properties are listed in Table 8.7.1. Water has thehighest speciÞc heat value of 4190 J/kg á C.
TABLE 8.7.1 Physical Properties of Some Sensible Heat Storage Materials
Storage MediumTemperature
Range, °CDensity (r),
kg/m3
SpeciÞc Heat (C),
J/kg K
Energy Density(rC) kWhr/m3 K
Thermal Conductivity
(W/m K)
Water 0Ð100 1000 4190 1.16 0.63 at 38°CWater (10 bar) 0Ð180 881 4190 1.03 Ñ50-ethylene glycolÐ50 water 0Ð100 1075 3480 0.98 ÑDowtherm A¨ 12Ð260 867 2200 0.53 0.112 at 260°C
(Dow Chemical, Co.)Therminol 66¨ Ð9Ð343 750 2100 0.44 0.106 at 343°C(Monsanto Co.)
Draw salt 220Ð540 1733 1550 0.75 0.57(50NaNO3-50KNO3)a
Molten Salt 142Ð540 1680 1560 0.72 0.61(53KNO3/40NaNO2/7NaNO3)a
Liquid sodium 100Ð760 750 1260 0.26 67.5Cast iron m.p.
(1150Ð1300)7200 540 1.08 42.0
Taconite Ñ 3200 800 0.71 ÑAluminum m.p. 660 2700 920 0.69 200Fireclay Ñ 2100Ð2600 1000 0.65 1.0Ð1.5
a Composition in percent by weight.Note: m.p. = melting point.
Q mc Tp= D
© 1999 by CRC Press LLC

Energy Conversion 8-99
Thermal energy, Q, can be stored as latent heat in a material of mass, m, that undergoes phasetransformation as given by Equation (8.7.2):
Q = ml (8.7.2)
where l = heat of phase transformation.Four types of phase transformations useful for latent heat storage are: solid liquid, liquid
vapor, solid vapor, and solid solid. Since phase transformation is an isothermal process, thermalenergy is stored and retrieved at a Þxed temperature known as the transition temperature. Some commonphase change materials (PCMs) used for thermal storage are parafÞn waxes, nonparafÞns, inorganic salts(both anhydrous and hydrated), and eutectics of organic and/or inorganic compounds. Table 8.7.2 listssome PCMs with their physical properties.
Thermochemical energy can be stored as heat of reaction in reversible chemical reactions. In thismode of storage, the reaction in the forward direction is endothermic (storage of heat), while the reversereaction is exothermic (release of heat). For example,
(8.7.3)
The amount of heat Q stored in a chemical reaction depends on the heat of reaction and the extentof conversion as given by Equation (8.7.4):
(8.7.4)
where ar = fraction reacted, DH = heat of reaction per unit mass, and m = mass.Chemical reaction is generally a highly energetic process. Therefore, a large amount of heat can be
stored in a small quantity of a material. Another advantage of thermochemical storage is that the productsof reaction can be stored at room temperature and need not be insulated. For sensible and latent heatstorage materials, insulation is very important. Examples of reactions include decomposition of metalhydrides, oxides, peroxides, ammoniated salts, carbonates, sulfur trioxide, etc. Some useful chemicalreactions are reported in Table 8.7.3.
TABLE 8.7.2 Physical Properties of Latent Heat Storage Materials or PCMs
Storage Medium
MeltingPoint
°C
Latent Heat,kJ/kg
SpeciÞc Heat (kJ/kg °C) Density (kg/m3)
Energy Density
(kWhr/m3 K)
Thermal Conductivity
(W/m K)Solid Liquid Solid Liquid
LiClO3 á 3H2O 8.1 253 Ñ Ñ 1720 1530 108 ÑNa2SO4 á 10H2O 32.4 251 1.76 3.32 1460 1330 92.7 2.25Na2S2O3 á 5H2O 48 200 1.47 2.39 1730 1665 92.5 0.57NaCH3COO á 3H2O 58 180 1.90 2.50 1450 1280 64 0.5Ba(OH)2 á 8H2O 78 301 0.67 1.26 2070 1937 162 0.653,Mg(NO3) á 6H2O 90 163 1.56 3.68 1636 1550 70 0.611LiNO3 252 530 2.02 2.041 2310 1776 261 1.35LiCO3/K2CO3, (35:65)a 505 345 1.34 1.76 2265 1960 188 ÑLiCO3/K2CO3/Na2CO3 397 277 1.68 1 63 2300 2140 165 Ñ(32:35:33)a
n-Tetradecane 5.5 228 Ñ Ñ 825 771 48 0.150n-Octadecane 28 244 2.16 Ñ 814 774 52.5 0.150HDPE (cross-linked) 126 180 2.88 2.51 960 900 45 0.361Steric acid 70 203 Ñ 2.35 941 847 48 0.172,
a Composition in percent by weight.Note: , = liquid.
®¬ ®¬®¬ ®¬
A H B C+ ®¬ +D
Q a m Hr= D
© 1999 by CRC Press LLC

8-100 Section 8
Applications and Examples
Cool Storage has major applications in space cooling of buildings, food and medicine preservation, andtransportation of items that need to be stored at low temperatures. A major application of cool storageis in the use of off-peak electricity for air-conditioning during peak hours. During off-peak hourselectricity can be used to make ice or chilled water, which can be used later for air-conditioning ofbuildings during the peak hours. The advantage of using ice as a storage medium over chilled water isthat a much larger amount of coolness can be stored in ice; 1 kg of ice stores 335 kJ, whereas 1 kg ofwater stores only 42 kJ for a temperature swing of 10°C. The disadvantage of ice is its lower thermalconductivity, which is responsible for lower heat-transfer rates.
Cool storage systems have been used in several buildings in the United States and Canada. TheMerchandise Mart of Chicago boasts the largest ice storage system in the world: each day more than 2million lb of ice are made and melted. For long-term cool storage, aquifers have been used for chilledwater storage. Examples include cooling of buildings at the University of Alabama and the United StatesPostal Service in Long Island, NY, using chilled water stored in aquifers (Tomlinson and Kannberg,1990). Other materials which have been found to have cool storage potential are PCMs like LiClO3 á3H2O, a eutectic of GlauberÕs salt, parafÞns and their mixtures, and some gas hydrates or clatherates.
Heat Storage has major applications in space heating, crop drying, cooking, electric power generation,industrial process heat (air and steam), waste heat utilization, and solar energy utilization, etc. Heatstorage in water is the most economical and well-developed technology. Epoxy-lined steel, Þberglass-reinforced polymer, concrete with plastic liner, and wood tanks are suitable containment materials forsystems using water as the storage material. The storage tanks may be located above or below ground.In North America and China, aquifers have been used for long-term storage of hot water and chilledwater. Pressurized water tanks are used to store heat from off-peak electricity (ASHRAE, 1995). Forexample, water is heated to maximum temperatures of about 138°C in a tank at a pressure of 50 psig.
Molten nitrate salt (50 wt% NaNO3/50 wt% KNO3) also known as Draw salt, which has a meltingpoint of 222°C, has been used as a storage and a heat-transfer ßuid in an experiment in Albuquerque,NM. It was the Þrst commercial demonstration of generating power from storage (Delameter and Bergen,1986). Solar Two, a 10-MW solar thermal power demonstration project in Barstow, CA, is also designedto use this molten salt to store solar energy (Chavez et al., 1995). Another molten nitrate salt is 40 wt%NaNO2/7 wt% NaNO3/53 wt% KNO3, known as HTS (heat-transfer salt) with a melting point of 142°C.This salt has been widely used in the chemical industry.
For applications in heating and cooling of buildings the containment of PCM can become an integralpart of the building. It may be part of the ceiling, wall, or ßoor of the building and may serve a structuralor a nonstructural function. Tubes, trays, rods, panels, balls, canisters, and tiles containing PCMs havebeen studied in the 1970s and 1980s for space-heating applications (Moses and Lane, 1983). The PCMsused were mostly salt hydrates such as GlauberÕs salt (Na2SO4 á 10H2O), Hypo (Na2S2O3 á 5H2O),
TABLE 8.7.3 Properties of thermochemical storage media
Pressure,kPa
Temperature,°C
Density,kg/m3
VolumetricStorageDensity,
kWhr/m3
Condition of Reaction
ReactionPressure,
kPaTemperature,
°CComponent
(Phase)
MgCO3 (s) + 1200 kJ/kg = 100 427Ð327 MgCO3(s) 100 20 1500MgO (s) + CO2(g) CO2(,) 7400 31 465
187Ca(OH)2(s) + 1415 kJ/kg = 100 572Ð402 Ca(OH)2(s) 100 20 1115CaO(s) + H2O(g) H2O(,) 100 20 1000 345
SO3(g) + 1235 kJ/kg = 100 520Ð960 SO3(,) 100 45 1900SO2(g) + 1/2O2(g) SO2(,) 630 40 1320
O2(g) 10000 20 130 280
Note: s = solid, , = liquid, g =gas.
© 1999 by CRC Press LLC

Energy Conversion 8-101
NaCH3COO á 3H2O, Na2HPO4 á 12H2O, Ba(OH)2 á 8H2O, MgCl2 á 6H2O, and Mg(NO3)2 á 6H2O. ParafÞnmixtures have been used for thermal storage in wall boards. Some PCMs, such as salt hydrates, exhibitsupercooling and phase segregation problems during heat removal. Low thermal conductivity andcomplex mechanism of heat transfer during melting and freezing introduce complexities in the designof their containment systems.
Mechanical Energy Storage
Mechanical energy may be stored as potential or kinetic energy.
Kinetic Energy
Kinetic energy can be stored in the rotating mass of a wheel, commonly known as a ßywheel. Kineticenergy of a rotating body is given by Equation (8.7.5):
(8.7.5)
where I = moment of inertia, and w = angular velocity.The maximum speciÞc energy of a ßywheel is expressed by the following equation (Jenser, 1980):
(8.7.6)
where A = shape factor, and its value depends on the geometry of ßywheel; A = 1.0 for a constant stressdisk and 0.5 for a thin-rimmed ßywheel. This equation shows that high tensile strength and low densityare the key parameters to store maximum energy. Tensile strength, density, and speciÞc energy of somematerials are given in Table 8.7.4.
Storing energy in a ßywheel is one of the oldest techniques used in ancient potteries. Present-dayßywheels are much more advanced as a result of superstrong/ultralight composite materials and fric-tionless high-performance magnetic bearings.
Potential Energy
If a body of mass m is elevated against the gravitational force g to a height Dh, the potential energystored is given by
(8.7.7)
From Equation (8.7.7), 1 Wh of energy can be stored in 1 kg mass of a body by raising it to a heightof 367 m.
TABLE 8.7.4 Flywheel Rotor Materials
Material Design Stress, MN/m2 Density, kg/m3 SpeciÞc Energy, Whr/kg
Composite Þbera/epoxy 750 1550 51.5E-glass Þbera/epoxy 250 1990 14.0S-glass Þbera/epoxy 350 1900 19.6Kevlar Þbera/epoxy 1000 1400 76.2Maraging steel 900 8000 24.2Titanium alloy 650 4500 30.8
a 60% Þber.
KE I=12
2w
KE
mAmax max=
r
r
PE = mg hD
© 1999 by CRC Press LLC

8-102 Section 8
Potential energy is also stored in a spring, either by compressing or expanding. Here, energy storedis given by
(8.7.8)
where k = spring constant and x is the distance to which the spring is compressed or expanded. Springshave been widely used to power toys and watches mainly because of very low values of energy density.
Pumped Hydro
Water may be pumped from a lower reservoir to a higher reservoir using electricity during off-peakhours, which may be used to generate electricity using hydraulic turbines during peak hours. Figure8.7.1a shows a schematic diagram of an above-ground pumped hydro system. Advantages of pumpedhydro units include simple operation, high reliability, low maintenance, long life, quick start fromstandstill, and economic generation of peaking electrical energy. In the United States a large number ofsuch systems are in operation. Power-generating capacities of these systems vary between 5 and 2000MW (Makansi, 1994). The overall efÞciencies of these power plants vary between 65 and 90%, whichincludes the efÞciencies of pumps, hydraulic turbines, generators, and losses from the upper reservoir.In spite of the technical and economic viability of pumped hydro, the requirement of a speciÞc type oftopography and some environmental concerns limit its application. To overcome these problems, aconcept of underground pumped hydro storage as shown in Figure 8.7.1b can be used. In this case, largecaverns or aquifers can be used as the lower reservoir.
Compressed Air Storage
In a fossil fuel power plant, approximately half of the output of a conventional gas turbine is used todrive the compressors. If the air is compressed during off-peak hours and stored, it can be used laterduring peak hours. Compressed air can be stored underground in abandoned mines, oil or gas Þelds,sealed aquifers, or natural caverns. A compressed air storage plant in Huntorf, Germany that has beenin operation since 1978 is the oldest unit. A 110-MW demonstration facility at the Alabama ElectricCooperative (AEC), Inc., McIntosh, Alabama , site has been in operation since 1991. The Hunterof unitis a 4-hr facility and the AEC site is a 26-hr facility (Makansi, 1994).
FIGURE 8.7.1 Pumped hydrostorage: (a) above ground; (b) underground.
PE = ( )1 2 2kx
© 1999 by CRC Press LLC

Energy Conversion 8-103
Electrical Energy Storage
Electrochemical energy storage, more commonly known as battery storage, stores electrical energy aschemical energy. Batteries are classiÞed as primary and secondary batteries. Only secondary batteriesare rechargeable and are therefore suitable for energy storage applications. Lead-acid and nickel-cadmiumare well-known rechargeable batteries that are most commonly used. Lead-acid batteries have been usedfor over a century and are still the most popular batteries.
Electrochemical operation of a cell during discharge and charge is shown in Figures 8.7.2a and b.During discharge when a cell is connected to a load, electrons ßow from the anode to the cathode. Inthis operation oxidation, or loss of electrons, takes place at the anode, and reduction, or gain of electrons,occurs at the cathode. The cell chemistry of a lead-acid battery is as follows: the anode is lead (Pb) andthe cathode is lead oxide (PbO2); the electrolyte is H2SO4. The cell reaction is
Theoretical voltages and capacities of some known batteries are reported in Table 8.7.5.
FIGURE 8.7.2 Electrochemical operation of a cell: (a) discharge; (b) charge.
TABLE 8.7.5 Properties of Some Rechargeable Batteries
No. System ElectrolyteTemp.
°CO.C.V.
(V)
Energy Density(Theoretical),
Whr/kg
EnergyDensity
(Achievable),Whr/kg
In/Out ElectricalEffciency
CycleLife
1 Lead-Acid H2SO4 20Ð30 2.05 171 50 75 10002 Nickel-Iron KOH 20Ð30 1.37 267 60 55 20003 Zinc-Iron KOH 50Ð60 1.65 1084 90 45 6004 Sodium-Sulfur b-Al2O3 300Ð375 1.76Ð2.08 664 120 75 20005 Lithium-Iron
SulÞdeLiCl-KCl (eutectic)
400Ð450 1.6 869 150 75 1000
Note: O.C.V. = open cell voltage.
2 4 2H SO H SO2 4+
4® + -
Anodic reaction: Pb + SO PbSO e (8.7.9)42
4- -= + 2
Cathodic reaction: PbO + SO H e = PbSO H O (8.7.10)2 42 +
4 2- -+ + +4 2 2
© 1999 by CRC Press LLC

8-104 Section 8
Applications
Battery storage is used in a wide range of applications. Currently, the main emphasis of research is onapplications in vehicles and load leveling.
Electric Vehicles. For electric vehicles, the speciÞc energy and speciÞc power are two important param-eters. The greater the speciÞc energy, the farther a vehicle can travel. If speciÞc power is high, a vehiclecan accelerate more quickly and have a higher top speed. Other important requirements are the abilityto charge and discharge a large number of times, to retain charge over an extended period of time, andto charge and discharge over a wide range of temperatures. Table 8.7.5 provides information about somerechargeable batteries.
Power Plants. Recent start-up of a commercial unit for the Puerto Rico Electric Power Authority (PREPA)is the latest development in large-scale application of lead-acid batteries. The facility stores 20 MW for20 min, both for peaking requirement and voltage and frequency control. Maximum discharge is limitedto 10 MW (Makanasi, 1994).
Defining Terms
Cool storage: The storage of thermal energy at temperatures below the nominaltemperature required by the space or process.
Heat storage: The storage of thermal energy at temperatures above the nominal temperature requiredby the space or process.
Energy density: Amount of energy stored per unit volume, kJ/m3 or kWhr/m3.SpeciÞc energy: Amount of energy stored per unit mass, kJ/kg or kWhr/kg.
References
ASHRAE, 1995. Thermal storage, in ASHRAE Handbook, HVAC Application, p. 40.15. American Societyof Heating, Refrigerating and Air-Conditioning Engineers, 1791 Tullie Circle, N.E., Atlanta.
Beckman, G. and Gilli, P.V. 1984. Topics in Energy Ñ Thermal Energy Storage. Springer-Verlag, NewYork.
Chavez, J.M. et al. 1995. The Solar Two Power Tower Project: a 10MWe power plant, in Proceedingsof the 1995 IECEC, Vol. 2, pp. 469Ð475, ASME, New York.
Delameter, W.R. and Bergen, N.E. 1986. Review of Molten Salt Electric Experiment: Solar CentralReceiver Project. SAND 86-8249, Sandia National Laboratory, Albuquerque.
Garg, H.P., Mullick, S.C., and Bhargava, A.K. 1985. Solar Thermal Energy Storage. D. Reidel, Boston.Glendenning, I. 1981. Advanced mechanical energy storage, in Energy Storage and Transportation, G.
Beghe, Ed., pp. 50Ð52. D. Reidel, Boston.Jensen, J. 1980. Energy Storage. Newnes-Butterworth, Boston.Makansi, J. 1994. Energy storage reinforces competitive business practices. Power. 138(9):63.Moses, P.J. and Lane, G.A. 1983. Encapsulation of PCMs, in Solar Heat Storage: Latent Heat Materials,
Vol. II, pp. 93Ð152. CRC Press, Boca Raton, FL.OÕConnor, L. 1993. Energizing the batteries for electric cars. Mech. Eng. 7:73Ð75.Sharma, S.K. and Jotshi, C.K. 1979. Discussion on storage subsystems, in Proceedings of the First
National Workshop on Solar Energy Storage, pp. 301Ð308. Panjab University, Chandigarh, India.Tomlinson, J.J. and Kannberg, L.D. 1990. Thermal energy storage. Mech. Eng. 9:68Ð72.
© 1999 by CRC Press LLC

Energy Conversion 8-105
8.8 Nuclear Power
Roberto Pagano and James S. Tulenko
Nuclear power refers to power generated through reactions involving atomic nuclei (i.e., nuclear reac-tions). These reactions fall into three broad categories Ñ fusion reactions, Þssion reactions, and radio-isotopes. In fusion, two light nuclei (most commonly isotopes of hydrogen) combine to form a heaviernucleus (usually helium), with energy being released in the process. Nuclear fusion is the source ofenergy generated in the stars (our sun). In artiÞcial applications, the technology to induce fusion reactionshas been available for several decades, but such reactions have been essentially uncontrolled (thehydrogen bomb). Once initiated, fusion reactions generate huge amounts of energy, which is subsequentlyreleased explosively. Means to produce and release energy from fusion in a sustained, controlled mannerare still being developed. Extensive research is ongoing, both in the United States and abroad, on thedevelopment of nuclear fusion as a controlled source of power.
Nuclear Þssion, in contrast, is the basis of a mature technology applied to the generation of power.Fission is the fragmentation of a heavy nucleus into two, sometimes three, lighter nuclei. Certain nuclidesfound in nature Þssion spontaneously, that is, with no external intervention. However, spontaneous Þssionin naturally occurring nuclides takes place at a very slow rate. Fission can be induced through a nuclearreaction. Of primary interest here is the Þssioning of several speciÞc nuclei through interactions withneutrons. Again, the Þssioning of a nucleus is accompanied by the release of energy.
At present, the element of primary importance with respect to nuclear Þssion power is uranium.Naturally occurring uranium consists of three isotopes Ñ 238U, 235U, and 234U. In a mixture of isotopesof an element, the abundance of any one is usually expressed as the number of atoms of that isotopepresent per 100 atoms of the mixture, abbreviated as atom percent a/o or weight percent w/o. Naturaluranium consists of 99.2745 a/o 238U, 0.7200 a/o 235U, and 0.0055 a/o 234U.
Radioisotope power is the third form of nuclear energy. When radioisotopes decay, high-energyelectrons (beta particles), helium atoms (alpha particles), and gamma rays (photons) are emitted. Whenthe energy of these radiations is stopped and converted to heat, a power source is created. Radioisotopesdecay energies range from 0.01 to 10 MeV. Radioisotopes are generally separated from radioactivewastes produced from nuclear power plants. The most common radioisotopes are polonium-210 (alphaemitter of 5.3 MeV), plutonium-238 (alpha emitter of 5.46 MeV), cesium-144 (beta emitter of 1.25MeV), and strontium-90 (beta emitter of 1.10 MeV).
The Fission Process
Consider Þrst the Þssion of a nucleus of 235U caused by an interaction with a neutron. A compoundnucleus of 236U is initially formed. If Þssion occurs, it does so within a very short time. Normally withthermal reaction, 85% of the interaction leads to Þssion. Alternatively, the compound nucleus dissipatesenergy by emitting a gamma photon, no Þssion occurs and the nucleus remains as 236U. This latterprocess occurs in 20% of the interaction of 235U with a neutron.
The Þssioning of a nucleus produces Þssion fragments called Þssion products, a number of neutronsand gamma photons. Most frequently, the number of neutrons is 2 or 3, ranging in extreme cases from0 to 8. In the Þssioning of 235U, the average number of neutrons released, designated by u, has a valueof 2.42. This value applies strictly if the Þssion is induced by a neutron of relatively low kinetic energy,called a thermal neutron.
In a nuclear reactor, which is a special material medium in which 235U is dispersed for the reactor towork, one of the neutrons liberated in the Þssioning of a nucleus must go on to induce a Þssion inanother nucleus. This leads to the idea of a self-sustaining chain reaction or, more speciÞcally, a criticalconÞguration in which a self-sustaining chain reaction can be maintained indeÞnitely. To this end, anadequate supply of 235U must be on hand and replenished as needed. Further, the conÞguration must be
© 1999 by CRC Press LLC

8-106 Section 8
such that the likelihood that any particular neutron ultimately induces a Þssion is adequately high toensure that on average one neutron will induce a Þssion.
The energy liberated in Þssion results from EinsteinÕs equation E = Mc2, which says that mass andenergy are equivalent. A summation of the masses of the Þssion fragments and the neutrons resultingfrom Þssion shows that the combined mass of the products of a Þssion is less than the mass of thecompound nucleus before Þssion occurs. It is found that the energy released is equal to E = DMc2 whenDM is the difference in the masses. This nuclear energy is traditionally expressed in units of electronvolts (eV), with the equivalence of 1 eV = 1.602 ´ 10Ð19 J. The single Þssion of a single uranium atomreleases approximately 200 ´ 106 eV, or 200 MeV, of energy. When one realizes that the combusion ofa single carbon atom (C + O2 ® CO2) releases 4 eV, a quantity 50 million times smaller, one gets atrue appreciation of the concentrated power of nuclear energy.
Most of the energy liberated in a Þssion appears as the kinetic energy of the Þssion fragments (168MeV, or 84%) and the kinetic energy of the neutrons (5 MeV, or 2.5%). The remainder is distributedamong the gamma photons appearing instantaneously with the Þssion and the energy associated withthe radioactive decay of the Þssion fragments. These fragments are readily stopped in the reactor. Theirrange is of the order of 0.01 to 0.001 mm. Thus, the major portion of the energy from a Þssion isdeposited within a very short distance from the site of the Þssion.
In the largest power reactors in operation in the United States today, heat is generated at the rate of3800 MW. At 200 MeV per Þssion, Þssioning in such reactors must occur at the rate of 1.2 ´ 1020
Þssions/sec to produce the power. In terms of 235U, this requires the Þssioning of all the nuclei containedin 0.047 g of 235U, or the Þssioning of approximately 4 kg per day. Thus, as a rule of thumb, the Þssioningof all the nuclei present in 1 g of 235U is sufÞcient to generate 1 MW day of thermal energy. In contrast,the generation of the same amount of energy from coal requires the combustion of 4 tons of coal oftypical heating value. With the combustion of coal there is the associated release of a large quantity ofcarbon dioxide (~14 tons) to the atmosphere with its effects on global warming.
Cross Sections
A measure of the probability of a particular nuclide to interact with a neutron is provided by a quantityknown as a cross section. Numerical values of cross sections are determined experimentally and areexpressed in units of barns (b), with 1 b deÞned as 10Ð24 cm2, or 10Ð28 m2.
As a quantity, a cross section may be interpreted as a target area Ñ the larger the cross section, themore likely the interaction of the nucleus with a neutron in its vicinity. For example, the cross sectionfor Þssion of 235U, denoted by has a value of 582 b if the interacting neutron is traveling at thevelocity associated with thermal energy (2200 m/sec). If the neutron is traveling at high energy, the crosssection may drop to a value of approximately 2 b. With respect to the radiative capture of a neutron in235U leading to the formation of 236U, the cross section is given by = 99 b, if the neutron is thermal.In summary, a cross section is a property speciÞc to a given nuclide, but it is a property whose valuedepends on the energy of the interacting neutron.
Cross sections are additive. Thus, the cross section for the absorption of a thermal neutron in 235U Ñwhether the absorption gives rise to a Þssion or a radiative capture Ñ is given by aa = af + ac = 582b + 99 b = 681 b. Further, the probability of a Þssion occurring as a result of a thermal neutron beingabsorbed in 235U is given by af/aa = 582 b/681 b = 0.85. Fission is, therefore, the more likely outcomeof an interaction between a 235U nuclide and a thermal neutron.
On average, the neutrons arising from the Þssioning of 235U have a kinetic energy of 2 MeV,corresponding to a speed of 2 ´ 107 m/sec. These neutrons are four orders of magnitude greater thanthe speed at which a neutron is considered to be thermal (2200 m/sec).
s f235,
sc235
© 1999 by CRC Press LLC

Energy Conversion 8-107
Categories of Nuclear Reactors
A prerequisite for a self-sustaining chain reaction is that sufÞcient 235U be present in the medium toensure that the absorption of a neutron in a nucleus of 235U is a likely occurrence. If the population ofneutrons present in the medium at any instant consists predominantly of slow neutrons, a far lesseramount of 235U is needed to ensure criticality than would be the case if the population were to consistof fast neutrons. This comes about because of the difference in the values of the cross sections mentionedpreviously.
There is, from this particular standpoint, an incentive to slow down the neutrons originating in Þssionin order to reduce the inventory of 235U needed to maintain criticality. In the power reactors operatingtoday, means are provided to slow down the neutrons. The slowing down is effected through multipleelastic scatterings of the neutrons with the nuclei of light elements deliberately present in the mediumacting as so-called moderators. Notable among such elements are hydrogen present in water, deuteriumin heavy water, and carbon in the form of graphite.
All of the reactors in which substantive moderation of the neutrons occurs are categorized as thermalreactors. This term stems from the distinguishing feature that the neutron population is in, or near,thermal equilibrium with the nuclei of the moderator. As a consequence, there is no net exchange ofenergy between the neutron population and its surroundings. The neutrons are then referred to as thermalneturons.
In a population of thermal neutrons, the distribution of the speeds of the neutrons is characterized,adequately in many cases, by the Maxwell-Boltzmann distribution, originally formulated to apply to themolecules of an ideal gas. According to this distribution, the most probable speed of the neutrons at thereference temperature of 20°C is 2200 m/sec and the kinetic energy corresponding to the most probablespeed is 0.025 eV.
Reactors that are not thermal reactors fall in the category of fast reactors. In these reactors, themoderation of neutrons is much reduced for reasons discussed later.
Nuclear Fuel
In light-water reactors (LWR), the type of power reactors most commonly in service today, the nuclearfuel is uranium with a content of 2 to 4% of 235U. This fuel is produced by enriching natural uraniumin 235U by one of several technologies, principally gaseous diffusion and gaseous centrifugation (Benedictet al., 1981). Neutrons of all energies, down to and including thermal energies, can induce Þssion in235U. For this reason, 235U is said to be Þssile.
In contrast, 238U, present to the extent of 96 to 98% in the fuel, can be Þssioned to a signiÞcant extentby neutrons with energies in excess of a threshold of roughly 2 MeV. Fissions of 238U, referred to asfast Þssions, play only a slight role in the chain reaction in an LWR. However, 238U absorbs neutronsradiatively to yield 239U. This nuclide is radioactive and decays to 239Np which, in turn, decays to 239Pu,a Þssile nuclide. Thus, in LWR fuel 239Pu, produced from 238U, is available for Þssioning by neutronsof all energies and contributes to the chain reaction. Because of its ability to form Þssile 239Pu, 238U istermed a fertile nuclide.
Conversion and Breeding
To characterize the unique capability of nuclear fuel simultaneously to produce and consume Þssilematerial, a Þgure of merit known as the conversion ratio (CR) is informative. It is deÞned by the relation:
In fuel irradiated in an LWR, the conversion ratio typically has a value of 0.5. If the appropriatecombination of materials, design, and operating parameters could be found to raise the conversion ratio
CR =number of fissile nuclei produced from fertile nuclei
number of fissile nuclei consumed
© 1999 by CRC Press LLC
8-108 Section 8
to a value greater than unity, a reactor would become a breeder reactor, that is, one that produces moreÞssile material than it consumes in its operation.
To illustrate the possibility of breeding, consider a parameter known as the reproduction factor andgiven by
In the case of 235U and thermal neutrons, the value of h is given by h235 = 2.42 ´ 582/(589 + 99) = 2.42´ 0.85 = 2.07.
If a chain reaction is to be self-sustaining in a reactor, the condition h > 1 must apply. To achievebreeding requires that h > 2. In other words, one neutron from Þssion would be available to sustain thechain reaction and another to produce a Þssile nucleus from a fertile nucleus. Practical considerationsindicate that the value of h must be substantially greater than 2, since neutrons will be lost by absorptionin structural materials, heat removal medium, Þssion fragments, the moderator, if present, and by escapingfrom the physical conÞnes of the reactor.
As shown, 235U has a value of h slightly above 2 with neutrons at thermal energies. Breeding or near-breeding conditions could arise, in principle, if very judicious choices of materials and parameters prevail.A more attractive fuel from the standpoint of breeding is 233U. This isotope of uranium is producedartiÞcially by placing the naturally occurring nuclide 232Th in a reactor. A radiative capture of a neutronin 232Th leads to the formation of the radioactive nuclide 233Th. Two successive radioactive decays yield233U. In a thermal reactor, the value of h with 233U is 2.29, approaching the level where breeding mightbe contemplated. Intermediate between the two Þssile isotopes of uranium is 239Pu, which at thermalenergies yields a value of h of 2.15.
Figure 8.8.1 shows the behavior of h as the energy of the neutrons inducing Þssion increases. A littleabove thermal energies the value of h for 239Pu and 235U drops below 2, indicating that breeding isimpossible at such energies. As energy increases, the values of h for both reach the threshold of 2 andcontinue to increase steadily, with 239Pu clearly the more attractive fuel from the standpoint of breeding.The value of 239Pu for 235U is relatively insensitive to increases in energy and remains continuously above2. Again, at higher energies, h is the more attractive fuel.
Research on the development of breeder reactors has focused on the 239Pu fuel cycle, both in theU.S. and abroad. Representative of these reactors is the liquid metal fast breeder reactor (LMFBR) inwhich liquid sodium is the heat-removal ßuid and provides the small amount of moderation needed.Breeder reactors with 233U as fuel, represented by an adaptation of the high-temperature gas-cooledreactor (HTGCR), in which the heat-removal ßuid is helium and the moderator is graphite, althoughless attractive, in principle, as breeders, might with further research and development prove to be viablealternatives to the LMFBR.
LWR Fuel
Nuclear fuel in light water is in the form of small cylindrical pellets of the ceramic UO2, with the uraniumenriched to 2 to 4% in 235U, as mentioned previously. These pellets are stacked vertically in tubes andthe ends of the tubes are sealed off. The dimensions and further details given here apply strictly to themore common type of LWR, known as the pressurized water reactor (PWR), but may be taken asgenerally representative of LWRs.
The tubes containing the fuel pellets are referred to as fuel rods. They are 4.3 to 4.7 m in length and0.0095m in outside diameter. An array typically of 17 ´ 17 rods constitutes a fuel assembly, as shownin Figure 8.8.2. Certain fuel rods within the assembly are replaced by guide sheaths in which absorberrods can be moved vertically. These rods absorb neutrons, thus providing one of the means of controllingthe chain reaction as the rods are inserted or withdrawn. Within the fuel assembly the fuel rods areplaced on a pitch of 0.0127 m, leaving vertical passages through which water can ßow. A total of
h us
s= =
number of neutrons causing fission in fueltotal number of neutrons absorbed in fuel
fuel
fuelv f
a
© 1999 by CRC Press LLC

Energy Conversion 8-109
approximately 200 fuel assemblies, juxtaposed to form a roughly cylindrical conÞguration constitute thecore of the reactor. Water is circulated through the core where the water serves both to moderate theneutrons and to remove the heat generated by Þssions in the nuclear fuel.
Light-Water Reactors
LWRs currently make up the largest portion of the installed nuclear generating capacity throughout theworld. Among these, the PWRs are more numerous. By operating at a sufÞciently high pressure, bulkboiling of the reactor coolant is suppressed in a PWR. In contrast, the coolant is allowed to boil in aboiling water reactor (BWR) and a portion of the coolant is converted to steam as it circulates throughthe core.
Pressurized Water Reactors
A schematic of a PWR system is shown in Figure 8.8.3. At the heart of the system is the core made upof fuel assemblies and associated control rods. The core is contained in a reactor vessel, or pressurevessel, designed to operate at a pressure typically of 15.5 mPa. Water is circulated through the corewhere it acts as a moderator and also removes the heat generated through Þssion. Typical operatingtemperatures at full power are 295°C at the inlet and 330°C at the outlet, an increase of 35°C as a resultof the water passing through the core.
From the reactor vessel, the coolant is circulated to steam generators and returned to the reactor vesselto complete the so-called primary loop. This loop constitutes the nuclear steam supply (NSS). Steamemerging from the steam generators is directed toward the secondary loop, or balance of plant, consistingof turbine generator, condenser, and feedwater pumps. Extremely small quantities of radioactive con-taminants may be present in the steam generated in PWRs, and all releases to the environment from thesecondary side of the plant are carefully monitored and controlled. Otherwise, steam from the NSSdiffers from steam generated in fossil fueled plants only inasmuch as its grade is inferior.
FIGURE 8.8.1 Dependence of reproduction factor of neutron energy.
© 1999 by CRC Press LLC

8-110 Section 8
Boiling Water Reactors
Figure 8.8.4 is a schematic of a BWR system. A reduced operating pressure of 7.2 MPa causes a portionof the coolant to ßash to steam. Steam separators and driers allow dry steam to emerge from the reactorvessel, thus eliminating the need for separate steam generators and a secondary loop. Steam from thereactor vessel ßows through a turbine generator and condenser, from which circulating pumps returnthe condensate to the reactor. Large quantities of radioactive contamination may be present in the steamproduced by a BWR because of the direct cycle, so releases must be carefully monitored. A distinguishingfeature of the BWR are the jet pumps, typically 24 in number, placed along the periphery of the core.These pumps augment the ßow of coolant through the core.
Defining Terms
Breeder reactors: Reactors in which the conversion ratio is greater than unity.Conversion ratio: The ratio of the number of Þssile nuclei produced in a reactor to the number of Þssile
of nuclei consumed.
FIGURE 8.8.2 PWR fuel assembly.
© 1999 by CRC Press LLC
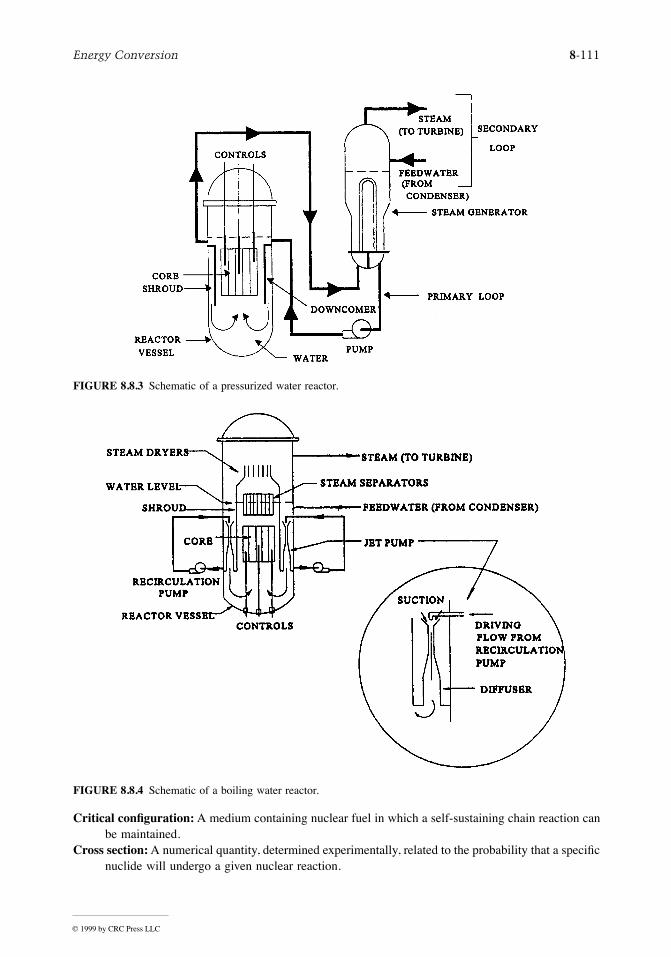
Energy Conversion 8-111
Critical conÞguration: A medium containing nuclear fuel in which a self-sustaining chain reaction canbe maintained.
Cross section: A numerical quantity, determined experimentally, related to the probability that a speciÞcnuclide will undergo a given nuclear reaction.
FIGURE 8.8.3 Schematic of a pressurized water reactor.
FIGURE 8.8.4 Schematic of a boiling water reactor.
© 1999 by CRC Press LLC

8-112 Section 8
Fast reactors: Reactors in which little moderation of the neutrons occurs and the neutron populationsconsist of neutrons of relatively high speeds.
Fertile nuclide: A nuclide that, through the absorption of a neutron and subsequent radioactive decays,can produce a Þssile nuclide.
Fissile nuclide: A nuclide that can be Þssioned by neutrons of all energies, down to and includingthermal energies.
Moderator: A component of a reactor present expressly to slow down neutrons and produce a populationof thermal neutrons.
Thermal neutrons: A population of neutrons in, or near, thermal equilibrium with the nuclei of amedium in which the populations exists.
Thermal reactors: Reactors in which the neutron populations consist predominantly of thermal neutrons.
References
Benedict, M., Pigford, T.H., and Levi, H.W. Nuclear Engineering, 2nd ed., McGraw-Hill, New York,1981.
Further Information
Glasstone, S. and Sesonske, A. Nuclear Reactor Engineering, 3rd ed., Van Nostrand Reinhold, NewYork, 1981.
© 1999 by CRC Press LLC

Energy Conversion 8-113
8.9 Nuclear Fusion
Thomas E. Shannon
Introduction
Nuclear fusion holds the promise of providing almost unlimited power for future generations. If theprocess can be commercialized as envisioned by reactor design studies (Najmabadi et al., 1994), manyof the problems associated with central electric power stations could be eliminated. Fusion power plantswould not produce the pollution caused by the burning of fossil fuel and would eliminate the concernfor meltdown associated with nuclear Þssion. The amount of radioactive waste material produced by afusion reactor will be much less than that of a Þssion reactor since there is essentially no radioactiveash from the fusion reaction. If low activation advanced materials such as silicon carbide compositescan be developed for the reactor structural material, the problem of disposal of activated componentscan also be eliminated.
Fusion Fuel
Although a number of different atomic nuclei can combine to release net energy from fusion, the reactionof deuterium and tritium (D-T) is the basis of planning for the Þrst generation of fusion reactors. Thischoice is based on considerations of reactor economy. The D-T reaction occurs at the lowest temperature,has the highest probability for reaction, and provides the greatest output of power per unit of cost(Shannon, 1989). The disadvantages of D-T as a fusion fuel are twofold. Tritium does not occur naturallyin nature and must be bred in the fusion reactor or elsewhere. Second, tritium is a radioactive isotopeof hydrogen with a relatively long half-life of 12.3 years. Since tritium can readily combine with airand water, special safety procedures will be required to handle the inventory necessary for a fusionreactor. There is hope that a less reactive fuel, such as deuterium alone (D-D) will eventually prove tobe an economically acceptable alternative (Shannon, 1989).
Confinement Concepts
Magnetic fusion, based on the tokamak concept, has received the majority of research funding for fusionenergy development. However, other magnetic fusion concepts, such as the stellarator, the sphericaltorus, reversed-Þeld pinch, and Þeld-reversed conÞgurations, are being developed as possible alternativesto the tokamak (ShefÞeld, 1994). It may also be possible to develop fusion power reactors by inertialconÞnement concepts (Waganer et al., 1992). Research on these concepts has been done primarily insupport of weapons development; therefore, the level of scientiÞc understanding for power reactorapplications is signiÞcantly less than that of magnetic fusion. The remainder of this discussion on reactordevelopment, fusion energy conversion, and transport will consider only the tokamak magnetic fusionconcept.
Tokamak Reactor Development
The tokamak device has proved to be the most effective means of producing the conditions necessaryfor magnetic fusion energy production. In 1994, researchers at the Princeton Plasma Physics Laboratoryachieved in excess of 10 MW of D-T fusion power in a research tokamak, the Tokamak Fusion TestReactor (TFTR). This accomplishment, coupled with worldwide progress in 40 years of magnetic fusionresearch, has established the scientiÞc feasibility of the tokamak concept. The next major step, theInternational Thermonuclear Experimental Reactor (ITER) is being carried out under an internationalagreement among Europe, Japan, Russia, and the United States (Conn et al., 1992). A drawing of theITER tokamak is shown in Figure 8.9.1. If the project is approved for construction, it will be in operation
© 1999 by CRC Press LLC

8-114 Section 8
around 2005. The ITER is being designed to produce a fusion power in excess of 1000 MW. This willbe a signiÞcant step on the path to commercial fusion power.
The U.S. Department of Energy has proposed a strategy, shown in Figure 8.9.2, which will lead to ademonstration power reactor by the year 2025. Supporting research and development programs necessaryto achieve this goal are shown in this Þgure.
FIGURE 8.9.1 The International Thermonuclear Experimental Reactor (ITER).
FIGURE 8.9.2 The U.S. Department of Energy magnetic fusion energy strategy.
© 1999 by CRC Press LLC

Energy Conversion 8-115
Fusion Energy Conversion and Transport
The energy from fusion is created in the form of charged particles and neutrons. The D-T reactionproduces a neutron with an energy of 14.1 MeV and an alpha particle (helium) with an energy of 3.5MeV in the reaction
D + T ® He4 (3.5 MeV) + n(14.1 MeV)
In the tokamak device, the reaction will take place in the toroidal vacuum vessel as previously shownin the ITER drawing, Figure 8.9.1. The D-T fuel, in the form of a plasma, will absorb energy from thepositively charged alpha particles to sustain the temperature necessary for the reaction to continue. Theneutron, having no charge, will escape from the plasma and pass through the wall of the vessel andpenetrate into the surrounding blanket/shield structure. The kinetic energy of the alpha particles fromthe fusion reaction is eventually deposited on the wall of the vacuum vessel by radiation and conductionheat transfer from the plasma while the neutron deposits most of its energy within the cross section ofthe blanket/shield. The resulting thermal energy is transferred by a coolant such as water to a steamgenerator where a conventional steam to electric generator system may be used to produce electricity.An overall schematic diagram of the energy conversion and heat-transport system is shown in Figure8.9.3.
Defining Terms
Deuterium and tritium: Isotopes of hydrogen as the fuel for fusion reactors.Half-life: The time required for half of the radioactive material to disintegrate.Low activation advanced materials: Structural materials that signiÞcantly reduce the radioactivity
induced by exposure to fusion neutrons.
FIGURE 8.9.3 Schematic Diagram of a Magnetic Fusion Reactor Power Plant.
© 1999 by CRC Press LLC

8-116 Section 8
Plasma: A gas such as a mixture of deuterium and tritium raised to a very high temperature at whichthe electrons and the nuclei of the atoms separate. The plasma, consisting of electrons and ions,can conduct electricity and react to magnetic Þelds.
References
Conn, R.W., Chuyanov, V.A., Inoue, N., and Sweetman, D.R. 1992. The International ThermonuclearExperimental Reactor, Sci. Am. 266(4).
Najmabadi, F. et al. 1994. The ARIES-II and -IV Second Stability Tokamak Reactors, University ofCalifornia, Los Angeles, report UCLA-PPG-1461.
Shannon, T.E. 1989. Design and cost evaluation of a generic magnetic fusion reactor using the DÐDfuel cycle. Fusion Technol. 15(2), Part 2B, 1245Ð1253
ShefÞeld, J. 1994. The physics of magnetic fusion reactors. Rev. Mod. Phy. 66(3).Waganer, L. et al. 1992. Inertial Fusion Energy Reactor Design Studies. U.S. Department of Energy
Report. Vol. I, II, and III, DOE/ER-54101 MDC 92E0008.
Further Information
The U.S. Department of Energy, OfÞce of Fusion Energy maintains a home page on the World WideWeb. The address http://wwwofe.er.doe.gov provides an excellent source of up-to-date information andaccess to information from most institutions involved in fusion research.
© 1999 by CRC Press LLC

Energy Conversion 8-117
8.10 Solar Thermal Energy Conversion
D. Yogi Goswami
Introduction
Solar thermal energy applications such as space and water heating have been known for a long time.Researchers over the past few decades have developed a number of additional solar thermal applications,such as industrial process heat, refrigeration and air-conditioning, drying and curing of agriculturalproducts, and electric power production by solar thermal conversion. This section will cover solar thermalenergy conversion including solar thermal collectors and conversion systems.
Solar Thermal Collectors
A simple solar thermal collector consists of (1) an absorber surface (usually a dark, thermally con-ducting surface), (2) some insulation behind the surface to reduce heat loss, (3) a trap for thermalreradiation from the surface such as glass, which transmits the shorter-wavelength solar radiation butblocks the longer-wavelength radiation from the absorber, and (4) a heat-transfer medium such as air,water, etc. High-temperature collectors require reßectors of sunlight that concentrate solar radiation onthe absorber. The technology of solar collectors is developed to achieve temperatures as high as 1000°Cor even higher. The design of a solar collector and the choice of working ßuids depend on the desiredtemperature and the economics of the application. Table 8.10.1 lists the types of solar thermal collectorsbased on their temperature range.
Flat Plate Collectors
Flat plate collectors may be designed to use liquids (water, oil, etc.) or air as the heat-transfer ßuid.Figure 8.10.1 shows a typical liquid-type ßat plate collector. The choice of materials for glazing andabsorber needs special attention.
Glazing. The purpose of glazing is to (1) transmit the shorter-wavelength solar radiation, but blockthe longer-wavelength reradiation from the absorber plate, and (2) reduce the heat loss by convectionfrom the top of the absorber plate. Glass is the most widely used glazing material. Transmittance of lowiron glass in the visible and near infrared wavelength range can be as much as 91%, while for the longer-wavelength radiation (>3 mm) its transmittance is almost zero. Other materials than can be used asglazings include certain plastic sheets such as polycarbonates (Lexan¨ and Tuffac¨ Ñ transmittance~75%), acrylics (Plexiglass¨ and Lucite¨ Ñ transmittance ~92%), and thin plastic Þlms such as poly-ethylene. A major advantage of the plastics is that they are shatterproof; however, they scratch easilyand lose transparency over time.
Absorbers. Copper is the most common material used for absorber plates and tubes because of itshigh thermal conductivity and high corrosion resistance. For low-temperature applications such asswimming pool heating, a plastic material called ethylene propylene polymer (trade names EPDM, HCP,
TABLE 8.10.1 Types of Solar Collectors and Their Typical Temperature Range
Type of Collector Concentration Ratio Typical WorkingTemperature Range (°C)
Flat plate collector 1 £70High-efÞciency ßat plate collector 1 60Ð120Fixed concentrator 2Ð5 100Ð150Parabolic trough collector 10Ð50 150Ð350Parabolic dish collector 200Ð2000 250Ð700Central receiver tower 200Ð2000 400Ð1000
Source: Compiled from Goswami, D.Y., Alternative Energy in Agriculture, Vol. 1, CRC Press, Boca Raton, FL, 1980.
© 1999 by CRC Press LLC
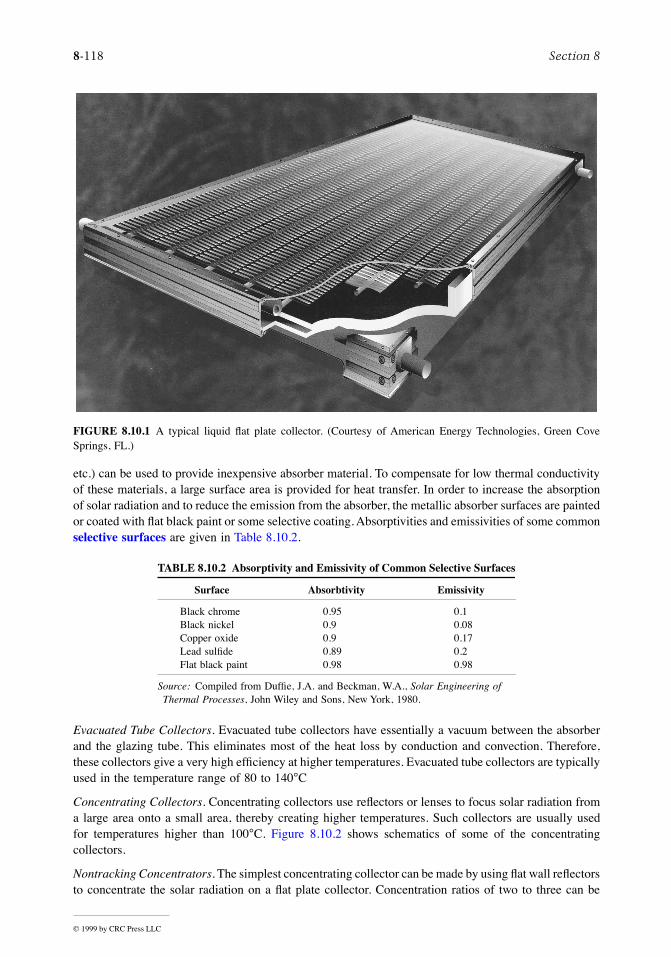
8-118 Section 8
etc.) can be used to provide inexpensive absorber material. To compensate for low thermal conductivityof these materials, a large surface area is provided for heat transfer. In order to increase the absorptionof solar radiation and to reduce the emission from the absorber, the metallic absorber surfaces are paintedor coated with ßat black paint or some selective coating. Absorptivities and emissivities of some commonselective surfaces are given in Table 8.10.2.
Evacuated Tube Collectors. Evacuated tube collectors have essentially a vacuum between the absorberand the glazing tube. This eliminates most of the heat loss by conduction and convection. Therefore,these collectors give a very high efÞciency at higher temperatures. Evacuated tube collectors are typicallyused in the temperature range of 80 to 140°C
Concentrating Collectors. Concentrating collectors use reßectors or lenses to focus solar radiation froma large area onto a small area, thereby creating higher temperatures. Such collectors are usually usedfor temperatures higher than 100°C. Figure 8.10.2 shows schematics of some of the concentratingcollectors.
Nontracking Concentrators. The simplest concentrating collector can be made by using ßat wall reßectorsto concentrate the solar radiation on a ßat plate collector. Concentration ratios of two to three can be
FIGURE 8.10.1 A typical liquid ßat plate collector. (Courtesy of American Energy Technologies, Green CoveSprings, FL.)
TABLE 8.10.2 Absorptivity and Emissivity of Common Selective Surfaces
Surface Absorbtivity Emissivity
Black chrome 0.95 0.1Black nickel 0.9 0.08Copper oxide 0.9 0.17Lead sulÞde 0.89 0.2Flat black paint 0.98 0.98
Source: Compiled from DufÞe, J.A. and Beckman, W.A., Solar Engineering of Thermal Processes, John Wiley and Sons, New York, 1980.
© 1999 by CRC Press LLC

Energy Conversion 8-119
achieved this way. For slightly higher concentration ratios, a novel design, developed by Roland Winston,called a Òcompound parabolic concentratorÓ (CPC) can be used (Winston, 1974).
Tracking Concentrators. For temperatures up to 350°C, cylindrical parabolic trough collectors are used.These collectors focus solar radiation on a line focus where the absorber is located. These collectorsusually require tracking on one axis only with seasonal adjustment on the other axis. A reßecting sphericalor paraboloidal bowl is used when temperatures of the order of 250 to 500°C are needed. These collectors
FIGURE 8.10.2 Types of concentrating collectors. (A) Flat plate collector with reßective wings; (B) Compoundparabolic concentrator; (C) parabolic trough; (D) central receiver; (E) parabolic dish.
© 1999 by CRC Press LLC

8-120 Section 8
require two-axis tracking. In some cases, the dish is kept stationary while the receiver is moved to trackthe focus of the reßected solar radiation. Finally, for extremely high temperatures (500 to 1000°C) neededfor large-scale thermal power generation, a large Þeld of tracking ßat mirrors (called heliostats) is usedto concentrate solar radiation on a receiver that is located on top of a central tower.
Collector Thermal Performance
The instantaneous efÞciency of a collector is given by
(8.10.1)
where
(8.10.2)
and A = area of the collector, I = incident solar energy per unit area, Cp, Ti, and To are the massßow rate, speciÞc heat, and inlet and outlet temperatures of the heat-transfer ßuid.
The efÞciency of a ßat plate solar collector can also be written by the HottelÐWhillierÐBliss equation:
(8.10.3)
where FR, called the collector heat-removal factor, is a convenient parameter that gives the ratio of theactual useful energy gain of a ßat plate collector to the useful gain if the whole collector surface wereat the inlet ßuid temperature; (ta)e = effective transmittance absorptance product; and UL = collectorheat-loss coefÞcient.
Equation 8.10.2 suggests that if the efÞciency, h, is plotted against (Ti Ð Tamb)/I, the resulting curvewill have a y intercept equal to FR (ta)e and a slope of FRUL. A linear curve usually gives an adequateapproximation. Figure 8.10.3 shows an example of a performance curve for a water-heating ßat platecollector, which is a linear least square curve Þt to the actual test data.
Solar Ponds
A solar pond combines collector and energy storage in one unit. Solar radiation that enters the pondtravels some distance through the water before being totally absorbed, thus increasing the temperatureof the water at that depth. The heat thus collected can be stored in the pond by creating a stagnant,transparent, insulating layer in the top part of the pond. The most common method is by the additionof a salt into the pond to increase the density of water in the lower section of the pond. This type ofpond is called a salt gradient solar pond. Reid (1987) reviewed the progress in the design andapplications of salt gradient solar ponds. Figure 8.10.4 shows a schematic of a salt gradient pond alongwith a density proÞle in the pond.
The theory of salt gradient solar ponds has been described by Tabor (1981). The most important aspectof such ponds is the creation and maintenance of the salt gradient. Theory shows that the condition formaintaining stability is
(8.10.4)
h = =Useful energy collected
Incident solar energy
Q A
Iu
Q mC T Tu p o i= -( )
Ç,m
h ta= ( ) --( )
F F UT T
IR e R Li amb
¶¶
¶r
¶¶
¶r
S
Z T
T
Z S> - ´1 14.
© 1999 by CRC Press LLC

Energy Conversion 8-121
where S is the salt concentration in kilograms per cubic meter, Z is the depth from the surface in meters,r is the density in kilograms per cubic meter, and T is the temperature in Kelvin. The two most commonsalts considered for solar pond applications are NaCl and MgCl2. According to the above criteria, thereis no difÞculty in obtaining stability with MgCl2 and it is somewhat difÞcult but possible to get stabilitywith NaCl.
Solar Water-Heating Systems
Solar water-heating systems represent the most common application of solar energy at the present time.Small systems are used for domestic hot water applications while larger systems are used in industrialprocess heat applications. There are basically two types of water-heating systems: natural circulationor passive solar system (thermosyphon) and forced circulation or active solar system.
Natural Circulation
Figure 8.10.5 shows a schematic of a natural circulation solar water-heating system. It is also called athermosyphon or passive solar water heater because it does not require a pump to circulate water. Thestorage tank is located above the collector. When the water in the collector gets heated, it rises into thetank, because of density change, setting up a circulation loop.
FIGURE 8.10.3 Thermal efÞciency curve for a double-glazed ßat plate liquid-type of solar collector. (Reprintedby permission of the American Society of Heating, Refrigerating and Air-Conditioning Engineers, Inc., Atlanta, GA,from ASHRAE Standard 93-77, Methods of Testing to Determine the Thermal Performance of Solar Collectors,1977.)
FIGURE 8.10.4 Schematic of a salt gradient solar pond.
Col
lect
or E
ffici
ency
, %
0 .02 .04 .06 .08 .10
80
60
40
20
Collector Tilt Angle, 45°Inlet Temperature, 32° to 60°CFlow Rate, 0.0136 KG/ (s-sq.m.)Solar Flux, 599 to 1009 W/sq.m.
Tests conducted outside1.22m by 1.25m liquid-heating collector10.2 cm of glass fiber back insulationcopper absorber, flat-black coating, ¥ = 0.97
°c . m2
wtf,i - ta
1
© 1999 by CRC Press LLC

8-122 Section 8
Forced Circulation
Figure 8.10.6 shows three conÞgurations of forced circulation systems: (1) open loop, (2) closed loop,and (3) closed loop with drainback. In an open loop system, the collectors are empty when they are notproviding useful heat and the storage tank is at atmospheric pressure. A disadvantage of this system isthe high pumping power required to pump the water to the collectors every time the collectors get hot.This disadvantage is overcome in the pressurized closed loop system (Figure 8.10.6B) since the pumphas to overcome only the resistance of the pipes. Because water always stays in the collectors of thissystem, antifreeze (propylene glycol or ethylene glycol) is required for locations where freezing condi-tions can occur. During stagnation conditions (in summer), the temperature in the collector can becomevery high, causing the pressure in the loop to increase. This can cause leaks in the loop unless someßuid is allowed to escape through a pressure-relief valve. In both cases, air enters the loop causing thepump to run dry. This disadvantage can be overcome in a closed loop drainback system (Figure 8.10.6C).In this system, when the pump shuts off, the water in the collectors drains back into a small holdingtank, which can be located where freezing does not occur. The holding tank can be located at a highlevel to reduce pumping power.
Industrial Process Heat Systems
For temperatures of up to about 100°C, required for many industrial process heat applications, forcedcirculation water-heating systems described above can be used. The systems, however, will require alarge collector area, storage and pumps, etc. For higher temperatures, evacuated tube collectors orconcentrating collectors must be used.
Space-Heating Systems
Solar space-heating systems can be classiÞed as active or passive depending on the method utilized forheat transfer. A system that uses pumps and/or blowers for ßuid ßow in order to transfer heat is calledan active system. On the other hand, a system that utilizes natural phenomena for heat transfer is calleda passive system. Examples of passive solar space-heating systems include direct gain, attached green-house, and storage wall (also called Trombe wall).
Active space-heating systems store solar collected heat in water or rocks. Heat from water storagecan be transferred to the space by convertors or by fan-coil units. A system using a fan-coil unit can beintegrated with a conventional air system as shown in Figure 8.10.7. Heat from rock storage can betransferred to air by simply blowing air over the rocks.
FIGURES 8.10.5 Schematic of a thermosyphon solar water-heating system.
© 1999 by CRC Press LLC

Energy Conversion 8-123
FIGURE 8.10.6 Typical conÞgurations of solar water-heating systems: (A) open loop system, (B) closed loopsystem, (C) closed loop drainback system. (Adapted from Goswami, D.Y., Alternative Energy in Agriculture, Vol.1, CRC Press, Boca Raton, FL, 1986.)
FIGURE 8.10.7 Schematic of an active solar space-heating system.
© 1999 by CRC Press LLC
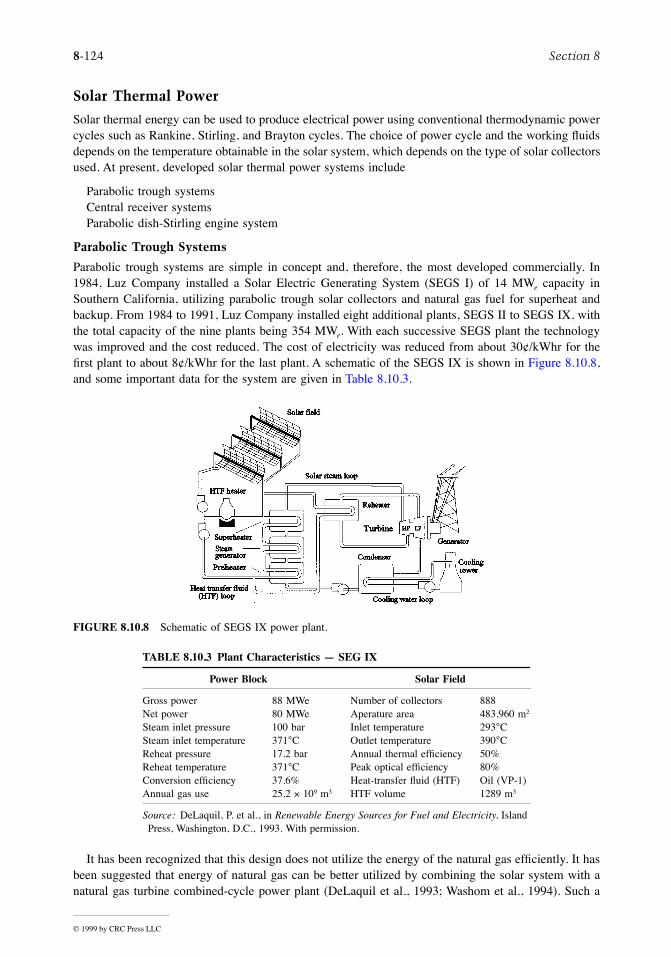
8-124 Section 8
Solar Thermal Power
Solar thermal energy can be used to produce electrical power using conventional thermodynamic powercycles such as Rankine, Stirling, and Brayton cycles. The choice of power cycle and the working ßuidsdepends on the temperature obtainable in the solar system, which depends on the type of solar collectorsused. At present, developed solar thermal power systems include
Parabolic trough systemsCentral receiver systemsParabolic dish-Stirling engine system
Parabolic Trough Systems
Parabolic trough systems are simple in concept and, therefore, the most developed commercially. In1984, Luz Company installed a Solar Electric Generating System (SEGS I) of 14 MWe capacity inSouthern California, utilizing parabolic trough solar collectors and natural gas fuel for superheat andbackup. From 1984 to 1991, Luz Company installed eight additional plants, SEGS II to SEGS IX, withthe total capacity of the nine plants being 354 MWe. With each successive SEGS plant the technologywas improved and the cost reduced. The cost of electricity was reduced from about 30¢/kWhr for theÞrst plant to about 8¢/kWhr for the last plant. A schematic of the SEGS IX is shown in Figure 8.10.8,and some important data for the system are given in Table 8.10.3.
It has been recognized that this design does not utilize the energy of the natural gas efÞciently. It hasbeen suggested that energy of natural gas can be better utilized by combining the solar system with anatural gas turbine combined-cycle power plant (DeLaquil et al., 1993; Washom et al., 1994). Such a
FIGURE 8.10.8 Schematic of SEGS IX power plant.
TABLE 8.10.3 Plant Characteristics Ñ SEG IX
Power Block Solar Field
Gross power 88 MWe Number of collectors 888Net power 80 MWe Aperature area 483,960 m2
Steam inlet pressure 100 bar Inlet temperature 293°CSteam inlet temperature 371°C Outlet temperature 390°CReheat pressure 17.2 bar Annual thermal efÞciency 50%Reheat temperature 371°C Peak optical efÞciency 80%Conversion efÞciency 37.6% Heat-transfer ßuid (HTF) Oil (VP-1)Annual gas use 25.2 ´ 109 m3 HTF volume 1289 m3
Source: DeLaquil, P. et al., in Renewable Energy Sources for Fuel and Electricity, Island Press, Washington, D.C., 1993. With permission.
© 1999 by CRC Press LLC

Energy Conversion 8-125
hybrid system would use the exhaust of a natural gas turbine for superheating and preheating of water,while the solar Þeld would be used for steam generation. Such a hybrid system can achieve conversionefÞciency as high as 60%. A schematic of a solar hybrid combined cycle is shown in Figure 8.10.9.
Central Receiver System
A central receiver system can potentially operate at very high temperature and therefore can have muchhigher efÞciency than parabolic trough systems. However, the system can be economical only at largercapacities, such as 100 MW and above. The central receiver absorber can heat the working ßuid or anintermediate ßuid to a temperature as high as 600 to 1000°C which can be used to drive a Rankine cycleor Brayton cycle.
Solar One, a 10-MWe central receiver power plant started operating in 1982 in Barstow, California.This plant generated superheated steam at 510°C and 10.3 MPa in the receiver absorber, which was usedto drive a simple steam Rankine power cycle. The plant operated successfully for 6 years and provideda good learning experience. The plant has now been redesigned as Solar Two in which molten sodiumnitrate is used as the heat-transfer ßuid as well as for storage. Use of molten salt allows operation ofthe receiver absorber at much lower pressures The constraint is that the salt must always be above itsmelting point (220°C). Figure 8.10.10 shows a schematic of the Solar Two power plant.
Parabolic Dish Systems
Parabolic dish systems can achieve very high temperatures. The high temperatures produced by parabolicdishes can be used to drive Rankine, Stirling, and Brayton power cycles. So far, Rankine and Stirlingcycles have been successfully demonstrated with parabolic dishes for electrical power production.
Early versions of parabolic dishes were made from die-stamped aluminum petals made reßectiveusing a metallized polymer Þlm. Later designs used simpler ßat mirror facets Þxed on a structure insuch a way as to approximate a parabolic dish. The latest designs use a polymer Þlm stretched on acircular frame (Mancini, 1994). The Þlm is given a slight concave curvature by providing a vacuumbehind it. These stretched polymer Þlms are Þxed on a structure to approximate a parabolic dish. Becauseof the low weight of the polymer Þlm, the dish structure can be made out of light tubular members,thereby reducing the cost of the dish considerably. Parabolic dishes require two-axis tracking.
McDonnell Douglas Corporation successfully demonstrated a 25-KWe parabolic dish system using aStirling engine and a generator assembly Þxed at the focal point of the dish in 1985 (Gupta, 1987). Theconcept is very attractive because it provides a modular design of stand-alone power plants for small
FIGURE 8.10.9 Solar hybrid combined cycle. (Adapted from Washom, B. et al., paper presented at the 1994 ASESAnnual Conference, San Jose, CA, 1994.)
© 1999 by CRC Press LLC

8-126 Section 8
communities and independent power applications. Cummins Power Generation Company, in Indiana,has developed this concept further (Mancini, 1994). The Cummins system uses stretched polymer Þlmfacets for a parabolic dish, a heat pipe receiver absorber, a free-piston Stirling engine, and a linearalternator, resulting in a very compact power generation system. Figures 8.10.11 shows the latest versionof the Cummins Dish Stirling power system. A detailed discussion of Stirling engines is given in Section8.5.
NomenclatureA = area of collector
Cp = speciÞc heat m = mass ßow rate T = temperature I = incident solar radiation
Qn = useful heat collected FR = collector heat-removal factor UL = collector heat-loss coefÞcient
S = salt concentration Z = depth
Greek Symbols a = absorptancet = transmittanceh = efÞciencyr = density
Subscriptsi = inlet o = outlet
amb = ambient e = effective
Defining Terms
Forced circulation or active solar system: A solar thermal system that uses active means, such aspumps, for ßuid ßow and heat transfer.
FIGURE 8.10.10 Schematic of Solar Two.
© 1999 by CRC Press LLC

Energy Conversion 8-127
Glazing: A material used in a solar collector that transmits short-wavelength solar radiation and blockslonger-wavelength reradiation from the absorber plate.
Natural circulation passive solar system: A solar thermal system that uses natural means, such as thethermosyphon effect, for ßuid ßow and heat transfer.
Salt gradient solar pond: A solar pond that uses high salt concentration in the lowest layer and aconcentration gradient in the middle layer to make those layers nonconvective.
Selective surface: A surface that has high absorptance in short wavelengths and low emittance in longerwavelengths.
Solar hybrid combined cycle: A hybrid of solar and natural gas turbine combined cycle.Solar thermal collector: A solar collector that absorbs sunlight and converts it to heat.
Figures 8.10.11 A parabolic dish Ñ Stirling Engine Power System.
© 1999 by CRC Press LLC

8-128 Section 8
References
ASHRAE. 1977. ASHRAE Standard 93-77, Method of Testing to Determine the Thermal Performanceof Solar Collectors, ASHRAE, Atlanta, GA.
DeLaquil, P., Kearney, D., Geyer, M., and Diver, R. 1993. Solar thermal electric technology, Chapter 5in Renewable Energy Sources for Fuel and Electricity, T.B. Johansson, M. Kelly, A.K.N. Reddy,and R.H. Williams, Eds., Island Press, Washington, D.C.
DufÞe, J.A. and Beckman, W.A. 1980. Solar Engineering of Thermal Processes, John Wiley & Sons,New York.
Goswami, D.Y. 1986. Alternative Energy in Agriculture, Vol. I, CRC Press, Boca Raton, FL.Gupta, B.P. 1987. Status and progress in solar thermal research and technology, in Progress in Solar
Engineering, Ed. D.Y. Goswami, Hemisphere Publishing, Washington, D.C.Mancini, T.R. 1994. The DOE solar thermal electric program, in Proceedings of the 1994 IECEC, pp.
1790Ð1975. AIAA, Washington, D.C.Reid, R.L. 1987. Engineering design of salt gradient solar pond for thermal and electric energy, in
Progress in Solar Engineering, Ed. D.Y. Goswami, Hemisphere Publishing, Washington, D.C.Tabor, H. 1981. Solar ponds. Solar Energy, 27(3), 181.Washom, B., Mason, W., Schaefer, J.C., and Kearney, D. 1994. Integrated Solar Combined Cycle Systems
(ISCCS) Utilizing Solar Parabolic Trough Technology Ñ Golden Opportunities for the 90s, paperpresented at the 1994 ASES Annual Conference, San Jose, CA.
Winston, R. 1974. Principles of solar concentrators of novel design. Solar Energy, 16(2), 89.
Further Information
For solar heating and cooling:Solar Engineering of Thermal Processes, by J.A. DufÞe and W.A. Beckman, John Wiley & Sons, New
York, 1980.Principles of Solar Engineering, by F. Kreith and J.F. Kreider, Hemisphere Publishing, a division of
Taylor and Francis, Washington, D.C., 1978.For solar thermal power:Solar Energy Fundamentals and Design, by W.B. Sine and R.W. Harrigan, John Wiley & Sons, New
York, 1985.
© 1999 by CRC Press LLC
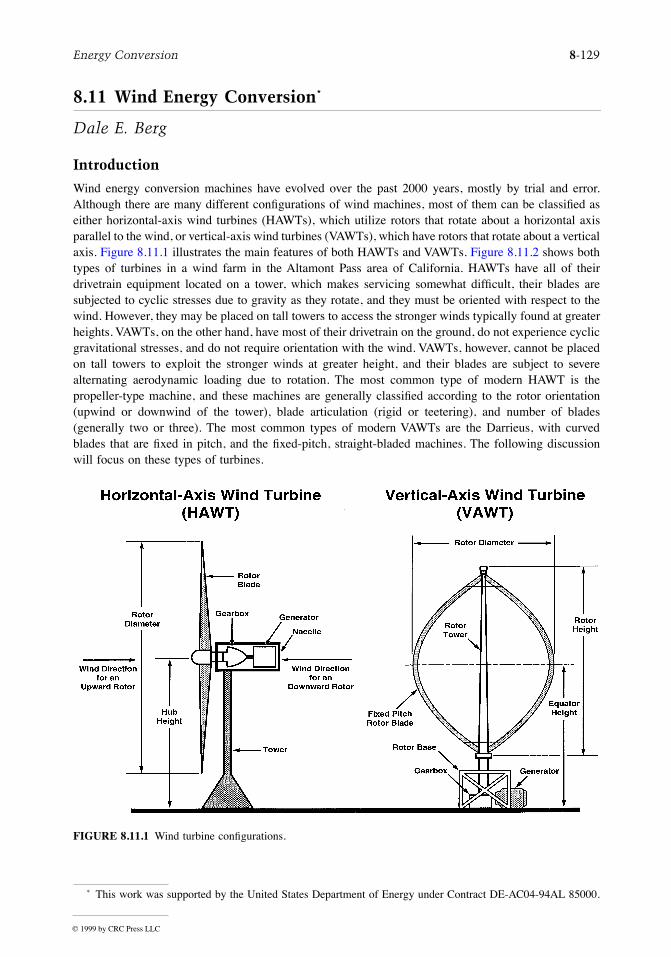
Energy Conversion 8-129
8.11 Wind Energy Conversion*
Dale E. Berg
Introduction
Wind energy conversion machines have evolved over the past 2000 years, mostly by trial and error.Although there are many different conÞgurations of wind machines, most of them can be classiÞed aseither horizontal-axis wind turbines (HAWTs), which utilize rotors that rotate about a horizontal axisparallel to the wind, or vertical-axis wind turbines (VAWTs), which have rotors that rotate about a verticalaxis. Figure 8.11.1 illustrates the main features of both HAWTs and VAWTs. Figure 8.11.2 shows bothtypes of turbines in a wind farm in the Altamont Pass area of California. HAWTs have all of theirdrivetrain equipment located on a tower, which makes servicing somewhat difÞcult, their blades aresubjected to cyclic stresses due to gravity as they rotate, and they must be oriented with respect to thewind. However, they may be placed on tall towers to access the stronger winds typically found at greaterheights. VAWTs, on the other hand, have most of their drivetrain on the ground, do not experience cyclicgravitational stresses, and do not require orientation with the wind. VAWTs, however, cannot be placedon tall towers to exploit the stronger winds at greater height, and their blades are subject to severealternating aerodynamic loading due to rotation. The most common type of modern HAWT is thepropeller-type machine, and these machines are generally classiÞed according to the rotor orientation(upwind or downwind of the tower), blade articulation (rigid or teetering), and number of blades(generally two or three). The most common types of modern VAWTs are the Darrieus, with curvedblades that are Þxed in pitch, and the Þxed-pitch, straight-bladed machines. The following discussionwill focus on these types of turbines.
* This work was supported by the United States Department of Energy under Contract DE-AC04-94AL 85000.
FIGURE 8.11.1 Wind turbine conÞgurations.
© 1999 by CRC Press LLC

8-130 Section 8
While small and even medium-sized machines have been developed primarily through trial and error,developing larger, more-complex, and highly efÞcient machines this way becomes very expensive andtime-consuming. A large cost-effective machine can be developed at a reasonable cost only if thedesigners can accurately predict the performance of conceptual machines and investigate the effects ofdesign alternatives. In the past two decades numerous techniques to predict the aerodynamic andstructural dynamic performance of wind turbines have been developed. These analytical models are not,in general, amenable to simple approximations, but must be solved with the use of computer codes ofvarying complexity. These models and codes will be summarized in the following sections.
Wind Turbine Aerodynamics
Items exposed to the wind are subjected to both drag (in the direction of the wind) and lift (perpendicularto the wind) forces. The earliest wind machines used drag to produce power. The European and Americanwindmills discussed in Section 7 of Chapter 7 were primarily drag devices, but they did make some useof lift. Modern wind turbines rely on airfoil-shaped blades that generate large amounts of lift to producepower more efÞciently than the drag machines. Let us consider how efÞcient these machines are atextracting energy from the wind.
Figure 8.11.3 illustrates the ßow Þeld about a translating drag device. The drag results from the relativevelocity between the wind and the device, and the power that is generated by the device (the productof the drag force and the translation velocity) is given by
(8.11.1)
FIGURE 8.11.2 Wind farm both horizontal-axis and vertical-axis turbines.
P Dlv U v C clvD= = -( )[ ]0 5 2. r
© 1999 by CRC Press LLC

Energy Conversion 8-131
where
P = power extracted in wattsD = drag force per unit spanwise length in n/ml = length of device (distance into the page) in mv = translation velocity in m/secr = air density in kg/m3
U = steady free-stream wind velocity in m/secCD = drag coefÞcient; function of device geometry function
c = width of device (perpendicular to wind) in m
The velocity of the device must always be less than the wind velocity, or no drag is generated. Thepower coefÞcient (the ratio of the power extracted to the power available in the area occupied by thedevice) for this machine is
(8.11.2)
Now consider a device that utilizes lift to extract power from the wind. Figure 8.11.4 illustrates anairfoil that is translating at right angles to the wind direction and is subject to both lift and drag forces.The relative velocity across this surface is the vector sum of the free-stream wind velocity and the windspeed induced by translation. The angle between the direction of the relative velocity and the chord lineof the airfoil is termed the angle of attack a. In this case, the power is given by
(8.11.3)
where c = airfoil chord length in m and CL, CD = lift and drag coefÞcients, respectively; functions ofairfoil shape and a. The power coefÞcient then is
(8.11.4)
Figure 8.11.5 compares Equations (8.11.2) and (8.11.4) using CL = 1.0 and CD = 0.10 for the airfoil(easily achieved with modern airfoils) and a maximum drag coefÞcient of 2.0 for the drag machine. Theairfoil has a maximum power coefÞcient of 15, compared with 0.3 for the drag device, or 50 times morepower per unit of projected area. Moreover, operating a lifting device at velocities well in excess of thewind velocity is easily achieved with rotating machines.
FIGURE 8.11.3 Schematic of translating drag device.
CP
U cl
v
U
v
UCp D= = -é
ëêùûú0 5
13
2
. r
P U clv
UC C
v
U
v
UL D= -éëê
ùûú
+ æè
öø
0 5 132
. r
Cv
UC C
v
U
v
Up L D= -éëê
ùûú
+ æè
öø
12
© 1999 by CRC Press LLC

8-132 Section 8
Machines discussed in this section utilize lift-producing blades to capture wind energy.
Aerodynamic Models
The aerodynamic analysis of a wind turbine has two primary objectives: (1) to predict the power producedby of the turbine and (2) to predict the detailed aerodynamic loads which will act on the turbine rotorblades. In general, the same models are used to accomplish both objectives. The aerodynamics of windturbines are far too complex to model with simple formulas that can be solved with hand-held calculators;computer based models ranging from very simpliÞed to very complex are required. The various modelscommonly used today are described below.
Momentum Models
The simplest aerodynamic model of a wind turbine is the actuator disk model or momentum theory inwhich the turbine is modeled as a single porous disk. In this model the axial force acting on the rotoror disk is equated to the time rate of change of momentum of the airstream passing through the rotor
FIGURE 8.11.4 Schematic of translating lift device.
FIGURE 8.11.5 Comparison of power coefÞcients for a translating airfoil and a translating drag device. The airfoilis moving at right angles to the wind direction. The drag device is moving in the wind direction.
© 1999 by CRC Press LLC
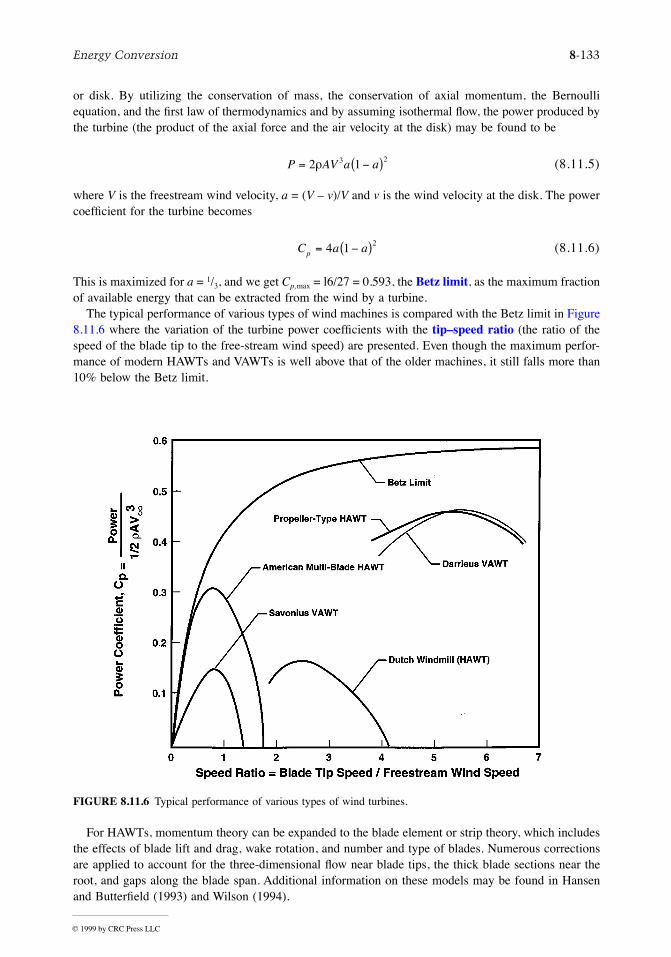
Energy Conversion 8-133
or disk. By utilizing the conservation of mass, the conservation of axial momentum, the Bernoulliequation, and the Þrst law of thermodynamics and by assuming isothermal ßow, the power produced bythe turbine (the product of the axial force and the air velocity at the disk) may be found to be
(8.11.5)
where V is the freestream wind velocity, a = (V Ð v)/V and v is the wind velocity at the disk. The powercoefÞcient for the turbine becomes
(8.11.6)
This is maximized for a = 1/3, and we get Cp,max = l6/27 = 0.593, the Betz limit, as the maximum fractionof available energy that can be extracted from the wind by a turbine.
The typical performance of various types of wind machines is compared with the Betz limit in Figure8.11.6 where the variation of the turbine power coefÞcients with the tipÐspeed ratio (the ratio of thespeed of the blade tip to the free-stream wind speed) are presented. Even though the maximum perfor-mance of modern HAWTs and VAWTs is well above that of the older machines, it still falls more than10% below the Betz limit.
For HAWTs, momentum theory can be expanded to the blade element or strip theory, which includesthe effects of blade lift and drag, wake rotation, and number and type of blades. Numerous correctionsare applied to account for the three-dimensional ßow near blade tips, the thick blade sections near theroot, and gaps along the blade span. Additional information on these models may be found in Hansenand ButterÞeld (1993) and Wilson (1994).
FIGURE 8.11.6 Typical performance of various types of wind turbines.
P AV a a= -( )2 13 2r
C a ap = -( )4 1 2
© 1999 by CRC Press LLC

8-134 Section 8
Momentum theory may also be expanded for vertical-axis turbines into the multiple streamtube andthe double-multiple streamtube theories that are the VAWT equivalent of the HAWT blade elementtheory. Additional information on these models may be found in Touryan et al. (1987) and Wilson (1994).
Wind shear and local Reynolds number variations may be readily accounted for with both the bladeelement and multiple streamtube methods. These models are extremely popular with wind turbinedesigners because they are simple, fast, and fairly accurate for performance prediction. However, theyare very approximate methods based upon the assumption of steady ßow and streamtubes that are Þxedin time and space. More-complex models such as vortex and local circulation models are needed for theanalysis of yawed ßow, unsteady aerodynamics, and other complex ßows, all of which can have largeimpacts on turbine performance and loads.
Vortex Models
Vortex models, based on the vorticity equation, can use either lifting line or lifting surface formulationsfor the blades with either free-wake or Þxed- (or prescribed- ) wake models, although there are a numberof variations of these models. The three-dimensional, lifting-surface, free-wake formulation is the mostphysically realistic model, but a computer program implementing such a model will require a tremendousamount of computer resources and time. The problem with vortex codes is one of Þnding a balancebetween model simpliÞcation (and limitation) and computation time. Additional information on vortexmodels may be found in Strickland et al. (1981) and Kocurek (1987).
Local Circulation Method
The local circulation method (LCM) utilizes a balance between the force on the blade and the changein wind momentum as it passes through the rotor, similar to what is done with the momentum models.The blade, however, is represented as a superposition of imaginary blades of different spans with ellipticalcirculation distributions. Unlike the streamtube models, LCM models may be formulated to analyzeunsteady ßow, and are able to yield detailed ßow Þeld velocity and blade-loading information. The LCMyields better answers than the momentum models, avoids the convergence problems of the vortex models,and, with an appropriate wake model, requires far less computer time than the vortex models. However,this model has not been widely used. Additional information may be found in Nasu and Azuma (1983),Masse (1986), and Oler (1989).
Common Model Limitations
All of the aerodynamic models in use today use airfoil section characteristic tables (lift and dragcoefÞcients as functions of angle of attack and Reynolds number) to determine the blade loading andturbine performance. Static two-dimensional wind tunnel test results or two-dimensional static airfoildesign code predictions are modiÞed with empirical, semiempirical, or analytic methods and used toestimate blade loads under three-dimensional, dynamic conditions. The greatest difÞculty in obtainingaccurate load predictions with any performance code is the determination of the appropriate airfoilsection characteristics.
Additional information and references on turbine aerodynamics may be found in Hansen and Butter-Þeld (1993) and Wilson (1994) for HAWTs and in Touryan et al. (1987) and Wilson (1994) for VAWTs.
Wind Turbine Loads
Wind turbine aerodynamic loads are of two types Ñ the narrowband harmonic or cyclic loads resultingfrom the steady atmospheric wind, wind shear, rotor rotation, and other steady effects; and the broadbandrandom loads resulting from nonuniformity or turbulence in the wind. The prediction of these loads ismore complicated than the prediction of the aerodynamic performance and requires the use of computer-based models. The harmonic loads are generally predicted with the same codes that are used to predictwind turbine performance. The random loads are typically estimated with empirical relations, althougha few analysts do utilize a performance code with a nonuniform wind model to predict them. A wind
© 1999 by CRC Press LLC

Energy Conversion 8-135
turbine will experience hundreds of millions of loading cycles in a 30-year lifetime, and small errorsthat lead to underpredicting component loads can result in costly short-term component failure.
Accurate prediction of turbine performance does not guarantee accurate prediction of detailed aero-dynamic loads Ñ the performance predictions result from the integration of loads over the entire turbine,and signiÞcant errors may be present in the detailed loads but balance out in the performance predictions.While there is a considerable body of data showing good agreement of predicted performance withmeasured performance, there are very few data available against which to compare detailed aerodynamicload predictions.
Wind Turbine Dynamics
Horizontal-Axis Turbines
Horizontal-axis turbine designs usually use fairly rigid, high-aspect-ratio blades, cantilevered from arigid hub and main shaft, although they may sometimes use relatively slender, quite ßexible blades,attached to a less rigid hub and/or main shaft. This assembly rotates and yaws about a tower which maybe ßexible. These structures have many natural vibration modes, and some of them may be excited bythe wind or the rotation frequency to cause a resonance condition in which the vibrations are ampliÞedand cause large stresses in one or more components. Careful structural analysis during the design canensure that the turbine that is built is dynamically stable under turbine operating conditions. Ignoringthe structural analysis or failing to properly conduct parts of it will likely result in a machine thatexperiences resonances and fails very quickly. Relatively rigid systems are less likely to experience thesestability problems than are very ßexible, highly dynamic systems.
Detailed analysis of the structural response of a turbine is a rather daunting task requiring theformulation and solution of the full governing equations of motion, usually performed with a Þnite-element structural model. Those equations must account for the interaction between the blades and thesteady centrifugal forces, the time-dependent gravitational forces, the steady and oscillatory aerodynamicforces, and the Coriolis forces. They must also model nonsteady airßow, the yaw motion of the nacelle,pitch control of the blades, teetering blades, the interaction between the rotor and the supporting tower,starting and braking sequences, etc. The rotor must be modeled in a rotating coordinate frame with time-dependent coefÞcients, while the tower must be modeled in a Þxed coordinate frame, with the excitingforces arising from the nonlinear, time-dependent coupling of the rotor and the time-dependent loadingof the wind.
Malcolm and Wright (1994) provide a list of some of the available HAWT dynamics codes that havebeen developed, together with their limitations.
Vertical-Axis Turbines
Darrieus turbine designs normally use relatively slender, high-aspect-ratio structural elements for theblades and supporting tower. The result is a very ßexible, highly dynamic structure, with many naturalmodes of vibration which, again, must be carefully analyzed to ensure that the turbine is dynamicallystable under all operating conditions. Typically, the guy cables and turbine support structure can beanalyzed with conventional methods, but the tower and blades require a more reÞned analysis, usuallyperformed with a Þnite-element structural program.
The blades and tower must be modeled in the rotating coordinate frame with time-independentcoefÞcients. The equations of motion are determined by the steady centrifugal and gravitational forces,the steady and oscillatory aerodynamic forces, and the Coriolis forces, together with the turbine physicalproperties. Detailed information on the modeling may be found in Lobitz and Sullivan (1983).
Aerodynamic Loads/Blade Motion Coupling
The blades themselves are driven by aerodynamic as well as structural dynamic forces. The motion ofslender, high-aspect-ratio blades may couple with the aerodynamic loads acting on them. This couplingmay increase the motion of the blades, creating a potentially fatal condition known as ßutter instability,
© 1999 by CRC Press LLC

8-136 Section 8
or it may decrease the motion of the blades, creating a beneÞcial condition known as aerodynamicdamping.
Stochastic Wind Effects
The wind is stochastic in nature, with signiÞcant short-term variations in both direction and velocity.As turbines become larger, the relative extent of these variations becomes smaller than the size of theturbine, and the effects become more pronounced. Analysis of the effect of ßuctuating wind loads onthe response of the turbine shows an increase in the broadband response, accompanied by a decrease inthe magnitude of the dominant narrowband responses at multiples of the rotation frequency. This increasein broadband response can include excitation of turbine vibration modes that are close to a narrowbandresponse frequency, but that are not predicted to be excited by a uniform wind (Lobitz, 1984).
Wind Turbine Controls
In general, wind turbines are designed to operate when the incident wind is high enough to generateelectricity and to shut down when the wind speeds exceed 25 to 30 m/sec. In spite of the tremendousamount of power which is present in the high winds, the amount of energy that can be captured is usuallymore than offset by the fatigue damage that is sustained by the turbine.
Brakes
Most turbines utilize mechanical brakes, frequently in conjunction with aerodynamic brakes, to stop therotor and to keep it from rotating when the turbine is not generating electricity. A few turbines relysolely on aerodynamic braking devices to accomplish this. Whatever type of braking system is used, itshould be a fail-safe design that will automatically activate to slow or stop the rotor in the event of anelectrical system failure.
Yaw Systems
Virtually all upwind and a few downwind HAWT turbines incorporate an active yaw control system,using wind-direction sensors and electric or hydraulic drive motors, to orient the rotor with respect tothe wind. VAWTs do not require yaw systems.
Peak Power Regulation
All turbines incorporate some method of limiting the peak power produced. This enables the generatorto operate near its design power rating, where it is most efÞcient, over a range of wind speeds. Theincrease in generator efÞciency at lower wind speeds, together with the lower cost of the drivetrain,more than offset the energy that is lost as a result of power limiting. Most horizontal-axis turbines useone of three common techniques to limit peak power Ñ stall regulation with Þxed-pitch blades (passivecontrol), full- or partial-span pitch control, or partial-span control surfaces such as ailerons and/or ßaps.With stall regulation, the blades are designed so that airfoil stall, which creates decreased lift andincreased drag, limits the power output in high winds. However, rotor drag loads continue to increaseas the wind speed increases. Another disadvantage is the difÞculty of controlling aerodynamic loads indeep stall. With full- or partial-span blade pitch control, peak power is controlled by decreasing bladepitch angle as wind speed increases, limiting peak power and decreasing rotor drag loads. A majordisadvantage of pitch control is the poor peak power control during high-wind stochastic (or turbulent)conditions Ñ power excursions can exceed twice the rated power levels before the pitch-control systemcan respond. Partial-span control surfaces limit the peak power by decreasing the lift and increasing thedrag of a portion of the airfoil. They can respond to wind changes somewhat faster than full-span pitchcontrol systems can. Sample power curves for both stall and pitch-regulated turbines are shown in Figure8.11.7.
Several other methods of pitch control have also been used, but on a limited basis. Passive pitch-control techniques automatically adjust the blade pitch angle using cams activated by centrifugal loadsor using tailored blade materials that permit the blade to twist as the aerodynamic loads increase. The
© 1999 by CRC Press LLC
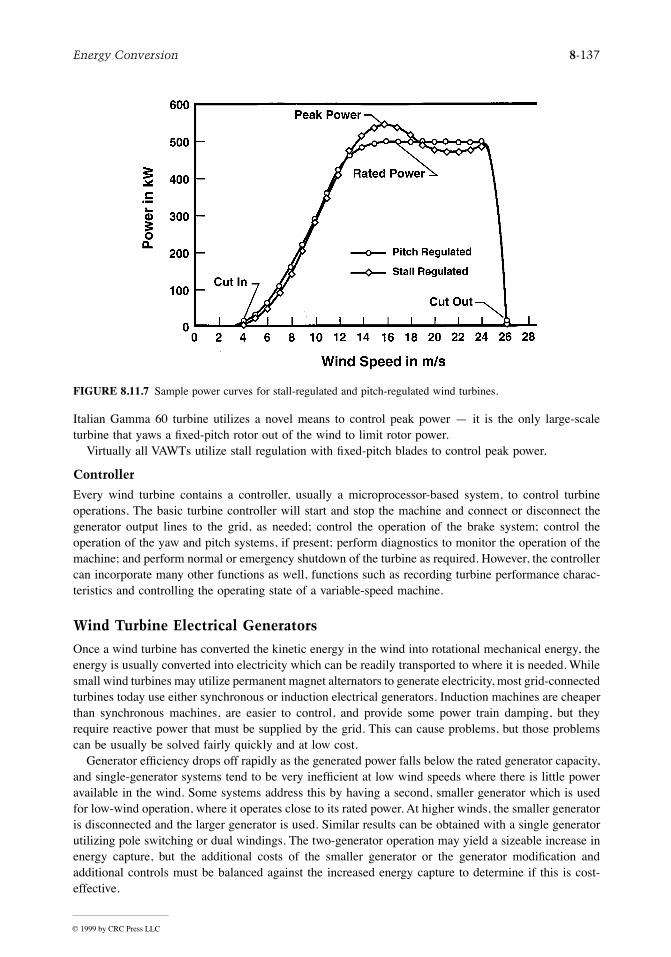
Energy Conversion 8-137
Italian Gamma 60 turbine utilizes a novel means to control peak power Ñ it is the only large-scaleturbine that yaws a Þxed-pitch rotor out of the wind to limit rotor power.
Virtually all VAWTs utilize stall regulation with Þxed-pitch blades to control peak power.
Controller
Every wind turbine contains a controller, usually a microprocessor-based system, to control turbineoperations. The basic turbine controller will start and stop the machine and connect or disconnect thegenerator output lines to the grid, as needed; control the operation of the brake system; control theoperation of the yaw and pitch systems, if present; perform diagnostics to monitor the operation of themachine; and perform normal or emergency shutdown of the turbine as required. However, the controllercan incorporate many other functions as well, functions such as recording turbine performance charac-teristics and controlling the operating state of a variable-speed machine.
Wind Turbine Electrical Generators
Once a wind turbine has converted the kinetic energy in the wind into rotational mechanical energy, theenergy is usually converted into electricity which can be readily transported to where it is needed. Whilesmall wind turbines may utilize permanent magnet alternators to generate electricity, most grid-connectedturbines today use either synchronous or induction electrical generators. Induction machines are cheaperthan synchronous machines, are easier to control, and provide some power train damping, but theyrequire reactive power that must be supplied by the grid. This can cause problems, but those problemscan be usually be solved fairly quickly and at low cost.
Generator efÞciency drops off rapidly as the generated power falls below the rated generator capacity,and single-generator systems tend to be very inefÞcient at low wind speeds where there is little poweravailable in the wind. Some systems address this by having a second, smaller generator which is usedfor low-wind operation, where it operates close to its rated power. At higher winds, the smaller generatoris disconnected and the larger generator is used. Similar results can be obtained with a single generatorutilizing pole switching or dual windings. The two-generator operation may yield a sizeable increase inenergy capture, but the additional costs of the smaller generator or the generator modiÞcation andadditional controls must be balanced against the increased energy capture to determine if this is cost-effective.
FIGURE 8.11.7 Sample power curves for stall-regulated and pitch-regulated wind turbines.
© 1999 by CRC Press LLC

8-138 Section 8
While most turbines operate at a single Þxed rotational speed, some operate at two or more Þxedrotational speeds, and some operate anywhere within a range of speeds. Variable-speed turbine operationoffers two major advantages over Þxed-speed operation:
1. The aerodynamic efÞciency of the rotor at low to moderate wind speeds may be improved bymore closely matching the rotor speed to the short-term average wind speed. At higher windspeeds, the blades are either in stall or are pitched to control peak power, so matching rotor speedto wind speed is less important.
2. System dynamic loads are attenuated by the ÒßywheelÓ action of the rotor as it speeds up andslows down in response to wind gusts.
In addition, variable speed permits the operation of the turbine in a variety of modes, includingoperation at maximum efÞciency for all wind speeds to maximize energy capture or operation to minimizefatigue damage. However, certain rotational speeds within the operating-speed range will likely exciteturbine vibration modes, causing resonance and increased rates of fatigue damage. These rotationalspeeds must be avoided during operation, and turbine control can become quite a complicated issue.
Variable-speed operation, in general, generates variable-frequency power. Most applications, includinginterfacing with power grids, require high-quality power at a reference frequency. Sophisticated powerelectronics may be used to accomplish this interface (Smith, 1989).
Wind-Diesel Systems
Wind turbines are increasingly being coupled with diesel engine-powered generators to create wind-diesel systems. In these systems, the diesel engine provides dependable, consistent power and the windturbines generate some of the power, reducing the engine fuel consumption and the system cost ofenergy. A large variety of wind-diesel systems and concepts have been investigated over the past decade(InÞeld, et. al., 1992). Although quite a few of these have been technically successful, very few of themhave been commercially successful. While the potential market for wind-diesel systems appears to bevery large, it has yet to materialize, for the reliability of the technology has not yet been well proven.
Water-Pumping Applications
The multibladed, mechanical windmill (the so-called ÒAmericanÓ windmill) with a mechanical pistonpump has been used for over a century to pump water in remote areas. Over the past few years somechanges to improve operation in low wind speeds have been made to the design of these machines.
Researchers at the U.S. Department of Agriculture facility at Bushland, Texas have reported consid-erable success in using variable-voltage, variable-frequency electricity produced by small stand-alonewind turbines to directly power submersible water pumps. Clark (1994) compares the pumping perfor-mance of one of these windÐelectric systems and that of the traditional American windmill with a pistonpump. He found that the windÐelectric system performed signiÞcantly better than the mechanical system,even though the price of the two systems was nearly identical. The windÐelectric system offers anotheradvantage as well Ñ while the windmill for the mechanical pump must be mounted directly over thewell, the wind turbine for a windÐelectric system may be mounted some distance away, at a better windlocation.
Defining Terms
Betz limit: Maximum fraction of available wind energy that can be extracted by a wind turbine rotor,according to momentum theory.
Momentum theory: A method of estimating the performance of a turbine by equating the timerate of change of air stream momentum through the turbine to the force acting on turbine blades.Power coefÞcient: The ratio of captured energy to the energy available in the reference area.
© 1999 by CRC Press LLC
Energy Conversion 8-139
Resonance: A vibration of large amplitude caused by a relatively small excitation at or near a systemnatural frequency.
Stall: A condition in which an airfoil experiences a decrease in lift and a large increase in drag.Stochastic: Containing variations from a smooth, uniform ßow.Tip-speed ratio: The ratio of the speed of the blade tip to the free-stream wind speed.WindÐdiesel system: An electrical-generation system that utilizes both diesel engineÐpowered genera-
tors and wind turbines to create a dependable, consistent power system.
References
Clark, R.N. 1994. Wind-electric water pumping systems for rural domestic and livestock water, inProceedings of the 5th European Wind Energy Association Conference and Exhibition, Macedonia,Greece, pp. 1136Ð1140.
Hansen, A.C. and ButterÞeld, C.P. 1993. Aerodynamics of horizontal-axis wind turbines, Ann. Rev. FluidMech., 25, 115Ð149.
InÞeld, D., Scotney, A., Lunsager, P., Binder, H., Uhlen,K., Toftevaag, T., and Skarstein, O. 1992. Winddiesel systems Ñ design assessment and future potential, paper presented at Sixth InternationalWindÐDiesel Workshop, Prince Edward Island, Canada.
Kocurek, D. 1987. Lifting surface performance analysis for horizontal axis wind turbines, SERI/STR-217, 3163.
Lobitz, D.W. 1984. NASTRAN-based software for the structural dynamic analysis of VAWTs andHAWTs, paper presented at European Wind Energy Conference, Hamburg, p. 385
Lobitz, D.W. and Sullivan, W.N. 1983. A comparison of Þnite element prediction and experimental datafor forced response of DOE 100 kW VAWT, in Proceedings of the Sixth Biennial Wind EnergyConference and Workshop, Minneapolis, MN, pp. 843Ð853.
Malcolm, D.J. and Wright, A.D. 1994. The use of ADAMS to model the AWT-26 prototype, in Pro-ceedings of 1994 ASME Wind Energy Symposium, New Orleans, LA, pp. 125Ð132
Masse, B. 1986. A local-circulation model for Darrieus vertical-axis wind turbines, J. Propulsion Power,2 (March-April) 135Ð141.
Nasu, K. and Azuma, A. 1983. An experimental veriÞcation of the local circulation method for ahorizontal axis wind turbine, paper presented at 18th Intersociety Energy Conversion EngineeringConference, Orlando, FL.
Oler, J.W. 1989. A discrete local circulation model for Darrieus turbines, in Proceedings of the EighthASME Wind Energy Symposium, Houston, TX, pp. 65Ð69.
Smith, G.A. 1989. Electrical control methods for wind turbines, Wind Eng., 13(2), 88Ð98.Strickland, J.H., Smith, T., and Sun, K. 1981. A vortex model of the Darrieus turbine: an analytical and
experimental study, SAND81-7017, Sandia National Laboratories, Albuquerque, NM.Touryan, K.J., Strickland, J.H., and Berg, D.E. 1987. Electric power from vertical-axis wind turbines,
J. Propulsion Power, 3(6), 481Ð493.Wilson, R.E. 1994. Aerodynamic behaviour of wind turbines, in Wind Turbine Technology, Fundamental
Concepts of Wind Turbine Engineering, D. Spera, Ed., ASME Press, New York, 215Ð282.
Further Information
Excellent summaries of HAWT and VAWT aerodynamics, together with extensive reference lists, arepresented by Craig Hansen and Sandy ButterÞeld in their paper ÒAerodynamics of Horizontal-Axis WindTurbinesÓ in the Annual Review of Fluid Mechanics, 1993, and by Ken Touryan, Jim Strickland, andDale Berg in their paper ÒElectric Power from Vertical-Axis Wind TurbinesÓ in the Journal of Propulsion,Volume 3, Number 6, 1987.
The latest developments in the Þeld of wind energy in the U.S. and Europe may be found in thefollowing:
© 1999 by CRC Press LLC

8-140 Section 8
Proceedings of the ASME Wind Energy Symposium, published annually by the American Institute ofAeronautics and Astronautics, 1801 Alexander Bell Drive, Suite 500, Reston, VA 20191Ð4344.
Proceedings of Windpower, the annual American Wind Energy Association (AWEA) conference,published annually by AWEA, 122 C St. NW, 4th Floor, Washington, D.C. 20001.
Proceedings of the European Wind Energy Association, published annually by EWEA, Eaton Court,Maylands Avenue, Hemel Hempstead, Hertforshire HP2 7TR, England.
© 1999 by CRC Press LLC
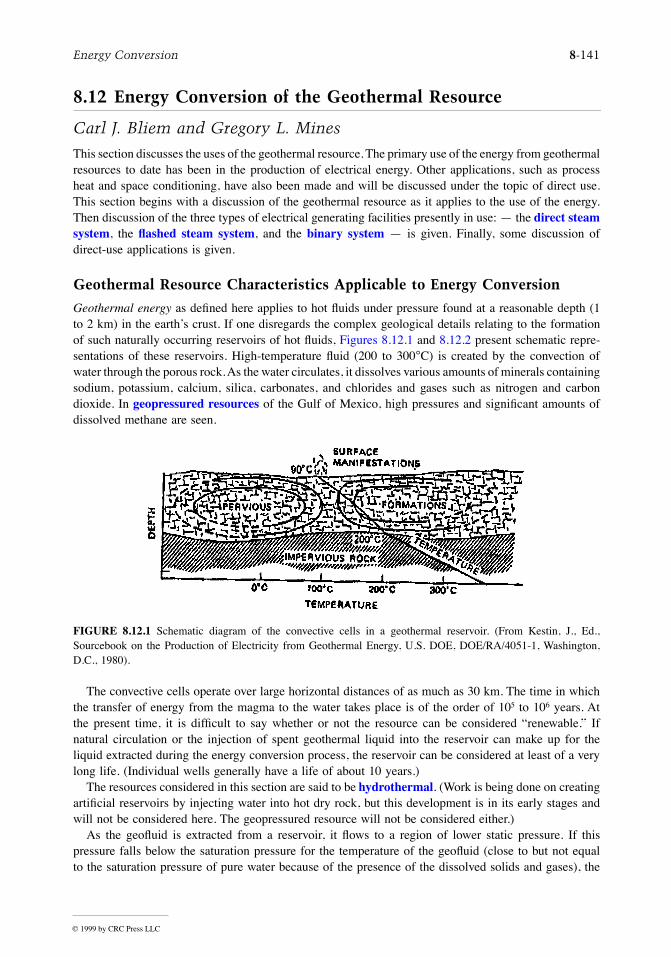
Energy Conversion 8-141
8.12 Energy Conversion of the Geothermal Resource
Carl J. Bliem and Gregory L. Mines
This section discusses the uses of the geothermal resource. The primary use of the energy from geothermalresources to date has been in the production of electrical energy. Other applications, such as processheat and space conditioning, have also been made and will be discussed under the topic of direct use.This section begins with a discussion of the geothermal resource as it applies to the use of the energy.Then discussion of the three types of electrical generating facilities presently in use: Ñ the direct steamsystem, the ßashed steam system, and the binary system Ñ is given. Finally, some discussion ofdirect-use applications is given.
Geothermal Resource Characteristics Applicable to Energy Conversion
Geothermal energy as deÞned here applies to hot ßuids under pressure found at a reasonable depth (1to 2 km) in the earthÕs crust. If one disregards the complex geological details relating to the formationof such naturally occurring reservoirs of hot ßuids, Figures 8.12.1 and 8.12.2 present schematic repre-sentations of these reservoirs. High-temperature ßuid (200 to 300°C) is created by the convection ofwater through the porous rock. As the water circulates, it dissolves various amounts of minerals containingsodium, potassium, calcium, silica, carbonates, and chlorides and gases such as nitrogen and carbondioxide. In geopressured resources of the Gulf of Mexico, high pressures and signiÞcant amounts ofdissolved methane are seen.
The convective cells operate over large horizontal distances of as much as 30 km. The time in whichthe transfer of energy from the magma to the water takes place is of the order of 105 to 106 years. Atthe present time, it is difÞcult to say whether or not the resource can be considered Òrenewable.Ó Ifnatural circulation or the injection of spent geothermal liquid into the reservoir can make up for theliquid extracted during the energy conversion process, the reservoir can be considered at least of a verylong life. (Individual wells generally have a life of about 10 years.)
The resources considered in this section are said to be hydrothermal. (Work is being done on creatingartiÞcial reservoirs by injecting water into hot dry rock, but this development is in its early stages andwill not be considered here. The geopressured resource will not be considered either.)
As the geoßuid is extracted from a reservoir, it ßows to a region of lower static pressure. If thispressure falls below the saturation pressure for the temperature of the geoßuid (close to but not equalto the saturation pressure of pure water because of the presence of the dissolved solids and gases), the
FIGURE 8.12.1 Schematic diagram of the convective cells in a geothermal reservoir. (From Kestin, J., Ed.,Sourcebook on the Production of Electricity from Geothermal Energy, U.S. DOE, DOE/RA/4051-1, Washington,D.C., 1980).
© 1999 by CRC Press LLC

8-142 Section 8
geoßuid will ßash into steam. Therefore, the person using this energy source may have a number ofdifferent physical forms to consider:
1. Wet steam from a vapor-dominated resource;2. Superheated or saturated steam from a vapor-dominated resource;3. Liquid at a pressure above the saturation pressure from a liquid-dominated resource;4. A mixture of liquid and vapor at a relatively low quality from a liquid-dominated resource.
Electrical Energy Generation from Geothermal Resources
The type of energy conversion system used to produce electrical power depends on the type and quality(temperature) of the geothermal resource. Vapor-dominated resources use systems where steam isexpanded directly through a turbine, similar to conventional fossil fuel steam plants. Liquid-dominatedresources use ßash steam systems and binary systems, with binary systems predominantly used for thelower-quality resources. The term binary system is used to describe a power cycle where the geothermalßuid provides the source of thermal energy for a closed-loop Rankine cycle using a secondary workingßuid. In this closed loop, the working ßuid is vaporized using the energy in the geoßuid, expandedthrough a turbine, condensed, and pumped back to the heater completing the closed loop.
Hydrothermal resources typically contain varying amounts of numerous dissolved minerals anddissolved gases. In power cycles where steam is extracted from the geothermal resource directly (vapordominated) or indirectly (ßashing liquid dominated) and expanded through a condensing turbine, thedesign and operation of the power cycle must account for the removal of the noncondensable gases. Ifthe gases are not removed from the condenser, they will accumulate in the condenser, raising the turbineback pressure and decreasing the power output. In systems where the liquid geoßuid is handled (binarycycle heat exchangers and piping and ßash steam ßash tanks and piping), measures must be taken to
FIGURE 8.12.2 Schematic diagram of a characteristic geothermal reservoir. (From Kestin, J., Ed., Sourcebook onthe Production of Electricity from Geothermal Energy, U.S. DOE, DOE/RA/4051-1, Washington, D.C., 1980).
© 1999 by CRC Press LLC

Energy Conversion 8-143
prevent the precipitation of the dissolved solids and/or to provide a means of removal of the resultingscale.
Direct Steam Systems — Vapor-Dominated Resources
For a geothermal resource producing a superheated or saturated vapor steam (Case 2), the vapor fromthe geothermal production well is sent to a conventional steam turbine as shown in Figure 8.12.3. (Thisis done after appropriate removal of rocks and debris and possibly after scrubbing with water to removecorrosive substances.) Normally, the turbine is a condensing type, as shown in the Þgure, although insome applications a back-pressure turbine is used, exhausting the steam to the atmosphere. The back-pressure turbine is typically used for small systems with the possible later addition of another turbineand a condenser to increase the power generated by the geoßuid ßow from the wells.
Figure 8.12.3 shows a system with a direct-contact condenser and a wet cooling tower. In this typeof system, the condensate from the condenser is more than enough to make up the evaporation andblowdown from the cooling tower. Therefore, the Þgure shows some of the condensate being injectedinto the reservoir. In many cases, direct-contact condensers are not feasible because of the hydrogensulÞde in the steam which would be released in the cooling tower exhaust. When hydrogen sulÞde is inthe steam, the majority of it appears as noncondensable and the noncondensable gas from the condensersmust be treated. For these systems, surface condensers are normally used in conjunction with wet coolingtowers. The actual hardware conÞguration is dictated by the process for removal of the sulfur. Again,some of the condensate can be used for cooling tower makeup if the sulfur is removed from the process.A number of processes have been developed to remove sulfur from the process.
Figure 8.12.4 depicts a system which is similar to the one described above, but one which receiveswet steam (Case 1). Here, the liquid is separated from the vapor prior to the entry of the vapor into theturbine. Otherwise, the system is the same as the one in Figure 8.12.3 and the same comments apply.
Flash Steam Systems — Liquid Dominated Resources
When the geoßuid is ßashed before it leaves the well, ßash steam systems are generally used. Thisindicates that the resource is at a relatively high temperature. Figures 8.12.5 and 8.12.6 depict single-and dual-ßash systems schematically. The single-ßash system in Figure 8.12.5 is quite similar to thesystem in Figure 8.12.4. The only difference is that the geoßuid pressure is dropped further before thesteam is separated and sent to the turbine. An optimum ßash pressure exists because the lower the ßash
FIGURE 8.12.3 Schematic diagram of a direct dry-steam plant. (From Kestin, J., Ed., Sourcebook on the Productionof Electricity from Geothermal Energy, U.S. DOE, DOE/RA/4051-1, Washington, D.C., 1980).
© 1999 by CRC Press LLC

8-144 Section 8
pressure, the more steam which is evolved. However, the work done per unit mass of steam ßowingthrough the turbine will also decrease with the lower ßash pressure. For a given set of geoßuid conditionsentering the plant, a ßash pressure exists that will maximize the energy produced per unit mass ofgeoßuid and also minimize the levelized energy cost (LEC). The performance and cost optima will benear, but not generally at the same pressure.
The ßash steam system can also be utilized in applications where the ßuid enters the plant as a liquid(single phase). In these systems, the geothermal ßuid is throttled with an expansion valve to the desiredßash pressure. This ßashing process can be considered adiabatic, where the amount of steam evolvedcan be determined from energy and mass balances of a simple throttling calculation.
FIGURE 8.12.4 Schematic diagram of a plant using a two-phase resource. (From Kestin, J., Ed., Sourcebook onthe Production of Electricity from Geothermal Energy, U.S. DOE, DOE/RA/4051-1, Washington, D.C., 1980).
FIGURE 8.12.5 Schematic diagram of a single-ßash plant. (From Kestin, J., Ed., Sourcebook on the Productionof Electricity from Geothermal Energy, U.S. DOE, DOE/RA/4051-1, Washington, D.C., 1980).
© 1999 by CRC Press LLC

Energy Conversion 8-145
Most successful ßash systems are dual ßash. The Þrst ßash is generally near the well-head pressureand the second ßash near atmospheric pressure. The low-pressure ßash is normally kept above atmo-spheric pressure to prohibit leakage of air into the system in the ßasher. Some recent studies haveindicated that for low-temperature resources, a subatmospheric second ßash would produce a cost-effective system. Again, optimization of the two ßash pressures is necessary to minimize the LEC. Incases in which the geoßuid has a high dissolved solid content, ßash crystallizers are used to remove theprecipitated dissolved solids. The ßashing process releases carbon dioxide dissolved in lowering thegeoßuid pH, which causes the precipitation of insoluble carbonates. The solubility of silica is temperaturedependent; lowering the geoßuid temperature causes the precipitation of silica.
None of the steam cycles depicted provides for the removal of the noncondensable gases from thecondenser. This removal is typically accomplished with steam ejectors or compressors which continu-ously remove the small stream of vapor from the condenser. Some steam is lost in this process ofremoving the noncondensable gases.
Binary Systems — Liquid-Dominated Resources
Recent studies have shown that for resources below 200°C, current technology binary systems havelower LEC than ßash steam plants for liquid-dominated resources. Figure 8.12.7 shows a typical binarysystem with an evaporative heat-rejection system. This type of heat-rejection system has been replacedby air-cooled condensers in most applications. In the areas where the geothermal resource exists, thereis little excess water for makeup in the cooling tower, as shown in Figure 8.12.7. All of the cooledgeoßuid in a binary system is typically injected back into the reservoir. This provides an environmentallyacceptable means of disposal of the ßuid and, more important, provides a recharge of the reservoir tomaintain the reservoir productivity.
The binary cycle is an attempt to reduce the scaling potential of the geoßuid. Carbonates are precip-itated when the pressure of the geoßuid is reduced and carbon dioxide comes out of solution as thegeoßuid ßashes. With downhole pumps in the wells, this can be eliminated by keeping the ßuidpressurized. Some resources do not require pumps to maintain the ßow and pressure necessary toeliminate ßashing (artesian ßow). Similarly, if the exit temperature of the geoßuid remains above someminimum value, silica will not be precipitated. These two operational strategies limit the scaling in abinary plant. Any constraint imposed on the geoßuid exit temperature will impact the design of the
FIGURE 8.12.6 Schematic diagram of a dual-ßash plant. (From Kestin, J., Ed., Sourcebook on the Production ofElectricity from Geothermal Energy, U.S. DOE, DOE/RA/4051-1, Washington, D.C., 1980).
© 1999 by CRC Press LLC

8-146 Section 8
binary plant, affecting the selection of turbine inlet conditions as well as the possible choice of workingßuid.
The binary cycle consists of a closed loop of a working ßuid normally performing a Rankine cycle.Most existing binary cycles use isobutane, pentane, or isopentane as working ßuids. Studies haveindicated that mixtures of hydrocarbons, e.g., 96% isobutane/4% hexane, will produce better utilizationof a 180°C resource and in some instances lower LEC.
The performance of the binary system depends on a number of factors. Some plant designs incorporatemultiple or staged boiling cycles, where the working ßuid ßow is split and boiling occurs at multiplepressures. In these cycles, multiple or staged turbines are required. The advantage of these cycles is thefact that the working ßuid heat-addition process more closely matches the sensible cooling of the liquidgeoßuid (as shown on the T-Q or T-h diagram). This lowers temperature differences through the cycle,reducing cycle irreversibilities and increasing performance. The same effect can be achieved by heatingthe working ßuid at supercritical pressures (pressures above the critical pressure). While the supercriticalcycle will have higher component, material, and pumping costs because of higher operating pressures,they have fewer components because they are less complex than multiple boiling cycles. (In many cases,the maximum pressure can be kept below 600 psi with hydrocarbons such as isobutane.) Lowering themean temperature difference in heat exchangers tends to require larger units so that capital costs areincreased. In general, the LEC is reduced because the effects of increased performance more thanoutweigh the increase in capital cost.
The choice of the working ßuid for the power cycle will also impact the cycle performance. In general,as resource temperature decreases, the more volatile ßuids will produce more power per unit mass ofgeoßuid. Power cycles using the more volatile ßuids typically operate at higher pressures and havehigher associated material and equipment cost. These higher costs may offset the gains in performanceand produce higher LECs in some cases.
Working ßuid mixtures have been shown to provide superior performance to the single componentor pure working ßuids. This performance improvement is due to the nonisothermal phase changes ofthis type of ßuid at constant-pressure (both boiling and condensing), which allows the working ßuid tomatch more closely the sensible cooling of the geoßuid. More importantly in the reduction of irrevers-ibilities, the desuperheating and condensing process more closely matches the sensible heating of coolingwater or air in the heat-rejection process.
FIGURE 8.12.7 Schematic diagram of a binary plant. (From Kestin, J., Ed., Sourcebook on the Production ofElectricity from Geothermal Energy, U.S. DOE, DOE/RA/4051-1, Washington, D.C., 1980).
© 1999 by CRC Press LLC

Energy Conversion 8-147
One additional type of binary cycle that has been proposed uses an ammonia-water mixture for theworking ßuid. A great deal of recuperative preheat of the working ßuid is accomplished by splitting theduty of the geoßuid, turbine exhaust, and preheated liquid ßows through a more complex heat-transfertrain than is shown in Figure 8.12.7. These systems are known as Kalina systems. In general, thesesystems do not change the composition of the mixture in the cycle as the Kalina cycle for applicationssuch as is the case for gas turbine bottoming.
There is some consideration of using a binary cycle as a bottoming cycle for a ßash steam or directsteam system. Similarly, a binary cycle could be used to bottom another binary system, perhaps with adifferent working ßuid.
Design Considerations
The selection of the working ßuid in binary cycles imposes safety considerations to be considered inthe design of the power plant. Equipment and facility designs must take into account the ßammablecharacteristic of the hydrocarbon working ßuids.
The selection of materials of construction for the piping and components exposed to the geoßuid willbe resource speciÞc. Typically, carbon steel is used for piping and pressure vessels. Turbines that usethe steam directly may have stainless steel components, although the use of stainless may be limited bythe presence of chlorides and the potential for stress cracking. The standard design for heat exchangersin binary cycles is for the geoßuid to be on the tube side. This facilitates the cleaning of the exchangerif scaling or fouling occurs on the surfaces exposed to the geoßuid. If the geoßuid has a high scalingpotential, components and piping should be designed to allow for periodic cleaning.
Direct Use of the Geothermal Resource
A number of direct-use applications of the heat in a geothermal resource have been successfullyimplemented. These include
1. Space conditioning (heating with the resource or a secondary ßuid and cooling with heat pumps);2. Heating of greenhouses;3. Aquaculture;4. Process heating (drying vegetable products);5. Ground coupled heat pumps.
Although the United States is one of the world leaders for the production of electrical power fromgeothermal energy, other nations take the lead for the direct use of this energy source. In Iceland, over85% of the buildings are supplied with heat and domestic hot water from geothermal systems (Ragnorson,1995).
Typical direct-use applications are either closed systems with produced ßuids being injected back intothe geothermal reservoir or systems where the produced water is pure enough for beneÞcial use ordisposal to surface waterways. Experience has shown that it is usually worthwhile to inject as much ofthe cooled ßuid as possible back into the reservoir to maintain pressure and production rates.
Defining Terms
Binary system: A binary system that uses thermal energy from the geoßuid to vaporize a secondaryworking ßuid in a Rankine cycle.
Direct steam system: A geothermal energy conversion system that utilizes steam directly from ageothermal well.
Flashed steam system: A geothermal energy conversion system that utilizes steam ßashed from theliquid geoßuid.
Geopressurized resource: Naturally occurring reservoirs of hot pressurized ßuid created by convectionof water through hot porous rock.
© 1999 by CRC Press LLC

8-148 Section 8
Hydrothermal resource: ArtiÞcial reservoirs created by injecting water into hot dry rock in the earthÕscore.
Kalina system: A binary system using a mixture of ammonia and water as the working ßuid in thepower cycle.
Reference
Ragnorson, A. Iceland country update, in Proceedings of the World Geothermal Congress, 1995, Flo-rence, Italy, May 1995, 145Ð161.
Further Information
Kestin, J. Ed., Sourcebook on the Production of Electricity from Geothermal Energy, U.S.DOE,DOE/RA/4051-1, Washington, D.C., 1980.
Lienau, Paul J. and Ben C. Lunis, Eds., Geothermal Direct Use Engineering and Design Guidebook,USDOE, Idaho Falls, ID, 1991.
Transactions of the Geothermal Resources Council, Vol. 1Ð19, (1977Ð1995), Geothermal ResourcesCouncil, Davis, CA.
© 1999 by CRC Press LLC

Energy Conversion 8-149
8.13 Direct Energy Conversion
Solar Photovoltaic Cells
Kitt C. Reinhardt
Introduction
Solar photovoltaic cells convert sunlight directly into electrical energy via the collection of solar photon-generated semiconductor charge carriers. The collection of charge carriers within the cell produces avoltage across the terminals of the cell, called the photovoltaic effect, that can drive an external electricalcircuit or charge a storage battery. Photovoltaic cells are useful in both space and terrestrial powerapplications. Silicon, Si, photovoltaic cells have provided the main source of electrical power to virtuallyall Earth-bound satellites since the advent of the space program in the late 1950s. In the early 1970s,photovoltaics generated a signiÞcant amount of interest for use in terrestrial power systems when oilsupplies to the industrial world were disrupted. Today, while photovoltaic power remains the primaryenergy source for most communication and surveillance satellites, issues concerning system efÞciency,reliability, and cost currently prevent its widespread use in residential and power utility applications.For example, in the United States the average price for conventional utility electricity is 6¢/kWhr,compared with ~35¢/kWhr for terrestrial photovoltaic electricity (Zweibel, 1995). Thus, the cost ofphotovoltaic power must be reduced by a factor of ~6 for it to become economically viable. At present,photovoltaic power is generally only cost-competitive for use in remotely located systems where con-ventional power is cost-prohibitive, such as in remote water-pumping and communications stations,signal and emergency lighting, and for village power. Factors that inßuence photovoltaic system energycosts include cell panel efÞciency, total system lifetime, and cost per unit area. The present discussionwill focus on issues concerning photovoltaic cells and panels. Detailed literature on power conditioningelectronics and energy storage systems can be found elsewhere. A large number of different photovoltaiccell designs have been demonstrated by researchers over the years. However, the most common andpractical cell designs are fabricated using single-crystal Si. Consequently, Si will be used to describebasic principles of semiconductors and photovoltaic cell operation.
Introduction to Semiconductors
We begin with a description of the concept of covalent bonding, valence electrons, and energy bands,which relates to conduction in semiconductors (Sze, 1981). The crystalline structure of Si is diamond,where each Si atom in the lattice is covalently bonded to four equidistant nearest neighbors that lie atthe corners of a tetrahedron. Each Si atom has four electrons in its outer orbit, called valence electrons,and each atom shares these electrons with its four neighbors to form four covalent bonds. The atomicconÞguration of the 14 electrons of Si is 1s22s22p63s23p2. At practical temperatures, only the 3s23p2
valence electrons contribute to the electrical conductivity; the 1s22s22p6 core electrons are too tightlybounded to the nucleus to participate. In a simpliÞed model, as N Si atoms are brought together at 0 Kto form a crystal, two distinct and nearly continuous bands of electronic energy levels form that areseparated by an energy gap called the semiconductor band gap, Eg. The resulting upper conductionband contains 4N states, as does the lower valence band. The 4N electrons that come from the Si 3s23p2
states completely Þll the 4N states in the valence band at 0 K, and the conduction band states arecompletely empty. Since there are no unoccupied states in the valence band for electrons to move andthe conduction band is empty, Si is a perfect insulator at 0 K.
As the temperature of the crystal increases, electrons in the valence band gain sufÞcient thermalenergy (>Eg) to be excited across the band gap into the conduction band, leaving holes (missing electrons)behind in the valence band. When current conduction in a semiconductor is dominated by thermallygenerated electrons and holes, it is called intrinsic. In this case, the resulting number of electrons perunit volume in the conduction band, n, equals the number of holes per volume in the valence band, p,that is n = p = ni, where ni is called the intrinsic carrier concentration. In the presence of an electric
© 1999 by CRC Press LLC

8-150 Section 8
Þeld, intrinsic electrons and holes gain kinetic energy and conduct electricity. However, since at roomtemperature ni for Si is only 1.45 ´ 1010 cmÐ3, compared with a free-electron density of more than 1022
cmÐ3 in metals, Si behaves as a very good insulator, i.e., electrical conductivity, s, is given by s = q(nmn
+ pmp), where q is the electronic charge and m is the respective carrier mobility.In order to increase the conductivity to values useful for solid-state devices, the level of n and p can
be increased by purposely adding impurity atoms into the crystal, called doping, that liberate extraelectrons or holes. In the case of Si, which is in column IV of the periodic table, and hence has fourvalence electrons for bonding, doping is achieved using either column III elements (boron, aluminum,gallium, or indium), which have three valence electrons, or column V elements (phosphorus, arsenic, orantimony), which have Þve valence electrons. When an arsenic atom with Þve valence electrons replaces(substitutes) an Si atom, four of its electrons are used to form covalent bonds with the four neighboringSi atoms. The Þfth electron is loosely bound to the arsenic nucleus, and at room temperature is ionizedand ÒdonatedÓ to the conduction band. Arsenic is therefore called a donor, and Si becomes an n-type(mostly electrons) semiconductor. Similarly, when a boron atom with three valence electrons substitutesfor an Si atom, one of the boron four covalent bonds becomes deÞcient of one electron. Boron can thenaccept one electron from the valence band to satisfy the bond requirement, which creates a positivelycharged hole in the valence band. Boron is therefore called an acceptor, and Si becomes a p-type (mostlyholes) semiconductor. In this way the electrical conductivity of semiconductors can be precisely con-trolled by varying the concentration of donor and acceptor impurities. In practical solid-state devices,typical values of n and p range between 1015 and 1019 cmÐ3.
The p-n Junction Diode
The p-n junction is a basic structure used for solid-state device rectiÞcation, ampliÞcation, and switching,as well as for photocarrier collection in photovoltaic cells. A p-n junction is formed when a p-typesemiconductor is metallurgically joined with an n-type semiconductor (Streetman, 1980). Before theyare joined, the p-material has a large concentration of holes and very few electrons, whereas the converseis true for the n-material. Upon joining the two materials, holes instantaneously diffuse from the p-sideinto the n-side and electrons diffuse from the n-side into the p-side. The transport of these carriersconstitutes a ÒdiffusionÓ current from the p-side to n-side; electron current is opposite in direction toelectron ßow by convention. As shown in Figure 8.13.1, negative acceptor ions are left behind as holesleave the p-side of the junction, creating a negative space-charge region (SCR), and positive donor ionsare left behind as electrons leave the n-side of the junction, creating a positive SCR. Consequently, anelectric Þeld directed from the positive SCR to the negative SCR results that opposes the further diffusionof electrons and holes; i.e., the electric Þeld creates a drift component of current from the n-side to p-side that opposes the diffusion component. In the absence of any external Þelds a condition of equilibriumis established, and the net current ßow across the junction is zero. As will be discussed, the p-n junctionelectric Þeld is also responsible for separating and collecting photon-generated carriers in photovoltaiccells.
When a voltage is applied across a p-n junction, the balance between the electron and hole drift anddiffusion currents is disturbed and a net current results. Under forward bias, a positive voltage is appliedto the p-side relative to the n-side, and the electric Þeld across the junction is reduced; i.e., the electricÞeld associated with the applied voltage subtracts from the zero-bias Þeld. The reduced Þeld enhanceshole diffusion from the p-side to the n-side and electron diffusion from the n-side to the p-side, therebyincreasing the ÒpositiveÓ current; the transport of current from the p-side to the n-side is positive byconvention. Conversely, under reverse bias a negative voltage is applied to the p-side relative to the n-side, and the electric Þeld across the junction increases. Consequently, the diffusion component of currentdecreases relative to the drift component, and a net ÒnegativeÓ current results across the junction.
The dark current-voltage (I-V ) characteristics for an Si p-n junction are generally well described bythe ideal Shockley diode equation (Sze, 1981),
© 1999 by CRC Press LLC

Energy Conversion 8-151
(8.13.1)
where ID is the junction dark current, Io is the reverse saturation current, V is the forward-bias voltage,n is the diode ideality factor, and T is the absolute temperature. The value of n is ~1.0 when the currentis dominated by carrier diffusion, but increases and approaches values of ~2 or greater when other currentmechanisms become important, such as carrier recombination or tunneling. In high-quality Si p-n junctionphotovoltaic cells, the value of n is ~1.0 near the relevant operating voltage. The parameter Io varieswith T and Eg according to
(8.13.2)
where A is the junction area and Dn and Dp, np and pn, and Ln and Lp are the diffusion coefÞcients,minority carrier densities, and diffusion lengths for electrons and holes, respectively. The value of Io
decreases strongly as Eg increases, which, as will be shown, increases the photovoltage obtainable froma photovoltaic cell.
Cell Operation and Efficiency
Cell Operation. Photovoltaic energy conversion in a p-n junction is a two-step process where freeelectrons and holes (photocarriers) are generated in the semiconductor via the absorption of solar energyand then simultaneously collected across the junction (Fahrenbruch and Bube, 1983). Consider theschematic of a typical photovoltaic cell shown in Figure 8.13.2 which consists of a p-n junction formedvery close to the top surface of the cell. Front metal ohmic contact grid Þngers allow solar energy topass into the absorber layers. The entire top surface is covered with an antireßection coating to minimizereßective losses, and the entire back surface is covered with an ohmic contact. The ohmic contacts formn and p region terminals that transfer (conduct) current from the semiconductor to the external circuitwith a negligible amount of voltage drop.
When the photovoltaic cell is exposed to solar radiation, photons with energies greater than Eg (super-band-gap photons) are absorbed in the n and p layers, and free electrons and holes are generated via thebreaking of covalent bonds. These electron-hole pairs, or photocarriers, are shown in Figure 8.13.1.The energy of the free photocarriers is converted directly into a current and voltage via photocarriercollection by the junction. The absorbed photons effectively contribute an energy Eg to the cell output,
FIGURE 8.13.1 Schematic diagram illustrating an abrupt p-n junction with a uniÞorm concentration of donorimpurities in the n-region and acceptor impurities in the p-region.
I I qV nkTD o= ( ) -[ ]exp 1
I qA D n L D p L T E kTo n p n p n p g= +[ ] µ -( )3 exp
© 1999 by CRC Press LLC

8-152 Section 8
and energy greater than Eg is lost as heat. Photons with energies less than Eg (sub-band-gap photons)are transmitted through the cell. After generation, minority photocarriers, that is, holes on the n-side andelectrons on the p-side, diffuse toward the edges of the junction due to a gradient of carriers that existsthere. If the minority carriers are generated within a diffusion length, L, of the junction, they will reachit and be swept across it by the electric Þeld of the junction. Hence, electrons are swept from the p-sideto the n-side and holes from the n-side to the p-side, and thus they are separated. The minority carriergradient present at the edges of the junction is due to the depletion of minority carriers that results fromtheir transfer across the junction. The diffusion ßux of minority carriers toward and across the junctionconstitutes a light-generated current, IL, or photocurrent, that is directed from the n-side to the p-side ofthe cell. The build-up of positive holes on the p-side and negative electrons on the n-side gives rise toa photovoltage across the junction. The polarity of both the photovoltage and photocurrent is identicalto that of a battery, and power is delivered from the junction to the external circuit.
Cell EfÞciency. In order to derive the solar conversion efÞciency, it is convenient to model the photovoltaiccell as an ideal p-n diode in parallel with a light-generated (constant) current source, IL, as shown inthe equivalent circuit of Figure 8.13.3. Parasitic series and shunt resistance losses, Rs and Rsh, respectively,are also shown, where Rs is due to ohmic contact and semiconductor resistances, and Rsh is due to defect-related carrier recombination and/or tunneling phenomena (Stirn, 1972). A qualitative expression for IL
is given by Tada et al. (1982):
(8.13.3)
where G is the photocarrier generation rate in carriers/cm3-sec due to solar photon absorption, whichdepends on Eg and the photon energy (wavelength) and intensity (concentration), and Wd is the sum ofthe negative and positive SCR widths. As mentioned, IL is directed from the n-side to the p-side. In
FIGURE 8.13.2 Schematic diagram of a typical p-n junction photovoltaic cell.
Grid
Antirefle
Electric fregion
Ohmic c
Substrator
Photon
or
I qAG L W LL n d p= + +( )
© 1999 by CRC Press LLC

Energy Conversion 8-153
contrast, the dark diode current given by Equation (8.13.1) is directed oppositely from the p-side to then-side. The dark current is due to the forward-bias photovoltage that appears across the cell p-n junctionwhen it is illuminated. Thus, the dark current opposes the light current. In the ideal case, that is, whenRs = 0 and Rsh = ¥, the total forward current, IT, is given by
(8.13.4)
A plot of dark and light current-voltage (I-V ) curves resulting from Equations (8.13.1) and (8.13.4),respectively, is shown in Figure 8.13.4 for a typical p-n solar cell. Under illumination, the forward-biasdark I-V curve is displaced downward into the fourth quadrant by the photocurrent, IL. It is noted fromFigure 8.13.3 that the voltage drop across the load resistance, RL, is V = ÐITRL. Under short-circuitconditions, that is, when the n and p terminals are tied to each other, RL is negligible. The resultingvoltage drop across the p-n junction will also be negligible, and from Equation (8.13.1), ID » 0. Asshown in Figure 8.13.4, the resultant current is termed the short-circuit current, Isc, or IT = ÐIsc = ÐIL.As the value of RL increases, a voltage appears across the junction, V = ÐITRL, called the photovoltage,and ID increases in accordance with Equation 8.13.1. Under this condition the cell is operating in thefourth quadrant of the I-V characteristic (i.e., the junction voltage is positive and the current is negative),and, consequently, the cell delivers power (product of the current and voltage) to RL. As the value of RL
continues to increase, so too does V and ID. When the value of RL approaches inÞnity, that is, underopen-circuit conditions, ID approaches IL and IT goes to zero. The resulting open-circuit voltage, Voc, isshown in Figure 8.13.4. Voc can be obtained by setting IT = 0 in Equation (8.13.4) and solving for V. ForV @ kT/q,
(8.13.5)
Thus, the operating point on the I-V curve in the fourth quadrant can be swept from (Isc, 0) to (0, Voc)by varying the value of RL. When the optimum load is chosen (i.e., RL » Voc/Isc), approximately 80% ofthe product IscVoc can be extracted as useful power as shown by the shaded maximum-power rectanglein Figure 8.13.4. Also shown in Figure 8.13.4 are the parameters Im and Vm, which correspond to valuesof current and voltage, respectively, that yield the maximum cell power, Pm, where Pm = ImVm. The kneethat appears at Pm is due to the parasitic effects of Rs and Rsh. The curvature of the knee at Pm is describedby the Þll factor, FF, where
(8.13.6)
The photovoltaic cell conversion efÞciency, h, is deÞned as
or
FIGURE 8.13.3 Schematic of equivalent circuit model for a p-n photovoltaic cell.
I I I I qV nkT IT D L o L= - = ( ) -[ ] -exp 1
V nkT q I Ioc L o= [ ]ln
FF = I V I Vm m sc oc
h = I V P Am m in
© 1999 by CRC Press LLC

8-154 Section 8
(8.13.7)
where Pin is the incident power in W/m2 equal to the sum in energy of the incident photons per time perarea. Values for Voc, Isc, FF, and h can be obtained in the laboratory under various air mass conditionsfrom light I-V curves measured using a carefully controlled (calibrated) light source to illuminate the cell.
Cell Material vs. Efficiency
The optimum value of material Eg for solar photovoltaic conversion is ~1.0 to 1.5 eV. To understandhow the choice of cell material affects conversion efÞciency, an ideal expression can be derived usingEquation 8.13.4 for the theoretical conversion efÞciency. The output power can be expressed as (Henry,1980)
(8.13.8)
The maximum output power is obtained when dP/dV = 0, and an expression for Im and Vm can be obtainedfrom Equation (8.13.8) and multiplied to give Pm, where
(8.13.9)
In practical cells, values for Vm and Voc are typically 1/2Eg/q to 2/3Eg/q. Thus, for materials with Eg ~ 1Ð 2 eV, the quantity in the large brackets of Equation (8.13.9) becomes ~Voc, and the factors that determineIL and Voc also determine Pm. From Equations (8.13.2) and (8.13.5), it is clear that Voc increases with Eg
through the reduction in Io. In contrast, as Eg increases, IL decreases because a smaller portion of thesolar spectrum is energetic enough to be absorbed; i.e., IL is the product of q and the number of availablephotons with energy greater than Eg. Hence, for a given solar spectrum there is an optimum value of Eg
that maximizes the product of Voc and IL. A plot of ideal AM1 conversion efÞciency vs. Eg is shown inFigure 8.13.5 for Òone sunÓ (925 W/m2) and Ò1000 sunsÓ (925 kW/m2) concentrations (Henry, 1980).The efÞciency curves were obtained using Equations (8.13.1) through (8.13.7) at 300 K. A maximumin efÞciency occurs for Eg ~ 1.0 Ð 1.5 eV.
FIGURE 8.13.4 Typical dark and light current-voltage characteristics for a p-n photovoltaic cell.
h = FF I V Psc oc in
P IV I V qV nkT I Vo L= = ( ) -[ ] -exp 1
P I V I V kT q qV kT kT qm m m L oc m= » - +( ) -[ ]ln 1
© 1999 by CRC Press LLC

Energy Conversion 8-155
Manufacture of Cells and Panels
There are basically Þve important solar cell design concepts, and each offers a trade-off betweenefÞciency and cost: (1) Large-area single-crystal planar cells, typically 1 ´ 1 cm2 to 6 ´ 6 cm2, yieldhigh efÞciencies under normal light conditions, 2) single-crystal small-area concentrator cells, typicallyless than 1 ´ 1 cm2, are potentially less costly and yield higher efÞciencies under concentrated light,i.e., concentration ratios of 20 to 1000 are typical; (3) more-complex single-crystal multijunction cellsyield the highest efÞciencies measured to date, but are substantially more expensive; (4) cells made frompolycrystalline materials are less expensive than single-crystaIline cells, but are less efÞcient; and (5)cells made from thin Þlm amorphous materials provide the lowest-cost approach yet, but are generallyless efÞcient than polycrystalline cells.
A typical 15% 4 ´ 4 cm2 photovoltaic cell produces only ~0.25 W under AM1.5 conditions. Therefore,individual cells must be electrically wired together to form larger submodules or panels to increase thetotal output power. The cells can be connected in series to increase the total voltage or in parallel toincrease the current. The modular nature of photovoltaic power allows the design of systems that candeliver electrical power from a few watts to many megawatts. In terrestrial applications the cells aretypically supported and held in place with a rigid substrate, i.e., typically aluminum, Plexiglas, Þberglass,or glass, and are encapsulated with glass or a polymeric material; in space applications the supportstructure may be rigid or ßexible, and the cells are protected from the space environment with quartzcover slides. The electrical power generated by the cells is conducted to an electrical load or storagebattery. Metal interconnects soldered to the ohmic contacts of the cells conduct electrical current fromone cell to the next. Current is then conducted from the network of series- and parallel-connected cellsby wires to a distribution terminal ÒbusÓ that transfers the power to either the load or battery.
Single-Crystal Cells. The p-n photovoltaic cells made from single-crystal Si dominate in space andterrestrial applications because of their high efÞciency and reliability. The formation of single-crystal p-
FIGURE 8.13.5 Theoretical AM1 efÞciency vs. semiconductor band gap Eg for an ideal photovoltaic cell under 1sun and 1000 suns concentrations.
1
Effi
cien
cy (
%)
cds
Eg (eV)
40
30
20
10
02 30
C=1
C=1000
Ge
SiGaAs
AM 1300 K
© 1999 by CRC Press LLC

8-156 Section 8
type Si results from the selective cooling of pure molten Si to form large cylindrical crystal ingots, calledboules, from which thin wafers are sliced and polished. The p-type impurities, usually boron, are addedto the melt, to give the desired impurity concentration. A large-area p-n junction is then formed bydiffusion of n-type impurity atoms, usually phosphorus. Front and back metal ohmic contacts and anantireßection coating are then formed using standard photolithography thermal evaporation or sputteringtechniques (Sze, 1985). The resulting cell structure is shown in Figure 8.13.2, and typical cell areasrange from 1 to 36 cm2. Different semiconductors absorb sunlight more efÞciently than others, describedby a factor called the absorption coefÞcient. Si has a relatively small absorption coefÞcient comparedwith other materials, such as InP, GaAs, and amorphous-Si, and consequently requires an absorptionlayer thickness of ~100 mm to maximize conversion efÞciency. Conventional Si cells have a thicknesson the order of 250 mm, but can be chemically or mechanically polished to a thickness of 100 mm.
Single-crystal III-V photovoltaic cells, such as InP and GaAs, are made from elements in the III andV columns of the periodic table. The band gaps of these cells, 1.35 and 1.42 eV, respectively, are closeto the optimum value. These materials involve the growth of single-crystal semiconductor layers upona single-crystal semiconductor substrate. This technique is called epitaxy and it provides a method toproduce both n-type and p-type layers to form the p-n junction. Epitaxial growth of n and p layers isrequired for InP and GaAs because diffusion of impurities at high temperatures is confounded by thehigh vapor pressure of the material. The formation of ohmic contacts and antireßection coating employthe same techniques as used for Si cells. The required absorption layer thickness for these cells is onlya few microns because of their large absorption coefÞcients. However, issues concerning yield andmechanical strength limit their minimum thickness to ~100 mm The best reported efÞciencies for single-crystal Si, GaAs, and InP cells under AM1.5 conditions are 24, 25, and 22%, respectively (Green et al.,1995).
Polycrystalline Cells. In the case of polycrystalline Si cells, molten Si is directly deposited into eithercylindrical or rectangular ingots. As the material solidiÞes, individual crystalline regions form that areseparated by grain boundaries which contain large numbers of structural defects. When the cell isilluminated, these defects capture a portion of the light-generated electron-hole pairs through recombi-nation processes before they can reach the junction and be collected. Thus, the grain boundaries diminishthe light-generated current and overall efÞciency of the cell. However, polycrystalline silicon cells aresufÞciently inexpensive to be commercially viable (Stone, 1993). An area that requires improvement isthe slicing of polycrystalline ingots, where yields as low as 50% are common. An approach that eliminatesthe expense of sawing and polishing altogether is the growth of polycrystalline Si directly into the formof thin ribbons using a technique called edge-deÞned Þlm-fed growth (EFG) (Fahrenbruch and Bube,1983). In this approach, a carbon die with a slot-shaped aperture is immersed in a crucible of moltenSi. The liquid Si wets the die and ßows through the slot where it cools and is pulled to form a thinribbon. This material also has high crystalline defect densities, but has good overall yields. An additionalapproach involves the growth of Þlms of nearly single-crystal quality, where two parallel supportingdendrites form the boundaries of a web or ribbon pulled from a supercooled melt of Si. The best efÞciencyfor polycrystalline Si cells under AM1.5 conditions is ~18%; that for Si cells grown by the EFG techniqueis 14%; and that for Si dendritic web cells is 15.5% (Stone, 1993). It is important to note that althoughthese lower-cost Þlms yield lower cell efÞciencies compared with single-crystal cells, the cost of cellsdepends on the cost of the starting material and the cost per watt is more important than efÞciency(Zweibel, 1995).
Thin Film Cells. Thin Þlms cells provide an even lower-cost (and lower-efÞciency) approach becausethey require a very small amount of semiconductor. An excellent review on thin Þlm photovoltaictechnologies, particularity on present and future cost issues, is given by Zweibel (1995). The generalapproach involves depositing only a few microns of material on a low-cost substrate using variousvacuum deposition techniques, although a multitude of other deposition techniques have also beendemonstrated. The top thin Þlm cell candidates are amorphous Si, a-Si, cadmium telluride, CdTe, andcopper indium diselenide, CIS (and related alloys). The highest reported thin Þlm AM1.5 efÞciencies
© 1999 by CRC Press LLC

Energy Conversion 8-157
are 17% for CIS, followed by 15.8% for CdTe, and ~11% for a-Si (Zweibel, 1995). However, the relativelevel of maturity of each design for commercial application must be put into perspective. While the bestCIS cell efÞciency is quite high, the best CIS square foot panel efÞciency reported back in 1988 was,and still is today, only 11%. SigniÞcant manufacturing problems have plagued the CIS cell, and currentlyit is still not commercially available. CdTe is believed to be the easiest of the thin Þlm cells to fabricate,and probably represents the closest to large-scale commercialization. Two U.S. companies have publiclyannounced CdTe manufacturing plants, and commercial efÞciencies are likely to be in the range of 6 to8% in the Þrst plants. The future of a-Si cells is currently believed to be limited if it cannot overcomea 10% efÞciency at the module level. Development problems include electrochemical instability to lightthat results in a 20 to 40% degradation. However, it appears that the use of multijunction thin Þlm a-Silayers may solve the problem, and modules of 7 to 9% are expected in the near term.
Concentrator Cells. Photovoltaic modules are typically either of the ßat plate or concentrator conÞgu-ration. Flat plate modules can be Þxed with respect to the sun or mounted to track the sun in one or twoaxis. Concentrator modules use large-area mirrors or lenses to concentrate sunlight onto smaller-areacells. Concentrator cells operate at higher efÞciencies. However, concentrator modules require one- ortwo-axis tracking which adds system complexity and cost that generally offsets the module efÞciencyand lower area cost beneÞts. The increase in conversion efÞciency with illumination intensity is shownin the 1000-sun concentration curve of Figure 8.13.5. Values for IL increase linearly with concentrationthrough the factor G in Equation (8.13.3) and Voc increases logarithmically with concentration throughIL in Equation (8.13.5). Under solar concentration of Ò20 sunsÓ or greater, a signiÞcant amount of cellheating can occur. While Jsc increases slightly with increasing temperature, values of Voc and FF dropstrongly. Thus, on adequate heat sink or active cooling is required at high concentrations. The reportedAM1.5 efÞciency for Si cells increases from 24 to 26.5% under a concentration of 255; and that forGaAs cells increases from 25 to 27.6% under a concentration of 140 (Green et al., 1995).
Multijunction Cells. Another approach to increase photovoltaic cell efÞciency is through the use ofmultijunction tandem cells. The simplest multijunction cell is a two-junction, two-terminal device. Inthis design, a high-band-gap (Eg1) p-n junction is vertically stacked (mechanically) or epitaxially grownatop a bottom lower-band-gap (Eg2) p-n junction as shown in Figure 8.13.6. The top junction absorbsphotons with energy ³Eg1, and the bottom junction absorbs photons with energy E, where Eg1 > E ³ Eg2,that passed through the top cell. This increases the utilization of the solar spectrum, since the excessenergy of the high-energy photons is not wasted. The values of Eg1 and Eg2 must be chosen to achievemaximum solar absorption and current matching; i.e., the two cells must generate equal currents whenilluminated. The band gap combinations of ~0.7 and 1.4, 1.0 and 1.4, 1.1 and 1.4, and 1.4 and 1.9 eVare current matched, where Eg for GaSb, CuInSe2, Si, GaAs, AlGaAs, and GaInP2 are ~0.7, 1.0, 1.1,1.4, and 1.9 eV, respectively. Multijunction concentrator cells have reported efÞciencies in excess of30% (Green, 1995).
Design of a Photovoltaic Generating System
A schematic diagram depicting the basic components of a typical photovoltaic power generation systemis shown in Figure 8.13.7 (Pulfrey, 1978). The system includes a photovoltaic array that consists ofmany smaller submodules, each containing many hundreds or thousands of photovoltaic cells. The DCoutput power from the array is controlled by a power conditioning unit that contains an inverter fordeveloping AC power and an input power tracking device to maintain the optimal array load to achievemaximum output power. Power is directly fed to the electrical load and/or storage system by theconditioning unit. The storage system is needed to save energy when power is generated in excess ofthe immediate demand, or when the load demand exceeds the immediate generation level. Total photo-voltaic power system efÞciency is the product of the efÞciencies of the individual components. TypicalefÞciencies for the power conditioning unit (determined by the inverter) and energy storage system areabout 95% and 50-80%, respectively. Thus, an array efÞciency of 10% would result in a total system
© 1999 by CRC Press LLC

8-158 Section 8
efÞciency of about 5 to 8%, and a total system efÞciency of 10% would require an array efÞciency inexcess of 13%.
Defining Terms
Band gap (Eg): The difference in energy between the energy level of the bottom of the conduction bandand the energy level of the top of the valence band.
Conduction band: A range of allowable energy states in a solid in which electrons can move freely.Conversion efÞciency (h): The ratio of the available power output photovoltaic cell to the total incident
radiant power.Dark current: Any current that ßows through the p-n junction in the absence of external irradiation.Fill factor ( ff ): The ratio of the maximum photovoltaic cell output power to the product of the open-
circuit voltage and short-circuit current.Light-generated current (IL): The electrical current obtained from an illuminated p-n junction resulting
from the collection of photocarriers across the junction.Open-circuit voltage (Voc): The voltage obtained across the terminals of an illuminated p-n photovoltaic
cell under open-circuit conditions.
FIGURE 8.13.6 Schematic diagram of a multijunction (two-junction) photovoltaic cell under illumination.
FIGURE 8.13.7 Schematic diagram depicting the basic components of a typical photovoltaic power system.
© 1999 by CRC Press LLC

Energy Conversion 8-159
Photocarriers: Electrons and holes generated within a semiconductor via the absorption of photonenergy.
Photocurrent: Synonymous with light-generated current.Photovoltaic effect: The production of a voltage difference across a p-n junction resulting from the
absorption of photon energy.Photovoltage: The voltage resulting from the photovoltaic effect.Polycrystalline: A material characterized by an array or agglomerate of small single-crystal sections of
various crystal orientations separated from one another by grain boundaries, which are localizedregions of very severe lattice disruptions and dislocations.
Short-circuit current (Isc): The electrical current measured through the terminals of an illuminated p-n photovoltaic cell under short-circuit conditions.
Single crystal: A material characterized by a perfect periodicity of atomic structure; the basic arrange-ment of atoms is repeated throughout the entire solid.
Valence band: A range of allowable energy states in a solid crystal in which lie the energies of thevalence electrons that bind the crystal together.
References
Fahrenbruch, A.L. and Bube, R.H. 1983. Fundamentals of Solar Cells Ñ Photovoltaic Solar EnergyConversion, Academic Press, New York.
Green, M.A., Emery, K., Bucher, K., and King, D.L. 1995. Short communication: solar cell efÞciencytables (version 5), Prog. Photovoltaics Res. Dev., 3, 51Ð55.
Henry, C.H. 1980. Limiting efÞciency of ideal single and multiple energy gap terrestrial solar cells, J.Appl. Phys., 51, 4494.
Pulfrey, D.L. 1978. Photovoltaic Power Generation, Van Nostrand Reinhold, New York.Stirn, R.J. 1972. Junction characteristics of Si solar cells, in Proceedings of the 9th IEEE Photovoltaics
Specialists Conference, p.72.Stone, J.L. 1993. Photovoltaics: unlimited electrical power from the sun, Phys. Today, Sepember, 22Ð29.Streetman, B.G. 1980. Solid State Electronic Devices, Prentice-Hall, Englewood Cliffs, NJ.Sze, S.M. 1981. Physics of Semiconductor Devices, 2nd ed., John Wiley & Sons, New York.Sze, S.M. 1985. Semiconductor Devices: Physics and Technology, John Wiley & Sons, New York,
341Ð457.Tada, H.Y., Carter, J.R., Anspaugh, B.E., and Downing, R.G. 1982. Solar Radiation Handbook. JPL
Publication 82-69, 2-11Zweibel, K. 1995. Thin Films: Past, Present, Future. NREL/IP-413-7486 Publication (DOE UC Category
1260 DE95004084).
Further Information
An excellent presentation of the basic theory of the various photovoltaic cell designs is given inFundamentals of Solar Cells: Photovoltaic Solar Energy Conversion, by Alan L. Fahrenbruch andRichard H. Bube. This text covers the basics of solar insolation, semiconductors, p-n junctions, andsingle-crystal, polycrystalline, thin Þlm, and concentrator photovoltaic cells.
An excellent review of the progress achieved in terrestrial and space photovoltaics can be traced inthe Proceedings of the IEEE (Institute of Electrical and Electronics Engineers) Photovoltaics SpecialistsConference (PVSC) that dates back to 1961. These proceedings include thousands of papers that addressnearly every aspect of photovoltaic cell development: basic theory, design, fabrication, and application.
The monthly journal Solar Energy Materials and Solar Cells covers many aspects of improving deviceefÞciency, reducing costs, and testing and applications.
© 1999 by CRC Press LLC

8-160 Section 8
The monthly journal Progress in Photovoltaics documents recent results of research work conductedin photovoltaics worldwide. This journal is an excellent source for currently reported cell conversionefÞciencies.
Proceedings of the conference Space Photovoltaics Research and Technology is an excellent sourcefor the reader interested in the development of photovoltaics for use in space.
Fuel Cells
D. Yogi Goswami
Introduction
A fuel cell is an electrochemical device in which a fuel and an oxidant react in such a controlled mannerthat the chemical energy of reaction is converted directly into electrical energy. Ordinarily, a fuel reactsviolently with an oxidant in a combustion reaction resulting in the release of heat of combustion. Theheat of combustion can, then, be converted into electrical energy via mechanical work with the constraintof the second law of thermodynamics. The overall efÞciency of the series of conversion processes is ofthe order of 40%. A fuel cell bypasses these processes resulting in potential efÞciencies of the order of80%. As an example, when hydrogen is burned in an atmosphere of oxygen it results in the followingreaction:
(8.13.10)
In this reaction, two hydrogen atoms bond with an oxygen atom by sharing their electrons with theoutermost orbit of oxygen, which becomes full, resulting in a stable structure.
The reactants H2 and O2 may be combined to form the same product (H2O) by Þrst stripping theelectrons away from the hydrogen atoms and allowing the electrons to pass through an external circuitbefore combining with oxygen. Table 8.13.1 gives typical electrochemical reactions in fuel cells.
(8.13.11)
(8.13.12)
Figure 8.13.8 shows a schematic of an arrangement that would allow the above reaction to proceed.
In order for the above reactions to occur according to the schematic of Figure 8.13.8:
TABLE 8.13.1 Electrochemical Reactions in Fuel Cells
Fuel Cell Anode Reaction Cathode Reaction Overall Reaction
Proton exchange H2 ® 2H+ + 2eÐ 1/2O2 + 2H+ + 2eÐ ® H2O H2 + 1/2O2 ® H2OAlkaline H2 + 2(OH)Ð ® 2H2O + 2eÐ 1/2O2 + H2O + 2eÐ ® 2(OH)Ð H2 + 1/2O2 ® H2OPhosphoric acid H2 ® 2H+ + 2eÐ 1/2O2 + 2H+ + 2eÐ ® H2O H2 + 1/2O2 ® H2OMolten carbonate H2 + ® H2O + CO2 + 2eÐ
CO + ® 2CO2 + 2eÐ
1/2O2 + CO2 + 2eÐ ® H2 + 1/2O2 + CO2 (cathode) ® H2O + CO2 (anode)
Solid oxide H2 + OÐ ® H2O + 2eÐ 1/2O2 + 2eÐ ® OÐ H2 + 1/2O2 ® H2OCO + OÐ ® CO2 + 2eÐ CO + 1/2O2 ® CO2
CH4 + 4OÐ ® 2H2O + CO2 + 8eÐ CH4 + 2O2 ® H2O + CO2
Source: Hirschenhofer, J.H. et al., Fuel Cells, A Handbook, rev. 3, Gilbert/Commonwealth, Morgantown, WV, 1994. With permission.
H O H O + heat of reaction2 2 2+ ® ( )12
DH
H H e electrons2+® + ( )-2 2
2 2H O e H O+2+ + ®-
CO3-
CO3-
CO3-
© 1999 by CRC Press LLC

Energy Conversion 8-161
1. Electrodes must be porous to let the fuel and electrolyte penetrate.2. The electrolyte must be permeable to H+ and (OH)Ð ions.3. Electrode materials must be catalysts for the reaction (Pt, Ni, etc.).
In 1839, William Grove, an English investigator, constructed a chemical battery in which he noticed thatthe water-forming reaction of hydrogen and oxygen generated an electrical current. However, it was notuntil 50 years later that two English chemists, Ludwig Mond and Carl Langer, developed a device theyactually called a fuel cell (Angrist, 1982). There has been a strong resurgence in research and developmentof fuel cells in the last four decades.
Thermodynamic Performance
The energy released or needed in any chemical reaction (DH) is equal to the difference between theenthalapy of formation of the products and the reactants.
(8.13.13)
In an exothermic reaction the change in enthalpy of formation (DH) is negative. Table 8.13.2 gives valuesof DH for various compounds at 25°C at 1 atm. All naturally occurring elements have a DH value of zero.
In a combustion reaction all of the change in the enthalpy of formation (DH) is converted to heat andis, therefore, called the higher heating value (HHV).
FIGURE 8.13.8 Conceptual schematic of a hydrogen fuel cell.
TABLE 8.13.2 Enthalty of Formation DH0 and Gibbs Free Energy DG0 of Compounds at 1 atm and 298 K
Compound or IonEnthalpy of Formation,
DH0, J/kg á molGibbs Free Energy DG0,
J/kg á mol
CO Ð110.0 ´ 106 Ð137.5 ´ 106
CO2 Ð394.0 ´ 106 Ð395.0 ´ 106
CH4 Ð74.9 ´ 106 Ð50.8 ´ 106
Water Ð286.0 ´ 106 Ð237.0 ´ 106
Steam Ð241.0 ´ 106 Ð228.0 ´ 106
C, H2, O2 0 0O(g) +249.2 ´ 106 +231.8 ´ 106
H(g) +218.0 ´ 106 +203.3 ´ 106
Source: Adapted from Wark, K., Thermodynamics, McGrawÐHill, New York, 1988. With permission.
D D DH H H= ( ) - ( )å åproducts reactants
© 1999 by CRC Press LLC

8-162 Section 8
(8.13.14)
For example, for complete combustion of hydrogen according to the following reaction:
(8.13.15)
Change in the enthalpy of formation is
(8.13.16)
In a fuel cell, most of DH can be converted to electricity directly. The part that cannot be converted towork directly gets converted into heat. The minimum amount that must be converted to heat is representedby reversible heat transfer òT dS. If a fuel cell operates isothermally, the maximum amount of electricalwork (We) produced is given by
(8.13.17)
In an irreversible reaction
(8.13.18)
Gibbs free energy, G, is given by:
(8.13.19)
Therefore, in a reversible isothermal process
(8.13.20)
The actual electrical work in a fuel cell is given by
(8.13.21)
(8.13.22)
The electrical work, We, is associated with the work of electrons passing through an external resistance.1 g á mol of electrons is equal to AvogadroÕs number (6.022 ´ 1023) and the charge of these electronsis equal to 96,439 C which is called a faraday (F). If n g á mols of electrons are generated and E is theinternal reversible cell voltage, then the maximum electrical work is given by
(8.13.23)
denoting values under standard conditions (25°C, 1 atm) by superscript 0, we have
(8.13.24)
- ( ) =DH reaction HHV of fuel
H O H O liquid2 2 2+ ® ( )12
D D D DH H H H= - - ( ) = - ´( ) - - = - ´ ×H O H O 22 2 2 J kg mol H
12
286 10 0 0 286 106 6
W H T Se ,max = -D D
W H T Se ,max < -D D
G H TS= -
D D DG H T S We= - = ,max
W Ge £ ( )D change in Gibbs free energy for the reaction
D D DG G Greaction products reactants= ( ) - ( )å å
W G nFEe ,max = = -D
DG nFE0 0= -
© 1999 by CRC Press LLC
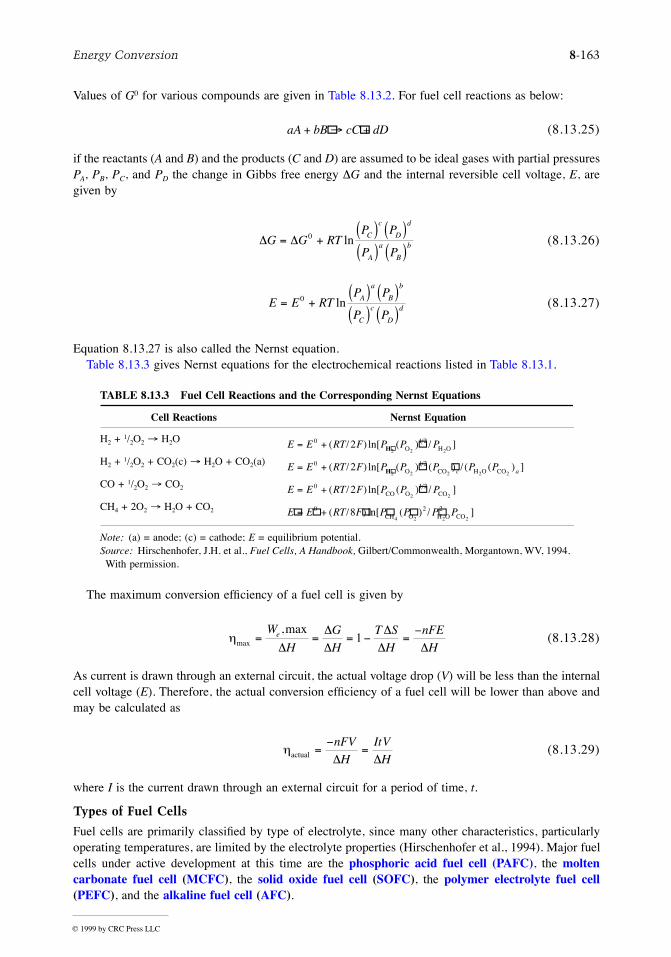
Energy Conversion 8-163
Values of G0 for various compounds are given in Table 8.13.2. For fuel cell reactions as below:
(8.13.25)
if the reactants (A and B) and the products (C and D) are assumed to be ideal gases with partial pressuresPA, PB, PC, and PD the change in Gibbs free energy DG and the internal reversible cell voltage, E, aregiven by
(8.13.26)
(8.13.27)
Equation 8.13.27 is also called the Nernst equation.Table 8.13.3 gives Nernst equations for the electrochemical reactions listed in Table 8.13.1.
The maximum conversion efÞciency of a fuel cell is given by
(8.13.28)
As current is drawn through an external circuit, the actual voltage drop (V) will be less than the internalcell voltage (E). Therefore, the actual conversion efÞciency of a fuel cell will be lower than above andmay be calculated as
(8.13.29)
where I is the current drawn through an external circuit for a period of time, t.
Types of Fuel Cells
Fuel cells are primarily classiÞed by type of electrolyte, since many other characteristics, particularlyoperating temperatures, are limited by the electrolyte properties (Hirschenhofer et al., 1994). Major fuelcells under active development at this time are the phosphoric acid fuel cell (PAFC), the moltencarbonate fuel cell (MCFC), the solid oxide fuel cell (SOFC), the polymer electrolyte fuel cell(PEFC), and the alkaline fuel cell (AFC).
TABLE 8.13.3 Fuel Cell Reactions and the Corresponding Nernst Equations
Cell Reactions Nernst Equation
H2 + 1/2O2 ® H2O
H2 + 1/2O2 + CO2(c) ® H2O + CO2(a)
CO + 1/2O2 ® CO2
CH4 + 2O2 ® H2O + CO2
Note: (a) = anode; (c) = cathode; E = equilibrium potential.Source: Hirschenhofer, J.H. et al., Fuel Cells, A Handbook, Gilbert/Commonwealth, Morgantown, WV, 1994. With permission.
aA bB cC dD+ ® +
D DG G RTP P
P P
C
c
D
d
A
a
B
b= +( ) ( )( ) ( )
0 ln
E E RTP P
P P
A
a
B
b
C
c
D
d= +( ) ( )( ) ( )
0 ln
E E RT F P P P= +0 1 222 2
( / ) ln[ ( ) / ]H O H O2
E E RT F P P P P Pc a= +0 1 222 2 2 2
( / ) ln[ ( ) ( ) / ( ( ) ]H O CO H O CO2
E E RT F P P P= +0 1 222 2
( / ) ln[ ( ) / ]CO O CO
E E RT F P P P P= +0 284 2 2
( / ) ln[ ( ) / ]CH O H O2
CO2
hmax
max= = = - =
-W
H
G
H
T S
H
nFE
He ,
DDD
DD D
1
hactual =-
=nFV
H
ItV
HD D
© 1999 by CRC Press LLC

8-164 Section 8
Phosphoric Acid Fuel Cell. PAFC uses concentrated phosphoric acid (H3PO4) as the electrolyte, hydrogenas the fuel, and oxygen (from air) as the oxidant. Table 8.13.4 provides information on the electrodesand other materials for PAFC as well as other fuel cells.
The reactions take place at the porous electrodes on highly dispersed electrocatalyst Pt particlessupported on carbon black and a polymeric binder, usually polytetraßuoroethylene (PTFE) (about 30 to50% by weight) (Kinoshita et al., 1988; Hirschenhofer et al., 1994). A porous carbon paper substrateprovides structural support for the electrocatalyst and serves as the current collector. A typical carbonpaper electrode impregnated with the electrocatalyst has a porosity of about 60%, consisting ofmicropores of about 34 � diameter and macropores of 3 to 50 mm diameter.
Dipolar plates (usually graphite) are used to separate the individual cells and electrically connect themin series in a fuel cell stack. In PAFC stacks, provisions are included to remove the waste heat, by liquids(usually water) or gases (usually air) which ßow through channels provided in the cell stack.
Molten Carbonate Fuel Cells. MCFCs use as electrolytes mixtures of molten carbonates of lithium(Li2CO3), potassium (K2CO3), and sodium (Na2CO3) in proportions as shown in Table 8.13.4. Theoperating temperature of the cell (~650°C) is higher than the melting temperature of the carbonateelectrolytes. Besides H2 (fuel) and O2 (oxidant from air) the cell uses CO2 which transfers from thecathode to the anode according to the reactions in Table 8.13.1.
According to the reactions, 1 g á mol of CO2 is transferred along with 2 g á mol of electrons (2F).The reversible potential for an MCFC, taking into account the transfer of CO2, is given by the Nernstequation in Table 8.13.3.
It is usual practice to recycle the CO2 generated at the anode to the cathode where it is consumed.An early process used to fabricate electrolyte structures involved hot processing mixtures of LiAlO2 andalkali carbonates at temperatures slightly below the melting point of carbonates. These electrolytestructures had problems of void spaces, nonuniformity of microstructure, poor mechanical strength, andhigh iR drop. To overcome these problems, processes have been developed recently that include tapecasting (Man et al., 1984; Hirschenhofer et al., 1994) and electrophoretic deposition (Baumgartner etal., 1985; Hirschenhofer et al., 1994).
Increasing the operating pressures results in enhanced cell voltages. Increasing the operating temper-ature above 550°C also enhances the cell performance. However, beyond 650°C the gains are diminishedand the electrolyte loss and material corrosion are increased. Therefore, 650°C is about the optimumoperating temperature.
Solid Oxide Fuel Cell. SOFCs offer a number of advantages over MCFCs for high-temperature operation,since there is no liquid electrolyte. Solid electrolyte allows ßexibility in cell shape design based onapplication. Cells of several shapes, as shown in Figure 8.13.9, are being developed. Because of thehigh temperature of operation (~1000°C) carbon monoxide (CO) and hydrocarbons such as methane(CH4) can be used as fuels. At 1000°C, these fuels can easily produce H2 that is used at the anode bysteam reforming and water-gas reactions as
(8.13.30)
(8.13.31)
Because of very high operating temperatures the choice of cell materials is limited by (1) chemicalstability in oxidizing and reducing atmosphere; (2) chemical stability of contacting materials; and (3)conductivity and thermomechanical compatibility. A detailed description of the current status is givenby Minh (1991; 1993) and Appleby and Foulkes (1989). Present SOFC designs make use of thin Þlmwall concepts where Þlms of electrodes, electrolyte, and interconnect material are deposited on eachother and sintered to form cell structure. Electrochemical vapor deposition (EVD) is now used to depositthin layers.
CO + H O CO H water-gas2 2 2® + ( )
CH + H O CO H steam reforming4 2 2® + ( )3
© 1999 by CRC Press LLC

En
ergy Con
version8-165
© 199
PEFC AFC
% Pt thin Þlm ¥ Dual Porosit Ni¥ 16 mm max pore
on electrolyte side¥ 30 mm pore on gas side
% Pt thin Þlm ¥ Porous lithinated NiO
rbon paper with Teßonoating on one side
Ñ Ñ
ton conductingembrane of perßuoro
ulfonic acid polymer
¥ KOH (45% to 85%)
n, surface area of 220 m2/g by nitrogen adsorption,
ission.
9 by CRC Press LLC
TABLE 8.13.4 Cell Components for Various Fuel Cells
Component PAFC MCFC SOFCb
Anode ¥ PTFE-bonded Pt/C¥ Vulcan XC-72a
¥ 0.1 mg Pt/cm2
¥ Ni-10 wt% Cr¥ 3Ð6 mm pore size¥ 50Ð70% initial porosity¥ 0.5Ð1.5 mm thickness¥ 0.1Ð1 m2/g
¥ Ni/ZrO2 cermetc (30 mol% Ni)¥ Deposit slurry¥ 12.5 ´ 10Ð6 cm/cm °C¥ ~150 mm thickness¥ 20Ð40% porosity
¥ 10
Cathode ¥ PTFE-bonded Pt/c¥ Vulcan XC-72a
¥ 0.5 mg Pt/cm2
¥ Lithiated NiO¥ 7Ð15 mm pore size¥ 60Ð65% after lithiation
and oxidation¥ 70Ð80% initial porosity¥ 0.5Ð0.75 mm thickness¥ 0.5 m2g
¥ Sr-doped lanthanum manganite (10 mol% Sr)
¥ Deposit slurry, sinter¥ ~1 mm thickness¥ 12 ´ 10Ð6 cm/cm °C expansion from
room temperature to 1000°Cd
¥ 20Ð40% porosity
¥ 10
Electrode support
¥ Carbon paper
¥ PTFE-bonded SiC
¥ 100% H3PO4
Ñ Ñ ¥ Cac
Electrolyte support
¥ g-LiAlO2
¥ 0.1Ð12m2/g¥ 0.5 mm thickness
Ñ
Electrolytea ¥ 62 Li-38 K¥ 50 Li-50 Na¥ 50 Li-50 K¥ Tape cast¥ 0.5 mm thickness
¥ Yttria-stabilized ZrO2 (8 mol% Y)¥ EVDd
¥ 10.5 ´ 10Ð6 cm/cm °C expansionfrom room temperature to 1000°Cd
¥ ~40 mm thickness
¥ Proms
a Conductive oil furnace black, product of Cabot Corp. Typical properties: 002 d-spacing of 3.6 � by X-ray diffusioand average particle size of 30 mm by electron microscopy.
b SpeciÞcations for Westinghouse SOFC.c Y2O3 stabilized ZrO2.d EVD = electrochemical vapor deposition.Source: Hirschenhofer, J.H. et al., Fuel Cells, Handbook, Gilbert/Commonwealth, Morgantown, WV, 1994. With perm

8-166 Section 8
Increasing pressure and temperature enhances the performance of SOFC.
Polymer Electrolyte Fuel Cell. The basic cell consists of a proton-conducting membrane such as perßuorosulfonic acid polymer sandwiched between two Pt-impregnated porous electrodes. The backs of theelectrodes are made hydrophobic by coating with Teßon¨, which provides a path for gas to diffuse tothe catalyst layer.
The electrochemical reactions for PEFC are similar to PAFC as given in Table 8.13.1.The protons from the anode diffuse through the membrane with the help of water molecules soaked
in the membrane. The cell operates at low temperature (80°C) and can have very high current densities.Therefore, the cell can be made very compact and can have fast start. There are no corrosive ßuids (acidsor alkalis) in the cell. Because of these attributes the cell is particularly suited for vehicle-power operation.Present research includes investigation of using methanol and natural gas as the fuel for the cell.
Alkaline Fuel Cell. Alkaline electrolytes have faster kinetics, which allows the use of non-noble metalelectrocatalysts. However, AFCs suffer a drastic performance loss if CO2 is present in the fuel or theoxidant, for example, air. Therefore, AFCs are restricted for use where pure H2 and O2 can be used.They have been used in the past in the space program.
Fuel Cell Performance
The performance of fuel cells is affected by the operating variables (e.g., temperature, pressure, gascomposition, reactant utilization, and current density) and other factors that inßuence the reversible cellpotential (impurities) and the magnitude of the irreversible voltage losses (polarization, contact resistance,exchange current).
The cell voltage (Vcell) is given by
(8.13.32)
where i is the current through the cell, R is the cell resistance, and mp is the polarization loss.
FIGURE 8.13.9 Solid oxide fuel cell designs atthe cathode: (a) tubular; (b) monolithic; (c) ßat plate.
V E iR pcell = - - m
© 1999 by CRC Press LLC
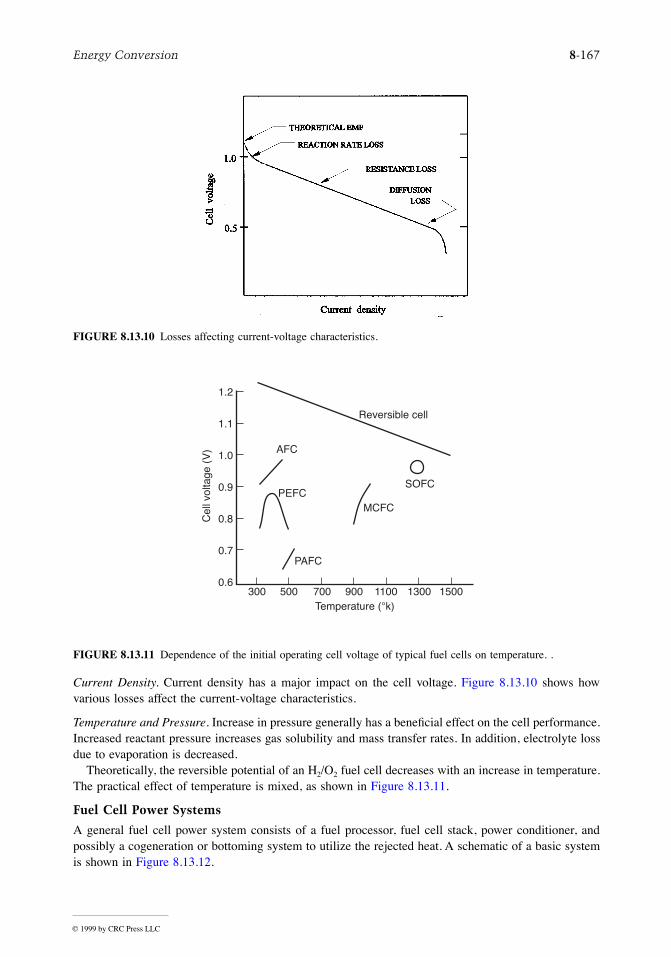
Energy Conversion 8-167
Current Density. Current density has a major impact on the cell voltage. Figure 8.13.10 shows howvarious losses affect the current-voltage characteristics.
Temperature and Pressure. Increase in pressure generally has a beneÞcial effect on the cell performance.Increased reactant pressure increases gas solubility and mass transfer rates. In addition, electrolyte lossdue to evaporation is decreased.
Theoretically, the reversible potential of an H2/O2 fuel cell decreases with an increase in temperature.The practical effect of temperature is mixed, as shown in Figure 8.13.11.
Fuel Cell Power Systems
A general fuel cell power system consists of a fuel processor, fuel cell stack, power conditioner, andpossibly a cogeneration or bottoming system to utilize the rejected heat. A schematic of a basic systemis shown in Figure 8.13.12.
FIGURE 8.13.10 Losses affecting current-voltage characteristics.
FIGURE 8.13.11 Dependence of the initial operating cell voltage of typical fuel cells on temperature. .
300
1.2
1.1
1.0
0.9
0.8
0.7
0.6500 700 900 1100 1300 1500
Temperature (°k)
Reversible cell
SOFC
MCFC
PAFC
PEFC
AFC
Cel
l vol
tage
(V
)
© 1999 by CRC Press LLC
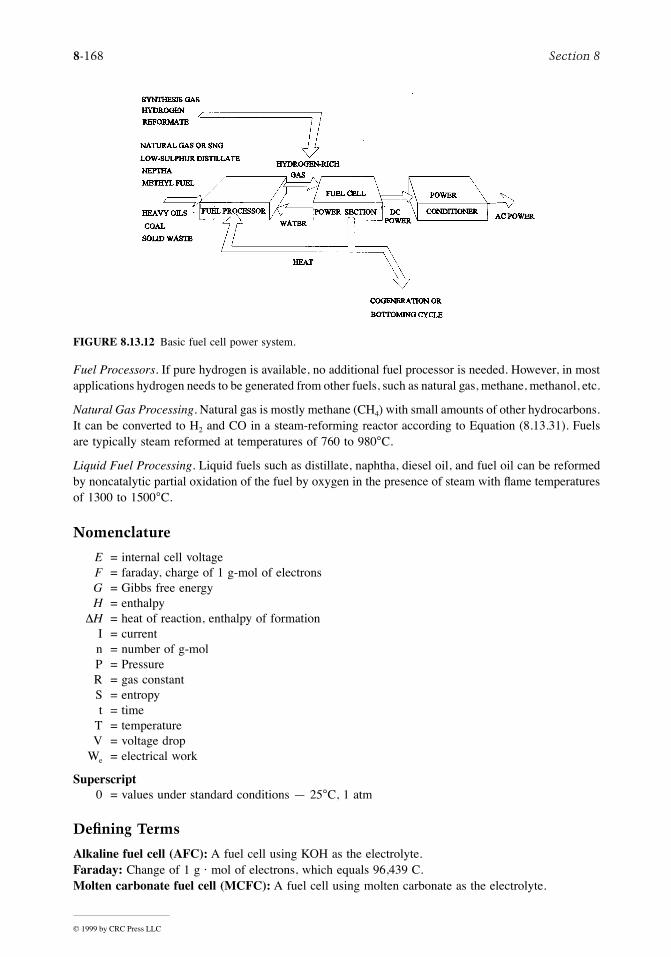
8-168 Section 8
Fuel Processors. If pure hydrogen is available, no additional fuel processor is needed. However, in mostapplications hydrogen needs to be generated from other fuels, such as natural gas, methane, methanol, etc.
Natural Gas Processing. Natural gas is mostly methane (CH4) with small amounts of other hydrocarbons.It can be converted to H2 and CO in a steam-reforming reactor according to Equation (8.13.31). Fuelsare typically steam reformed at temperatures of 760 to 980°C.
Liquid Fuel Processing. Liquid fuels such as distillate, naphtha, diesel oil, and fuel oil can be reformedby noncatalytic partial oxidation of the fuel by oxygen in the presence of steam with ßame temperaturesof 1300 to 1500°C.
Nomenclature
Defining Terms
Alkaline fuel cell (AFC): A fuel cell using KOH as the electrolyte.Faraday: Change of 1 g á mol of electrons, which equals 96,439 C.Molten carbonate fuel cell (MCFC): A fuel cell using molten carbonate as the electrolyte.
FIGURE 8.13.12 Basic fuel cell power system.
E = internal cell voltageF = faraday, charge of 1 g-mol of electronsG = Gibbs free energyH = enthalpy
DH = heat of reaction, enthalpy of formationI = currentn = number of g-molP = PressureR = gas constantS = entropyt = time
T = temperatureV = voltage drop
We = electrical work
Superscript0 = values under standard conditions Ñ 25°C, 1 atm
© 1999 by CRC Press LLC

Energy Conversion 8-169
Phosphoric acid fuel cell (PAFC): A fuel cell using phosphoric acid as the electrolyte.Polymer electrolyte fuel cell (PEFC): A fuel cell using Zerconia as the electrolyte.Solid oxide fuel cell (SOFC): A fuel cell using potassium as the electrolyte.
References
Angrist, S.W. 1982. Chapter 8, in Direct Energy Conversion. Allyn and Bacon, Boston.Appleby, A.J. and Foulkes, F.R. 1989. Fuel Cell Handbook, Van Nostrand Reinhold, New York.Baumgartner, C.E., DeCarlo, V.J., Glugla, P.G., and Grimaldi, J.J. 1985. J. Electrochem. Soc, 132, 57.Farooque, M. 1990. ERC, Development on Internal Reforming Carbonate Fuel Cell Technology, Final
Report, prepared for United States DOE/METC, DOC/MC/23274-2941, pp. 3Ð19, October.Hirschenhofer, J.H., Stauffer, D.B., and Engleman, R.R. 1994. Fuel Cells, A Handbook, rev. 3. Prepared
by Gilbert/Commonwealth, Inc., under U.S. DOE Contract No. DE-AC01-88FE61684, UnitedStates Department of Energy, OfÞce of Fossil Energy, Morgantown, WV.
Kinoshita, K., McLarnon, F.R., and Cairns, E.J. 1988. Fuel Cells, A Handbook. Prepared by LawrenceBerkeley Laboratory for the United States DOE under contract DE-AC03765F00098.
Maru, H.C., Paetsch, L., and Piegeaud, A. 1984. In Proceedings of the Symposium on Molten CarbonateFuel Technology, R.J. Selman and T.D. Claar, Eds., The Electrochemical Society, Pennington, NJ,p. 20.
Minh, N.Q. 1991. High-temperature fuel cells, Part 2: The solid oxide cell, Chem. Tech., 21, February.Minh, N.Q. 1993. Ceramic fuel cells, J. Am. Ceram. Soc., 76(3), 563Ð588.Pigeaud, A., Skok, A.J., Patel, P.S., and Maru, H.C. 1981. Thin Solid Films, 83, 1449.Wark, K. 1988. Thermodynamics, McGraw-Hill, New York, p. 873.
Further Information
Information presented in this section borrows heavily from Hirschenhofer et al. (1994) which lists originalreferences of works published by thousands of researchers across the world. For those references andfurther information, readers are referred to the Fuel Cell handbooks by Hirschenhofer, Stauffer, andEngleman (1994), and Appleby and Foulkes (1989), listed in the References section.
Thermionic Energy Conversion
Mysore L. Ramalingam
Introduction
Thermionic energy conversion (TEC) is the process of converting heat directly to useful electricalwork by the phenomenon of thermionic electron emission. This fundamental concept can be applied toa cylindrical version of the planar converter, considered the building block for space nuclear powersystems (SNPS) at any power level. Space nuclear reactors based on TEC can produce power in therange of 5 kWe to 5 MWe, a spectrum that serves the needs of current users such as National Aeronauticsand Space Administration (NASA), United States Air Force (USAF), United States Department of Energy(USDOE), and Ballistic Missile Defense Organization (BMDO). Electrical power in this range iscurrently being considered for commercial telecommunication satellites, navigation, propulsion, andplanetary exploration missions.
The history of thermionic emission dates back to the mid-1700s when Charles Dufay observed thatelectricity is conducted in the space near a red-hot body. Although Thomas Edison requested a patentin the late 1800s, indicating that he had observed thermionic electron emission while perfecting hiselectric light system, it was not until the 1960s that the phenomenon of TEC was adequately describedtheoretically and experimentally (Hatsopoulos and Gryftopoulos, 1973). These pioneering activities haveled to the development of thermionic SNPS that could potentially be augmented by Brayton and Stirling
© 1999 by CRC Press LLC

8-170 Section 8
cycle generators to produce additional power from waste heat in NASA manned lunar and martianexploration missions (Ramalingam and Young, 1993).
Principles of Thermionic Energy Conversion
Figure 8.13.13 represents a schematic of the essential components and processes in an elementarythermionic converter (TC). Electrons Òboil-offÓ from the emitter material surface, a refractory metalsuch as tungsten, when heated to high temperatures (2000 K) by a heat source. The electrons thentraverse the small interelectrode gap, to a colder (1000 K) collector surface where they condense,producing an output voltage that drives the current through the electrical load and back to the emitter.The ßow of electrons through the electrical load is sustained by the temperature difference and thedifference in surface work functions of the electrodes.
Surface Work Function. In a simple form, the energy required to separate an electron from a metalsurface atom and take it to inÞnity outside the surface is termed the electron work function or the workfunction of the metal surface. The force experienced by an electron as it crosses an interface between ametal and a rareÞed vapor can be represented by the electron motive, Y, which is deÞned as a scalarquantity whose negative gradient at any point is a measure of the force exerted on the electron at thatpoint (Langmuir and Kingdon, 1925). At absolute zero the kinetic energy of the free electrons wouldoccupy quantum energy levels from zero to some maximum value called the Fermi level. Each energylevel contains a limited number of free electrons, similar to the electrons contained in each electron orbitsurrounding the nucleus of an atom. Fermi energy, m, corresponds to the highest energy of all freeelectrons at absolute zero. At temperatures other than absolute zero some of the free electrons begin toexperience energies greater than that at the Fermi level. Thus, the electron work function F, would bedeÞned as
(8.13.33)
where YT represents the electron motive or energy at some temperature, T, above absolute zero.
Interelectrode Motive Distribution. Figure 8.13.14 provides a schematic representation of the electronmotive distribution in the interelectrode space of a thermionic converter. Under ideal conditions ofparticle transport, the motive varies linearly from YEM, the motive just outside the emitter, to YCO, themotive outside the collector surface. The magnitudes of the Fermi energies of the emitter and collectorrelative to YEM and YCO are clearly indicated. The internal voltage drop of the converter is deÞned as;
(8.13.34)
FIGURE 8.13.13 Schematic of an Elementary TEC.
F Y= -T m
D Y YV e= -( )EM CO
© 1999 by CRC Press LLC

Energy Conversion 8-171
In a conventional thermionic converter, the emitter and collector are not at the same temperature, but toa good approximation, the output voltage, neglecting lead losses and particle interaction losses, canbe represented by the relationship.
(8.13.35)
Since a real thermionic converter has an ionizing medium to improve its performance, a similar motivedistribution can be deÞned for the ions. It is sufÞcient to state that the ion interelectrode motive has aslope equal and opposite to the corresponding electron interelectrode motive. The ions are, therefore,decelerated when the electrons are accelerated and vice versa.
Electron Saturation Current. In the absence of a strong inßuence from an external electrical source, theelectron current ejected from a hot metal at the emitter surface into the vacuum ionizing medium istermed the electron saturation current. As this quantity depends on the number of free electrons N(ex),Fermi-Dirac statistics provide the means to compute the number of free electrons, N(ex) dex, incident ona unit area within the metal in unit time with energies corresponding to the motion normal to the area,between ex and ex + dex. For energies greater than the Fermi energy, the functional dependence of N(ex)on ex is given by (Fowler, 1955)
(8.13.36)
where me is the mass of the electron = 9.108 ´ 10Ð28 g and h is PlanckÕs constant = 4.140 ´ 10Ð15 eV á sec.The electron saturation current density, Jsat, for a uniform surface, is found by integrating N(ex) in the
range of ex from YT to inÞnity for all YT Ð m > kT, which is the case for almost all materials and practicaltemperatures. The result of the integration yields
FIGURE 8.13.14 Electron motive distribution in the interelectrode gap.
V e= -( )m mCO EM
N m kT h kTx e xe p e m( ) » [ ] - -{ }[ ]4 3 exp
© 1999 by CRC Press LLC
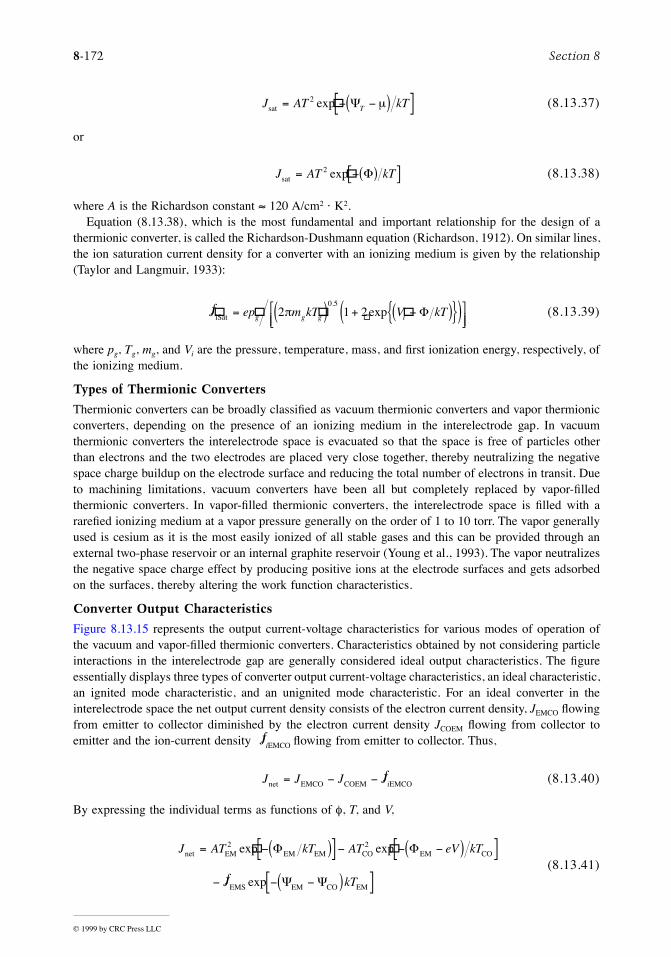
8-172 Section 8
(8.13.37)
or
(8.13.38)
where A is the Richardson constant » 120 A/cm2 á K2.Equation (8.13.38), which is the most fundamental and important relationship for the design of a
thermionic converter, is called the Richardson-Dushmann equation (Richardson, 1912). On similar lines,the ion saturation current density for a converter with an ionizing medium is given by the relationship(Taylor and Langmuir, 1933):
(8.13.39)
where pg, Tg, mg, and Vi are the pressure, temperature, mass, and Þrst ionization energy, respectively, ofthe ionizing medium.
Types of Thermionic Converters
Thermionic converters can be broadly classiÞed as vacuum thermionic converters and vapor thermionicconverters, depending on the presence of an ionizing medium in the interelectrode gap. In vacuumthermionic converters the interelectrode space is evacuated so that the space is free of particles otherthan electrons and the two electrodes are placed very close together, thereby neutralizing the negativespace charge buildup on the electrode surface and reducing the total number of electrons in transit. Dueto machining limitations, vacuum converters have been all but completely replaced by vapor-Þlledthermionic converters. In vapor-Þlled thermionic converters, the interelectrode space is Þlled with arareÞed ionizing medium at a vapor pressure generally on the order of 1 to 10 torr. The vapor generallyused is cesium as it is the most easily ionized of all stable gases and this can be provided through anexternal two-phase reservoir or an internal graphite reservoir (Young et al., 1993). The vapor neutralizesthe negative space charge effect by producing positive ions at the electrode surfaces and gets adsorbedon the surfaces, thereby altering the work function characteristics.
Converter Output Characteristics
Figure 8.13.15 represents the output current-voltage characteristics for various modes of operation ofthe vacuum and vapor-Þlled thermionic converters. Characteristics obtained by not considering particleinteractions in the interelectrode gap are generally considered ideal output characteristics. The Þgureessentially displays three types of converter output current-voltage characteristics, an ideal characteristic,an ignited mode characteristic, and an unignited mode characteristic. For an ideal converter in theinterelectrode space the net output current density consists of the electron current density, JEMCO ßowingfrom emitter to collector diminished by the electron current density JCOEM ßowing from collector toemitter and the ion-current density ßowing from emitter to collector. Thus,
(8.13.40)
By expressing the individual terms as functions of f, T, and V,
(8.13.41)
J AT kTTsat = - -( )[ ]2 exp Y m
J AT kTsat = -( )[ ]2 exp F
Ä exp.
J ep m kT V kTg g g iiSat = ( ) + -( ){ }( )éëê
ùûú
2 1 20 5
p F
ÄJiEMCO
J J J Jinet EMCO COEM EMCO= - - Ä
J AT kT AT eV kT
J kT
net EM2
EM EM CO2
EM CO
EMS EM CO EM
= -( )[ ] - - -( )[ ]- - -( )[ ]
exp exp
Ä exp
F F
Y Y
© 1999 by CRC Press LLC

Energy Conversion 8-173
Similar relationships can be generated for various types of thermionic converters.
Thermodynamic Analysis
In thermodynamic terms a thermionic converter is a heat engine that receives heat at high temperature,rejects heat at a lower temperature, and produces useful electrical work while operating in a cycleanalogous to a simple vapor cycle engine. Based on the application of the Þrst law of thermodynamicsto the control volumes around the emitter (Houston, 1959; Angrist, 1976),
Energy In = Energy Out (8.13.42)
i.e.,
(8.13.43)
where, by using the terminology in Figure 8.13.14, each of the terms in Equation (8.13.43) can beelaborated as follows:
(a) Energy supplied by back emission of the collector:
(8.13.44)
(b) Energy supplied by joule heating of lead wires and plasma:
(8.13.45)
FIGURE 8.13.15 Thermionic diode output current density characteristics and nomenclature.
for EM COeV < -F F
q q q q q q qCB JH HS EC WB CD RA+ + = + + +
q J V kT eCB COEM CO CO= + + + ( )[ ]F d 2
q J J R RJH EMCO COEM LW PL= -[ ] +( )0 52
.
© 1999 by CRC Press LLC
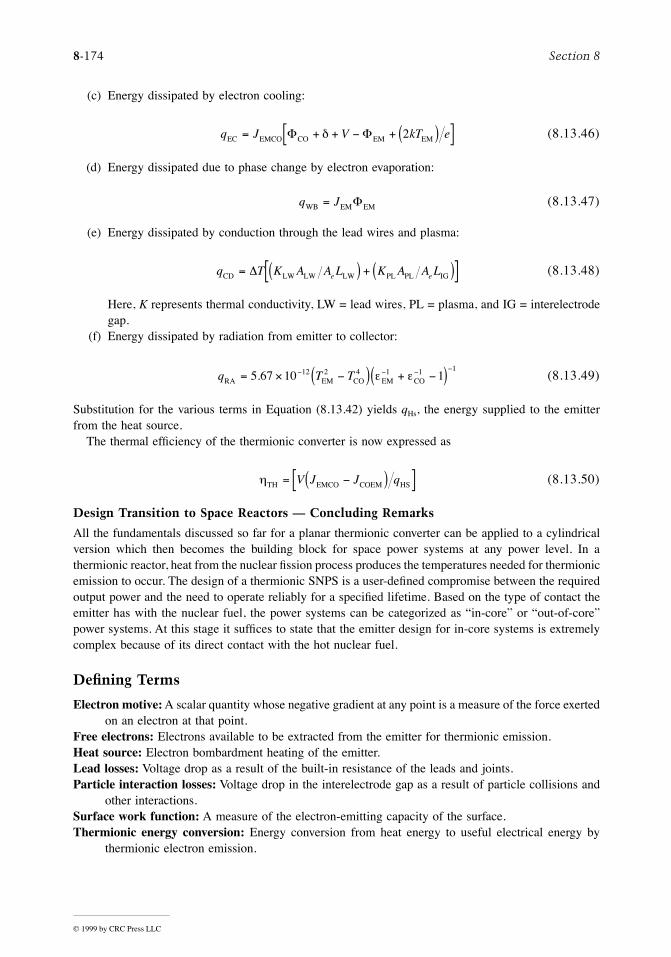
8-174 Section 8
(c) Energy dissipated by electron cooling:
(8.13.46)
(d) Energy dissipated due to phase change by electron evaporation:
(8.13.47)
(e) Energy dissipated by conduction through the lead wires and plasma:
(8.13.48)
Here, K represents thermal conductivity, LW = lead wires, PL = plasma, and IG = interelectrodegap.
(f) Energy dissipated by radiation from emitter to collector:
(8.13.49)
Substitution for the various terms in Equation (8.13.42) yields qHs, the energy supplied to the emitterfrom the heat source.
The thermal efÞciency of the thermionic converter is now expressed as
(8.13.50)
Design Transition to Space Reactors — Concluding Remarks
All the fundamentals discussed so far for a planar thermionic converter can be applied to a cylindricalversion which then becomes the building block for space power systems at any power level. In athermionic reactor, heat from the nuclear Þssion process produces the temperatures needed for thermionicemission to occur. The design of a thermionic SNPS is a user-deÞned compromise between the requiredoutput power and the need to operate reliably for a speciÞed lifetime. Based on the type of contact theemitter has with the nuclear fuel, the power systems can be categorized as Òin-coreÓ or Òout-of-coreÓpower systems. At this stage it sufÞces to state that the emitter design for in-core systems is extremelycomplex because of its direct contact with the hot nuclear fuel.
Defining Terms
Electron motive: A scalar quantity whose negative gradient at any point is a measure of the force exertedon an electron at that point.
Free electrons: Electrons available to be extracted from the emitter for thermionic emission.Heat source: Electron bombardment heating of the emitter.Lead losses: Voltage drop as a result of the built-in resistance of the leads and joints.Particle interaction losses: Voltage drop in the interelectrode gap as a result of particle collisions and
other interactions.Surface work function: A measure of the electron-emitting capacity of the surface.Thermionic energy conversion: Energy conversion from heat energy to useful electrical energy by
thermionic electron emission.
q J V kT eEC EMCO CO EM EM= + + - + ( )[ ]F Fd 2
q JWB EM EM= F
q T K A A L K A A Le eCD LW LW LW PL PL IG= ( ) + ( )[ ]D
q T TRA EM2
CO4
EM1
CO1= ´ -( ) + -( )- - - -
5 67 10 112 1. e e
hTH EMCO COEM HS= -( )[ ]V J J q
© 1999 by CRC Press LLC

Energy Conversion 8-175
References
Angrist, S.W. 1976. Direct Energy Conversion, 3rd ed., Allyn and Bacon, Boston.Fowler, R.H. 1955. Statistical Mechanics, 2nd ed., Cambridge University Press, New York.Hatsopoulos, G.N. and Gyftopoulos, E.P. 1973. Thermionic Energy Conversion, Vol. 1, MIT Press,
Cambridge, MA.Houston, J.M. 1959. Theoretical efÞciency of the thermionic energy converter, J. Appl. Phys.,
30:481Ð487.Langmuir, I. and Kingdon, K.H. 1925. Thermionic effects caused by vapors of alkali metals, Proc. R.
Soc. London, Ser. A, 107:61Ð79.Ramalingam, M.L. and Young, T.J. 1993. The power of thermionic energy conversion, Mech. Eng.,
115(9):78Ð83.Richardson, O.W. 1912. Some applications of the electron theory of matter, Philos. Mag., 23:594Ð627.Taylor, J.B. and Langmuir, I. 1933. The evaporation of atoms, ions and electrons from cesium Þlms on
tungsten, Phys. Rev., 44:423Ð458.Young, T.J., Thayer, K.L., and Ramalingam, M.L. 1993. Performance simulation of an advanced cylin-
drical thermionic fuel element with a graphite reservoir, presented at 28th AIAA ThermophysicsConference, Orlando, FL.
Further Information
Hatsopoulos, G.N. and Gryftopoulos, E.P. 1979. Thermionic Energy Conversion, Vol. 2, MIT Press,Cambridge, MA.
Cayless, M.A. 1961. Thermionic generation of electricity, Br. J. Appl. Phys., 12:433Ð442.Hernquist, K.G., Kanefsky, M., and Norman, F.H. 1959. Thermionic energy converter, RCA Rev.,
19:244Ð258.Rasor, N.S. 1960. Figure of merit for thermionic energy conversion, J. Appl. Phys., 31:163Ð167.Ramalingam, M.L. 1993. The Advanced Single Cell Thermionic Converter Program, WL-TR-93-2112,
USAF Technical Report, Dayton, OH.
Thermoelectric Power Conversion
Jean-Pierre Fleurial
Introduction
The advances in materials science and solid-state physics during the 1940s and 1950s resulted in intensivestudies of thermoelectric effects and related applications in the late 1950s and through the mid-1960s(Rowe and Bhandari, 1983). The development of semiconductors with good thermoelectric propertiesmade possible the fabrication of thermoelectric generators and refrigerators. Being solid-state devices,thermoelectric systems offer some unique advantages, such as high reliability, long life, small-size andno-vibrations refrigerators, and can be used in a wide temperature range, from 200 to 1300 K. However,because of their limited conversion efÞciencies, these devices have remained conÞned to specializedapplications. As the following sections will emphasize, the performance of those devices is closelyassociated with the magnitude of the dimensionless Þgure of merit, ZT, of the thermoelectric semicon-ductor.
ZT represents the relative magnitude of electrical and thermal cross-effect transport in materials. State-of-the-art thermoelectric materials, known since the early 1960s, have been extensively developed.Although signiÞcant improvements of the thermoelectric properties of these materials have beenachieved, a maximum ZT value close to 1 is the current approximate limit over the whole 100 to 1500K temperature range (Figure 8.13.16). To expand the use of thermoelectric devices to a wide range ofapplications will require improving ZT by a factor of two to three. There is no theoretical limitation on
© 1999 by CRC Press LLC

8-176 Section 8
the value of ZT, and new promising approaches are now focusing on the investigation of totally differentmaterials and the development of novel thin Þlm heterostructure.
Thermoelectric Effects
Thermoelectric devices are based on two transport phenomena: the Seebeck effect for power generationand the Peltier effect for electronic refrigeration. If a steady temperature gradient is applied along aconducting sample, the initially uniform charge carrier distribution is disturbed as the free carriers locatedat the high-temperature end diffuse to the low-temperature end. This results in the generation of a backemf which opposes any further diffusion current. The open-circuit voltage when no current ßows is theSeebeck voltage. When the junctions of a circuit formed from two dissimilar conductors (n- and p-typesemiconductors) connected electrically in series but thermally in parallel are maintained at differenttemperatures T1 and T2, the open-circuit voltage V developed is given by V = Spn(T1 Ð T2), where Spn isthe Seebeck coefÞcient expressed in mV á KÐ1.
The complementary Peltier effect arises when an electrical current I passes through the junction. Atemperature gradient is then established across the junctions and the corresponding rate of reversibleheat absorption is given by = PpnI, where Ppn is the Peltier coefÞcient expressed in W á AÐ1 orV. There is actually a third, less-important phenomenon, the Thomson effect, which is produced whenan electrical current passes along a single conducting sample over which a temperature gradient ismaintained. The rate of reversible heat absorption is given by = bI(T1 Ð T2), where b is the ThomsoncoefÞcient expressed in V á KÐ1. The three coefÞcients are related by the Kelvin relationships:
(8.13.51)
Thermoelectric Applications
The schematic of a thermoelectric device, or module, on Figure 8.13.17, illustrates the three differentmodes of operation: power generation, cooling, and heating. The thermoelectric module is a standardizeddevice consisting of several p- and n-type legs connected electrically in series and thermally in parallel,and bonded to a ceramic plate on each side (typically alumina). The modules are fabricated in a greatvariety of sizes, shapes, and number of thermoelectric couples and can operate in a wide range ofcurrents, voltages, powers, and efÞciencies. Complex, large-scale thermoelectric systems can be easilydesigned and built by assembling various numbers of these modules connected in series or in paralleldepending on the type of applications.
FIGURE 8.13.16 Typical temperature variations of ZT of state-of-the-art n-type thermoelectric alloys.
ÇQ ÇQ
ÇQ
ST
dS
dT Tpnpn pn p nand= =
-P b b
© 1999 by CRC Press LLC

Energy Conversion 8-177
Power Generation. When a temperature gradient is applied across the thermoelectric device, the heatabsorbed at the hot junction (Figure 8.13.17, hot side Th Ð T1 and cold side, Tc Ð T2) will generate acurrent through the circuit and deliver electrical power to the load resistance RL (Harman and Honig,1967). The conversion efÞciency h of a thermoelectric generator is determined by the ratio of theelectrical energy, supplied to the load resistance, to the thermal energy, absorbed at the hot junction, andis given by
(8.13.52)
where K is the thermal conductance in parallel and R is the electrical series resistance of one p-nthermoelectric couple. The electrical power PL generated can be written as
(8.13.53)
The thermoelectric generator can be designed to operate at maximum power output, by matching theload and couple resistances, RL = R. The corresponding conversion efÞciency is
(8.13.54)
where Zpn is the Þgure of merit of the p-n couple given by
(8.13.55)
The Þgure of merit can be optimized by adjusting the device geometry and minimizing the RK product.This results in Zpn becoming independent of the dimensions of the thermoelectric legs. Moreover, ifthe p- and n-type legs have similar transport properties, the Þgure of merit, Zpn = Z, can be directlyrelated to the Seebeck coefÞcient S, electrical conductivity s or resistivity r, and thermal conductivityl of the thermoelectric material:
(8.13.56)
FIGURE 8.13.17 Schematic of a thermoelectric module.
h =
pn
R I
S IT K T T RI
L
h h c
2
212
+ -( ) -
PS T T R
R RL
h c L
L
=-( )+( )
pn
2
2
hPh c
h c
T T
T T Z=
pn1
-
+ + -32
12
14
ZS
RKpnpn2
=
ZS S
= =2 2
rls
l
© 1999 by CRC Press LLC

8-178 Section 8
The maximum performance hmax of the generator is obtained by optimizing the load-to-couple-resistanceratio, leading to the maximum energy conversion efÞciency expressed as
(8.13.57)
It must be noted that the maximum efÞciency is thus the product of the Carnot efÞciency, less than unity,and of a material-related efÞciency, increasing with increasing Zpn values as illustrated in Figure 8.13.18.
Refrigeration. When a current source is used to deliver electrical power to a thermoelectric device, heatcan be pumped from T1 to T2 and the device thus operates as a refrigerator (Figure 8.13.17, hot side Th
= T2 and cold side, Tc = T1). As in the case of a thermoelectric generator the operation of a thermoelectriccooler depends solely upon the properties of the p-n thermocouple materials expressed in terms of theÞgure of merit Zpn and the two temperatures Tc and Th (Goldsmid, 1986). The conversion efÞciency orcoefÞcient of performance, COP, of a thermoelectric refrigerator is determined by the ratio of thecooling power pumped at the cold junction to the electrical power input from the current source and isgiven by
(8.13.58)
There are three different modes of operation which are of interest to thermoelectric coolers. Athermoelectric cooler be designed to operate at maximum cooling power, Qcmax, by optimizing the valueof the current:
(8.13.59)
FIGURE 8.13.18 Maximum conversion efÞciency hmax as a function of the average material Þgure of merit ZT,calculated using Equation (8.13.57) for two systems operating in different temperature ranges: the radioisotopegenerator (RTG) used for deep space missions and an automobile waste heat recovery generator.
hmax
pn av
pn av
=- + -
+ +
T T
T
Z T
Z TT
T
h c
h c
h
1 1
1
COPpn
pn
=- - -( )
-( ) +
S T I RI K T T
S T T I RI
c h c
h c
12
2
2
IS T
RQc
ST
RK T TQc
c ch cmax
pnmaxand= =
( )- -( )1
2
2
© 1999 by CRC Press LLC

Energy Conversion 8-179
Similarly, the conditions required for operating at maximum efÞciency, COPmax, across a constanttemperature gradient, are determined by differentiating Equation (8.13.58) with respect to I, with thesolution:
(8.13.60)
(8.13.61)
By reversing the input current to the device, the thermoelectric refrigerator can become a heat pump,with T1 being the hot junction temperature. The expression of the maximum conversion efÞciency ofthe heat pump is very similar to Equation (8.13.61) because of the following relationship:
(8.13.62)
The maximum COP expression in Equation (8.13.61) is similar to the one derived for the conversionefÞciency h of a thermoelectric generator in Equation (8.13.57). However, there is a major differencebetween the COPmax and hmax parameters. Clearly, hmax increases with increasing DT values but is limitedby the Carnot efÞciency (Equation 8.13.54) which is less than 1, while COPmax in Equation (8.13.52)increases with decreasing DT values and can reach values much larger than 1. Figure 8.13.19 representsthe variations of the COPmax of a thermoelectric cooling device optimized for working voltage andgeometry as a function of average ZT values and temperature differences (hot junction temperature at300 K). The average ZT value for current state-of-the-art commercially available materials (Bi2Te3-basedalloys) is about 0.8. For example, it can be seen that a COPmax of 4 is obtained for a (Th Ð Tc) differenceof 10 K, meaning that to pump 8 W of thermal power only 2 W of electrical power needs to be providedto the thermoelectric cooling device. This also means that 10 W of thermal power will be rejected atthe hot side of the cooler.
FIGURE 8.13.19 Maximum material coefÞcient of performance COPmax of a single-stage thermoelectric coolercalculated using Equation (8.13.61) as a function of the cold-side temperature (hot-side temperature of 300 K).Curves corresponding to various values of the average material Þgure of merit are displayed.
IK T T
S TZ T
h c cCOP
pn avpn avmax
=-( )
+ +( )1 1
COPmax
pn av
pn av
=-
+ -
+ +
T
T T
Z TT
T
Z Tc
h c
h
c
1
1 1
COP COPmax
heat pump
max
refrigerator( ) = + ( )1
© 1999 by CRC Press LLC

8-180 Section 8
The operation of a thermoelectric refrigerator at maximum cooling power necessitates a substantiallyhigher input current than the operation at maximum efÞciency. This is illustrated by calculating thevariations of the maximum COP and cooling power with the input current and temperature differencewhich have been plotted in Figures 8.13.20 and 8.13.21. The calculation was based on the properties ofa thermoelectric cooler using state-of-the-art Bi2Te3-based alloys, and the arbitrary units are the samefor both graphs. It can be seen that increases while decreases with increasing DT. Also, itis possible to operate at the same cooling power with two different current values.
Finally, the third problem of interest for thermoelectric coolers is to determine the maximum temper-ature difference, DTmax, that can be achieved across the device. As shown on Figure 8.13.21, by operatingat maximum cooling power and extrapolating Equation (8.13.59) to Qcmax = 0, DTmax is given by
FIGURE 8.13.20 Three-dimensional plot of the variations of the COP of a thermoelectric cooler as a function ofthe operating current and the temperature difference.
FIGURE 8.13.21 Three-dimensional plot of the variations of the cooling power of a thermoelectric cooler as afunction of the operating current and the temperature difference.
ICOPmaxIQcmax
© 1999 by CRC Press LLC

Energy Conversion 8-181
(8.13.63)
where Tc min corresponds to the lowest cold-side temperature achievable. If the cooler operates at a DTclose to DTmax or higher, it becomes necessary to consider a cascade arrangement with several stages.The COP of an n-stage thermoelectric cooler is optimized if the COP of each stage, COPi, is the same,which requires DTi /TiÐ1 to be the same for each stage. The overall maximum COP is then expressed as
(8.13.64)
Additional Considerations
When considering the operation of an actual thermoelectric device, several other important parametersmust be considered. The thermal and electrical contact resistances can substantially degrade the deviceperformance, in particular for short lengths of the thermoelectric legs. For example, the conversionefÞciency of a radioisotope generator system is about 20% lower than the value calculated in Figure8.13.18 for the thermoelectric materials only. The electrical contact resistance arises from the connection(see Figure 8.13.17) of all the legs in series. Typical values obtained for actual generators and coolersare 10 to 25 mW á cm2. The thermal contact resistance is generated by the heat-transfer characteristicsof the ceramic plates and contact layers used to build the thermoelectric module. The heat exchangersand corresponding heat losses should also be taken into account.
In addition, the transport properties of the thermoelectric materials vary with temperature, as illustratedin Figure 8.13.16. When a thermoelectric device is operating across a wide temperature range, thesevariations should be factored in the calculation of its performance.
Nomenclature
COP coefÞcient of performanceCOPmax maximum coefÞcient of performance
COPi coefÞcient of performance of the ith stage of a multistage thermoelectric coolerI current intensity
current intensity required to operate a thermoelectric cooler at maximum conversion efÞciencycurrent intensity required to operate a thermoelectric cooler at maximum cooling power
K thermal conductanceQ rate of reversible heat absorptionR electrical resistance
RL load resistancePL electrical power delivered to the load resistanceS Seebeck coefÞcient
Spn Seebeck coefÞcient of a p-n couple of thermoelementsT1 temperatureT2 temperatureTav average temperature across the thermoelectric deviceTc cold-side temperature of a thermoelectric device
Tc min minimum cold-side temperature which can be achieved by a thermoelectric coolerTh hot-side temperature of a thermoelectric deviceV voltage; open-circuit voltageZ thermoelectric Þgure of merit
DT Z T TZ T
Zc c
h
max pn
pn
pn
and= =+ -1
2
1 2 12
min
COP
COP
max =
+æ
èç
ö
ø÷ -
æ
èç
ö
ø÷
=Õ
1
11
11 ii
n
ICOPmax
IQcmax
© 1999 by CRC Press LLC

8-182 Section 8
Defining Terms
CoefÞcient of performance: Electrical to thermal energy conversion efÞciency of a thermoelectricrefrigerator, determined by the ratio of the cooling power pumped at the cold junction to theelectrical power input from the current source.
Dimensionless Þgure of merit: The performance of a thermoelectric device depends solely upon theproperties of the thermoelectric material, expressed in terms of the dimensionless Þgure of meritZT, and the hot-side and cold-side temperatures. ZT is calculated as the square of the SeebeckcoefÞcient times the absolute temperature divided by the product of the electrical resistivity to thethermal conductivity. The best ZT values are obtained in heavily doped semiconductors, such asBi2Te3 alloys, PbTe alloys, and Si-Ge alloys.
Stage: Multistage thermoelectric coolers are used to achieve larger temperature differences than possiblewith a single-stage cooler composed of only one module.
Thermoelectric leg: Single thermoelectric element made of n-type or p-type thermoelectric materialused in fabricating a thermoelectric couple, the building block of thermoelectric modules. Thegeometry of the leg (cross-section-to-length ratio) must be optimized to maximize the performanceof the device.
Thermoelectric module: Standardized device consisting of several p- and n-type legs connected elec-trically in series and thermally in parallel, and bonded to a ceramic plate on each. The modulesare fabricated in a great variety of sizes, shapes, and number of thermoelectric couples.
References
Goldsmid, H.J. 1986. Electronic Refrigeration, Pion Ltd., London.Hannan, T.C. and Honig, J.M. 1967. Thermoelectric and Thermomagnetic Effects and Applications,
McGraw-Hill, New York.Rowe, D.M and Bhandari, C.M. 1983. Modern Thermoelectrics, Reston Publishing, Reston, VA.
Further Information
The Proceedings of the Annual International Conference on Thermoelectrics are published annually bythe International Thermoelectric Society (ITS). These proceedings provide the latest information onthermoelectric materials research and development as well as thermoelectric devices and systems. TheITS also publishes a semiannual newsletter. For ITS membership or questions related to thermoelectrics,you may contact the current ITS secretary: Dr. Jean-Pierre Fleurial, Jet Propulsion Laboratory, MS 277-212, Pasadena, CA 91109. Phone (818)-354-4144. Fax (818) 393-6951. E-mail jean-pierre.ß[email protected].
Zpn thermoelectric Þgure of merit of a p-n couple of thermoelementsZT dimensionless thermoelectric Þgure of merit
b Thomson coefÞcientbp Thomson coefÞcient for the p-type thermoelementbn Thomson coefÞcient for the n-type thermoelement
DT temperature difference across a thermoelectric deviceDTmax maximum temperature difference which can be achieved across a thermoelectric cooler
h thermoelectric conversion efÞciencyhmax maximum thermoelectric conversion efÞciency
l thermal conductivityPpr Peltier coefÞcient
r electrical resistivity
© 1999 by CRC Press LLC
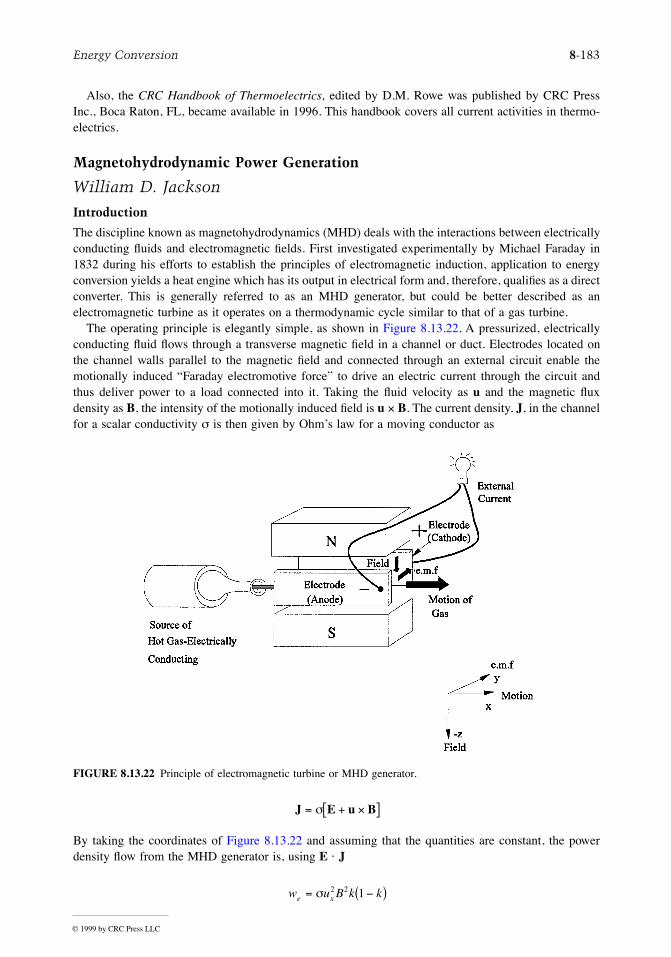
Energy Conversion 8-183
Also, the CRC Handbook of Thermoelectrics, edited by D.M. Rowe was published by CRC PressInc., Boca Raton, FL, became available in 1996. This handbook covers all current activities in thermo-electrics.
Magnetohydrodynamic Power Generation
William D. Jackson
Introduction
The discipline known as magnetohydrodynamics (MHD) deals with the interactions between electricallyconducting ßuids and electromagnetic Þelds. First investigated experimentally by Michael Faraday in1832 during his efforts to establish the principles of electromagnetic induction, application to energyconversion yields a heat engine which has its output in electrical form and, therefore, qualiÞes as a directconverter. This is generally referred to as an MHD generator, but could be better described as anelectromagnetic turbine as it operates on a thermodynamic cycle similar to that of a gas turbine.
The operating principle is elegantly simple, as shown in Figure 8.13.22. A pressurized, electricallyconducting ßuid ßows through a transverse magnetic Þeld in a channel or duct. Electrodes located onthe channel walls parallel to the magnetic Þeld and connected through an external circuit enable themotionally induced ÒFaraday electromotive forceÓ to drive an electric current through the circuit andthus deliver power to a load connected into it. Taking the ßuid velocity as u and the magnetic ßuxdensity as B, the intensity of the motionally induced Þeld is u ´ B. The current density, J, in the channelfor a scalar conductivity s is then given by OhmÕs law for a moving conductor as
By taking the coordinates of Figure 8.13.22 and assuming that the quantities are constant, the powerdensity ßow from the MHD generator is, using E á J
FIGURE 8.13.22 Principle of electromagnetic turbine or MHD generator.
J E u B= + ´[ ]s
w u B k ke x= -( )s 2 2 1
© 1999 by CRC Press LLC

8-184 Section 8
where k = Ez/u ´ B is the Òloading factorÓ relating loaded electric Þeld to open circuit induction and isused in the same manner as the regulation of an electrical machine is applied to its terminal voltage.
It is instructive at this point to determine the power density of an MHD generator using valuesrepresentative of the most commonly considered type of MHD generator. Combustion gas with s = 10S/m, a ßow velocity of 800 m/sec and an applied Þeld of 5 T for maximum power transfer (k = 0.5)yields we as 40 MW/m3. This value is sufÞciently attractive to qualify MHD generators for bulk powerapplications. An intensive, worldwide development effort to utilize this and other MHD generatorproperties has been conducted since the late 1950s. However, this has not yet led to any signiÞcantapplication of MHD generators. To understand how this has come about and what still needs to beaccomplished to make MHD attractive will now be summarized.
Electrical Conductivity Considerations
Two approaches have been followed to obtain adequate ionization and, therefore, conductivity in theworking ßuid. What may be termed the mainline approach to achieving electrical conductivity is to adda readily ionizable material to ÒseedÓ the working ßuid. Alkali metals with ionization potentials around4 V are obvious candidates, although a lower value would be highly desirable. A potassium salt with anionization potential of 4.09 eV has been widely used because of low cost but cesium with a 3.89-eVvalue is the preferred seed material when the running time is short or the working ßuid is recycled.There are two methods of ionization:
1. Thermal ionization in which recombination ensures a common temperature for electrons, ions,and neutrals; the mass action law (Saha equation) is followed; and the heat of ionization in electronvolts is the ionization potential; and
2. Extrathermal or nonequilibrium ionization where electrons and heavy particles are at differenttemperatures and the concept of entwined ßuids (electron, ion, and neutral gases) is involved.
The former is applicable to diatomic combustion gases while the latter occurs in monatomic (noble)gases but is also observed in hydrogen. Only a small amount of seed material is required and is typicallyaround 1% of the total mass ßow for maximum conductivity.
The existence of mutually perpendicular E and B Þelds in an MHD generator is of major signiÞcancein that the electrons are now subjected to the Hall effect. This causes electrons and, therefore, electriccurrents to ßow at an angle with respect to the E Þeld in the collision-dominated environment of theMHD generator. The presence of a signiÞcant Hall effect requires that the electrical boundary conditionson the channel be carefully selected and also introduces the possibility of working ßuid instabilitiesdriven by force ßuctuations of electrical origin. A further source of ßuctuations and consequent loss ofconductivity occurs when nonequilibrium ionization is employed due to current concentration by Jouleheating. This latter effect is controlled by operating only in a regime where, throughout the channel,complete ionization of the seed material is achieved.
Generator Configurations and Loading
The basic consequence of the Hall effect is to set up E Þelds in both transverse and axial directions inthe generator channel and these are generally referred to as the Faraday and Hall Þelds, respectively.The direction of the Faraday Þeld depends on the magnetic Þeld; the Hall Þeld depends on the Hallparameter and is always directed toward the upstream end of the channel. These considerations, in turn,lead to the MHD generator having the characteristics of a gyrator Ñ a two-terminal pair power-producingdevice in which one terminal pair (Faraday) is a voltage source and the other (Hall) is a current sourcedependent in this case on the Hall parameter. Electric power can be extracted from either the Faradayor Hall terminals, or both.
This has resulted in several electrical boundary conditions being utilized with the axial ßow channelas shown in Figure 8.13.23. These are most readily understood by treating each anode-cathode pair asa generating cell. The segmented Faraday conÞguration (Figure 8.13.23a) is then simply a paralleloperation of cells which leads to the apparently inconvenient requirement of separate loading of individual
© 1999 by CRC Press LLC

Energy Conversion 8-185
cells: the Hall connection (Figure 8.13.23b) utilizes a single load by series connection but depends onthe Hall parameter for its performance; and the diagonal connection (Figure 8.13.23c) connects the cellsin series-parallel and so avoids Hall parameter dependence while retaining the single load feature. Inall three linear conÞgurations, the channel walls are electrically segmented to support the Hall Þeld, andexperience has shown that this must be sufÞciently Þnely graded so that no more than 50 V is supportedby the interelectrode gaps to avoid electrical breakdown.
The MHD generator is a linear version of the homopolar machine originally demonstrated by Faradayand is, as a practical matter, conÞned to DC generation. Accordingly, some form of DC-AC conversionusing power electronics is required for the vast majority of applications. The single load feature losessigniÞcance in this situation as the Òpower conditioningÓ can readily be arranged to combine (consolidate)the individual cell outputs before conversion to the required AC system conditions. Indeed, to maximizepower extraction while limiting interelectrode voltages and controlling electrode currents (to ensureadequate lifetime), the power conditioning is arranged to extract power from both Faraday and Hallterminal pairs.
An alternative geometry is to set up a radial ßow (usually but not necessarily outward) with the diskconÞguration of Figure 8.13.23d. The result is a Hall generator, which is generally favored for nonequi-librium ionization as it avoids the inevitable nonuniformities associated with electrode segmentationwith their proclivity for promoting ionization instabilities. A measure of Faraday performance is achiev-able through the introduction of swirl, and additional ring electrodes enable power conditioning to control(and optimize) the radial electric Þeld.
Components
An MHD generator per se requires several components to make up a complete powertrain. In additionto the power conditioning needed for DC-AC conversion these include a magnet, seed injector, combustorwith fuel and oxidizer supply or an input heat exchanger, nozzle, compressor, diffuser, exhaust gas-cleaning system (for once-through systems), and controls. The need to accommodate a channel betweenthe poles of a magnet qualiÞes the MHD generator as a large-air-gap machine.
FIGURE 8.13.23 Basic Faraday linear MHD generator.
© 1999 by CRC Press LLC

8-186 Section 8
Systems
Power systems incorporating MHD generators are either of the once-through (open-cycle) or workingßuid recycle (closed-cycle) type, and the complete MHD system described in the previous section caneither be stand-alone or incorporated into a more complex conÞguration such as a binary cycle. In thelatter case, the high-temperature operation of the MHD unit makes it a topping cycle candidate and itis in this mode that MHD has received most system consideration. An MHD generator operated directlyon ionized combustion gas is usually associated with an open cycle while nonequilibrium ionizationwith seeded noble gases and LMMHD are invariably considered for closed-cycle operation. An exceptionis nonequilibrium ionization in cesium-seeded hydrogen which has received some attention for open-cycle operation.
Heat Sources, Applications, and Environmental Considerations
A heat source capable of providing from 1000 K for LMMHD to over 3000 K for open-cycle systemsfor power production is a candidate. Rocket motor fuels, all fossil fuels, high-temperature nuclear reactorscooled with hydrogen and biomass are suitable for open cycles, while closed cycles can be driven througha heat exchanger by any of these combustion sources. A high-temperature nuclear reactor, probablyhelium cooled, is also a feasible source for MHD and in the early stages of development of the processreceived much attention. With the abandonment of efforts to develop commercial reactors to operate attemperatures above 1200 K, attention has focused on high-energy fuels for pulse power (few seconds)operation and coal for utility power generation.
While the debate over the role of fossil energy in the long-term electricity generation scenariocontinues, it is established that coal is a major resource which must be utilized at maximim efÞciencyto limit CO2 production and must be combusted in a manner which reduces SO2 and NOx efßuents toacceptable levels. The use of MHD generators signiÞcantly advances all of these objectives. Brießy, itwas Þrst observed that the Òelectromagnetic turbineÓ has the major advantage that it cannot only providethe highest efÞciency of any known converter from the Carnot viewpoint but that its operation is notadversely affected by coal slag and ash. Indeed, slag provides an excellent renewable coating for thechannel walls and increases lifetime.
System calculations have shown that, when coupled as a topping cycle to the best available steamplant technology, a thermal efÞciency with coal and full environmental control is 52.5%. When coupledinto a ternary cycle with either a gas turbine or fuel cells and a steam turbine, efÞciencies upward of60% are possible.
Technology Status
A pulse-type MHD generator was successfully built and operated by Avco (now Textron DefenseIndustries) in 1963 and a complete natural gas-Þred pilot plant with a nominal 20-MW MHD generatorwas commissioned in the U.S.S.R. on the northern outskirts of Moscow in 1971. In the decade of the1980s, development was focused on coal Þring as a result of the oil crises of the 1970s and in the U.S.progressed to the point where the technology base was developed for a demonstration plant with a 15-MW MHD generator.
Future Prospects
The two particular attributes of the MHD generator are its rapid start-up to multimegawatt power levelsfor pulse power applications and its ability to provide a very high overall thermal efÞciency for powerplants using coal while meeting the most stringent environmental standards. The Þrst has already beenutilized in crustal exploration, and the second must surely be utilized when coal is the fuel of choicefor electric power production. In the meantime, MHD has been established as a viable technology onwhich further development work will be conducted for advanced applications such as the conversionsystem for thermonuclear fusion reactors.
© 1999 by CRC Press LLC

Energy Conversion 8-187
Further Information
The following proceedings series contain a full and complete record of MHD generator and powersystem development:
1. Proceedings of the Symposia for the Engineering Aspects of Magnetohydrodynamics, held annu-ally in the U.S. since 1960 (except for 1971 and 1980).
2. Proceedings of 11 International Conferences on Magnetohydrodynamic Electrical Power Gener-ation, held in 1962, 1964, 1966, 1968, 1971 , 1975, 1980, 1983, 1986, 1989, and 1992. The 12thconference will be held in Yokahama, Japan in October 1996.
© 1999 by CRC Press LLC

8-188 Section 8
8.14 Ocean Energy Technology
Desikan Bharathan and Federica Zangrando
The ocean contains a vast renewable energy potential in its waves and tides, in the temperature differencebetween cold, deep waters and warm surface waters, and in the salinity differences at river mouths(SERI, 1990; WEC, 1993; Cavanagh et al., 1993). Waves offer a power source for which numeroussystems have been conceived. Tides are a result of the gravity of the sun, the moon, and the rotation ofthe Earth working together. The ocean also acts as a gigantic solar collector, capturing the energy of thesun in its surface water as heat. The temperature difference between warm surface waters and cold waterfrom the ocean depths provides a potential source of energy. Other sources of ocean energy includeocean currents, salinity gradients, and ocean-grown biomass.
The following sections brießy describe the status and potential of the various ocean energy technol-ogies, with emphasis placed on those with a near-term applicability.
Ocean Thermal Energy Conversion
Ocean thermal energy conversion (OTEC) technology is based on the principle that energy can beextracted from two reservoirs at different temperatures (SERI, 1989). A temperature difference as littleas 20°C can be exploited effectively to produce usable energy. Temperature differences of this magnitudeprevail between ocean waters at the surface and at depths up to 1000 m in many areas of the world,particularly in tropical and subtropical latitudes between 24° north and south of the equator. Here, surfacewater temperatures typically range from 22 to 29°C, while temperatures at a depth of 1000 m rangefrom 4 to 6°C. This constitutes a vast, renewable resource, estimated at 1013 W, for potential baseloadpower generation.
Recent research has been concentrated on two OTEC power cycles, namely, closed-cycle and open-cycle, for converting this thermal energy to electrical energy (Avery and Wu, 1994). Both cycles havebeen demonstrated, but no commercial system is yet in operation. In a closed-cycle system, warmseawater is used to vaporize a working ßuid such as ammonia ßowing through a heat exchanger(evaporator). The vapor expands at moderate pressures and turns a turbine. The vapor is condensed inanother heat exchanger (condenser) using cold seawater pumped from the ocean depths through a cold-water pipe. The condensed working ßuid is pumped back to the evaporator to repeat the cycle. Theworking ßuid remains in a closed system and is continuously circulated. In an opencycle system, the warm seawater is ÒßashÓ evaporated in a vacuum chamber to make steam at an absolutepressure of about 2.4 kPa. The steam expands through a low-pressure turbine coupled to a generator toproduce electricity. The steam exiting the turbine is condensed by using cold seawater pumped from theocean depths through a cold-water pipe. If a surface condenser is used, condensed steam providesdesalinated water.
Efßuent from either a closed cycle or an open cycle system can be further processed to enhanceproduction of desalinated water through a ßash evaporator/condenser system in a second stage.
For combined production of power and water, these systems are estimated to be competitive withconventional systems in several coastal markets.
Tidal Power
The energy from tides is derived from the kinetic energy of water moving from a higher to a lowerelevation, as for hydroelectric plants. High tide can provide the potential energy for seawater to ßowinto an enclosed basin or estuary that is then discharged at low tide (Ryan, 1980). Electricity is producedfrom the gravity-driven inßow or outßow (or both) through a turbogenerator. The tidal resource is variablebut quite predictable, and there are no signiÞcant technical barriers for deployment of this technology.Because costs are strongly driven by the civil works required to dam the reservoir, only a few sitesaround the world have the proper conditions of tides and landscape to lend themselves to this technology.
© 1999 by CRC Press LLC

Energy Conversion 8-189
Although it has beneÞted from some recent developments in marine and offshore construction thatsigniÞcantly reduce construction time and costs, the economics of tidal power production still does notmake it competitive with conventional energy systems.
The highest tides in the world can reach above 17 m, as in the Bay of Fundy between Maine andNova Scotia, where it is projected that up to 10,000 MW could be produced by tidal systems in this bayalone. A minimum tidal range (difference between mean high and low tides) of 5 m is required for plantsusing conventional hydroelectric equipment (horizontal axial-ßow water turbines housed in underwaterbulbs or Straßo turbines). More recently, low-head hydroelectric power equipment has proved adaptableto tidal power and new systems for 2-m heads have been proposed.
There are a few tidal power stations operating in France, the former U.S.S.R., China, and Canada.The largest and longest-operating plant is the 240-MW tidal power station on the Rance River estuaryin northern France (Banal and Bichon, 1981), which has operated with 95% availability since 1968. The400-kW tidal plant in Kislaya Bay on the Barents Sea in the former U.S.S.R. has been operating since1968; at this favorable site only a 50-m-wide dam was needed to close the reservoir. The 20-MWCanadian plant at Annapolis on the Bay of Fundy uses a Straßo turbine generator and has operatedreliably since 1984. A number of small-bulb and Straßo turbine generator plants of up to 4 MW are alsoinstalled on the China coastline.
Wave Power
Waves contain signiÞcant power which can be harnessed by shore-mounted or offshore systems, thelatter having larger incident power on the device but requiring more costly installations. A myriad ofwave-energy converter concepts have been devised, transforming wave energy into other forms ofmechanical (rotative, oscillating, or relative motion), potential, or pneumatic energy, and ultimately intoelectricity; very few have been tested at sea.
The power per unit frontal length of the wave is proportional to wave height squared and to waveperiod, with their representative values on the order of 2 m and 10 sec. The strong dependence on waveheight makes the resource quite variable, even on a seasonal and a yearly average basis. The northeasternPaciÞc and Atlantic coasts have average yearly incident wave power of about 50 kW/m, while near thetip of South America the average power can reach 100 kW/m. Japan, on the other hand, receives anaverage of 15 kW/m. Waves during storms can reach 200 kW/m, but these large waves are unsafe foroperation because of their severity, and they impose signiÞcant constraints and additional costs on thesystem. Overall, the amount of power that could be harvested from waves breaking against worldcoastlines is estimated to be on the order of the current global consumption of energy. However, totalinstalled capacity amounts to less than 1 MW worldwide.
A commonly deployed device is the oscillating water column (OWC), which has so far been mountedon shore but is also proposed for ßoating plants. It consists of an air chamber in contact with the seaso that the water column in the chamber oscillates with the waves. This motion compresses the air inthe chamber, which ßows in and out of a Wells turbine. This turbine can be self-rectifying, i.e., it usesthe airßow in both directions, and it consists of a simple rotor, with symmetrical airfoil blades attachedtangentially to a central disk. Inertial energy storage (ßywheels) is often used to even out the variablepneumatic energy delivered by the air.
Two of the largest wave-energy power plants were built at Toftestallen, near Bergen, Norway. ANorwegian company, Norwave A.S., built a 350-kW tapered channel (Tapchan) device in 1984, whichsurvived a severe storm in 1989 (the 500 kW multi-resonant OWC plant built by Kvaerner Brug A.S.did not). The channel takes advantage of the rocky coastline to funnel waves through a 60-m-wideopening into a coastal reservoir of 5500 m2, while maintaining civil engineering costs to a minimum.Wave height increases as the channel narrows over its 60-m length, and the rising waves spill over the3-m-high channel walls, Þlling the reservoir. Continuous wave action maintains the reservoir level at arelatively constant elevation above sea level, providing potential energy for a low-head hydroelectricKaplan turbogenerator. Estimates by Norwave to rebuild an identical plant at this site suggested capital
© 1999 by CRC Press LLC

8-190 Section 8
costs of $3500/kW installed, and energy costs of 8¢/kWhr, at a plant capacity factor of 25% (ASCE,1992). In recent efforts, the National Institute of Ocean Technology has installed a 150-kW wave-energyconversion device in the southern tip of India.
Concluding Remarks
Among the many ocean energy prospects, OTEC, tides, and tapered channel wave-energy convertersoffer the most near-term potential and possess applicability for a large variety of sites. To realize theirpotential, additional research and development is required.
Defining Terms
Ocean thermal energy conversion (OTEC): A system that utilizes the temperature difference betweenthe seawater at the surface and at depths.
Closed-cycle OTEC: Uses a working ßuid in a closed cycle.Open-cycle OTEC: Uses steam ßashed from the warm seawater as the working ßuid which is condensed
and exhausted.
References
ASCE, 1992, Ocean Energy Recovery, The State of the Art, R.J. Seymour, Ed., American Society ofCivil Engineers, New York.
Avery, W.H. and Wu, C. 1994, Renewable Energy from the Ocean, a Guide to OTEC, Oxford UniversityPress, New York.
Banal, M. and Bichon, A. 1981. Tidal Energy in France: The Rance Estuary Tidal Power Station ÑSome Results after 15 Years of Operation, Paper K3, Second Symposium on Wave and TidalEnergy, Cambridge, England, September.
Cavanagh, J.E., Clarke, J.H., and Price, R. Ocean energy systems, in Renewable Energy, Sources forFuels and Electricity, T.B. Johansson, H. Kelley, A.K.N. Reddy, and R.H. Williams (Eds.), IslandPress, Washington, D.C., 1993, chap 12.
Ryan, P.R. 1979/80. Harnessing power from tides: state of the art, Oceanus, 22(4), 64Ð67.SERI, 1989. Ocean Thermal Energy Conversion: An Overview, Solar Energy Research Institute,
SERI/SP-220-3024, Golden, CO. SERI, 1990. The Potential of Renewable Energy: An Interlaboratory White Paper, Solar Energy Research
Institute, SERI/TP-260-3674, Golden, CO.WEC, 1993. Renewable Energy Resources Ñ Opportunities and Constraints 1990Ð2020, World Energy
Council, London, England.
Further Information
CEC, 1992 Energy Technology Status Report, California Energy Commission, Sacramento, CA, 1992.Funakoshi, H., Ohno, M., Takahashi, S., and Oikawa, K. Present situation of wave energy conversion
systems, Civil Eng. Jpn., 32, 108Ð134, 1993.
© 1999 by CRC Press LLC
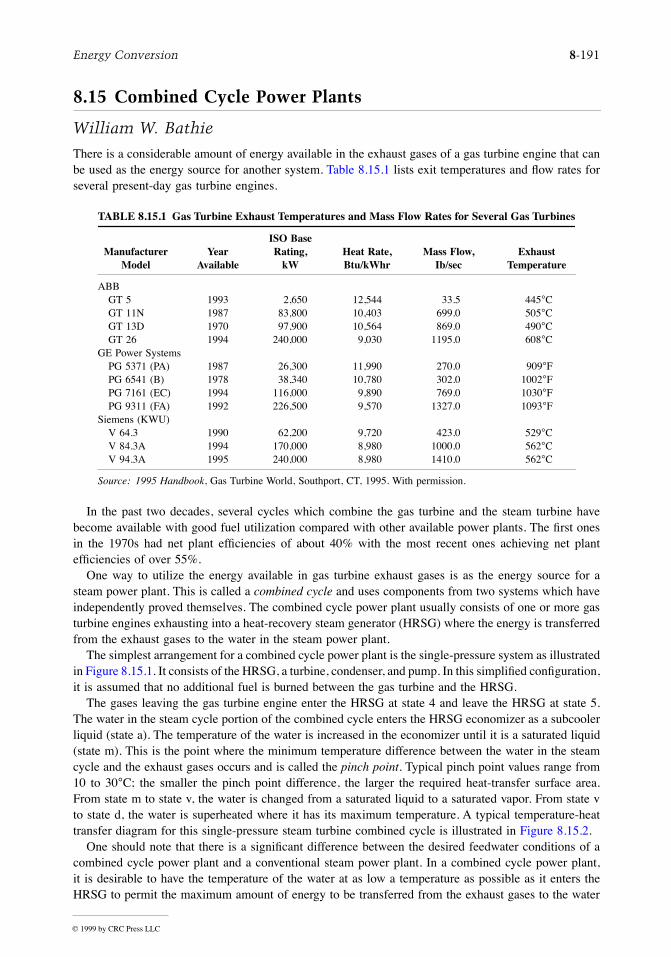
Energy Conversion 8-191
8.15 Combined Cycle Power Plants
William W. Bathie
There is a considerable amount of energy available in the exhaust gases of a gas turbine engine that canbe used as the energy source for another system. Table 8.15.1 lists exit temperatures and ßow rates forseveral present-day gas turbine engines.
In the past two decades, several cycles which combine the gas turbine and the steam turbine havebecome available with good fuel utilization compared with other available power plants. The Þrst onesin the 1970s had net plant efÞciencies of about 40% with the most recent ones achieving net plantefÞciencies of over 55%.
One way to utilize the energy available in gas turbine exhaust gases is as the energy source for asteam power plant. This is called a combined cycle and uses components from two systems which haveindependently proved themselves. The combined cycle power plant usually consists of one or more gasturbine engines exhausting into a heat-recovery steam generator (HRSG) where the energy is transferredfrom the exhaust gases to the water in the steam power plant.
The simplest arrangement for a combined cycle power plant is the single-pressure system as illustratedin Figure 8.15.1. It consists of the HRSG, a turbine, condenser, and pump. In this simpliÞed conÞguration,it is assumed that no additional fuel is burned between the gas turbine and the HRSG.
The gases leaving the gas turbine engine enter the HRSG at state 4 and leave the HRSG at state 5.The water in the steam cycle portion of the combined cycle enters the HRSG economizer as a subcoolerliquid (state a). The temperature of the water is increased in the economizer until it is a saturated liquid(state m). This is the point where the minimum temperature difference between the water in the steamcycle and the exhaust gases occurs and is called the pinch point. Typical pinch point values range from10 to 30°C; the smaller the pinch point difference, the larger the required heat-transfer surface area.From state m to state v, the water is changed from a saturated liquid to a saturated vapor. From state vto state d, the water is superheated where it has its maximum temperature. A typical temperature-heattransfer diagram for this single-pressure steam turbine combined cycle is illustrated in Figure 8.15.2.
One should note that there is a signiÞcant difference between the desired feedwater conditions of acombined cycle power plant and a conventional steam power plant. In a combined cycle power plant,it is desirable to have the temperature of the water at as low a temperature as possible as it enters theHRSG to permit the maximum amount of energy to be transferred from the exhaust gases to the water
TABLE 8.15.1 Gas Turbine Exhaust Temperatures and Mass Flow Rates for Several Gas Turbines
ManufacturerModel
Year Available
ISO BaseRating,
kWHeat Rate,Btu/kWhr
Mass Flow,Ib/sec
Exhaust Temperature
ABBGT 5 1993 2,650 12,544 33.5 445°CGT 11N 1987 83,800 10,403 699.0 505°CGT 13D 1970 97,900 10,564 869.0 490°CGT 26 1994 240,000 9,030 1195.0 608°C
GE Power SystemsPG 5371 (PA) 1987 26,300 11,990 270.0 909°FPG 6541 (B) 1978 38,340 10,780 302.0 1002°FPG 7161 (EC) 1994 116,000 9,890 769.0 1030°FPG 9311 (FA) 1992 226,500 9,570 1327.0 1093°F
Siemens (KWU)V 64.3 1990 62,200 9,720 423.0 529°CV 84.3A 1994 170,000 8,980 1000.0 562°CV 94.3A 1995 240,000 8,980 1410.0 562°C
Source: 1995 Handbook, Gas Turbine World, Southport, CT, 1995. With permission.
© 1999 by CRC Press LLC
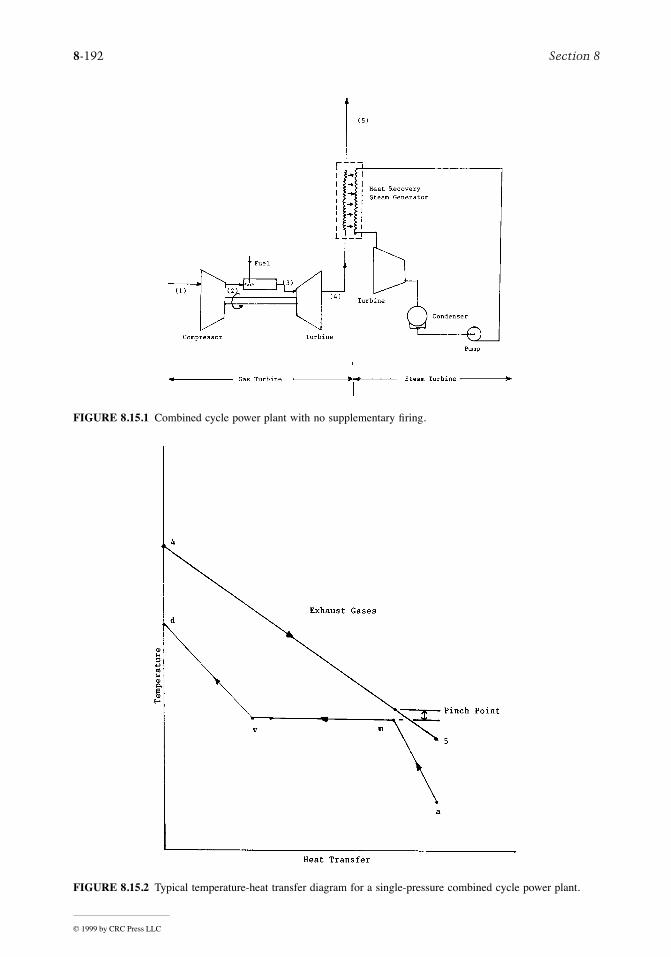
8-192 Section 8
FIGURE 8.15.1 Combined cycle power plant with no supplementary Þring.
FIGURE 8.15.2 Typical temperature-heat transfer diagram for a single-pressure combined cycle power plant.
© 1999 by CRC Press LLC

Energy Conversion 8-193
since the more energy transferred, the greater the amount of power produced by the steam turbine andthe higher the combined cycle thermal efÞciency or the lower the heat rate. In a conventional steamcycle power plant, the higher the feedwater temperature as it enters the steam generator (boiler), thehigher the cycle thermal efÞciency. Conventional steam cycle power plants achieve the higher feedwatertemperature by the use of feedwater heaters.
Table 8.15.2 lists net plant output, heat rate, and net plant efÞciency values for several combinedcycles. One should observe for the units listed in Table 8.15.2 that
1. The size varies widely from a low of 22,800 kW to a high of 711,000 kW;2. The heat rates vary from 7880 to 5885 Btu/kWhr. These compare with heat rate values for the
gas turbines listed in Table 8.15.1 that vary from a high of 12,544 Btu/kWhr to a low of 8980Btu/kWhr.
3. The net plant efÞciency varies from a low of 42.8% to a high of 57.0%;4. The fraction of the total net plant output from the steam turbine power plant in most cases ranges
from 35 to 39%.
One should keep in mind that only a few of the combined cycle plants currently available are listed inTable 8.15.2. The ones listed are intended to illustrate the range in net plant output and heat rate valuesand should not be interpreted as a list of all units currently available.
The amount of energy transferred in the HRSG is dependent on the steam pressure. This is illustratedin Figure 8.15.3. In this comparison, it is assumed in both cases that the steam exit temperature is thesame and that the exhaust gas HRSG inlet temperature and ßow rate are the same. One observes thatthe pressure of the water dictates the temperature at which evaporation occurs. The higher the evaporationtemperature (and therefore steam pressure), the lower the mass ßow rate of the steam, and therefore thelower the power generated by the steam power plant. It is obvious that the lower the steam pressure,the lower the ßue gas temperature.
The output of an unÞred single-pressure combined cycle power plant is determined by the gas turbineselected since this Þxes the temperature and mass ßow rate of the exhaust gases. One way to increasethe steam cycle output is to introduce supplementary Þring in the exhaust duct between the gas turbineexit and HRSG inlet. This is shown schematically in Figure 8.15.4. The advantages of adding supple-mentary Þring are
TABLE 8.15.2 Net Plant Output, Heat Rate, and Net Plant EfÞciency for Several Combined Cycles
ManufacturerModel
Net Plant Output, kW
Heat Rate,Btu/kWhr
Net Plant EfÞciency, %
Steam TurbinePower, kW
ABBKA 35-1 22,800 7,880 42.8 6,200KA 8C-4 314,400 6,560 51.2 109,700KA 11N-4 506,300 6,755 49.8 185,400KA 24-2 501,800 5,885 57.0 182,800
GE Power Systems (60 Hz)S106B 59,200 7,020 48.6 22,600S406B 240,000 6,930 49.3 93,600S206FA 219,300 6,380 53.4 85,620S207EC 357,700 6,415 53.2 134,400S207FA 509,600 6,170 55.3 188,400
Siemens (KWU)GUD 3.64.3 275,000 6,550 52.1 98,000GUD 3.84.2 486,000 6,560 52.0 186,000GUD 3.94.2 711,000 6,525 52.3 269,000GUD 2.84.3A 499,000 6,330 56.9 176,000
Source: 1995 Handbook, Gas Turbine World, Southport, CT, 1995. With permission.
© 1999 by CRC Press LLC
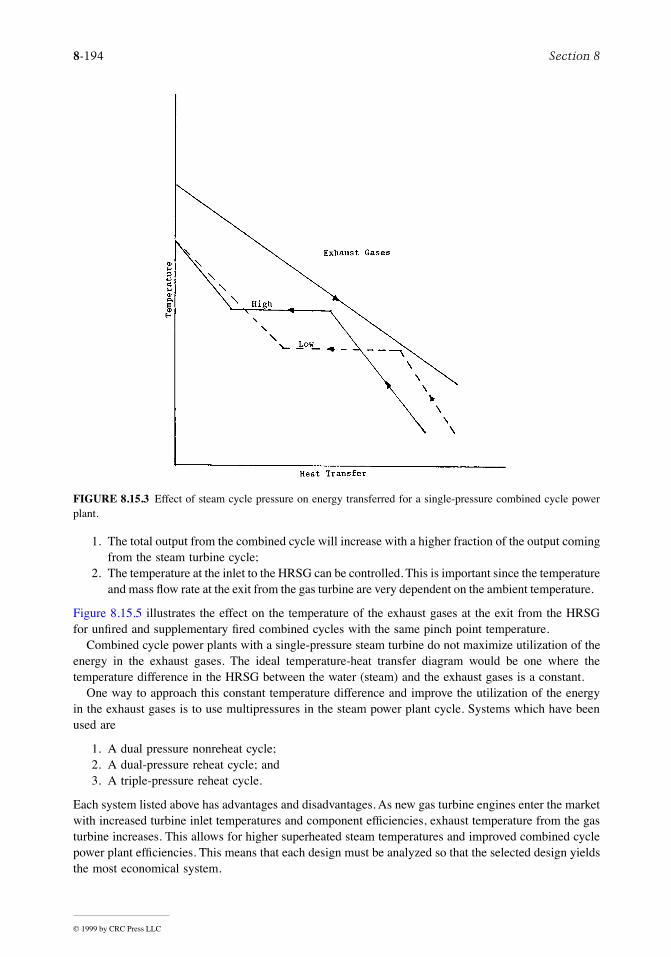
8-194 Section 8
1. The total output from the combined cycle will increase with a higher fraction of the output comingfrom the steam turbine cycle;
2. The temperature at the inlet to the HRSG can be controlled. This is important since the temperatureand mass ßow rate at the exit from the gas turbine are very dependent on the ambient temperature.
Figure 8.15.5 illustrates the effect on the temperature of the exhaust gases at the exit from the HRSGfor unÞred and supplementary Þred combined cycles with the same pinch point temperature.
Combined cycle power plants with a single-pressure steam turbine do not maximize utilization of theenergy in the exhaust gases. The ideal temperature-heat transfer diagram would be one where thetemperature difference in the HRSG between the water (steam) and the exhaust gases is a constant.
One way to approach this constant temperature difference and improve the utilization of the energyin the exhaust gases is to use multipressures in the steam power plant cycle. Systems which have beenused are
1. A dual pressure nonreheat cycle;2. A dual-pressure reheat cycle; and3. A triple-pressure reheat cycle.
Each system listed above has advantages and disadvantages. As new gas turbine engines enter the marketwith increased turbine inlet temperatures and component efÞciencies, exhaust temperature from the gasturbine increases. This allows for higher superheated steam temperatures and improved combined cyclepower plant efÞciencies. This means that each design must be analyzed so that the selected design yieldsthe most economical system.
FIGURE 8.15.3 Effect of steam cycle pressure on energy transferred for a single-pressure combined cycle powerplant.
© 1999 by CRC Press LLC

Energy Conversion 8-195
FIGURE 8.15.4 Combined cycle power plant with supplementary Þring.
FIGURE 8.15.5 Effect of supplementary Þring on exit temperature for same pinch point temperature difference.(a) No supplementary Þring; (b), (c) supplementary Þring.
© 1999 by CRC Press LLC

8-196 Section 8
A simpliÞed schematic diagram for a three-pressure combined cycle power plant is shown in Figure8.15.6. This arrangement results in a high quality at the exit from the low-pressure steam turbine.
Reference
1995 Handbook, Gas Turbine World, Southport, CT, 1995.
Further Information
Bonzani, G. et al., Technical and economic optimization of a 450 MW combined cycle plant, in 1991ASME Cogen-Turbo, 5th International Symposium and Exposition on Gas Turbines in Cogener-ation, Repowering and Peak-Load Power Generation, van der Linden, S. et al., Eds., pp. 131Ð143,ASME, New York, 1991.
Dechamps, P.J. et al., Advanced combined cycle alternatives with advanced gas turbines, in ASME Cogen-Turbo Power Õ93, 7th Congress and Exposition on Gas Turbines in Cogeneration and Utility,Holland, H.W. et al., Eds., pp. 387Ð396, ASME, New York, 1993.
Gyarmathy, G. and Ortmann, P., The off design of single- and dual-pressure steam cycles in CC plants,in 1991 ASME Cogen-Turbo, 5th International Symposium and Exposition on Gas Turbines inCogeneration, Repowering and Peak-Load Power Generation, van der Linden, S. et al., Eds., pp.271Ð280, ASME, New York, 1991.
Horlock, J.H., Combined Power Plants Including Combined Cycle Gas Turbine (CCGT) Plants, Perga-mon Press, New York, 1992.
Kehlhofer, W., Combined-Cycle Gas & Steam Turbine Power Plants, Fairmont Press, Englewood Cliffs,NJ, 1991.
Maurer, R., DestecÕs successes and plans for coal gasiÞcation combined cycle (CGCVC) power systems,in 1992 ASME Cogen-Turbo, 6th International Conference in Cogeneration and Utility, Cooke,D.H. et al., Eds., pp. 75Ð85, ASME, New York, 1992.
FIGURE 8.15.6 Schematic diagram for a three-pressure steam turbine combined cycle with superheating and reheat.
© 1999 by CRC Press LLC

Energy Conversion 8-197
8.16 EMERGY Evaluation and Transformity
Howard T. Odum
EMERGY (spelled with an ÒmÓ) evaluation is a method of energy analysis that puts all inputs andproducts on a common basis of what was previously required directly and indirectly to make each fromone form of energy.
EMERGY is the available energy of one kind previously used up directly and indirectly to make aservice or product.
Its unit is the emjoule, deÞned to measure availability already used up. If average solar insolation atthe earthÕs surface is chosen as the common base for the convenience of evaluating environmental andtechnological energy ßows, then evaluations are made in units of solar emjoules, abbreviated sej.
In every energy transformation, available energy is used up to produce a smaller amount of energyof another kind. The EMERGY of one kind required directly and indirectly to make one unit of energyof another kind is deÞned as transformity (Odum, 1988).
Solar transformity is the solar EMERGY of the inputs divided by the energy of the output.
energy (J) ´ transformity (sej/J) = EMERGY (sej)
If all energy ßows are expressed in solar EMERGY, then all kinds of energy may be comparedaccording to their solar transformity. The more successive energy transformations there are, the higherthe transformity. The higher the transformity, the more energy ßows have converged in the process.Since many energy ßows of one kind are usually required to support a smaller energy ßow of anothertype, it is appropriate to describe the converging process as an energy hierarchy. The more transformationsthere are, the higher the transformity and the higher the position in a universal energy hierarchy. Figure8.16.1 shows an environmental food chain with more energy ßow but lower quality units (lowertransformity) on the left and small total energy ßow through high transformity units on the right. A landexample is sunlight-grass-sheep-people. An aquatic series is sunlight-phytoplankton-zooplankton-smallÞsh-large Þsh.
In environment, engineering, and economics the selective process of self organization generates higherquality energy capable of amplifying other processes. Thus observed transformitites are a measure ofenergy quality. Tables of solar transformity have been prepared based on previous EMERGY analysis(Odum, 1996). See sample in Table 8.16.1
Empower is the EMERGY used per unit time, for the United States about 8.5 E24 solar emjoules peryear, a measure of the nationÕs processing of real wealth. By dividing the gross economic product ($6.5trillion per year) the EMERGY/money ratio results (1.3 trillion solar emjoules per dollar). This is realwealth buying power of a dollar.
After an EMERGY evaluation is made, the solar EMERGY of each item can be divided by theEMERGY/money ratio to determine the emdollars, the buying power contributed by that item.
Emdollars are deÞned as the dollars of gross economic product due to that much real wealth measuredas EMERGY.
Because it puts all forms of available energy on a common basis, EMERGY may be the correct wayto evaluate useful work. If real wealth comes from work, maximizing EMERGY production and usemaximizes the real wealth of an economy. Selecting alternatives to maximize empower and emdollarsis a new tool for engineering design and public policy.
Many energy analysis procedures add available energy as an exergy sum. However, EMERGYevaluation recognizes that each form of energy is different in its quality and the quantity of energy ofother kinds required to make it. As shown in the EMERGY evaluation example (Table 8.16.2), eachenergy value is multiplied by its transformity so as to convert all items to solar EMERGY.
© 1999 by CRC Press LLC

8-198 Section 8
FIGURE 8.16.1 Energy transformation hierarchy: (a) spatial view of units, their sizes, and territories; (b) systemsdiagram of energy ßow web; (c) web aggegated into an energy transformation chain; (d) energy ßows betweenhierarchical levels; (e) transformitites of ßows between levels.
© 1999 by CRC Press LLC

Energy Conversion 8-199
An Example of EMERGY Evaluation, Lignite
The evaluation procedure starts with an aggregated systems diagram to relate inputs, outputs, and mainprocesses. This is used to identify line items in an evaluation table. An example is the analysis of ligniteprocessing at the Big Brown Mine in FairÞeld, Texas. Line items for the EMERGY evaluation in Table8.16.2 were identiÞed from the summarizing systems diagram in Figure 8.16.2. The net EMERGY ratiorelates the EMERGY yield to the EMERGY required for the processing. The net EMERGY ratio of 6.8(Table 8.16.2) means that 6.8 times more real wealth was contributed to the economy than required inthe processing. The operation contributed 5.6 million emdollars per day to the economy as lignite yield,almost 12 times more than the economic value of $477,000 dollars per day.
Defining Terms
EMERGY: Available energy of one kind previously required directly and indirectly to make a productor service (unit: emjoules). Example: solar emjoules (abbreviation: sej).
Transformity: EMERGY per unit available energy (units: emjoules per joule). Example: solar emjoulesper joule (abbreviation: sej/J).
Empower: EMERGY ßow per unit time (units: emjoules per time). Example: solar emjoules per year(abbreviation: sej/yr).
Emdollars: EMERGY divided by EMERGY/money ratio. (abbreviation Em$).Net EMERGY ratio: Yield EMERGY/EMERGY of purchased inputs.
TABLE 8.16.1 Typical Solar Transformities
Form of Energy Solar Transformitysej/J
Solar insolation 1Chemical energy in rain transpired over land# 18,000Mined coal 40,000Electric power 174,000Human service, college graduate 343,000,000
sej/J = solar emjoules per Joule# Gibbs energy relative to sea water salt concentration in leaves, the
main energy basis for land plants.
TABLE 8.16.2 EMERGY Evaluation of Lignite Processing in Texas*
Note Item
Data Units/Day J, G, or $
Solar EMERGY/Unit
sej/unit
Solar Empower E17
sej/day
Em$ 1995$Thsd$/yr#
1 Diverted env. product. 7.10 E11 J 1.5 E4/J 0.11 8.52 Topsoil lost 5.04 E12 J 6.3 E4/J 3.18 2443 Fuel used 6.38 E10 J 5.0 E4/J 0.032 2.54 Electricity used 3.11 E11 J 1.6 E5/J 0.50 38.55 Equipment support 13.8 E6 g 5.7 E9/g 0.79 60.86 Goods & service costs 2.8 E5 $ 2.2 E12/$ 6.2 477
6.2 4777 Sum of inputs 10.8 8308 Lignite yield 2.0 E14 J 3.68 E4/J 73.6 5661
* Analysis of Big Brown Plant, FairÞeld, Texas (Odum et al., 1987, revised).# Solar empower in Column 5 divided by 1.3 E12 sej/$ for U.S.A., 1995. Net EMERGY ratio
= Yield/Inputs = 73.6/10.8 = 6.8
© 1999 by CRC Press LLC
8-200 Section 8
References
Odum, H.T., Odum, E.C., and Blissett, M. 1987. Ecology and Economy: ÒEMERGYÓ Analysis andPublic Policy in Texas. Policy Research Project Report #78, Lyndon B. Johnson School of PublicAffairs, The University of Texas, Austin, 178 pp.
Odum, H.T. 1988. Self organization, transformity, and information. Science 242, 1132Ð1139.Odum, H.T. 1996. Environmental Accounting, EMERGY and Decision Making. John Wiley & Sons,
New York, 276 pp.
Further Information
Hall, C.A.S., Ed. 1995. Maximum Power. University Press of Colorado, Niwot, CO, 393 pp.
FIGURE 8.16.2 Energy systems diagram and emergy ßows of a lignite mining operation evaluated in Table 8.16.2.
© 1999 by CRC Press LLC