GOOG Exhibit 99.1 Q4 2016 - Alphabet Inc. · Title: GOOG Exhibit 99.1 Q4 2016 Created Date:...
15
Exhibit 99.1 Alphabet Announces Fourth Quarter and Fiscal Year 2016 Results MOUNTAIN VIEW, Calif. – January 26, 2017 – Alphabet Inc. (NASDAQ: GOOG, GOOGL) today announced financial results for the quarter and fiscal year ended December 31, 2016. "Our growth in the fourth quarter was exceptional -- with revenues up 22% year on year and 24% on a constant currency basis. This performance was led by mobile search and YouTube. We’re seeing great momentum in Google’s newer investment areas and ongoing strong progress in Other Bets," said Ruth Porat, CFO of Alphabet. Q4 2016 financial highlights The following summarizes our consolidated financial results for the quarters ended December 31, 2015 and 2016 (in millions, except for per share information; unaudited): Three Months Ended December 31, 2015 Three Months Ended December 31, 2016 Revenues $21,329 $26,064 Increase in revenues year over year 18% 22% Increase in constant currency revenues year over year 24% 24% GAAP operating income $5,380 $6,639 GAAP operating margin 25% 25% Non-GAAP operating income $6,816 $8,485 Non-GAAP operating margin 32% 33% GAAP net income $4,923 $5,333 Non-GAAP net income $6,043 $6,593 GAAP diluted EPS for Class A and B common stock and Class C capital stock $7.06 $7.56 Non-GAAP diluted EPS for Class A and B common stock and Class C capital stock $8.67 $9.36 Diluted shares (in thousands) 697,025 700,221 Operating income, operating margin, net income, and diluted earnings per share (EPS) are reported on a GAAP and non-GAAP basis. Non-GAAP operating income and non-GAAP operating margin exclude stock-based compensation (SBC) expense. Non-GAAP net income and non-GAAP diluted EPS exclude SBC expense, net of the SBC related tax benefits. These non-GAAP measures, free cash flow (an alternative non-GAAP measure of liquidity), and non- GAAP constant currency revenues and growth are described and reconciled to the corresponding GAAP measures at the end of this release. The following summarizes our segment results where Google is presented as a single segment and all other Alphabet businesses are combined as Other Bets (in millions; unaudited): Three Months Ended December 31, 2015 Three Months Ended December 31, 2016 Google segment revenues $21,179 $25,802 Google operating income $6,744 $7,883 Other Bets revenues $150 $262 Other Bets operating loss ($1,213) ($1,088)
Transcript of GOOG Exhibit 99.1 Q4 2016 - Alphabet Inc. · Title: GOOG Exhibit 99.1 Q4 2016 Created Date:...
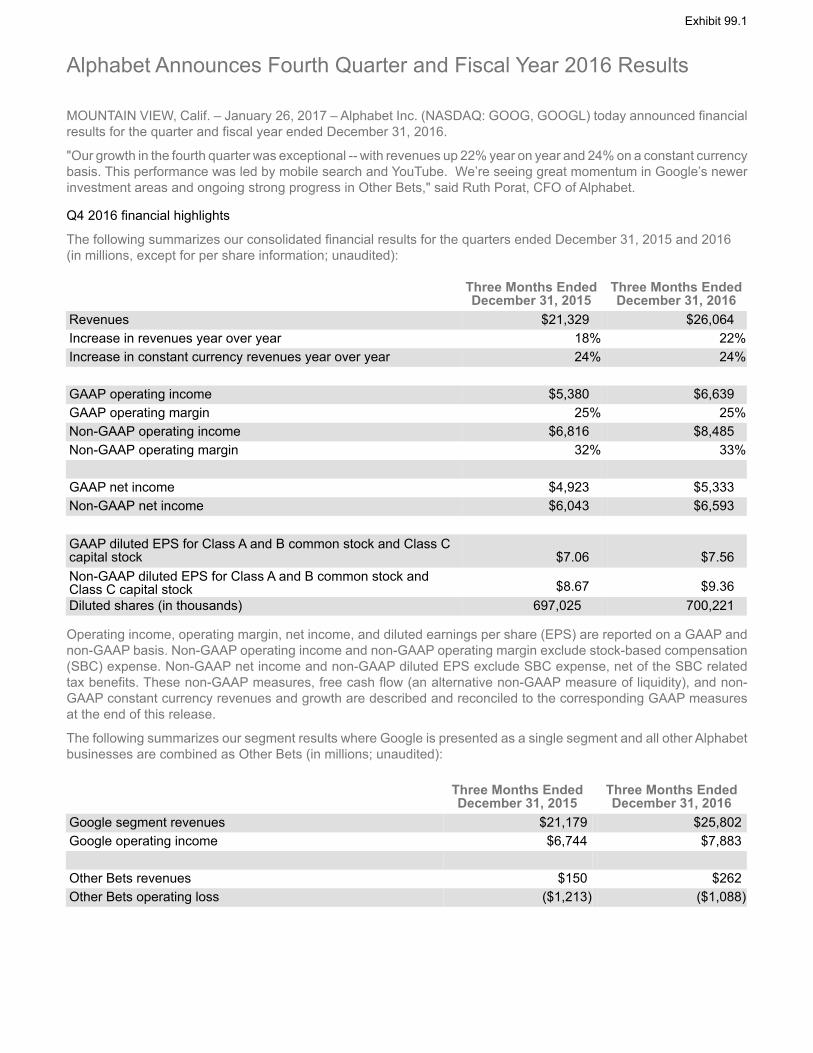
Exhibit 99.1
Alphabet Announces Fourth Quarter and Fiscal Year 2016 Results
MOUNTAIN VIEW, Calif. – January 26, 2017 – Alphabet Inc. (NASDAQ: GOOG, GOOGL) today announced financial results for the quarter and fiscal year ended December 31, 2016.
"Our growth in the fourth quarter was exceptional -- with revenues up 22% year on year and 24% on a constant currency basis. This performance was led by mobile search and YouTube. We’re seeing great momentum in Google’s newer investment areas and ongoing strong progress in Other Bets," said Ruth Porat, CFO of Alphabet.
Q4 2016 financial highlights
The following summarizes our consolidated financial results for the quarters ended December 31, 2015 and 2016 (in millions, except for per share information; unaudited):
Three Months EndedDecember 31, 2015
Three Months EndedDecember 31, 2016
Revenues $21,329 $26,064Increase in revenues year over year 18% 22%Increase in constant currency revenues year over year 24% 24%
GAAP operating income $5,380 $6,639GAAP operating margin 25% 25%Non-GAAP operating income $6,816 $8,485Non-GAAP operating margin 32% 33%
GAAP net income $4,923 $5,333Non-GAAP net income $6,043 $6,593
GAAP diluted EPS for Class A and B common stock and Class C capital stock $7.06 $7.56Non-GAAP diluted EPS for Class A and B common stock and Class C capital stock $8.67 $9.36Diluted shares (in thousands) 697,025 700,221
Operating income, operating margin, net income, and diluted earnings per share (EPS) are reported on a GAAP and non-GAAP basis. Non-GAAP operating income and non-GAAP operating margin exclude stock-based compensation (SBC) expense. Non-GAAP net income and non-GAAP diluted EPS exclude SBC expense, net of the SBC related tax benefits. These non-GAAP measures, free cash flow (an alternative non-GAAP measure of liquidity), and non-GAAP constant currency revenues and growth are described and reconciled to the corresponding GAAP measures at the end of this release.
The following summarizes our segment results where Google is presented as a single segment and all other Alphabet businesses are combined as Other Bets (in millions; unaudited):
Three Months EndedDecember 31, 2015
Three Months EndedDecember 31, 2016
Google segment revenues $21,179 $25,802Google operating income $6,744 $7,883
Other Bets revenues $150 $262Other Bets operating loss ($1,213) ($1,088)
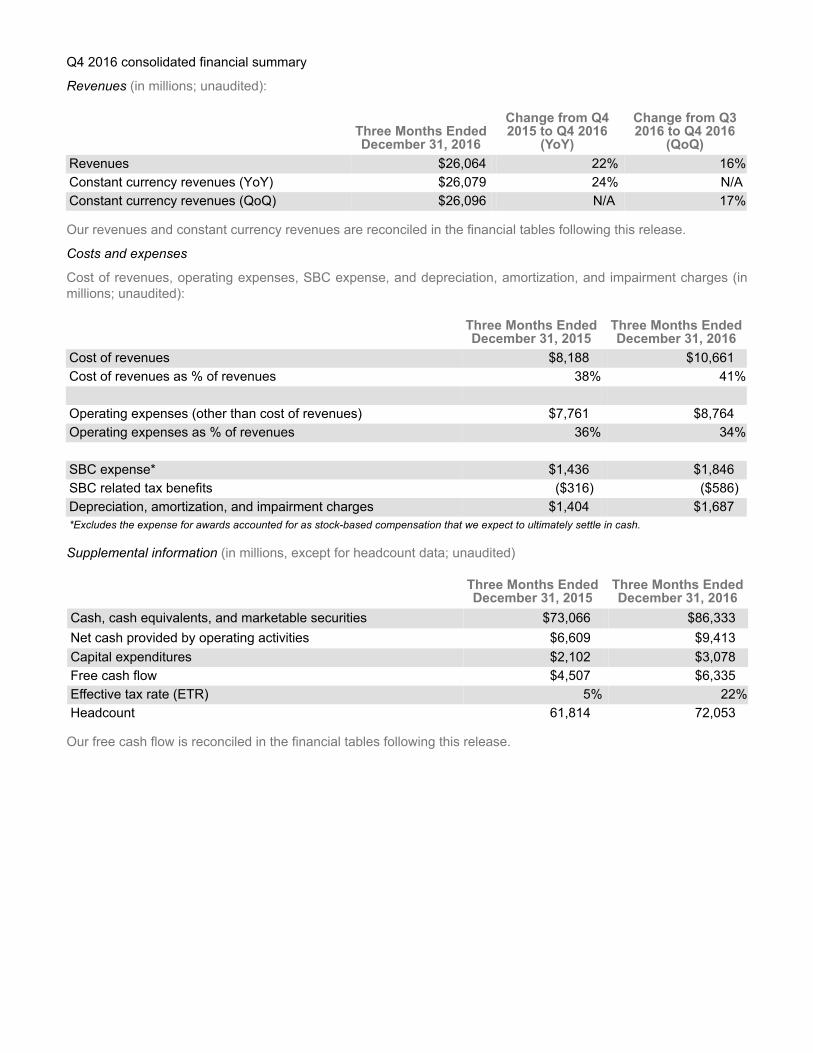
Q4 2016 consolidated financial summary
Revenues (in millions; unaudited):
Three Months EndedDecember 31, 2016
Change from Q4 2015 to Q4 2016
(YoY)
Change from Q3 2016 to Q4 2016
(QoQ)Revenues $26,064 22% 16%Constant currency revenues (YoY) $26,079 24% N/AConstant currency revenues (QoQ) $26,096 N/A 17%
Our revenues and constant currency revenues are reconciled in the financial tables following this release.
Costs and expenses
Cost of revenues, operating expenses, SBC expense, and depreciation, amortization, and impairment charges (in millions; unaudited):
Three Months EndedDecember 31, 2015
Three Months EndedDecember 31, 2016
Cost of revenues $8,188 $10,661Cost of revenues as % of revenues 38% 41%
Operating expenses (other than cost of revenues) $7,761 $8,764Operating expenses as % of revenues 36% 34%
SBC expense* $1,436 $1,846SBC related tax benefits ($316) ($586)Depreciation, amortization, and impairment charges $1,404 $1,687*Excludes the expense for awards accounted for as stock-based compensation that we expect to ultimately settle in cash.
Supplemental information (in millions, except for headcount data; unaudited)
Three Months EndedDecember 31, 2015
Three Months EndedDecember 31, 2016
Cash, cash equivalents, and marketable securities $73,066 $86,333Net cash provided by operating activities $6,609 $9,413Capital expenditures $2,102 $3,078Free cash flow $4,507 $6,335Effective tax rate (ETR) 5% 22%Headcount 61,814 72,053
Our free cash flow is reconciled in the financial tables following this release.
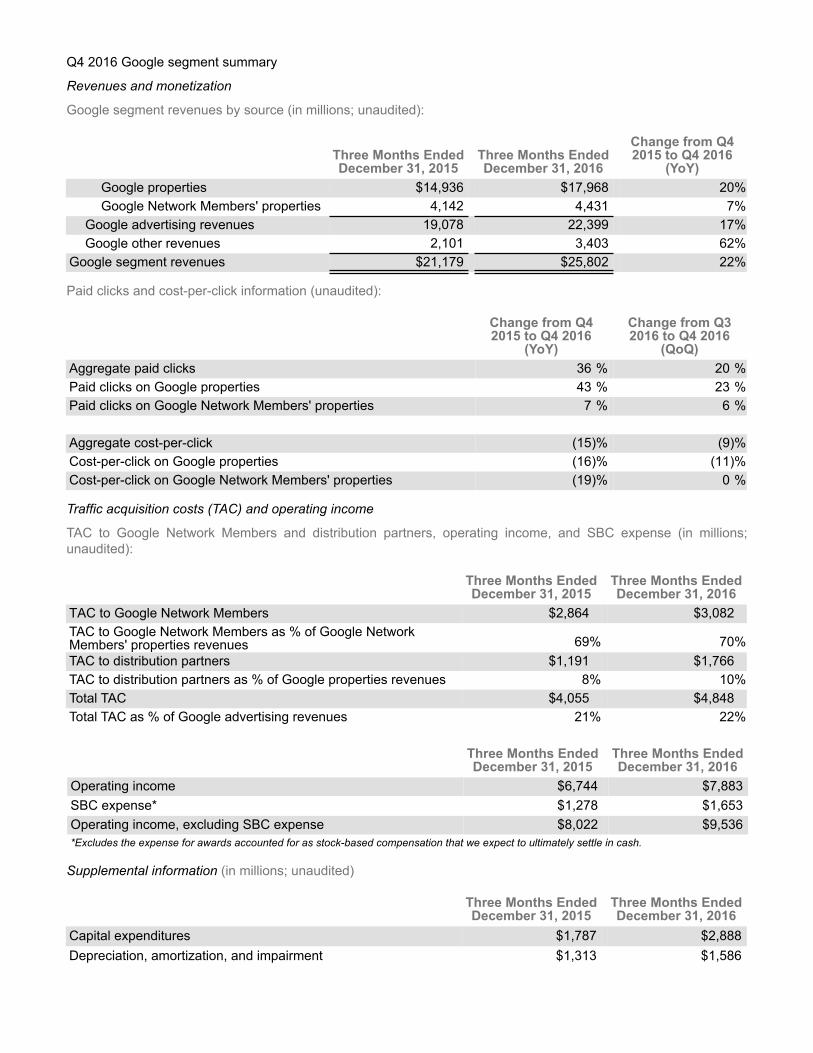
Q4 2016 Google segment summary
Revenues and monetization
Google segment revenues by source (in millions; unaudited):
Three Months EndedDecember 31, 2015
Three Months EndedDecember 31, 2016
Change from Q4 2015 to Q4 2016
(YoY)Google properties $14,936 $17,968 20%Google Network Members' properties 4,142 4,431 7%
Google advertising revenues 19,078 22,399 17%Google other revenues 2,101 3,403 62%
Google segment revenues $21,179 $25,802 22%
Paid clicks and cost-per-click information (unaudited):
Change from Q4 2015 to Q4 2016
(YoY)
Change from Q3 2016 to Q4 2016
(QoQ)Aggregate paid clicks 36 % 20 %Paid clicks on Google properties 43 % 23 %Paid clicks on Google Network Members' properties 7 % 6 %
Aggregate cost-per-click (15)% (9)%Cost-per-click on Google properties (16)% (11)%Cost-per-click on Google Network Members' properties (19)% 0 %
Traffic acquisition costs (TAC) and operating income
TAC to Google Network Members and distribution partners, operating income, and SBC expense (in millions; unaudited):
Three Months EndedDecember 31, 2015
Three Months EndedDecember 31, 2016
TAC to Google Network Members $2,864 $3,082TAC to Google Network Members as % of Google Network Members' properties revenues 69% 70%TAC to distribution partners $1,191 $1,766TAC to distribution partners as % of Google properties revenues 8% 10%Total TAC $4,055 $4,848Total TAC as % of Google advertising revenues 21% 22%
Three Months EndedDecember 31, 2015
Three Months EndedDecember 31, 2016
Operating income $6,744 $7,883SBC expense* $1,278 $1,653Operating income, excluding SBC expense $8,022 $9,536*Excludes the expense for awards accounted for as stock-based compensation that we expect to ultimately settle in cash.
Supplemental information (in millions; unaudited)
Three Months EndedDecember 31, 2015
Three Months EndedDecember 31, 2016
Capital expenditures $1,787 $2,888Depreciation, amortization, and impairment $1,313 $1,586
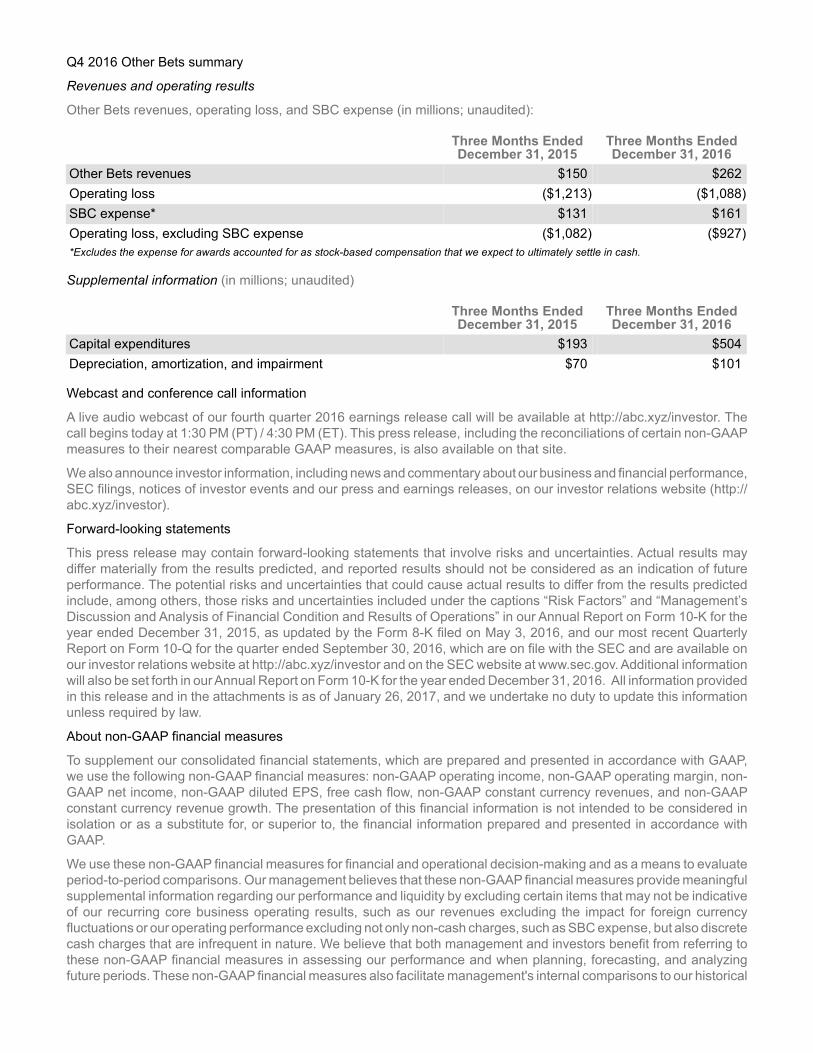
Q4 2016 Other Bets summary
Revenues and operating results
Other Bets revenues, operating loss, and SBC expense (in millions; unaudited):
Three Months EndedDecember 31, 2015
Three Months EndedDecember 31, 2016
Other Bets revenues $150 $262Operating loss ($1,213) ($1,088)SBC expense* $131 $161Operating loss, excluding SBC expense ($1,082) ($927)*Excludes the expense for awards accounted for as stock-based compensation that we expect to ultimately settle in cash.
Supplemental information (in millions; unaudited)
Three Months EndedDecember 31, 2015
Three Months EndedDecember 31, 2016
Capital expenditures $193 $504Depreciation, amortization, and impairment $70 $101
Webcast and conference call information
A live audio webcast of our fourth quarter 2016 earnings release call will be available at http://abc.xyz/investor. The call begins today at 1:30 PM (PT) / 4:30 PM (ET). This press release, including the reconciliations of certain non-GAAP measures to their nearest comparable GAAP measures, is also available on that site.
We also announce investor information, including news and commentary about our business and financial performance, SEC filings, notices of investor events and our press and earnings releases, on our investor relations website (http://abc.xyz/investor).
Forward-looking statements
This press release may contain forward-looking statements that involve risks and uncertainties. Actual results may differ materially from the results predicted, and reported results should not be considered as an indication of future performance. The potential risks and uncertainties that could cause actual results to differ from the results predicted include, among others, those risks and uncertainties included under the captions “Risk Factors” and “Management’s Discussion and Analysis of Financial Condition and Results of Operations” in our Annual Report on Form 10-K for the year ended December 31, 2015, as updated by the Form 8-K filed on May 3, 2016, and our most recent Quarterly Report on Form 10-Q for the quarter ended September 30, 2016, which are on file with the SEC and are available on our investor relations website at http://abc.xyz/investor and on the SEC website at www.sec.gov. Additional information will also be set forth in our Annual Report on Form 10-K for the year ended December 31, 2016. All information provided in this release and in the attachments is as of January 26, 2017, and we undertake no duty to update this information unless required by law.
About non-GAAP financial measures
To supplement our consolidated financial statements, which are prepared and presented in accordance with GAAP, we use the following non-GAAP financial measures: non-GAAP operating income, non-GAAP operating margin, non-GAAP net income, non-GAAP diluted EPS, free cash flow, non-GAAP constant currency revenues, and non-GAAP constant currency revenue growth. The presentation of this financial information is not intended to be considered in isolation or as a substitute for, or superior to, the financial information prepared and presented in accordance with GAAP.
We use these non-GAAP financial measures for financial and operational decision-making and as a means to evaluate period-to-period comparisons. Our management believes that these non-GAAP financial measures provide meaningful supplemental information regarding our performance and liquidity by excluding certain items that may not be indicative of our recurring core business operating results, such as our revenues excluding the impact for foreign currency fluctuations or our operating performance excluding not only non-cash charges, such as SBC expense, but also discrete cash charges that are infrequent in nature. We believe that both management and investors benefit from referring to these non-GAAP financial measures in assessing our performance and when planning, forecasting, and analyzing future periods. These non-GAAP financial measures also facilitate management's internal comparisons to our historical
performance and liquidity as well as comparisons to our competitors' operating results. We believe these non-GAAP financial measures are useful to investors both because (1) they allow for greater transparency with respect to key metrics used by management in its financial and operational decision-making and (2) they are used by our institutional investors and the analyst community to help them analyze the health of our business.
For more information on these non-GAAP financial measures, please see the tables captioned "Reconciliations of non-GAAP results of operations to the nearest comparable GAAP measures," "Reconciliation from net cash provided by operating activities to free cash flow," and "Reconciliation from GAAP revenues to non-GAAP constant currency revenues" included at the end of this release.
Contact
Investor [email protected]
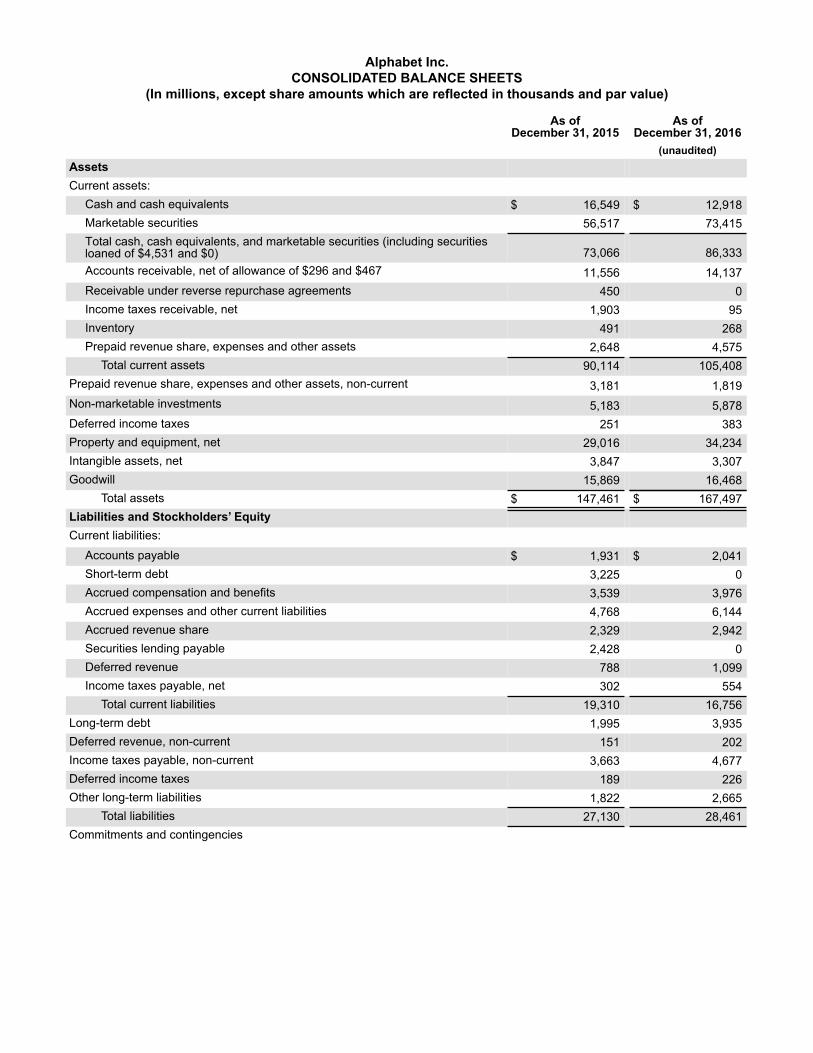
Alphabet Inc.CONSOLIDATED BALANCE SHEETS
(In millions, except share amounts which are reflected in thousands and par value)
As ofDecember 31, 2015
As ofDecember 31, 2016
(unaudited)AssetsCurrent assets:
Cash and cash equivalents $ 16,549 $ 12,918Marketable securities 56,517 73,415Total cash, cash equivalents, and marketable securities (including securitiesloaned of $4,531 and $0) 73,066 86,333Accounts receivable, net of allowance of $296 and $467 11,556 14,137Receivable under reverse repurchase agreements 450 0Income taxes receivable, net 1,903 95Inventory 491 268Prepaid revenue share, expenses and other assets 2,648 4,575
Total current assets 90,114 105,408Prepaid revenue share, expenses and other assets, non-current 3,181 1,819Non-marketable investments 5,183 5,878Deferred income taxes 251 383Property and equipment, net 29,016 34,234Intangible assets, net 3,847 3,307Goodwill 15,869 16,468
Total assets $ 147,461 $ 167,497Liabilities and Stockholders’ EquityCurrent liabilities:
Accounts payable $ 1,931 $ 2,041Short-term debt 3,225 0Accrued compensation and benefits 3,539 3,976Accrued expenses and other current liabilities 4,768 6,144Accrued revenue share 2,329 2,942Securities lending payable 2,428 0Deferred revenue 788 1,099Income taxes payable, net 302 554
Total current liabilities 19,310 16,756Long-term debt 1,995 3,935Deferred revenue, non-current 151 202Income taxes payable, non-current 3,663 4,677Deferred income taxes 189 226Other long-term liabilities 1,822 2,665
Total liabilities 27,130 28,461Commitments and contingencies
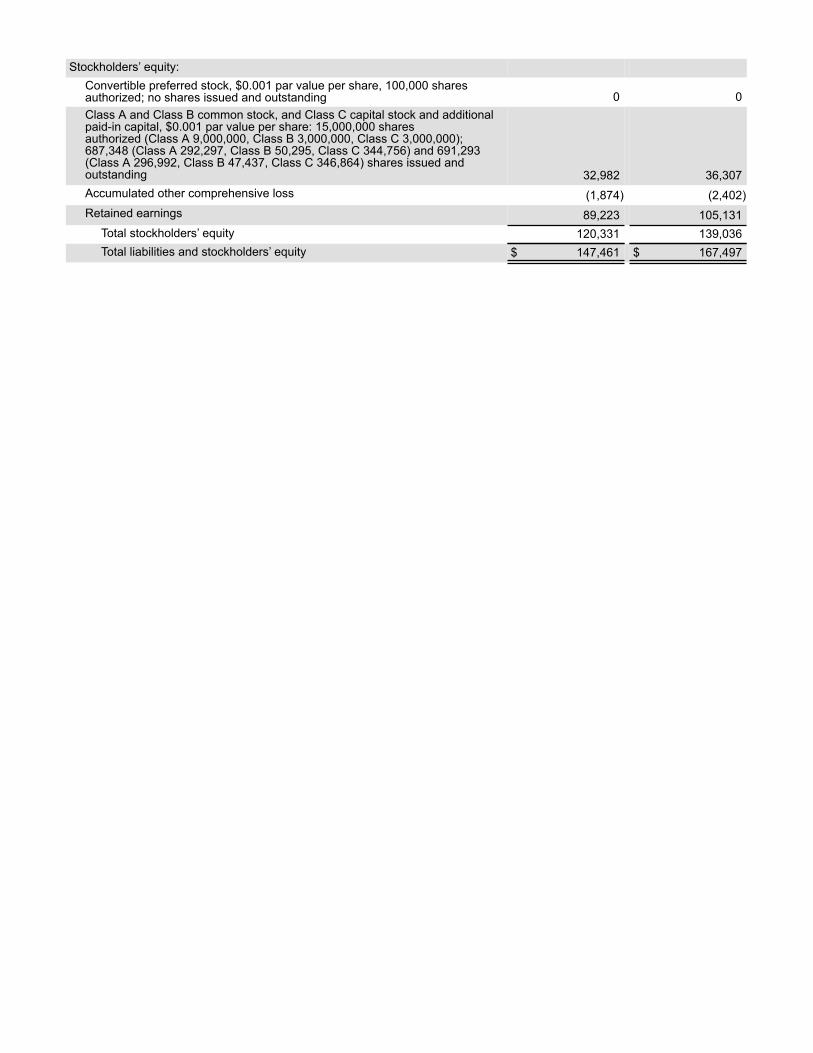
Stockholders’ equity:Convertible preferred stock, $0.001 par value per share, 100,000 shares authorized; no shares issued and outstanding 0 0Class A and Class B common stock, and Class C capital stock and additionalpaid-in capital, $0.001 par value per share: 15,000,000 sharesauthorized (Class A 9,000,000, Class B 3,000,000, Class C 3,000,000);687,348 (Class A 292,297, Class B 50,295, Class C 344,756) and 691,293(Class A 296,992, Class B 47,437, Class C 346,864) shares issued andoutstanding 32,982 36,307Accumulated other comprehensive loss (1,874) (2,402)Retained earnings 89,223 105,131
Total stockholders’ equity 120,331 139,036Total liabilities and stockholders’ equity $ 147,461 $ 167,497
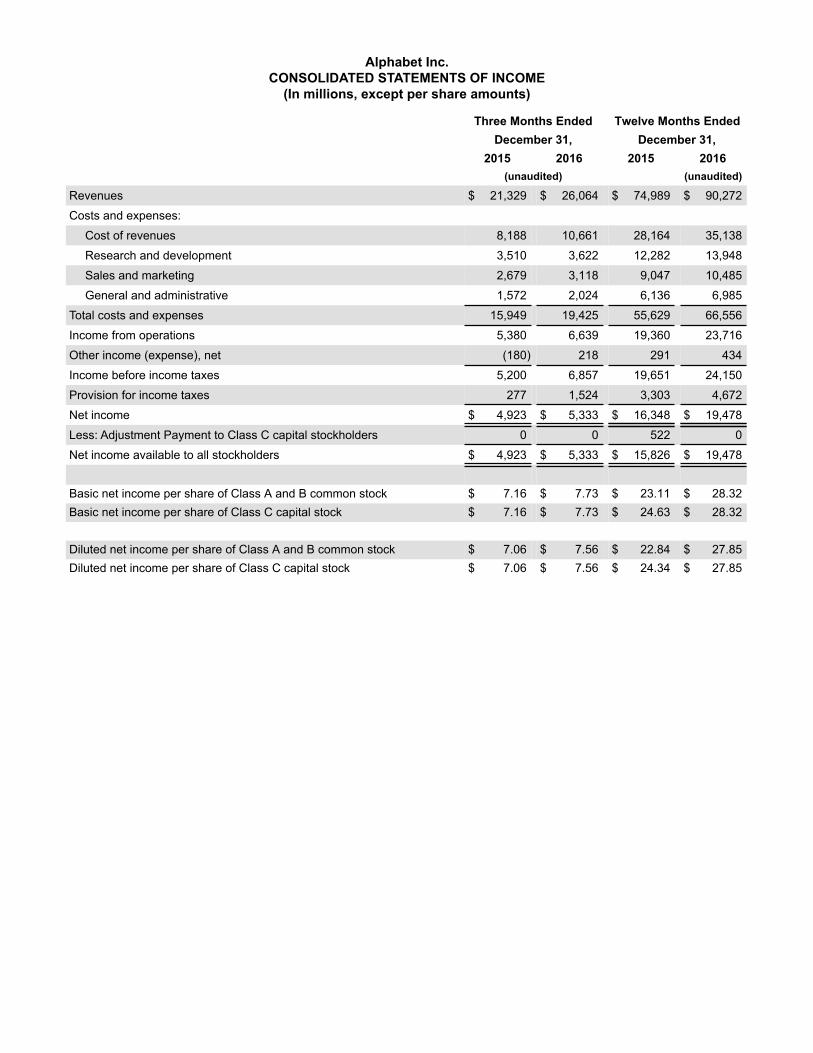
Alphabet Inc.CONSOLIDATED STATEMENTS OF INCOME
(In millions, except per share amounts)
Three Months Ended Twelve Months EndedDecember 31, December 31,
2015 2016 2015 2016(unaudited) (unaudited)
Revenues $ 21,329 $ 26,064 $ 74,989 $ 90,272
Costs and expenses:
Cost of revenues 8,188 10,661 28,164 35,138
Research and development 3,510 3,622 12,282 13,948
Sales and marketing 2,679 3,118 9,047 10,485
General and administrative 1,572 2,024 6,136 6,985
Total costs and expenses 15,949 19,425 55,629 66,556
Income from operations 5,380 6,639 19,360 23,716
Other income (expense), net (180) 218 291 434
Income before income taxes 5,200 6,857 19,651 24,150
Provision for income taxes 277 1,524 3,303 4,672
Net income $ 4,923 $ 5,333 $ 16,348 $ 19,478
Less: Adjustment Payment to Class C capital stockholders 0 0 522 0
Net income available to all stockholders $ 4,923 $ 5,333 $ 15,826 $ 19,478
Basic net income per share of Class A and B common stock $ 7.16 $ 7.73 $ 23.11 $ 28.32Basic net income per share of Class C capital stock $ 7.16 $ 7.73 $ 24.63 $ 28.32
Diluted net income per share of Class A and B common stock $ 7.06 $ 7.56 $ 22.84 $ 27.85Diluted net income per share of Class C capital stock $ 7.06 $ 7.56 $ 24.34 $ 27.85
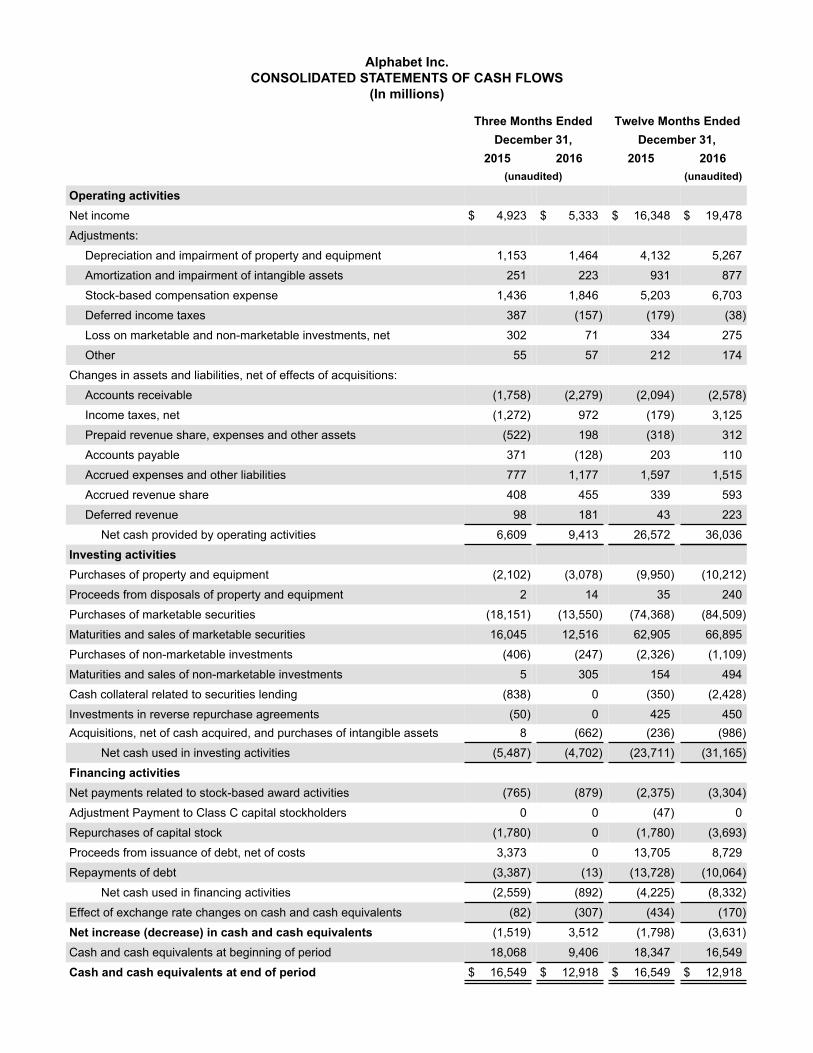
Alphabet Inc.CONSOLIDATED STATEMENTS OF CASH FLOWS
(In millions)
Three Months Ended Twelve Months EndedDecember 31, December 31,
2015 2016 2015 2016(unaudited) (unaudited)
Operating activitiesNet income $ 4,923 $ 5,333 $ 16,348 $ 19,478
Adjustments:
Depreciation and impairment of property and equipment 1,153 1,464 4,132 5,267
Amortization and impairment of intangible assets 251 223 931 877
Stock-based compensation expense 1,436 1,846 5,203 6,703
Deferred income taxes 387 (157) (179) (38)
Loss on marketable and non-marketable investments, net 302 71 334 275
Other 55 57 212 174
Changes in assets and liabilities, net of effects of acquisitions:
Accounts receivable (1,758) (2,279) (2,094) (2,578)
Income taxes, net (1,272) 972 (179) 3,125
Prepaid revenue share, expenses and other assets (522) 198 (318) 312
Accounts payable 371 (128) 203 110
Accrued expenses and other liabilities 777 1,177 1,597 1,515
Accrued revenue share 408 455 339 593
Deferred revenue 98 181 43 223
Net cash provided by operating activities 6,609 9,413 26,572 36,036
Investing activitiesPurchases of property and equipment (2,102) (3,078) (9,950) (10,212)
Proceeds from disposals of property and equipment 2 14 35 240
Purchases of marketable securities (18,151) (13,550) (74,368) (84,509)
Maturities and sales of marketable securities 16,045 12,516 62,905 66,895
Purchases of non-marketable investments (406) (247) (2,326) (1,109)
Maturities and sales of non-marketable investments 5 305 154 494
Cash collateral related to securities lending (838) 0 (350) (2,428)
Investments in reverse repurchase agreements (50) 0 425 450Acquisitions, net of cash acquired, and purchases of intangible assets 8 (662) (236) (986)
Net cash used in investing activities (5,487) (4,702) (23,711) (31,165)
Financing activitiesNet payments related to stock-based award activities (765) (879) (2,375) (3,304)
Adjustment Payment to Class C capital stockholders 0 0 (47) 0
Repurchases of capital stock (1,780) 0 (1,780) (3,693)
Proceeds from issuance of debt, net of costs 3,373 0 13,705 8,729
Repayments of debt (3,387) (13) (13,728) (10,064)
Net cash used in financing activities (2,559) (892) (4,225) (8,332)
Effect of exchange rate changes on cash and cash equivalents (82) (307) (434) (170)
Net increase (decrease) in cash and cash equivalents (1,519) 3,512 (1,798) (3,631)
Cash and cash equivalents at beginning of period 18,068 9,406 18,347 16,549
Cash and cash equivalents at end of period $ 16,549 $ 12,918 $ 16,549 $ 12,918
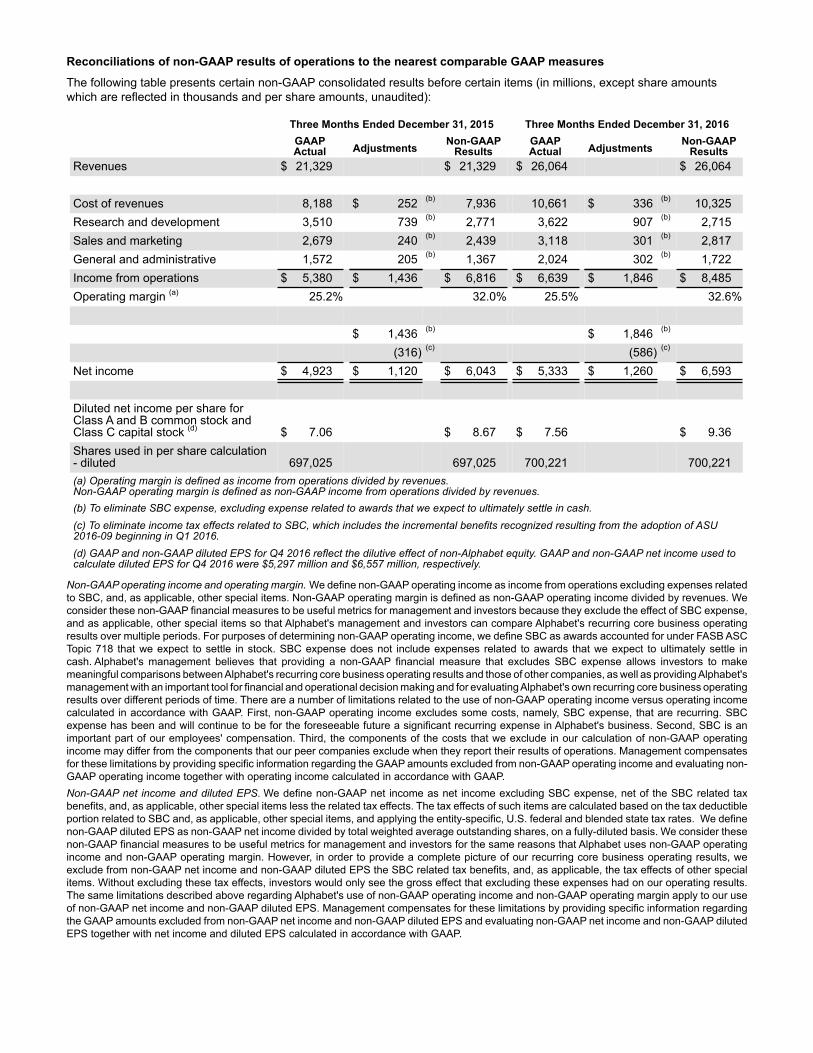
Reconciliations of non-GAAP results of operations to the nearest comparable GAAP measures
The following table presents certain non-GAAP consolidated results before certain items (in millions, except share amounts which are reflected in thousands and per share amounts, unaudited):
Three Months Ended December 31, 2015 Three Months Ended December 31, 2016GAAP Actual Adjustments Non-GAAP
ResultsGAAP Actual Adjustments Non-GAAP
ResultsRevenues $ 21,329 $ 21,329 $ 26,064 $ 26,064
Cost of revenues 8,188 $ 252 (b) 7,936 10,661 $ 336 (b) 10,325Research and development 3,510 739 (b) 2,771 3,622 907 (b) 2,715Sales and marketing 2,679 240 (b) 2,439 3,118 301 (b) 2,817General and administrative 1,572 205 (b) 1,367 2,024 302 (b) 1,722Income from operations $ 5,380 $ 1,436 $ 6,816 $ 6,639 $ 1,846 $ 8,485Operating margin (a) 25.2% 32.0% 25.5% 32.6%
$ 1,436 (b) $ 1,846 (b)
(316) (c) (586) (c)
Net income $ 4,923 $ 1,120 $ 6,043 $ 5,333 $ 1,260 $ 6,593
Diluted net income per share for Class A and B common stock and Class C capital stock (d) $ 7.06 $ 8.67 $ 7.56 $ 9.36Shares used in per share calculation- diluted 697,025 697,025 700,221 700,221(a) Operating margin is defined as income from operations divided by revenues.Non-GAAP operating margin is defined as non-GAAP income from operations divided by revenues.(b) To eliminate SBC expense, excluding expense related to awards that we expect to ultimately settle in cash.(c) To eliminate income tax effects related to SBC, which includes the incremental benefits recognized resulting from the adoption of ASU 2016-09 beginning in Q1 2016.(d) GAAP and non-GAAP diluted EPS for Q4 2016 reflect the dilutive effect of non-Alphabet equity. GAAP and non-GAAP net income used to calculate diluted EPS for Q4 2016 were $5,297 million and $6,557 million, respectively.
Non-GAAP operating income and operating margin. We define non-GAAP operating income as income from operations excluding expenses related to SBC, and, as applicable, other special items. Non-GAAP operating margin is defined as non-GAAP operating income divided by revenues. We consider these non-GAAP financial measures to be useful metrics for management and investors because they exclude the effect of SBC expense, and as applicable, other special items so that Alphabet's management and investors can compare Alphabet's recurring core business operating results over multiple periods. For purposes of determining non-GAAP operating income, we define SBC as awards accounted for under FASB ASC Topic 718 that we expect to settle in stock. SBC expense does not include expenses related to awards that we expect to ultimately settle in cash. Alphabet's management believes that providing a non-GAAP financial measure that excludes SBC expense allows investors to make meaningful comparisons between Alphabet's recurring core business operating results and those of other companies, as well as providing Alphabet's management with an important tool for financial and operational decision making and for evaluating Alphabet's own recurring core business operating results over different periods of time. There are a number of limitations related to the use of non-GAAP operating income versus operating income calculated in accordance with GAAP. First, non-GAAP operating income excludes some costs, namely, SBC expense, that are recurring. SBC expense has been and will continue to be for the foreseeable future a significant recurring expense in Alphabet's business. Second, SBC is an important part of our employees' compensation. Third, the components of the costs that we exclude in our calculation of non-GAAP operating income may differ from the components that our peer companies exclude when they report their results of operations. Management compensates for these limitations by providing specific information regarding the GAAP amounts excluded from non-GAAP operating income and evaluating non-GAAP operating income together with operating income calculated in accordance with GAAP.Non-GAAP net income and diluted EPS. We define non-GAAP net income as net income excluding SBC expense, net of the SBC related tax benefits, and, as applicable, other special items less the related tax effects. The tax effects of such items are calculated based on the tax deductible portion related to SBC and, as applicable, other special items, and applying the entity-specific, U.S. federal and blended state tax rates. We define non-GAAP diluted EPS as non-GAAP net income divided by total weighted average outstanding shares, on a fully-diluted basis. We consider these non-GAAP financial measures to be useful metrics for management and investors for the same reasons that Alphabet uses non-GAAP operating income and non-GAAP operating margin. However, in order to provide a complete picture of our recurring core business operating results, we exclude from non-GAAP net income and non-GAAP diluted EPS the SBC related tax benefits, and, as applicable, the tax effects of other special items. Without excluding these tax effects, investors would only see the gross effect that excluding these expenses had on our operating results. The same limitations described above regarding Alphabet's use of non-GAAP operating income and non-GAAP operating margin apply to our use of non-GAAP net income and non-GAAP diluted EPS. Management compensates for these limitations by providing specific information regarding the GAAP amounts excluded from non-GAAP net income and non-GAAP diluted EPS and evaluating non-GAAP net income and non-GAAP diluted EPS together with net income and diluted EPS calculated in accordance with GAAP.
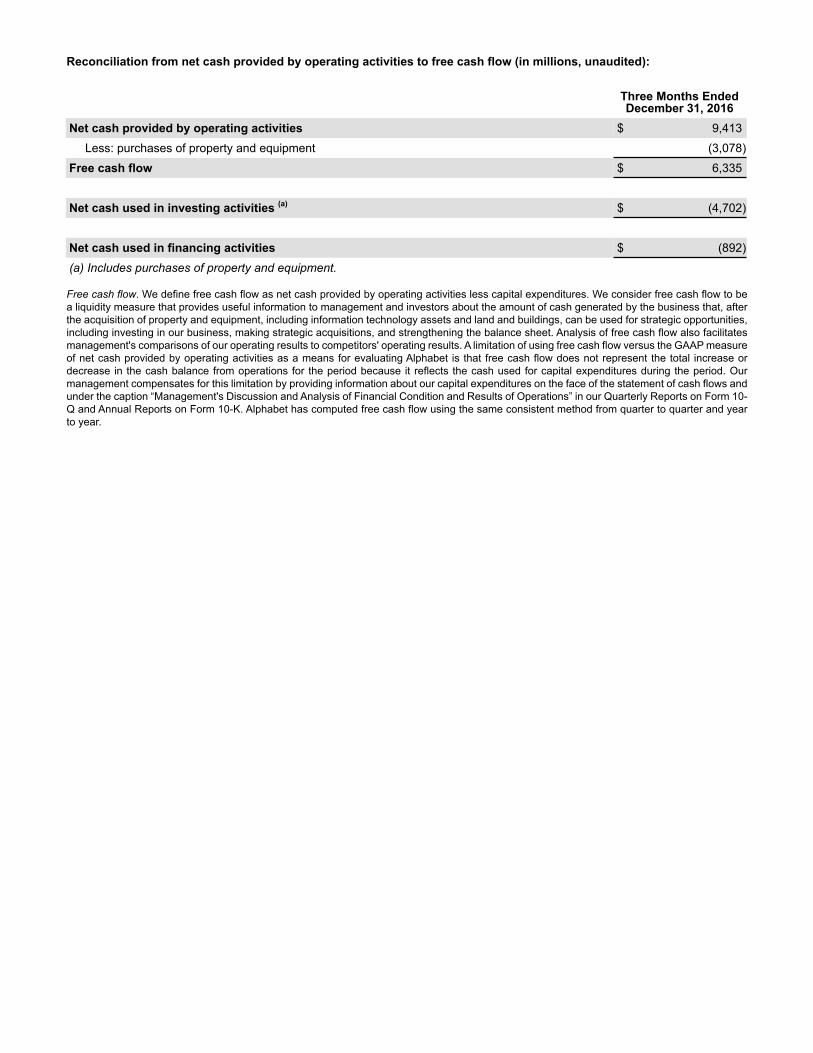
Reconciliation from net cash provided by operating activities to free cash flow (in millions, unaudited):
Three Months EndedDecember 31, 2016
Net cash provided by operating activities $ 9,413
Less: purchases of property and equipment (3,078)
Free cash flow $ 6,335
Net cash used in investing activities (a) $ (4,702)
Net cash used in financing activities $ (892)
(a) Includes purchases of property and equipment.
Free cash flow. We define free cash flow as net cash provided by operating activities less capital expenditures. We consider free cash flow to be a liquidity measure that provides useful information to management and investors about the amount of cash generated by the business that, after the acquisition of property and equipment, including information technology assets and land and buildings, can be used for strategic opportunities, including investing in our business, making strategic acquisitions, and strengthening the balance sheet. Analysis of free cash flow also facilitates management's comparisons of our operating results to competitors' operating results. A limitation of using free cash flow versus the GAAP measure of net cash provided by operating activities as a means for evaluating Alphabet is that free cash flow does not represent the total increase or decrease in the cash balance from operations for the period because it reflects the cash used for capital expenditures during the period. Our management compensates for this limitation by providing information about our capital expenditures on the face of the statement of cash flows and under the caption “Management's Discussion and Analysis of Financial Condition and Results of Operations” in our Quarterly Reports on Form 10-Q and Annual Reports on Form 10-K. Alphabet has computed free cash flow using the same consistent method from quarter to quarter and year to year.
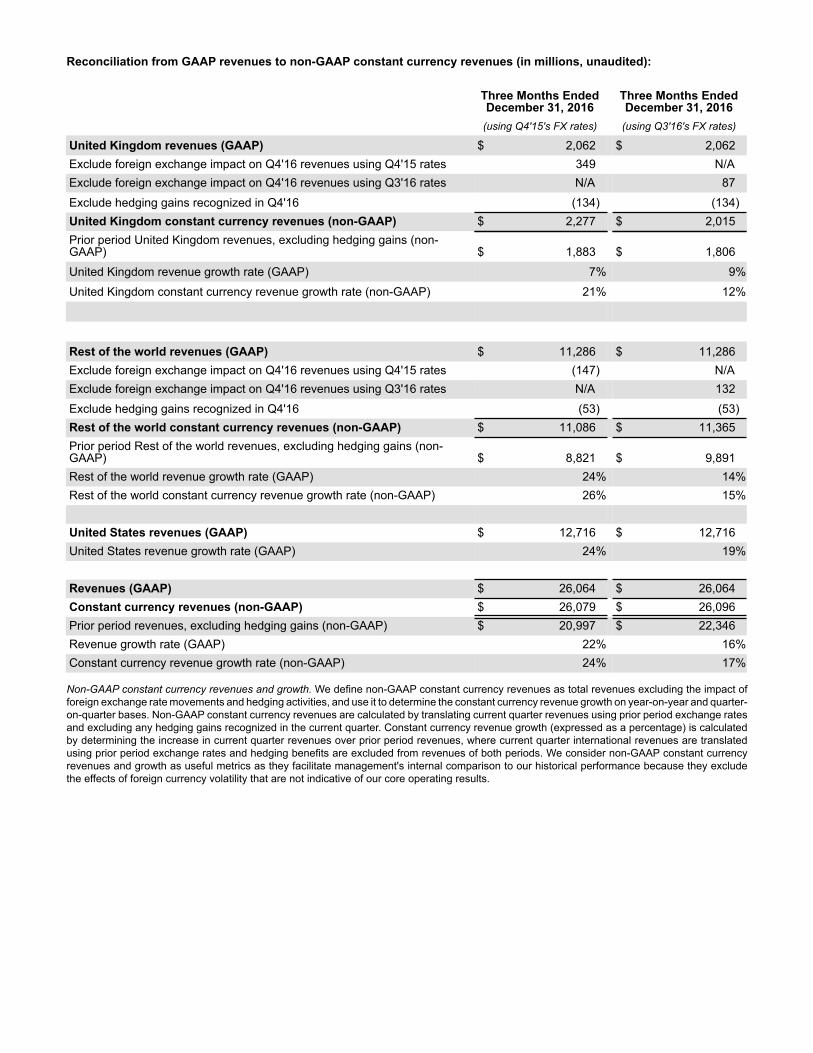
Reconciliation from GAAP revenues to non-GAAP constant currency revenues (in millions, unaudited):
Three Months EndedDecember 31, 2016
Three Months EndedDecember 31, 2016
(using Q4'15's FX rates) (using Q3'16's FX rates)
United Kingdom revenues (GAAP) $ 2,062 $ 2,062Exclude foreign exchange impact on Q4'16 revenues using Q4'15 rates 349 N/AExclude foreign exchange impact on Q4'16 revenues using Q3'16 rates N/A 87
Exclude hedging gains recognized in Q4'16 (134) (134)United Kingdom constant currency revenues (non-GAAP) $ 2,277 $ 2,015Prior period United Kingdom revenues, excluding hedging gains (non-GAAP) $ 1,883 $ 1,806
United Kingdom revenue growth rate (GAAP) 7% 9%
United Kingdom constant currency revenue growth rate (non-GAAP) 21% 12%
Rest of the world revenues (GAAP) $ 11,286 $ 11,286Exclude foreign exchange impact on Q4'16 revenues using Q4'15 rates (147) N/AExclude foreign exchange impact on Q4'16 revenues using Q3'16 rates N/A 132
Exclude hedging gains recognized in Q4'16 (53) (53)Rest of the world constant currency revenues (non-GAAP) $ 11,086 $ 11,365Prior period Rest of the world revenues, excluding hedging gains (non-GAAP) $ 8,821 $ 9,891Rest of the world revenue growth rate (GAAP) 24% 14%Rest of the world constant currency revenue growth rate (non-GAAP) 26% 15%
United States revenues (GAAP) $ 12,716 $ 12,716United States revenue growth rate (GAAP) 24% 19%
Revenues (GAAP) $ 26,064 $ 26,064Constant currency revenues (non-GAAP) $ 26,079 $ 26,096Prior period revenues, excluding hedging gains (non-GAAP) $ 20,997 $ 22,346Revenue growth rate (GAAP) 22% 16%Constant currency revenue growth rate (non-GAAP) 24% 17%
Non-GAAP constant currency revenues and growth. We define non-GAAP constant currency revenues as total revenues excluding the impact of foreign exchange rate movements and hedging activities, and use it to determine the constant currency revenue growth on year-on-year and quarter-on-quarter bases. Non-GAAP constant currency revenues are calculated by translating current quarter revenues using prior period exchange rates and excluding any hedging gains recognized in the current quarter. Constant currency revenue growth (expressed as a percentage) is calculated by determining the increase in current quarter revenues over prior period revenues, where current quarter international revenues are translated using prior period exchange rates and hedging benefits are excluded from revenues of both periods. We consider non-GAAP constant currency revenues and growth as useful metrics as they facilitate management's internal comparison to our historical performance because they exclude the effects of foreign currency volatility that are not indicative of our core operating results.
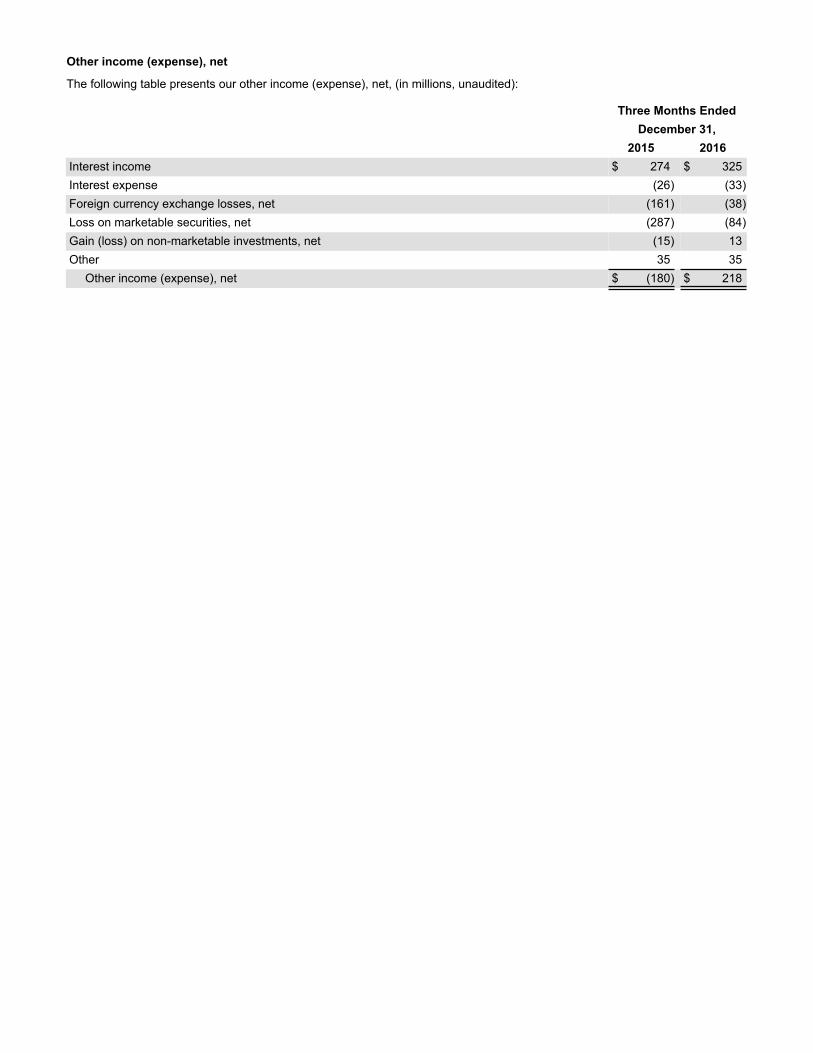
Other income (expense), net
The following table presents our other income (expense), net, (in millions, unaudited):
Three Months EndedDecember 31,
2015 2016Interest income $ 274 $ 325Interest expense (26) (33)Foreign currency exchange losses, net (161) (38)Loss on marketable securities, net (287) (84)Gain (loss) on non-marketable investments, net (15) 13Other 35 35
Other income (expense), net $ (180) $ 218
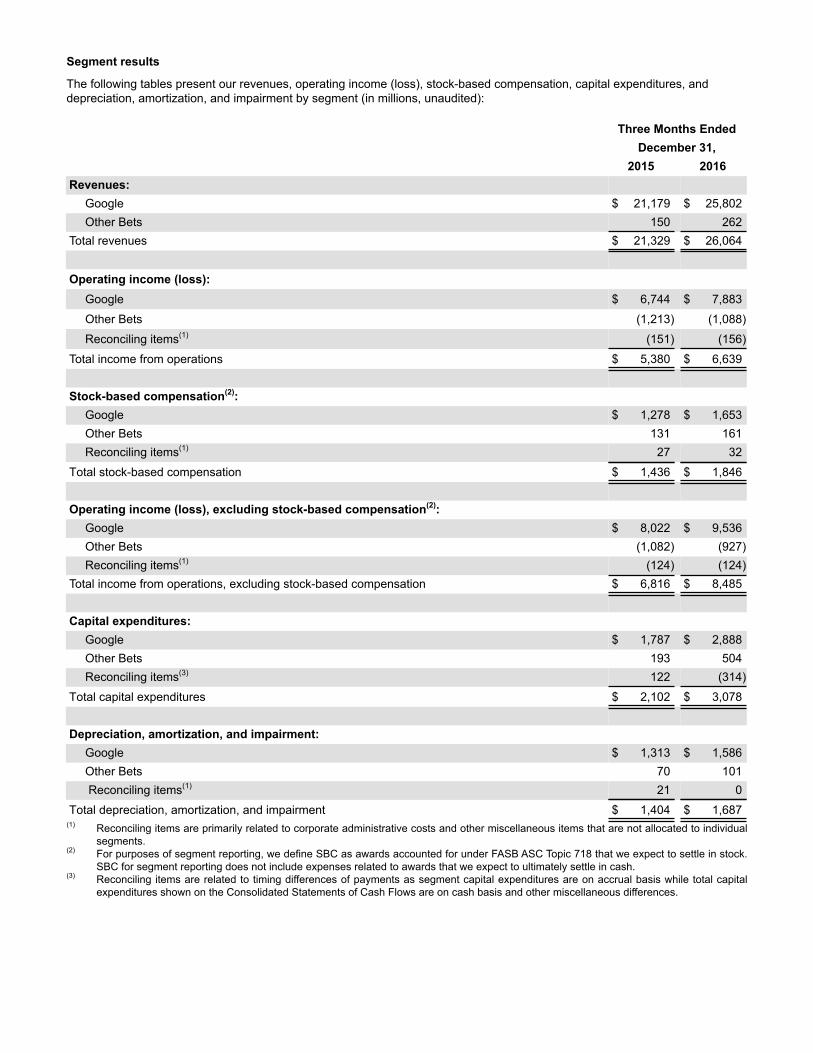
Segment results
The following tables present our revenues, operating income (loss), stock-based compensation, capital expenditures, and depreciation, amortization, and impairment by segment (in millions, unaudited):
Three Months EndedDecember 31,
2015 2016Revenues:
Google $ 21,179 $ 25,802Other Bets 150 262
Total revenues $ 21,329 $ 26,064
Operating income (loss):Google $ 6,744 $ 7,883
Other Bets (1,213) (1,088)
Reconciling items(1) (151) (156)
Total income from operations $ 5,380 $ 6,639
Stock-based compensation(2):Google $ 1,278 $ 1,653Other Bets 131 161Reconciling items(1) 27 32
Total stock-based compensation $ 1,436 $ 1,846
Operating income (loss), excluding stock-based compensation(2):Google $ 8,022 $ 9,536Other Bets (1,082) (927)Reconciling items(1) (124) (124)
Total income from operations, excluding stock-based compensation $ 6,816 $ 8,485
Capital expenditures:Google $ 1,787 $ 2,888Other Bets 193 504Reconciling items(3) 122 (314)
Total capital expenditures $ 2,102 $ 3,078
Depreciation, amortization, and impairment:Google $ 1,313 $ 1,586Other Bets 70 101 Reconciling items(1) 21 0
Total depreciation, amortization, and impairment $ 1,404 $ 1,687(1) Reconciling items are primarily related to corporate administrative costs and other miscellaneous items that are not allocated to individual
segments.(2) For purposes of segment reporting, we define SBC as awards accounted for under FASB ASC Topic 718 that we expect to settle in stock.
SBC for segment reporting does not include expenses related to awards that we expect to ultimately settle in cash.(3) Reconciling items are related to timing differences of payments as segment capital expenditures are on accrual basis while total capital
expenditures shown on the Consolidated Statements of Cash Flows are on cash basis and other miscellaneous differences.
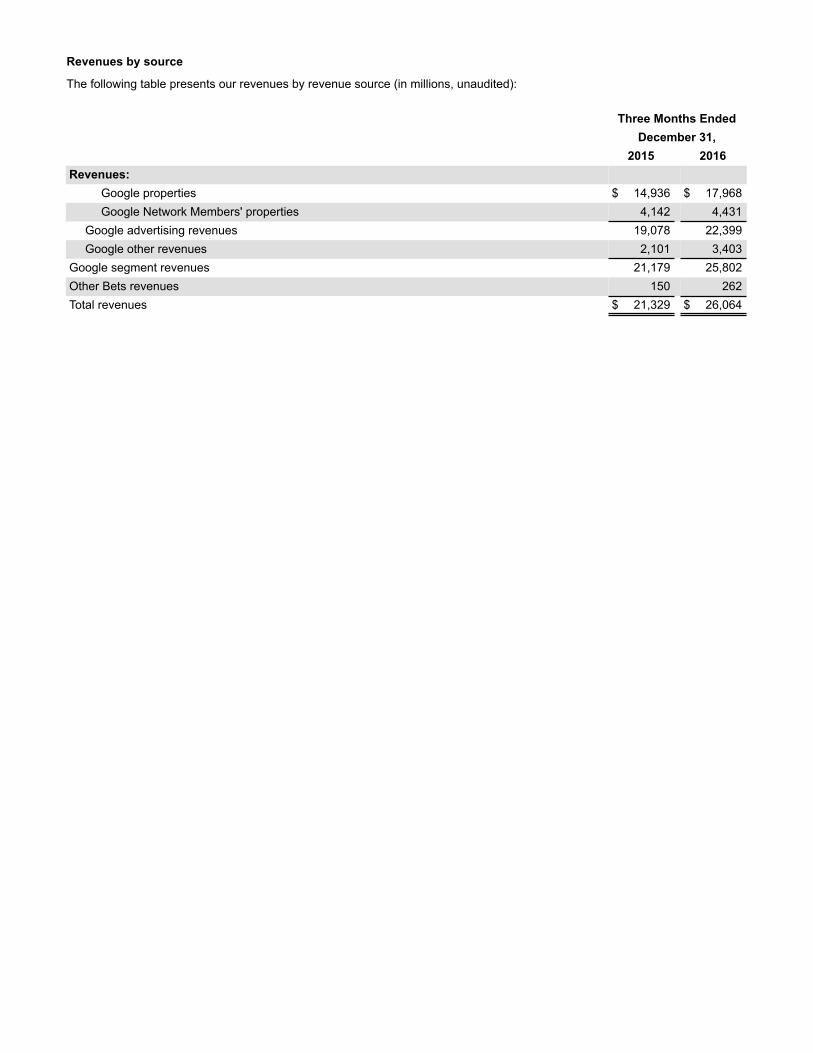
Revenues by source
The following table presents our revenues by revenue source (in millions, unaudited):
Three Months EndedDecember 31,
2015 2016Revenues:
Google properties $ 14,936 $ 17,968Google Network Members' properties 4,142 4,431
Google advertising revenues 19,078 22,399Google other revenues 2,101 3,403
Google segment revenues 21,179 25,802Other Bets revenues 150 262Total revenues $ 21,329 $ 26,064