
GOODWOOD INC.
22
GOODWOOD INC. THE GOODWOOD FUNDS 2018 Annual Report Twenty-Third Edition
Transcript of GOODWOOD INC.

GOODWOOD INC.
THE
GOODWOOD
FUNDS
2018 Annual Report
Twenty-Third Edition

-1-
GOODWOOD INC.
2018 Annual Report
I am pleased to submit the 23rd edition of the Goodwood Annual Report and would like to thank
our co-investors for their continued support and confidence. For over 23 years, the objective of
the Annual Letter has been to report on our year-end investment results, analyze and explain how
the Goodwood portfolios have succeeded or failed and provide our investors with an outlook on
the year ahead.
The investment objectives for the Goodwood Funds remain unchanged. We aim to generate
above average, risk-adjusted, long-term rates-of-return by opportunistically investing in
undervalued, misunderstood securities at all levels of the capital structure. This strategy can
result in short-term return volatility but, over the long-term, we believe will generate above-
average rates-of-return. As significant investors in our own strategies, this unique and long-term
perspective aligns our interests and motivates our actions.
Investment Awards:
In the Fall of 2018, Goodwood announced that the Goodwood Milford Fund LP received another
award at Alternative IQ’s Canadian Hedge Fund of the Year Awards hosted by KPMG LLP. The
Goodwood Milford Fund LP and Goodwood Milford Fund Trust utilize a defensive, yield-
oriented investment approach. This strategy has generated above average historical rates-of-
return with low monthly return volatility. The 2018 investment industry award serves as
continued validation of the portfolio strategy and investment approach.
• 2018 Canadian Hedge Fund Awards – 3rd Place, Best 5 Year Annualized Return
• 2017 Canadian Hedge Fund Awards – 1st Place, Best 5 Year Annualized Return
• 2016 Canadian Hedge Fund Awards – 2nd Place, Best 5 Year Sharpe Ratio
• 2015 Canadian Hedge Fund Awards – 2nd Place, Best 5 Year Sharpe Ratio
• 2014 Canadian Hedge Fund Awards – 2nd Place, Best 5 Year Annualized Return
• 2012 Canadian Hedge Fund Awards – 2nd Place, Best 3 Year Sharpe Ratio
• 2012 Canadian Hedge Fund Awards – 2nd Place, Best 3 Year Annualized Return
2018 Net Annualized Investment Returns for the Goodwood Funds (since inception):
• Goodwood Fund (Oct, 1996) +7.5%
• Goodwood Capital Fund (Dec,1999) +3.6%
• Goodwood Milford Fund LP (Jan, 2006) +11.9%
The Goodwood Funds use alternative strategies which seek to maximize risk-adjusted
investment returns. Each Fund’s approach is unique and customized to the respective investment
objective. Therefore, an annual review of each Funds’ objective is encouraged before reading the
Annual Report.

-2-
Diversified Fixed Income Strategies:
Our pooled fixed-income funds are the Goodwood Milford Fund LP and Goodwood Milford
Fund Trust (RSP eligible) (the “Goodwood Milford Funds”). The core investment strategy of the
Goodwood Milford Funds is to invest in corporate bonds that provide higher income and capital
gains through credit upgrades or other credit enhancing events. Corporate bonds tend to carry
less duration exposure which is beneficial in a rising interest rate environment. To further reduce
portfolio risk, the Goodwood Milford Funds can short sell treasury bonds to isolate credit term
premiums (i.e., spreads between treasury and non-treasury securities). To enhance total risk-
adjusted returns, the Goodwood Milford Funds may allocate a portion of its assets into long/short
equity positions (including preferred shares).
As an alternative to the Goodwood Milford Funds, Goodwood offers institutional clients such as
pensions, foundations, endowments and private individual investors with customized segregated
management accounts. The segregated accounts have the advantage of custom tailoring the
portfolio to fit unique investment objectives. We start our process with an in-depth discussion
about investment goals, objectives, risk tolerance, tax situation and liquidity needs. We
customize solutions tailored to unique investment requirements. Our investment objective is to
maximize total return in any interest-rate and credit spread environment by investing in a diverse
portfolio of corporate debt and high dividend equities. Our approach focuses on the preservation
of capital through extensive and rigorous investment analysis on a position and portfolio basis.
Diversified Equity Strategies:
Our pooled equity strategies include the Goodwood Fund and Goodwood Capital Fund. These
value-based, bottom-up, special situation funds provide investors with exposure to one of the
more inefficient markets within the broader North American equity market. The investment
strategies cannot be replicated by passive or quantitative vehicles. Our company-specific
approach is not dependent on the markets moving higher, but rather the company’s ability to
reprice or unlock intrinsic or latent value. Goodwood's equity mandates have a long track record
of investment success through a concentrated, company-specific and event-driven approach, with
a focus on undervalued public securities. We remain focused on business fundamentals rather
than speculating and investing in unproven business models.
The Goodwood Fund's investment objective is to maximize long-term return through the
purchase and short sale of exchange-listed and/or over the counter quoted securities using a
bottom-up, company-specific portfolio management approach. The portfolio is concentrated with
8-10 core positions typically representing over 75% of the portfolio. The value-oriented, special
situations stock picking strategy allows the Goodwood Fund to focus on a limited number of
ideas. These ideas are believed to offer superior return potential over the long-term.
The Goodwood Capital Fund is a long-only strategy that seeks to provide capital appreciation
and long-term growth of capital by investing in common stocks of North American small to
medium-sized companies. The capital is invested in a mix of high-quality capital compounding
businesses and special situation strategies. The portfolio is also relatively concentrated with 20-
25 positions. The Fund strategy is designed to generate an idiosyncratic risk/return profile with
low correlation to broader equity markets or macro factors.

-3-
Concentrated Special Situation Strategies:
Goodwood SPValue Fund LP is a special purpose vehicle structured to pursue singular and
unique investment opportunities. The investment objective is to generate attractive total returns
through select investments in companies, deemed by us, to be undervalued and that offer the
potential of being positively influenced by our active involvement in seeking to implement
changes in the areas of corporate governance, capital allocation, management and, strategic and
operational issues and other related activities. (see Medexus Pharmaceuticals Inc. commentary
within Peter Puccetti’s 2018 Goodwood Fund Annual Report as an example of this concentrated
special situation opportunity).
Once again, we thank you for your continued support and confidence, and I look forward to
discussing the 2018 results and our 2019 outlook in person.
Respectfully submitted,
Curt Cumming
President
Goodwood Inc.
(416) 203-2022
April 10, 2019
The information contained herein is drawn from sources believed to be reliable but the accuracy or completeness of
the information is not guaranteed. The opinions expressed are based upon our analysis and interpretation of these
particulars and are not to be construed as a solicitation or an offer to buy or sell the securities mentioned herein. The
Goodwood Funds and/or the principals, officers, directors, employees of Goodwood Inc. may have a position in the
securities mentioned herein and may make purchase and/or sales of these securities from time to time. Our
valuations may contain forward-looking information which is subject to change. Actual results or performance may
differ materially from those expressed or implied in this document as a result of unforeseen events and their effects
on our valuations and opinions. Principals of Goodwood Inc. may, from time to time, accept officer positions and/or
directorships from companies unrelated to Goodwood Inc. In this circumstance, such companies would be
considered under relevant securities law to be “related” or "connected issuers" to Goodwood Inc. or to Funds
managed by Goodwood Inc. Currently, there are no "connected issuers" in relation to Goodwood Inc. and/or the
Funds managed by Goodwood Inc. Furthermore, Goodwood Inc., or an affiliate of Goodwood Inc., may provide
services to and receive compensation from issuers in which the Funds are invested. Goodwood Management
Services Ltd., an affiliate of Goodwood Inc., entered into a 5 year Consulting Agreement with Polaris Infrastructure
Inc. (formerly Ram Power Corp) dated May 13, 2015. and, Goodwood Inc. entered into a 4 year Consulting
Agreement with Medexus Pharmaceuticals Inc. (formerly Pediapharm Inc.) dated October 16, 2018. Goodwood Inc.
has adopted appropriate policies and procedures to address conflicts of interest with respect to connected issuers.

-4-
GOODWOOD FUND
2018 Annual Report
To the Unitholders of the Goodwood Fund:
For the year ending December 31, 2018, the Goodwood Fund’s (the "Fund") net asset value
(“NAV”) per Class “A” units and Class “B” units both decreased by -16.6%, while the NAV per
Class “F” units decreased by -15.7%. The S&P/TSX Composite Total Return Index ("TSX")
decreased by -8.9% in the same period.
From October 31, 1996 (commencement of the offering of the Fund Class “A” units) through to
December 31, 2018, the Fund has returned +7.5% per annum net (after all fees) versus the TSX's
per annum return of +7.1%.*
No distributions were paid on December 31, 2018.
The Fund's 2018 audited financial statements are attached for your review.
During 2018 (based on month end figures), the Fund averaged an 102.1% invested position (i.e.,
market value of long positions plus market value of short sale positions as a percentage of the
Fund’s equity). At one extreme, the Fund was 118.6% invested, composed of 91.3% long and
27.3% short, leaving a “net market exposure” (i.e., longs minus shorts as a percentage of the
Fund’s equity) of 64.0%. At the other extreme, the Fund was 90.0% invested, or 90.0% long
and 0.0% short for a net market exposure of 90.0%.
All figures in Canadian dollars unless otherwise noted. “Fund” refers to just the Goodwood
Fund while “Funds” refers to the Goodwood Fund, Goodwood Capital Fund, Goodwood
Milford Fund, Goodwood Milford Fund Trust and other investment pools that Goodwood Inc.
manages.
*The indicated rates of return are the historical total returns over the periods noted, including changes in unit value
and reinvestment of all distributions. Performance returns in this report are calculated for the founding Class of
Units for each respective Fund. These indicated rates of return are net of all management fees, expenses and
performance incentive fees and do not take into account any redemption charges that may have been payable by
redeeming unitholders, which would have reduced the returns of redeeming unitholders in certain circumstances.
Please refer to the Offering Memorandum or Prospectus for details concerning the redemption fee schedule
applicable to the Fund and other important information. In addition, performance data represents past performance
and is not necessarily indicative of future performance. Performance data from certain market indices (S&P/TSX
Composite Index, S&P/TSX SmallCap TR Index and FTSE TMX Canada Universe Corporate Bond Index) are
provided in this report for information purposes only. A comparison of the Funds’ performance to such market
indices is of limited use because the composition of the Funds’ portfolio may contain other securities not found in
the market index. As a result, no market indices are directly comparable to the results of the Funds and are displayed
for comparison purposes to the broad market. The Annual Reports are not recommendations or research but
rather commentaries of the Goodwood funds’ holdings. This communication is not a product of any research
department. Goodwood Inc. does not have a research department. Any views and/or commentary in this
communication is by the Author (Portfolio Manager of the Goodwood funds). This commentary is not a
recommendation and does not take into account whether any product or transaction is suitable for any particular
investor.

-5-
Goodwood Fund Position Commentary
As at the time of writing of this Annual Report and in keeping with its concentrated approach,
the Goodwood Fund has approximately 65.1% of equity invested in five noteworthy positions. A
few key investment points on each follow:
Great Canadian Gaming Corporation (“GC”, 19.4% Current Fund Weighting)
Complementing GC's already strong national gaming footprint (particularly in BC), over the last
couple of years GC won a meaningful share of the Ontario Lottery & Gaming Corporation's
("OLG") "bundles" specifically, the OLG East bundle, the West GTA bundle and the GTA
bundle. The financial impact of these material add-ons has begun to become evident to investors
leading to GC's share price performing well over the last couple of years. But, the reaction has
been tempered by both misguided (in our opinion) short sale reports and GC management's
historical tendency to be less forthcoming with investors than typical management teams of
public companies. We continue to believe that, between the significant additional gaming
capacity being brought on in these new operating assets (in an Ontario market that has been
underserved in a gaming sense compared to other jurisdictions) and the large real estate
redevelopment potential inherent in these bundles (particularly the GTA bundle's Woodbine
site), much stock price upside remains.
GC management and the Board have a history of judicious and sizeable share repurchases which
we think, in part, explains the absence of stock promotion exhibited by management historically
- if you're trying to buy back and cancel a lot of stock, you don't want to promote your prospects.
Since September 2018, GC has repurchased 3.6mm shares (increased remaining shareholders’
interests by 6.2%). During the quarter ending December 31, 2018: 3,167,052 shares at $48.69 per
share and another 136,810 after end of 2018 (up to March 5, 2019) at $48.49 per share. Since
-6-
2011, 34.4mm shares have been repurchased for $578mm (so an average of $16.80 per share).
With 58.1mm shares outstanding now that means GC has bought back and cancelled 37% of the
shares that would have been outstanding otherwise (again, at an average of $16.80/share versus
the current $49.52 share price!). It has been a huge win for we remaining shareholders and the
most recent buyback activity shows that management and the Board consider the current share
price unduly cheap.
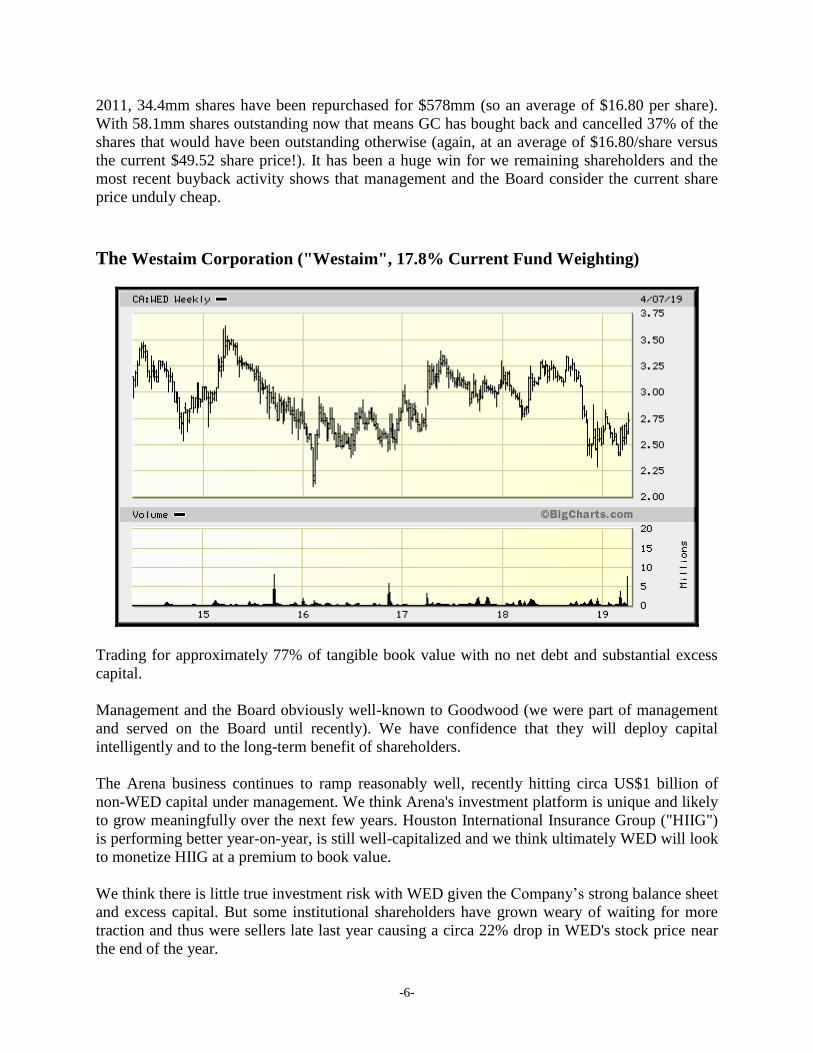
The Westaim Corporation ("Westaim", 17.8% Current Fund Weighting)
Trading for approximately 77% of tangible book value with no net debt and substantial excess
capital.
Management and the Board obviously well-known to Goodwood (we were part of management
and served on the Board until recently). We have confidence that they will deploy capital
intelligently and to the long-term benefit of shareholders.
The Arena business continues to ramp reasonably well, recently hitting circa US$1 billion of
non-WED capital under management. We think Arena's investment platform is unique and likely
to grow meaningfully over the next few years. Houston International Insurance Group ("HIIG")
is performing better year-on-year, is still well-capitalized and we think ultimately WED will look
to monetize HIIG at a premium to book value.
We think there is little true investment risk with WED given the Company’s strong balance sheet
and excess capital. But some institutional shareholders have grown weary of waiting for more
traction and thus were sellers late last year causing a circa 22% drop in WED's stock price near
the end of the year.

-7-
We believe, as Arena continues to ramp and if HIIG were to be monetized, we could see an
almost 100% rise in WED's stock price.
Polaris Infrastructure Inc. (“PIF”, 15.5% Current Fund Weighting)
PIF was the biggest detractor to the Fund’s performance in 2018 as a spike in political risk in
Nicaragua in 2018 (after 29 years of peaceful progress) caused a re-rating of PIF stock. This
despite the fact that affiliates of the World Bank are PIF’s financial partners in this geothermal
plant and that this plant, responsible for approximately 7% of power supply in Nicaragua, has
never operated as well as it is currently.
The stock has begun to recover as the political situation has quieted down. We believe it will
continue to recover as we think: i. the most likely outcomes politically are all favourable for PIF,
ii. the plant will continue to ramp production and free cash flow higher over the next year, iii.
PIF management have managed to begin diversifying with the addition of some Peruvian assets
recently (Peru is an in-favour investment jurisdiction for many of the largest infrastructure
investors worldwide) and, iv. PIF is trading for more than a 20% free cash flow yield at the
current share price.

-8-
Medexus Pharmaceuticals Inc. (“MDP”, 8.7% Current Fund Weighting)
The Fund’s position in MDP is split approximately 64% in common shares and 36% in the MDP
convertible debenture. The common share position has significant upside in our opinion and our
cost is much lower than the current share price as the Goodwood Fund originally had an
investment in MDP as a private position from years back. The convertible debenture has less
torque to the upside but is a safer instrument and gives us the relative certainty of a 6% annual
coupon plus an accretion to $125 (from $100 issue price) maturity in approximately 4.5 years
from now (so we have decent upside potential even if the stock price doesn’t go up).
MDP was rolled into the former Pediapharm Inc. (Pediapharm was publicly-traded) and at the
same time we played a meaningful role in the C$62 million capital raise to allow the new MDP
(i.e., name was changed from Pediapharm) to buy the US business of a German specialty
pharmaceutical company.
The combined entity is now running at circa C$90 million plus of revenues, has excess cash on
the balance sheet (circa C$30 million) and will be looking to in-license and/or acquire further
products. We believe the Company will get to north of C$20 million in EBITDA run rate within
two years which would imply an unusually low forward EV/EBITDA multiple of about 3X.
We feel the 12 year right-of-first-refusal that was negotiated with the German company and
which gives MDP the opportunity to license additional products for North America is potentially
very lucrative and not currently in our internal forecast.
We were very happy with the high quality, healthcare-focused specialty institutional investors
who participated on the financing and, in one case, agreed to take one of our Board seats and
become Chairman of the Board (Peter van der Velden, the managing partner of Lumira Ventures
the former MDS Health Ventures).

-9-
AMP Solar Group (“AMP”, 4.0% Current Fund Weighting)
AMP remains a private entity which we carry in the Fund at a C$30 million valuation (i.e., for
100% of AMP). We have no liquidity on our investment yet but our original cost for the equity is
zero and management's plans include either an IPO or a corporate sale within the next couple of
years.
AMP's latest financing package, supplied by one of the Walton family offices - Zoma Capital,
allows AMP to accelerate development of its international portfolio of solar power sites thereby
driving greater economic value for AMP shareholders.
Two years ago AMP made a small non-core investment in private, UK-based, Faraday Grid
Limited ("Faraday") based on AMP management's relationship with Faraday management and
knowledge of Faraday's opportunity set. In the last few months, third party investors have put
meaningful additional amounts of capital into Faraday at valuation levels that imply a circa C$84
million valuation on AMP's small initial investment.
Prior to the potential Faraday investment value being illustrated, AMP had received last year a
multi-million dollar investment from Adam Neuman, the co-founder and CEO of WeWork
(WeWork in turn is backed in part by Japanese multi-billionaire, Masayoshi Son of Softbank),
which values AMP at approximately C$250 million. As well, AMP has recently received a circa
C$5 million investment from a very successful, former Bay Street fund manager also at a
valuation level approximating Adam Neuman's.
At a C$250 million valuation plus the C$84 million implied value of AMP's interest in Faraday
(so C$334 million total), our AMP position would result in an approximate 40% gain for the
whole Fund. But, AMP has to execute well on its current pipeline for all this potential value to
come through.
Respectfully submitted,
Peter Puccetti, CFA
Chief Investment Officer
Goodwood Inc.
April 10, 2019

-10-
GOODWOOD CAPITAL FUND
2018 Annual Report
To the Unitholders of Goodwood Capital Fund:
For the year ending December 31, 2018, the Goodwood Capital Fund’s (the "Capital Fund") net
asset value (“NAV”) per Class “A” unit decreased -13.3% while the NAV per Class “F” unit
decreased by -12.3%. The S&P/TSX Composite Total Return Index ("TSX") decreased -8.9%
and the S&P/TSX SmallCap Total Return Index (“SmallCap Index”) decreased -18.2% in the
same period.*
From December 23, 1999 (commencement of the offering of the Capital Fund Class “A” units)
through to December 31, 2018, the Capital Fund has returned +3.6% per annum net versus the
TSX's per annum increase of +5.5%.
No distributions were paid on December 31, 2018.
The Capital Fund's 2018 audited financial statements are attached for your review.
For a more detailed discussion of Goodwood Inc.’s investment philosophy and information
regarding the Capital Fund’s core holdings, please refer to the Annual Management Report of
Fund Performance available on SEDAR (www.sedar.com) or request a copy of the Goodwood
Annual Report by emailing [email protected].
Please feel free to call if you have any questions, thoughts or comments.
Respectfully submitted,
Peter Puccetti, CFA
Chief Investment Officer
Goodwood Inc.
March 29, 2019
* The proportion of assets of the Fund invested in any particular market capitalization will vary and may include a
large portion invested in small-cap issuers. The S&P/TSX Composite Total Return Index is a broad-based market
capitalization weighted index of the largest, most widely held stocks traded on the Toronto Stock Exchange. The
S&P/TSX SmallCap Total Return Index provides an investable index for the Canadian small cap market. These
indices include reinvestment of dividends and capital gains. A comparison of the Fund’s performance to such
market indices is of limited use because the composition of the Fund’s portfolio may contain other securities not
found in the market index. As a result, no market indices are directly comparable to the results of the Fund. Note
that the indicated rates of return are the historical total returns over the periods noted, including changes in unit
value and reinvestment of all distributions. These indicated rates of return are net of all management fees, expenses
and performance incentive fees and do not take into account any redemption charges that may have been payable by
redeeming unitholders, which would have reduced the returns of redeeming unitholders in certain circumstances.
Please refer to the Prospectus for details concerning the redemption fee schedule of the Fund and other important
information. In addition, note that performance data represents past performance and is not necessarily indicative of
future performance.

-11-
GOODWOOD MILFORD FUND
2018 Annual Report
To the Unitholders of the Goodwood Milford Fund:
For the year ending December 31, 2018, the Goodwood Milford Fund’s (the "Fund") net asset
value (“NAV”) per “Class S” unit decreased by -5.9%. The S&P/TSX Composite Total Return
Index ("TSX") decreased by -8.9% in the same period. The FTSE TMX Canada Universe Bond
Index returned +1.4% in 2018.
From January 1, 2006 (commencement of the offering of the Fund Class “S” units) through to
December 31, 2018, the Fund has returned +11.9% per annum net (after all fees) versus the
TSX's per annum return of +4.8%.
The Fund's 2018 audited financial statements are attached for your review.
During 2018 (based on month end figures), the Fund averaged a 220.8% invested position (i.e.,
market value of long positions plus market value of short sale positions as a percentage of the
Fund’s equity). At one extreme, the Fund was 251.7% invested, composed of 225.2% long and
26.6% short, leaving a “net market exposure” (i.e., longs minus shorts as a percentage of the
Fund’s equity) of 198.6%. At the other extreme, the Fund was 177.3% invested, or 143.9% long
and 33.3% short for a net market exposure of 110.6%.
The Fund’s investment focus is on creating investment return from income generating fixed
income securities and capital gains by recognizing companies whose bonds will rise in price as a
result of improving credit quality. We forecast improvements in credit quality by analyzing
fundamental bottom up factors and watch for improvements in corporate performance,
implementation of successful new business lines, asset sales, deleveraging and equity raises.
*The indicated rates of return are the historical total returns over the periods noted, including changes in unit value
and reinvestment of all distributions. These indicated rates of return are net of all management fees, expenses and
performance incentive fees and do not take into account any redemption charges that may have been payable by
redeeming unitholders, which would have reduced the returns of redeeming unitholders in certain circumstances.
Performance returns above are calculated for the founding Class of Units for the Goodwood Milford Fund LP -
Class S Units. The Goodwood Milford Fund Trust was launched in May 2017 and has the same investment strategy
as the Goodwood Milford Fund LP. Other class or series, including the Goodwood Milford Fund Trust may charge
different fees and/or have different holdings and therefore returns between classes and Funds may vary. Goodwood
Inc. became the Investment Manager of the Goodwood Milford Fund on October 1, 2013 and Chris Currie, CFA
joined Goodwood Inc.’s investment team continuing as portfolio manager for the Fund. There will be no change to
the investment strategy of the Fund. Please refer to the Offering Memorandum for details and other important
information. In addition, performance data represents past performance and is not indicative of future performance.
Performance data from certain market indices (S&P/TSX Composite, FTSE TMX Canada Universe Corporate Bond
Index and the iShares Canadian Corporate Bond ETF) are provided in this report for information purposes only. A
comparison of the Fund’s performance to such market indices is of limited use because the composition of the
Fund’s portfolio may contain other securities not found in the market index. As a result, no market indices are
directly comparable to the results of the Fund. The Annual Reports are not recommendations or research but
rather commentaries of the Goodwood funds’ holdings. This communication is not a product of any research
department. Goodwood Inc. does not have a research department. Any views and/or commentary in this
communication is by the Author (Portfolio Manager of the Goodwood funds). This commentary is not a
recommendation and does not take into account whether any product or transaction is suitable for any particular
investor.

-12-
The Goodwood Milford Fund
The Goodwood Milford Fund Limited Partnership (“the Fund”) and the RRSP eligible version of
the Fund, the Goodwood Milford Fund Trust (hereinafter referred to as “the Funds” or
“Goodwood Milford Funds”) are yield-oriented investment funds which seek to maximize
capital appreciation and income by investing primarily in Canadian corporate bonds and to a
lesser extent dividend paying equity securities. Both Funds currently offer a quarterly cash
distribution of 4% on an annualized basis. To achieve its income goals the Funds invest in the
following asset classes: fixed income including corporate bonds, high yield bonds, government
bonds, preferred shares and equities. The Funds have a flexible investment strategy which may
include the use of other investment techniques such as leverage, to increase yield and short
selling to protect capital. Within the fixed income segment of the portfolio, the Funds have the
ability to shift the risk/reward profile by allocating investments between government bonds and
higher yielding, lower rated bonds. The investment strategy has historically been focused on the
corporate bond sector as the Manager is attracted to the higher coupons available. The Manager
also uses a value approach, similar to other Goodwood Funds, where fundamental bottom-up
analysis is used to identify opportunities to generate capital gains by selecting securities which
we believe will improve in credit quality from any combination of improving business
fundamentals, equity deleveraging, sales of subsidiaries or assets, mergers and credit rating
upgrades.
The Fund generated a net -5.9% return in 2018 (after all fees) underperforming the iShares Core
Canadian Universe Bond ETF and the iShares Canadian Corporate Bond ETF which generated
+1.3% and +0.6% respectively.
Comments on Asset Classes
Investment Grade Corporate Bonds
Investment grade corporate bonds underperformed Government of Canada bonds in 2018
generating a +1.10% return vs +1.53% for Canada’s as measured by the FTSE TMX Canada
Universe Bond Index. The first half of 2018 was marked by three Bank of Canada rate increases
which kept Canada yields range bound until August. Investment grade spreads gradually
widened during this period. In September and October, we saw a sharp sell-off in Canada’s and
investment grade corporates as the fixed income market digested the US Federal Reserve’s
strategy of reducing its balance sheet holdings of fixed income securities and Chairman Powell’s
comments that the Federal Reserve was a long way from neutral in its interest rate policy. There
was a sharp reversal in risk appetite in the last two months of 2018 as the markets focused on the
escalating China-US trade war and its potential negative impact on world growth. This caused a
strong rally in Federal government bonds, a sell-off in stocks and spread widening and
underperformance for investment grade corporates. As we start 2019, spreads have rallied
strongly and investment grade corporate bonds have outperformed.

-13-
High Yield Bonds
High yield prices as measured by the US Index ETF “HYG” (iShares iBoxx $ High Yield
Corporate Bond ETF) exhibited range bound pattern until the October to December equity
market sell off in 2018. During Q4 2018 investors penchant to sell all risk related assets took
HYG price down over -7% in the quarter, which resulted in a -7.06% annual loss for the HYG in
2018.
In Canada, the BBB corporate segment of the FTSE TMX Canada Universe Corporate
underperformed with a return of +1.00% for the year. In the Fund we sold a number of high yield
bonds reducing our weighting to this asset class from a high of 68.21% in June to 42.16% as at
December 31, 2018.
Preferred Shares
Preferred shares were weak performers in 2018. After generating coupon returns from January to
October, preferred shares were caught up in the equity market sell off from October to December
2018. The Canadian preferred share index “TXPR” (S&P/TSX Preferred Share Index) was down
-11.17% in this period and generated an annual -12.21% return for 2018. Unlike stocks and high
yield bonds which recovered sharply in January 2019, preferred shares remained weak in the first
quarter of 2019, recovering about 1/5th of their losses to date.
Equities
It was a challenging year for both the TSX and the Dow Jones Industrial Average (“Dow”)
indices. The TSX lost -8.88% in 2018 and the Dow lost -3.48%. The fourth quarter was the
weakest quarter in 2018 for both indices and drove the overall year’s loss. The fourth quarter sell
off was driven by escalating tensions in the China-US trade war which manifested in each
country imposing increasing levels of tariffs on each other’s imports. The tariffs were widely
seen as potentially slowing world growth which would negatively impact stocks. Raising interest
rates in the US were another concern as was impact of the US Federal Reserve’s plan to reduce
its balance sheet holdings of fixed income securities.
We have seen a strong rally in equities in the first three months of 2019 which has brought a
number of stocks close to the price levels of the summer of 2018 which we believe is positive for
the outlook for equity markets.

-14-
Comments on Goodwood Milford Fund LP and Goodwood Milford Fund Trust
Holdings
AltaGas Canada Inc. 4.26% December 5, 2028 (“AltaGas Canada”, 5.96% Current
Fund Weighting)
The Funds investment in AltaGas Canada arose out of the spin off in October 2018 of AltaGas
Canada from its parent AltaGas Ltd. AltaGas Ltd. is under rating agency and market pressure to
reduce its leverage. As one component of its deleveraging plan, AltaGas Ltd. sought to monetize
its investment in certain Canadian hydro and natural gas pipeline assets by forming AltaGas
Canada and selling off a portion of its investment to the public. The AltaGas Canada equity issue
was initially not well received by the market place primarily as a result of the high valuation. A
subsequent repricing lower resulted in a successful placing of the equity issue in October of
2018. When AltaGas Canada began marketing its first investment grade bond issue (BBB H) it
faced similar skepticism as investors recalled the difficulties in placing the equity issue. The
issue had to be favourably priced to be sold successfully. The favourable pricing – a spread of
200 basis points for a BBB H issue – was, in our minds, an investment opportunity. The issue
has subsequently traded up to $106, a 6% capital gain for the Funds in addition to the 4.26%
coupon.

-15-
Yellow Pages Limited 10% due November 1, 2022 (“Yellow Pages”, 1.39% Current
Fund Weighting)
Yellow Pages has been a long-time issuer in the high yield market. The once ubiquitous yellow
phone book has been steadily disappearing from consumers homes and is being replaced by
internet search engines and apps on increasingly sophisticated smart phones. In the face of these
steady declines, Yellow Pages’ challenge has been to develop a digital platform offering
advertising to small and medium sized businesses to offset the steadily declining printed phone
book business. Even as revenues are declining as it makes this transition, Yellow Pages generates
a sizable amount of cash at high margins. This free cash flow generation makes the bond an
interesting investment as the bond has a cash flow sweep feature whereby 100% of defined
excess flow per year is set aside to redeem bonds at $100. Note that the bonds were issued at
$98, have a coupon of 10% and mature in November 2022. To date, Yellow Pages has paid down
approximately 45% of the outstanding principal from $315mm to $170mm currently. The bond
is rated B+ by S&P and BB L by DBRS.

-16-
Jamieson Wellness Inc. (“Jamieson”, 2.68% Fund Weighting)
Jamieson is a Canadian based health and wellness products company that is the number one
brand in Canada in vitamins, minerals and supplements. Jamieson was founded in Canada in
1922. The company markets its products through grocery, drug store, big box store and internet
channels and sells its products in over 40 countries. The Fund bought its position in Jamieson’s
IPO in July 2017 at a price of $15.75 per share. The stock closed on December 31, 2018 at
$21.33 per share. We like Jamieson as it has shown consecutive years of revenue growth, has
been a market innovator, and has, we believe, a number of opportunities ahead of it. Our view is
based on the belief that as world incomes increase, more people will be attracted to the healthy
lifestyle that has become so prevalent in Western countries. China is, in particular, an attractive
opportunity for Jamieson as the company grows its product portfolio there. Jamieson is one of
the few foreign manufacturers that are allowed to apply for product certifications from China’s
FDA. Certifications allow products to be sold in the Chinese domestic market in-store and
online.

-17-
Artis REIT 6% Series I Preferred Share (“Artis”, 1.95% Fund Weighting)
We own the Artis REIT Series I preferred shares in the Fund for a few of reasons. The first is
that the company has embarked on a strategy of deleveraging and refocusing its portfolio of real
estate assets. The company is attempting to reduce its exposure to Western Canada from 40% to
15% by selling assets in Western Canada. Artis has also successfully refocused its portfolio into
the Southern US, buying properties in Arizona, Colorado and Texas. US assets now make up
45% of its portfolio, a significant shift away from its Western Canada base. We believe these
initiatives are increasing the credit quality of the company. The second factor we like is the
structure of the preferred in that investors are guaranteed (unless redeemed on the coupon reset
date) the greater of 6% or a coupon equal to 5 year Canada’s plus 393 basis points. We don’t
think Artis will have the financial resources to call the $125mm sized issue in April 2023 so that
investors will get the benefit of a minimum 6% coupon for another 5 years. The third positive
feature is that Artis in February of 2019 increased its liquidity by raising $250mm of a 2 year
debentures with a coupon of 3.674%. The unsecured debenture was given an investment grade
rating of BBB L by DBRS.

-18-
Province of Alberta 1.25% June 1, 2020 (“Alberta” 2.85% Fund Weighting)
We shorted the Province of Alberta 1.25% June 1, 2020 debenture in the Fund as a hedge against
rising interest rates and a potential capital gains generation opportunity if spreads widened. As an
interest rate hedge the bond’s low interest coupon of 1.25% gives us a low cost of borrowing.
The Province of Alberta bond was an effective interest rate hedge for the first ten months of
2018 as interest rates rose steadily from January to October. During this period the Bank of
Canada raised short term interest rates 3 times. An escalating trade war between the US and
China that intensified in the Fall, gave investors concerns that world growth would be negatively
impacted. As a result, interest rates started to drop through the fall reducing the effectiveness of
the short as a hedge. However, concerns about a potential slowdown in world trade negatively
impacted the US crude oil price, which fell from US$75 in October 2018 to US$45 in December.
The drop in the US oil price and the corresponding drop in the Canadian oil price resulted in a
significant spread widening (from 8.5bps to 20bps) for this Alberta bond versus its Government
of Canada maturity date comparable.
Thank you for investing with us in 2018, we look forward to 2019.
Respectfully submitted,
Chris Currie, CFA Curt Cumming
Portfolio Manager President
Goodwood Inc. Goodwood Inc.
(416) 203-2027 (416) 203-2522
[email protected] [email protected]
March 28, 2019

-19-
GOODWOOD MILFORD FUND TRUST
2018 Annual Report
To the Unitholders of the Goodwood Milford Fund Trust:
For the year ending December 31, 2018, the Goodwood Milford Fund Trust’s (the "Fund") net
asset value (“NAV”) per “Class A” unit decreased by -6.2%. The S&P/TSX Composite Total
Return Index ("TSX") decreased by -8.9% in the same period. The FTSE TMX Canada
Universe Bond Index returned +1.4% in 2018.
From May 31, 2017 (commencement of the offering of the Fund Class “A” units) through to
December 31, 2018, the Fund has returned -3.9% per annum net (after all fees) versus the TSX's
per annum return of -1.3%.
The Fund's 2018 audited financial statements are attached for your review.
During 2018 (based on month end figures), the Fund averaged a 189.0% invested position (i.e.,
market value of long positions plus market value of short sale positions as a percentage of the
Fund’s equity). At one extreme, the Fund was 214.6% invested, composed of 190.5% long and
24.2% short, leaving a “net market exposure” (i.e., longs minus shorts as a percentage of the
Fund’s equity) of 166.3%. At the other extreme, the Fund was 153.8% invested, or 130.7% long
and 23.1% short for a net market exposure of 107.6%.
The Fund’s investment focus is on creating investment return from income generating fixed
income securities and capital gains by recognizing companies whose bonds will rise in price as a
result of improving credit quality. We forecast improvements in credit quality by analyzing
fundamental bottom up factors and watch for improvements in corporate performance,
implementation of successful new business lines, asset sales, deleveraging and equity raises.
*The indicated rates of return are the historical total returns over the periods noted, including changes in unit value
and reinvestment of all distributions. These indicated rates of return are net of all management fees, expenses and
performance incentive fees and do not take into account any redemption charges that may have been payable by
redeeming unitholders, which would have reduced the returns of redeeming unitholders in certain circumstances.
Performance returns above are calculated for the founding Class of Units for the Goodwood Milford Fund Trust-
Class A Units. The Goodwood Milford Fund Trust was launched in May 2017 and has the same investment strategy
as the Goodwood Milford Fund LP. Other class or series of the Goodwood Milford Fund Trust may charge different
fees and/or have different holdings and therefore returns between classes and Funds may vary. Please refer to the
Offering Memorandum for details and other important information. In addition, performance data represents past
performance and is not indicative of future performance. Performance data from certain market indices (S&P/TSX
Composite, FTSE TMX Canada Universe Corporate Bond Index, the iShares Core Canadian Universe Bond ETF
and the iShares Canadian Corporate Bond ETF) are provided in this report for information purposes only. A
comparison of the Fund’s performance to such market indices is of limited use because the composition of the
Fund’s portfolio may contain other securities not found in the market index. As a result, no market indices are
directly comparable to the results of the Fund. The Annual Reports are not recommendations or research but
rather commentaries of the Goodwood funds’ holdings. This communication is not a product of any research
department. Goodwood Inc. does not have a research department. Any views and/or commentary in this
communication is by the Author (Portfolio Manager of the Goodwood funds). This commentary is not a
recommendation and does not take into account whether any product or transaction is suitable for any particular
investor.

-20-
The Goodwood Milford Fund Trust
The Goodwood Milford Fund Trust (“the Fund”) is the RRSP eligible version of the Goodwood
Milford Fund LP, the Fund (hereinafter referred to as “the Funds” or “Goodwood Milford
Funds”) are yield-oriented investment funds which seek to maximize capital appreciation and
income by investing primarily in Canadian corporate bonds and to a lesser extent dividend
paying equity securities. Both Funds currently offer a quarterly cash distribution of 4% on an
annualized basis. To achieve its income goals the Funds invest in the following asset classes:
fixed income including corporate bonds, high yield bonds, government bonds, preferred shares
and equities. The Funds have a flexible investment strategy which may include the use of other
investment techniques such as leverage, to increase yield and short selling to protect capital.
Within the fixed income segment of the portfolio, the Funds have the ability to shift the
risk/reward profile by allocating investments between government bonds and higher yielding,
lower rated bonds. The investment strategy has historically been focused on the corporate bond
sector as the Manager is attracted to the higher coupons available. The Manager also uses a value
approach, similar to other Goodwood Funds, where fundamental bottom-up analysis is used to
identify opportunities to generate capital gains by selecting securities which we believe will
improve in credit quality from any combination of improving business fundamentals, equity
deleveraging, sales of subsidiaries or assets, mergers and credit rating upgrades.
The Fund generated a net -6.2% return in 2018 (after all fees) underperforming the iShares Core
Canadian Universe Bond ETF and the iShares Canadian Corporate Bond ETF which generated
+1.3% and +0.6% respectively.

Goodwood
Fund
Goodwood
Capital Fund
Goodwood
Milford Fund LP
Goodwood
Milford Fund Trust
Strategy:
Long/Short
fundamental bottom-up
value oriented
Long-only
fundamental bottom-up
value oriented
Long/Short
fundamental corporate
credit with equity overlay
Long/Short
fundamental corporate
credit with equity overlay
Exposure:
Valuation/Liquidity:
Fund Type:
North America
Weekly & Monthly
Mutual Fund Trust
North America
Weekly & Monthly
Mutual Fund Trust
North America
Weekly & Monthly
Limited Partnership
North America
Weekly & Monthly
Unit Trust
Inception Date: October, 1996 December, 1999 January, 2006 May, 2017
RRSP Eligible: Yes Yes N/A Yes
Prime Broker/
Custodian:
National Bank
Independent Network
(NBIN Inc.)
National Bank
Independent Network
(NBIN Inc.)
National Bank
Independent Network
(NBIN Inc.)
National Bank
Independent Network
(NBIN Inc.)
Trustee/
General Partner:
Computershare Trust
Company of Canada
Computershare Trust
Company of Canada
Milford Capital
Management Partners Inc.
Odyssey Trust
Company
Fund Accounting: SS&C CommonWealth
Fund Services Ltd.
SS&C CommonWealth
Fund Services Ltd.
SS&C CommonWealth
Fund Services Ltd.
SS&C CommonWealth
Fund Services Ltd.
Auditor: KPMG, LLP KPMG, LLP KPMG, LLP KPMG, LLP
Legal Counsel: Borden Ladner Gervais,
LLP
Borden Ladner Gervais,
LLP
Borden Ladner Gervais,
LLP
Borden Ladner Gervais,
LLP
FundSERV Code: Class B – GWD022
Class F – GWD222
Class A – GWD001
Class F – GWD004
Available Upon
Request
Class A – GWD600
Class F – GWD601
Class AD – GWD602
Class FD – GWD603