Good Practice in Designing and Implementing National ... Monitoring Systems for Adaptation...Good...
80
Good Practice in Designing and Implementing National Monitoring Systems for Adaptation to Climate Change
Transcript of Good Practice in Designing and Implementing National ... Monitoring Systems for Adaptation...Good...

Good Practice in Designing and Implementing National Monitoring Systems for Adaptation to Climate Change


Good Practice in Designing and Implementing National Monitoring Systems for Adaptation to Climate Change
Prakriti Naswa,1 Sara Traerup,1 Claudia Bouroncle,2 Claudia Medellín,2 Pablo Imbach,2
Bastiaan Louman2 and Jason Spensley3
1 UNEP DTU Partnership, UN City Marmorvej 51, 2100 Copenhagen Ø, Denmark.2 Climate Change and Watersheds Programme, Tropical Agricultural Research and Higher Education Center3 UNFCCC Climate Technology Centre and Network, United Nations Environment Programme, UN City,
Copenhagen, Denmark.

Climate Technology Centre & Network (CTCN)UN CityMarmorvej 512100 CopenhagenDenmark, Phone +45 4533 5372http://www.ctc-n.org/
ISBN 978-87-93130-48-7
Design:Magnum Custom PublishingNew Delhi, [email protected]
Photo credits:Neil Palmer (CIAT)
A digital copy of this report can be downloaded from http://www.ctc-n.org/
This document may be cited as:P. Naswa, S. Traerup, C. Bouroncle, C. Medellín, P. Imbach, B. Louman and J. Spensley: Good Practice in Designing and Implementing National Monitoring Systems for Adaptation to Climate Change. Climate Technology Centre & Network, Denmark, 2015
Disclaimer:Mention of a commercial company or product in this document does not imply endorsement by UNEP or the authors. The use of information from this document for publicity or advertising is not permitted. Trademark names and symbols are used in an editorial fashion with no intention on infringement of trademark or copyright laws.
The views expressed in this publication are those of the authors and do not necessarily re-ect the views of the United Nations Environment Programme. We regret any errors or omissions that may have been unwittingly made.

3
Contents
List of Tables, Figures, and Boxes 5
Abbreviations 7
Foreword 9
1 Introduction 11
2 Monitoring and Evaluation of Climate Change Adaptation 13
2.1 Monitoring and Evaluation Processes 14
2.2 Stages of M&E Process 15
2.3 Process of Selecting Indicators 17
2.4 Criteria for Selecting Appropriate Indicators 18
2.5 ClassificationofIndicators 19
2.6 Challenges to Monitoring and Evaluation 21
2.6.1 Selecting the Right Indicators 21
2.6.2 Measuring the Baseline 21
2.6.3 Qualitative vs. Quantitative Indicators 22
2.6.4 Setting Intermediate Targets 22
2.6.5 Smart Indicators 22
2.6.6 Replicability 22
2.6.7 Efficiencyvs.Effectiveness 23
2.6.8 Time Period of Evaluation 23
2.6.9 Indicator Issues that are Distinctive at National Level 23
3 Monitoring and Evaluation Frameworks 25
3.1 General Overview of Approaches to M&E Frameworks for Climate Change Adaptation 25
3.1.1 Results-Based Monitoring and Evaluation 25
3.1.2 Logical Framework Approach 26
3.1.3 Monitoring and Evaluation Framework 27
3.1.4 Tracking Adaptation and Measuring Development 28
3.1.5 Robust Decision-Making 28
4
3.1.6 Opportunistic Impact Measurement 28
3.1.7 Outcome Mapping Approach 28
3.1.8 Objectives-Oriented Project-Planning (ZOPP) 29
4 Existing National-Scale Efforts to Monitor and Evaluate
Adaptation Policies and Strategies 31
4.1 Indicators used in National Monitoring Systems for Tracking Adaptation 33
4.2 Data 35
4.3 Resources 36
5 Monitoring and Evaluation Systems for Adaptation in the Latin American Region 39
5.1 Conceptual Frameworks used for M&E Systems in Latin America 42
5.2 Types of Indicators used in M&E systems in Latin America 44
5.3 IdentificationandSelectionofIndicators 47
5.4 Description of indicators and baselines 48
5.5 Implementation and sustainability of M&E systems 50
6 Emerging Lessons 53
7 References 55
Annex 1 Sector-Specific Indicators 61
Annex 2 Examples of Indicators for the Monitoring and Evaluation
of Climate Change Adaptation 63
Annex 3 Existing Frameworks 67
Annex 4 RBM Tracking Tool for Climate Change Adaptation Projects 69
Annex 5 Templates for M&E of Climate Change Adaptation 73
5
List of Tables, Figures, and Boxes
List of Tables
Table 1 Examples of various categories of indicator 20Table 2 Illustration of a simple logic model 27Table 3 Overview of existing national-level monitoring systems 31Table 4 Comparison of process-based indicators used to evaluate progress in adaptation in Finland and the United Kingdom 33Table 5 Kenya county-level institutional adaptive capacity indicators 34Table 6 Kenya national-level vulnerability indicators 35Table 7 National monitoring systems and data requirements 35Table 8 M&E systems related to climate change adaptation in Latin America selected for analysis 41Table 9 Sectors and issues considered with more emphasis on the M&E systems for adaptation to climate change in Latin America selected for analysis 42Table 10 Institutional functions for adaptation 43Table 11 Number of indicators assigned to different aspects of the adaptation process in the Latin American M&E systems analysed 45Table 12 Criteria utilised to select indicators from the M&E systems related to climate change adaptation in Latin America 48Table 13 Categories of information for the description of indicators in M&E systems related to climate change adaptation in Latin America 49
List of Figures
Figure 1 Example of a theory of change 15Figure 2 Illustration of a simple logic model 26Figure 3 Illustration of the monitoring and evaluation framework 27
List of Boxes
Box 1 Process, outcome, and impact indicators: an example of coastal city protection 20Box 2 Good practices for the design and operation of M&E systems for adaptation 40Box 3 Types of indicators for M&E systems and their relationship to adaptation processes 46


7
Abbreviations
ARIA Institutional Analysis on Adaptation to Climate Change
CICC Interministerial Commission on Climate Change, Mexico
ENCC-ARG Indicators of Climate Change with a Socioeconomic Approach – Argentina
ENCC-HND Indicators of Climate Change with a Socioeconomic Approach – Honduras
GEF Global Environment Facility
GTZ Gesellschaft für Technische Zusammenarbeit / German Technical Cooperation
HF Hailstones/Frost
HRF Heavy Rainfall and Floods
IACC Indicators for the Monitoring and Evaluation of the Adaptation to Climate Change
IIED International Institute for Environment and Development
M&E Monitoring and Evaluation
MDG Millennium Development Goals
NAC National Adaptive Capacity framework
NAP National Adaptation Plan
NAPA National Adaptation Programmes of Action
NCCAP National Climate Change Action Plan
NGO Non-governmental Organisation
NPBMF NationalPerformanceandBenefitsMeasurementFramework
OVI ObjectivelyVerifiableIndicator
PACC Programme of Adaptation to Climate Change
PANCC National Plan of Action on Climate Change
PCI Practical Concepts Incorporated
PECC Special Climate Change Program
PROAGRO Programme for Agricultural Sustainable Development
PSS Health Sector Plan for Climate Change Mitigation and Adaptation
RDM Robust Decision-Making
RBM Results-Based Management
8
RISE Response-Inducing Sustainability Evaluation
RVD Rainfall Variability and Drought
SERMANAT Ministry of Environment and Natural Resources, Mexico
SIRE Regional Environmental Information System
SLR Sea Level Rise
TAMD Tracking Adaptation and Measuring Development
UNDP United Nations Development Programme
UNEG United Nations Evaluation Group
UNHCR United Nations High Commissioner for Refugees
USAID United States Agency for International Development
ZOPP Zielorientierte Projektplanung / Objective-Oriented Planning

9
Foreword
Jukka UosukainenDirector, Climate Technology Centre and Network
Theextentandeffectivenessofinvestmentsmadeforadaptingtoachangingclimatewillhaveadefininginfluenceonhowwellcountriesareabletoachievetheirdevelopmentobjectivesinthenearandlongterm.Asthenegativeimpactofclimatechangeintensifiesandasinvestmentinclimatechangeadaptationactionincreases, it is crucial that rigorous systems are put in place for measuring the impacts of climate change and investment impacts over time. Doing so will strengthen the effectiveness of investments, and thereby mitigate the loss of life and livelihoods in the context of climate change.
Thankfully, an increasing number of countries are strengthening their systems for monitoring systems for climatechangeadaptation.There isagrowingwealthofactivity in thisfield.However,perhapsdue tocontextual diversity and the relative newness of the discipline of measuring and evaluation climate change adaptation, there isarangeofapproachesandmethodologies fordoingso.Perhapsasareflectionofthis increase in activity and assortment of methods, the Climate Technology Centre and Network (CTCN) is increasingly being requested by developing country authorities to share good practices and provide handsontechnicalassistanceinthisfield.Itishopedthatthispublicationcanbeausefulreferenceforgovernmentofficialsandtechnicalpractitionerswhoaredesigningsystemsformeasuringandevaluatingclimate change adaptation.
CTCN is the implementation arm of the UNFCCC’s technology mechanism, and is mandated to promote the accelerated transfer of environmentally sound technologies for low carbon and climate resilient development. CTCN is hosted by the United Nations Environment Programme (UNEP), in collaboration with the United Nations Industrial Development Organisation (UNIDO) and 12 independent, leading climate technology organisations located throughout the world. As mandated by the Conference of the Parties, and guided by our Advisory Board, the CTCN provides the following three core services:
i. technical assistance to accelerate the transfer of climate technologies, at the request of developing countries; ii. strengthening access to information and knowledge on climate technologies; and iii.fosteringcollaborationamongclimatetechnologydevelopers,usersandfinanciers.
This publication is a product of technical assistance being delivered in Colombia, at the request of their National Designated Entity to CTCN and in close partnership of national stakeholders including the Ministry of Environment and Sustainable Development, the Department of National Planning, the National Unit for Risk Management and the Institute for Hydrology, Meteorology and Environmental Studies, to support the development of the indicators for the national monitoring system for adaptation to climate change.Finally, it is my pleasure to thank the Government of Colombia for their leadership and innovation in the fieldofclimatechangeadaptationingeneralandtheefforttodevelopanindicatorssystemtocomplementthe National Plan for Adaptation to Climate Change. We are also deeply grateful to CTCN Consortium Partners, UNEP-DTU Partnership and CATIE, for their work in this publication and on climate change adaptation technologies more broadly.
Jukka Uosukainen
Jukka Uosukainen Director, Climate Technology Centre and Network Foreword The extent and effectiveness of investments made for adapting to a changing climate will have a defining influence on how well countries are able to achieve their development objectives in the near and long term. As the negative impact of climate change intensifies and as investment in climate change adaptation action increases, it is crucial that rigorous systems are put in place for measuring the impacts of climate change and investment impacts over time. Doing so will strengthen the effectiveness of investments, and thereby mitigate the loss of life and livelihoods in the context of climate change. Thankfully, an increasing number of countries are strengthening their systems for monitoring systems for climate change adaptation. There is a growing wealth of activity in this field. However, perhaps due to contextual diversity and the relative newness of the discipline of measuring and evaluation climate change adaptation, there is a range of approaches and methodologies for doing so. Perhaps as a reflection of this increase in activity and assortment of methods, the Climate Technology Centre and Network (CTCN) is increasingly being requested by developing country authorities to share good practices and provide hands on technical assistance in this field. It is hoped that this publication can be a useful reference for government officials and technical practitioners who are designing systems for measuring and evaluating climate change adaptation. CTCN is the implementation arm of the UNFCCC’s technology mechanism, and is mandated to promote the accelerated transfer of environmentally sound technologies for low carbon and climate resilient development. CTCN is hosted by the United Nations Environment Programme (UNEP), in collaboration with the United Nations Industrial Development Organisation (UNIDO) and 12 independent, leading climate technology organisations located throughout the world. As mandated by the Conference of the Parties, and guided by our Advisory Board, the CTCN provides the following three core services:
(i) technical assistance to accelerate the transfer of climate technologies, at the request of developing countries;
(ii) strengthening access to information and knowledge on climate technologies; and (iii) fostering collaboration among climate technology developers, users and financiers.
This publication is a product of technical assistance being delivered in Colombia, at the request of their National Designated Entity to CTCN and in close partnership of national stakeholders including the Ministry of Environment and Sustainable Development, the Department of National Planning, the National Unit for Risk Management and the Institute for Hydrology, Meteorology and Environmental Studies, to support the development of the indicators for the national monitoring system for adaptation to climate change.

11
1. Introduction
Climate change presents a new type of challenge for development. It is, by now, widely acknowledged that climate-change impacts amplify existing unfavorable conditions for developing countries (McCarthy et al. 2001). It is also acknowledged that developing nations are more vulnerable and have less adaptive capacity to confront such changes (Swart et al. 2003). Countries with limited resources, poor infrastructure and unstable institutions have generally little capacity to adapt and are highly vulnerable (Smit and Pilifosova 2001). These factors are intrinsically linked with those that promote sustainable development while at the same time aiming to improve living conditions and increase access to resources. Therefore, targeted development planning and strategies have important roles in strengthening the adaptive capacities of societies at various levels.
Adverse effects of climate change are determined not only by changes to climate, but also by the sensitivity of human and natural systems to these changes. The recognition of the exposure and sensitivity of systems to multiple climate-induced stresses implies that development frameworks will need to consider the links between sustainable development and climate change. Additionally, this will require climate change to be brought into development planning, for which it will be critical to acquire an understanding of what policies will work where and when. Implementing adaptation interventions is incomplete without knowing the progress of the intervention and how it enables the overall goal of building resilience to the changing climate to be reached. The monitoring and evaluation (M&E) of adaptive management practices, in simple words, are processes, tools and techniques that systematically and periodically measure and analyse the processes, outcomes and impacts of adaptation programme activities to achieve the intended objectives. Monitoring is "the routine collection and analysis of information to track progress against set plans and check compliance to established standards"(IFRC,2011).Evaluation,ontheotherhand, isdefinedas" the systematic investigation of the merit, worthorsignificanceofanobject" (Scriven, 1999). There is a growing body of literature emphasising the importance of the M&E of adaptation measures. Hence the need to develop relevant tools, mechanisms, frameworks and guidelines for the M&E of adaptation interventions in order to assess the relevance, results, processes and impacts of adaptation.
Monitoring and evaluation systems are ongoing exercises that can applied to a specific measure, aprogramme, a portfolio or a country. The magnitude of complexity in introducing such systems increase with level, that is, from the level of a single measure to a national level system. The timing and integration of theM&Esystemisveryimportant.WhiledevelopingasystemofM&Eindicatorsforaspecificmeasuretheoverall goal of the programme should be kept in mind. For a programme, the M&E system should be well integrated with the planning process, while the indicator system should be in place at the beginning of the programme, since it facilitates the processes and enables comparison. National-level indicator systems for M&E can be complicated as they act as if they have to provide an overall framework for different adaptation policies.
In this report, we identify, analyse and compare international good practices in the design and implementation ofnationalmonitoringandevaluatingindicatorsystemsforclimatechangeadaptation.Thisfirstchapterprovides an introduction to the context and key terminology in the domain of climate change adaptation and indicators for M&E of adaptation. The second chapter discusses the existing approaches to M&E, while Chapter 3 provides a general overview of approaches to M&E Frameworks for Climate Change Adaptation. Chapters 4 and 5 outline and discuss the application and relevance of existing frameworks for M&E in international and Latin American contexts.


13
2. Monitoring and Evaluation of Climate Change Adaptation
The perception of adaptation within the climate change literature is generally that it involves ‘adjustment in natural or human systems in response to actual or expected climate stimuli or their effects, which moderates harmorexploitsbeneficialopportunities’ (IPCC2001,p.982). Importantly, thisdefinition includesbothclimate variability and climate change. Failing to integrate adaptation into development planning and policies renders a country’s socio-economic systems vulnerable to climate change and can slow down its development initiatives.
The climate change debate has stimulated an increasing interest in measuring and analysing human vulnerability to climate change and potential initiatives to adapt to the negative impacts of these changes (Mertz et al. 2009a; Vincent 2007; Eakin and Luers 2006). Vulnerability to climate change impacts is the degree to which a system is susceptible and unable to cope with the adverse effects of climate change (IPCC 2007; Adger 2006). The key parameters of vulnerability are the stress to which a system is exposed, its sensitivity and its adaptive capacity. Thus, the vulnerability of, for example, a household will determine its ability to respond to and recover from negative climate change impacts. Hence the importance of decreasing vulnerability to climate change further emphasises the need for appropriate adaptation interventions.
Adaptation interventions have now become an integral part of plans and policies to deal with changing climate, but they are often also integrated into general development efforts. However, little evidence exists as yet on the success of these measures in reaching their intended objectives, and/or contributing to development, and/or mitigation efforts. One important step in making adaptation count is to design appropriate monitoring and evaluating mechanisms for adaptation investments that can contribute to evidence-based decision-making in the future. Whether an adaptation measure has produced desirable results or not, or if, the measure is in progress, whether it is on a desirable path or not are issues that can be tackled by M&E processes. In contrast to mitigation investments, each adaptation investment is unique, noteasilyreplicable,oftenbottom-up,verysite-specificanddifficulttoquantify.Whilethesecondaryandtertiarybenefitsofadaptationmaycutacrossvarioussectors,thedesign,implementationandimmediatebenefitsarespecifictoalocation.
There are many reasons why M&E should be incorporated as an integral part of adaptation intervention, some of which are as follows:
• Projections on climate change have a varying level of uncertainty, and adjustments may need to be made as more reliable information becomes available.
• M&E indicators help track the progress of the intervention as well as measure its effectiveness in achieving the desired objective.
• CriticalsuccessfactorsforanadaptationprogrammecanbeidentifiedthroughM&Eprocesses.
• Whenworkingwithina limitedpool of resources,M&Emechanismscanhelpefficiently allocateresourcesamongvariousprocessestobringaboutmaximumreturns.Sometimesefficientutilisationof a critical resource is a key success factor for measuring, in which case M&E mechanisms can be useful in ensuring that the resource utilisation follows the planned path.
• M&E indicators can be helpful in designing a good mix of mitigation and adaptation interventions so that they complement each other in the best possible manner.
• M&E indicators can help identify the target groups and other vulnerable groups, as well as the direct andindirectbeneficiariesoftheadaptationintervention.
14
Good Practice in Designing and Implementing National Monitoring Systems for Adaptation to Climate Change
• M&E indicators enable comparison with respect to a baseline for different time periods, as well as comparisons across interventions.
• M&E indicators focussing on the process and intermediate targets help identify unanticipated problems. This means that corrective action is possible while the programme is ongoing, instead of realising that the actual output is far away from the desired output at the end of the programme.
• Adaptation is a continuous process, and often one intervention is followed by the other. Future decisions and policy-planning will be better informed when decisions are based on how well a particular action was executed and produced the desired results. Therefore, the M&E process helps identify the areas that need improvement and those that are doing well, which in turn contributes to the right choice of future interventions and their adjustments and intensities.
• M&E processes can help assess concerns regarding the assumptions underlying an objective and the strategy adopted for meeting it.
The ultimate objective of having a robust M&E process is to increase the success rate of adaptation investments within a given set of limited resources and other constraints like information inputs etc. Measuring and evaluating the impact of an adaptation investment or judging whether an adaptation strategy has been successful or not through appropriate indicators is a challenging task. Some of these challenges are discussed in the following chapters. Whether an adaptation investment is correct, whether it yields the same results and whether it is on the desired process path can only be assessed through M&E.
2.1 Monitoring and Evaluation Processes
M&E are often linked together. However, the two terms deal with different issues at various stages of programme implementation.
• Monitoringisanongoingexercise,sometimesperformedatpre-definedtimeintervals.Thefocusof monitoring is on activities and processes. 'Monitoring' a process, one looks into compliance with designsandotherprocessspecifications,intermediatetargets,progressfromareferencelevelortowards a set objective, etc.
• Evaluation primarily focusses on outcomes and impacts. It is performed periodically and is often pursued at the end of the programme, but it is becoming increasing common to have ex-ante or mid-term evaluations. Evaluation assesses the causal contribution of adaptation interventions or the activities of the intervention to the actual results. When outcomes are being 'evaluated', the evaluation process checks whether the outcome is in alignment with the goal of the programme, whether the outcome resulted in the change that was expected, etc.
Rephrasing a lesson from sustainability M&E practice (Imbach et al. 1997), it is necessary to differentiate between the assessment of projects and programmes that go through formal planning procedures and assessments, and the assessment of social and natural processes that are not formerly planned. This is a key distinction because the evaluation approach and tools required in each case are different. This publication emphasises the M&E of projects and programmes or of any planned intervention, but as will be seenbelow,theM&Eofprocessesisimportantfordefiningprioritiesandobjectivesandforidentifyingthebarriers and limitations that planned activities and programs may have to face.
When an evaluation exercise is carried out before the implementation of the intervention, it is usually a component of the feasibility study looking at the potential outcomes and impacts. Therefore, as a part of thefeasibilitystudy,pre-implementationevaluationdealswithissueslikeprospectivebenefits,flexibilityinprocesses, appropriateness for target community, etc. If evaluation is done at the end of the process, it dealswithissueslikebenefitsrealised.Toputthedifferencebetweenmonitoringandevaluationinsimpleterms, monitoring assesses what is being done, while evaluation assesses what has been done. Monitoring processes gather information on progress, results or impacts, while evaluation helps in appraising them against certain criteria. Information from monitoring activities is also an input for ex-post and mid-term evaluations. Evaluation highlights the achievements or failures of the intervention as the case may be.
15
Monitoring checks for the difference between the actual paths followed during implementation and the paths planned in the outline. Evaluation can also explore unintended results, while monitoring can be very useful when resources are limited.
2.2 Stages of M&E Process
The primary concern in implementing an adaptation intervention is that it delivers its intended contribution inanappropriatewaythatitisbeneficialtothetargetbeneficiarieswithinadefinedsetofresources:thatis,itiseffective,hasapositiveimpactandisefficient.Inordertoachievetheseaims,robustM&Esystemsareneeded. An adaptation investment may involve many processes that can have different timelines. In such a case, the overall evaluation will integrate the results of the M&E regarding the processes that comprise the adaptation intervention. In general, the design of an M&E system typically follows the following steps:
1. Setting Objectives. Setting or clarifying the objective of theM&E system is the first step in theprocess. The objective has to be in alignment with the broader goals of, for example, a national adaptation strategy or programme or a plan of action and be in line with available information on climate change hazards and exposures. Spearman and McGray (2011) emphasise the importance of adaptation objectives being derived from an adaptation context assessment. This implies that the practitionersandevaluatorsshouldbewellawareofthecontextofhowtheinterventionbenefitsandaffects the target segment, the non-climate factors involved in the success of the intervention, the beneficiariesetc.ItisinthiscontextthattheM&Eobjectiveshavetobedetermined.SpearmanandMcGray (2011) propose three categories of activity and their potential contribution, namely, adaptive capacity, adaptation actions and sustainable development.
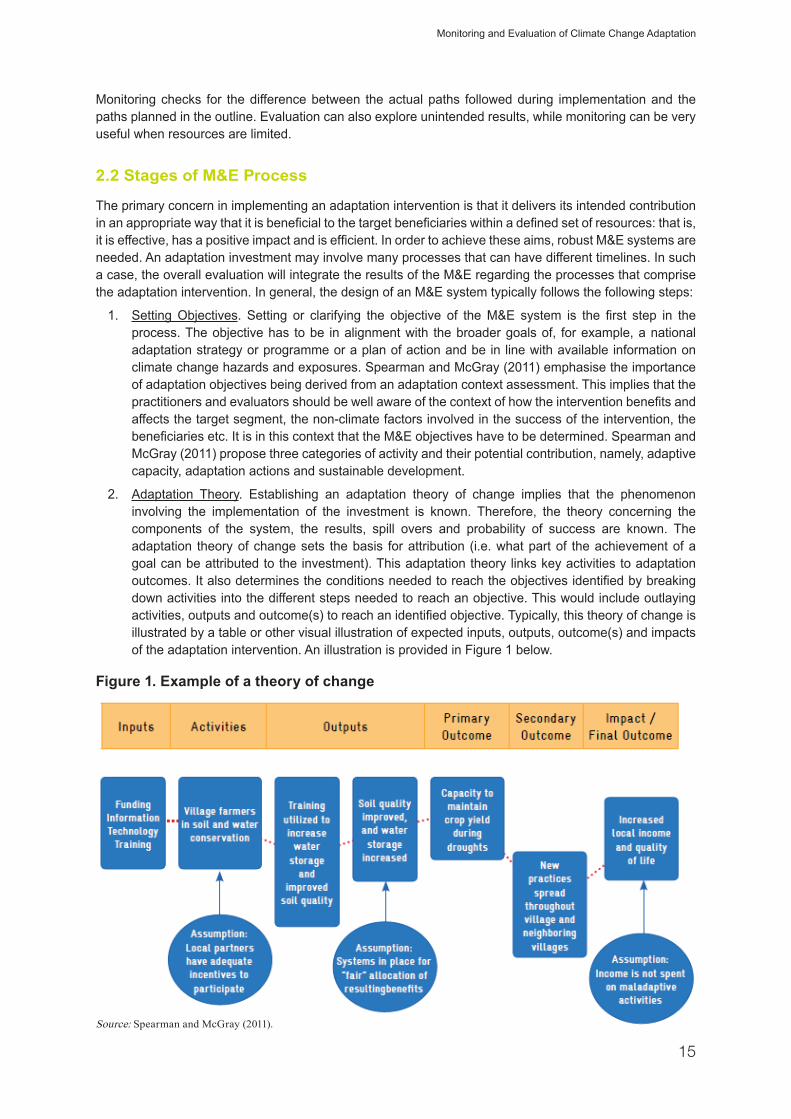
2. Adaptation Theory. Establishing an adaptation theory of change implies that the phenomenon involving the implementation of the investment is known. Therefore, the theory concerning the components of the system, the results, spill overs and probability of success are known. The adaptation theory of change sets the basis for attribution (i.e. what part of the achievement of a goal can be attributed to the investment). This adaptation theory links key activities to adaptation outcomes.Italsodeterminestheconditionsneededtoreachtheobjectivesidentifiedbybreakingdown activities into the different steps needed to reach an objective. This would include outlaying activities,outputsandoutcome(s)toreachanidentifiedobjective.Typically,thistheoryofchangeisillustrated by a table or other visual illustration of expected inputs, outputs, outcome(s) and impacts of the adaptation intervention. An illustration is provided in Figure 1 below.
Figure 1. Example of a theory of change
Source: Spearman and McGray (2011).
Monitoring and Evaluation of Climate Change Adaptation
16
Good Practice in Designing and Implementing National Monitoring Systems for Adaptation to Climate Change
3. Choose Indicators. Choosing the indicators depends on the processes that have to be monitored and how accurately the indicators capture the progress of the process. The context, local or national, is also important for the choice of indicators. Choosing indicators entails multiple considerations, including the following:
9 Baseline and Benchmarks.Indicatorsthatmeasurechangenecessitatetheidentificationofabaselineagainst which progress is measured. In the case of multiple processes a baseline scenario has to be developed. Baseline scenarios are useful when the future state is being measured with respect to the current stage. Though monitoring is a continuous process, sometimes measuring progress requires thatspecificintermediatetargetpointsareset.Forinvestmentsthathavestandardprocesses,thatis, theprocessesarewelldefinedandcommon,benchmarks formonitoringwith respect to timeperiod can be set. For example, if a new drought-resistant crop has to be introduced, there will be guidelines that have to be followed in terms of time of planting, time frame and quantities for watering andaddingfertilizersetc.Thesearewelldefinedandstandardpracticesthatneedcomplianceforwhich process indicators can be designed.
9 Prioritisation based on critical resources. When implementing an adaptation investment, it is likely that not all resources will be fully available. Sometimes some resources are critical for the success of the investment, that is, their appropriate use determines the success of the intervention. These critical resources have to be judiciously used and may require a particularly rigorous monitoring mechanism, given that deviations can lead to implementation failure.
9 Measurement tools and resource requirements. The measurement tools, processes and resources required to implement theM&E systemwill have to be identified at the outset. For example, inmeasuringincreasesinfarmproductivity,theresourcesrequiredincludefieldinvestigators,mapsandmeasuringequipment.ResourcerequirementswoulddefinethebudgetandtimeframeoftheM&Esystem.ThisalsohelpsinselectingtherightbundleofindicatorsthatareefficientintermsofM&Eresourcerequirements.Afforestationcanbetrackedbyfieldinvestigatorsaswellasthroughremotesensing,but,basedoncontext,onlyoneofthemcouldbemoreefficientaswellascost-effective. Identifying tools provides clarity in terms of the processes that will go into executing the M&E system. Sometimes only a representative sample is studied, this choice being dependent on the tool.
9 Data Sources and Assumptions.Datasourceshavetobeidentifiedformeasuringbaselines,definingbenchmarksandmeasuring indicators.Sometimes thedatasourcesare thebeneficiariesof theadaptationintervention.Theassumptionsdefinetheboundariesforwhichtheindicatorsholdgoodand are effective enough to measure what they are expected to measure.
4. Implementation and Execution of the M&E system. The final step in the M&E process is itsimplementation.
5. Triangulation techniques. Triangulation refers to using more than one method of investing the same thinginordertovalidatetheresultsofthefirstmethod.Often,particularlyforevaluation,alternativemethodsofmeasurementhavetobeidentifiedbecauseasinglemeasurementmechanismmaybeinadequate to evaluate the success of the intervention, or else, due to a high error margin in one method, another method may be used to supplement it. When assessment is made using samples, more than one sample may be taken. For indicators that are tracking critical resources, triangulation methods can be adopted to ensure a tighter monitoring system.
6. Results, Interpretation and Information Dissemination for action. The results and interim and finalreportshavetobe interpretedandcommunicatedtothoseresponsiblefor implementingtheadaptationintervention.ThisstepisanimportantpartoftheM&Eprocess,asithelpsrectificationmeasures to be taken if the process is not on track.
17
A comprehensive M&E of adaptation at the national level will require the development of indicators of progress. The nature and focus of such indicators will depend strongly on the objective of the evaluation. In the case of an in-country request to evaluate the success of national adaptation policies and interventions, theM&Ewillneedtouseindicatorsthatarelogicallytiedtodefinedpolicygoals,whichcanbeusedtosketch out progress towards measurable policy targets.
2.3 Process of Selecting Indicators
There are no defined methodologies or guiding principles for selecting indicators for M&E. However,making the right choice of indicators still constitutes a critical step in the M&E process, as the entire purpose of introducing M&E system fails if the choice of indicators is not appropriate. In the previous sectionwedefinedwhatconstitutessuccessfuladaptationandhowthecriteriaforM&Eprocessesaffectthe choice of indicators. In this section we describe SMART, SPICED and CREAM, popular concepts used in the process of indicator selection.
SMART. 'SMART' stands for Specific, Measurable, Attainable, Relevant and Time-bound. Indicators must befocussedandclearlydefined,thatis,theyshouldbespecific. For example, the capital cost of building awaterreservoirisUSD10,000,tobespentintenequalinstalmentsovertenmonths.Thisisaspecificindicator where every month one tenth of the construction is achieved and one tenth of the payment is made.Whetherqualitativeorquantitativeinnature,thereshouldbeadefinedmethodofmeasuringtheindicators in such a way that the method used to measure them can be repeated and used for comparison. Inotherwords,theindicatorsshouldbeobjectivelyverifiable.Maintainingobjectivityisalittlecomplicatedin case of qualitative variables. The target of the indicator should be attainable within the scope of the definedgoalsoftheadaptationintervention.Theindicatormustalsobeavalidandappropriatemeasureofthe process, outcome or impact that is being monitored, that is, it should be relevant. For example, growth intheproductionofwheatwithrespecttothebaselineisarelevantindicatorinmeasuringtheefficiencyofanewdrought-resistanthybridseed.Indicatorsshouldhaveatemporalconnection,thatis,adefinedperiod for their achievement. Time-bound indicators must also be trackable. Training 20% of coastal village dwellers in sustainable aquaculture techniques during the period from June to September 2014 is a SMART indicator.
CREAM. Schiavo-Campo (1999) definesCREAM indicators,which should beclear, i.e. unambiguous and precise; relevant, i.e. should measure the process, outcome or impact appropriately; economic, i.e. should justify the costs involved; adequate, i.e. should provide enough information or basis for assessment; and monitorable, i.e. should be amenable to independent validation (Schiavo-Campo, 1999). CREAM indicatorsaresomewhatsimilartoSMARTindicatorsandhaveanoverlapforclear/specificandrelevanceproperties.
SPICED. Roche (1999) proposed the SPICED approach, which deals with how indicators should be used: Subjective: key informants can contribute by providing insights that can be useful in saving critical resources like time. Participatory: indicators should be developed in consultation with stakeholders. Having a participatory approach ensures that different interests are well represented. Interpreted and Communicable:contextsforlocallydefinedindicatorsmustbeinterpretedandcommunicatedtorelevantstakeholders. Cross-checked and Compared: the validity of indicators should be cross-checked by comparing them with multiple indicators and tracking their progress or by using different stakeholders for the same indictor. Empowering: the process should be empowering for stakeholders so that they can reflectcritically thechanges instateacross timeperiods.Diverse and Disaggregated: the indicator set should be diverse in order to capture a range of phenomena, groups, processes etc. Information-recording mechanisms should facilitate the temporal tracking of differences and diversity.
Monitoring and Evaluation of Climate Change Adaptation

18
Good Practice in Designing and Implementing National Monitoring Systems for Adaptation to Climate Change
2.4 Criteria for Selecting Appropriate Indicators
Designing indicators for M&E depends on what constitutes a successful adaptation. A climate change adaptation initiative should not be viewed as an outcome in itself: it should merely be seen as an enabler to decrease vulnerability to the adverse impacts of climate change, as well as to reach development goals within economic, social and environmental priority areas. Consequently, indicators for the M&E of adaptation initiatives are not necessarily very different from those for other development and planning initiatives.
Identifying what constitutes successful outcomes of adaptation interventions is a precursor to designing M&E indicators. A discussion paper by Adger et al. (2005) concludes that the criteria with which to measure successful adaptation should include context-specific criteria of efficiency, effectiveness, equity andlegitimacy. In general a good indicator set would meet many M&E criteria. The following are some of the criteriawhichindicatorsshouldreflectwhentheyareusedfortheM&Eofadaptationinterventions:
a. Relevance. This refers to how well an adaptation intervention meets its overall objectives. For example, if an agricultural strategy is designed to be useful in droughts, it should meet its objective if a drought occurs. The M&E process should subsequently measure the objectives, such as their validity,theoverlapbetweenobjectiveandintendedimpact,thechoiceofactivitiesetc.Inthisspecificcase the indicators might be the ratio of water required per unit area in the base case and the drought case. The choice of indicators should also be based on their relevance to the context, since local contexts can vary considerably even within a country, municipality, etc. Relevance indicators need not be measurable, but can also consist of the qualitative judgements of the investigators. For example, in an ex-ante evaluation of a drought resistant crop, indicators are needed that the crop canbearlowsoilmoisturelevelsuptoaspecificlevel.However,thelocationwherethiscropvarietyis being administered may indicate a much lower soil moisture level. Hence the relevance indicators of the suitability of this crop for the region should reject the use of this crop.
b. Efficiency. This is ameasure of outputs with respect to inputs. The efficiency of an adaptationinterventionismeasuredbyhowmuchmoreoutputisreceivedperunitofinput.Usuallyefficiencyindicators are based on costs, person-hours, volume of materials used etc. Indicators based on this criterion are heavily dependent on the baseline assessment.
c. Effectiveness. This is a measure determining how well each intervention achieves its objectives. Indicators of effectiveness typically cover the impact of the intervention.
d. Feasibility. This refers to the overall viability and practical possibility of an adaptation intervention. This is typically an ex-ante criterion. Interventions with ambitious goals will have lower chances of success. Therefore, the implications for the M&E indicators are that they should reflect thefeasibilityofgoalsandthattheintermediatetargetsshouldreflectanoperationalrange.Feasibilitycan also depend on technological concerns, management capacity etc. The feasibility criteria need not necessarily be a part of the M&E system if, at the outset, the assumptions and risks of the interventionaredefined.
e. Equity.Equitycriteriaconsidertheextenttowhichadaptationinterventionsbenefitthevulnerablepopulation.Thisalsohasspilloverimplicationsthatsomethingmaybebeneficialforonesegmentbut isadverselyaffectinganothersegment.Forexample, ifaninterventionisdesignedtobenefitcoastal communities, the indictors should focus on how well the marginalised sections of the coastal communitieshavebenefittedandassessingwhetheronesegmentisbeingadverselyaffectedatthecostofsomeotherbeneficiary.
f. Beneficiaries. This is a criterion for coverage. While equity requires an adaptation intervention to catertotherequirementsofmarginalisedsegments,‘beneficiaries’criterionfocusonthespanand
19
extentofthebeneficiaries.Thiscouldbeintermsofthenumberofbeneficiaries,theirgeographicspan, thenumberofcategoriesofbeneficiariescoveredetc.Forexample,awaterconservationtechniquebenefiting70%ofthefarmersinanareaisanexampleofacoveragecriterion.
g. Flexibility. Flexibility is particularly important for long-term interventions under conditions of climate uncertainty,asthefuturestateoftheclimateisnotknown.Therefore,theflexibilitytochangetheintervention in course of the time can be crucial for the success of the intervention. The indicators can therefore check for lock-in periods.
h. Sustainability. In the context of adaptation, sustainability would require an adaptation intervention to be non-maladaptive or not to have negative spillovers, to be compatible with the environment, and tobeself-sustainingafteraninitialpush,beinginapositiontodelivercontinuedbenefitsevenafterthe project is over (Brooks, et al. 2011). The indicators should be comprehensive enough to address the complex issues surrounding the concept of sustainability.
i. Acceptability. This addresses how stakeholders will respond to the intervention. Some forms of adaptation intervention require beneficiaries or other stakeholders to be actively involved inimplementation. If there are social, cultural or legal issues with acceptance, the intervention may not produce the desired results. Therefore, in such cases, the indicators must take into account a stakeholder acceptance factor.
j. Implementation (Compliance). In some adaptation interventions, compliance with standard operating practices is crucial for success. In such cases process indicators with intermediate targets have to be defined.Dependingupontherigourofthecompliancerequirement,thetimeperiodforintermediatemonitoring can vary. Compliance is also important in cases where resource constraints are critical to the success of the intervention.
2.5 Classification of Indicators
TheindicatorsforM&Ecanbeclassifiedbasedontheirmeasurability and the type of task undergoing M&E. In terms of measurability, the indicators can be divided into qualitative and quantitative.
• Quantitative indicators can be measured in hard numbers. It is easier to have well-demarcated thresholdsforquantitativeindicators.However,confiningmeasurementtofiguresdoesnotcapturethe softer aspects of adaptation intervention. For example, crop yields per hectare are a good indicator of the effectiveness of the implementation of new drought-resistant seed varieties.
• Qualitative indicators are more subjective and can change based on the judgment of the researcher or the respondent. An example is peoples' narratives on the effectiveness of training programmes tomanageemergencyfloodsituations.Tosomeextentthesecanbetabulatedasbinaryvariablesor scales.
In terms of tasks, the indicators can be classified as process indicators, outcome indicators andimpact indicators.
• Process indicators focus on design, compliance with a pre-determined process, and the actual implementation processes involved in the adaptation intervention.
• Outcome indicatorsfocusonadefinedsetofgoalsordeliverablesattheendoftheadaptationprogramme intervention.
• Impact indicators deal with the effectiveness of the intervention in terms of the broader objectives andaimsofimplementingaspecificadaptationintervention.
Monitoring and Evaluation of Climate Change Adaptation

20
Good Practice in Designing and Implementing National Monitoring Systems for Adaptation to Climate Change
Box 1. Process, outcome, and impact indicators: an example of coastal city protection
To understand the differences among the three categories of tasks, let us take the example of a coastal city that needs to protect its community from increasing sea levels and storm surges up to three kilometres inland. Let us assume that dykes are being built as an adaptation measure. In this case, process indicators would include indicators like budget compliance, intermediate project construction targets, compliance with materials used etc. Outcome indicators would include indicators like per unit cost, total implementation cost, ratio of public to private investment etc. Impact indicators would include indicators like annual maintenance costs, the life span of the protection, policies supporting a measure etc. These process and outcome indicators assume that careful thought has gone into the choice of adaptation strategy and that the strategy is an appropriate choice. However, these indicators will not necessarily contribute towards making a choice. For that reason, in the design and evaluation of the intervention, one would need to consider answers to questions like, whether the intervention will provide immediate protection or not, what is the life span of the protection, what will be the scale ofpreventionat the time the interventioncomes toanend,aswellas,say,fifteenyearsafter theimplementation. If appropriate weights are assigned based on the programme’s objectives, the impact indicators can help make a choice between protection by dykes, protection by dykes and coastal vegetation like mangroves, and protection by coastal vegetation alone. Outcome indicators, on the other hand, would most likely not identify how the coastal community is protected, as the goal is to transit from stage t0 to stage t1.
Abroaderclassification for these indicatorswoulddistinguish those thatmeasureeffectiveness from those that measure efficiency.
• Efficiency indicators measure the output against each unit of input. Therefore all the indicators, such as per unit cost of technology, per unit cost maintenance costs etc., fall under the broader indicatorcategoryofefficiencyindicators.
• Effectiveness indicators measure inputs vis-à-vis impacts. The number of people trained in emergencyresponsesinadisasterforaspecificinputcostisameasureofefficiency.Howmanyofthem actually use the training in an emergency event or how many qualify an end-of-course test is a measure of effectiveness.
Both have their advantages and disadvantages, and neither cannot be weighed more than the other. Depending upon the context and what is being monitored and evaluated, the choice of indicators will change. Continuing with our example of introducing a drought-resistant crop in a village, the following table lists some examples of indicators and their broad categories.
Table 1. Examples of various categories of indicator
Quantitative Indicators - Cost of additional resources vs. additional crop production - Numberofbeneficiaries
Qualitative Indicators - Acceptability of crop type - Legal acceptance of the drought-resistant crop
Process - Frequency of adding fertilizer - Sowing process
Outcome - Numberofbeneficiaries - Increase in production
Impact - Increase in income levels - Increase in health standards
Efficiency - Cost of additional resources vs. additional crop production - Additional labour hours vs. additional crop production
Effectiveness - Water requirement - Soil moisture requirement
21
2.6 Challenges to Monitoring and Evaluation
The need to have an effective M&E system for adaptation interventions is clear. However, the design of a robustmechanismcanbefilledwithmanypracticalproblems.Followingaresomeofthecommonissuesthat planners face when designing and implementing M&E mechanisms.
2.6.1 Selecting the Right Indicators
The choice of indicators that are appropriate is one of the most challenging tasks in designing an M&E system.Choosing the process indicators confines themonitoring process to questions of compliance.Outcome indicators, on the other hand, emphasise the future state that is being targeted. For example, the adaptation measure to increase green cover to hold the soil in place and prevent soil slippage may best be measured as an outcome indicator where the ultimate goal is to have a predetermined green area withspecificplantations.Iftheobjectiveisnotjusttopreventsoilslippagebuttopromotebiodiversityinaregion, then having process-driven indicators may be more relevant. Impact indicators measure the overall impact of an adaptation intervention. In most cases it is possible only to measure the direct or primary benefitsofameasure.However,thechoiceoftheadaptationanditssubsequentsuccessmayalsodependontheamountofsecondarybenefits.Similarly,itisdifficulttotakestockofthedamagethatwasavoidedin the process. Having a system in place nationally increases the complexity of the system.
For example, if a choice has to be made between increasing the depth of a bore well or introducing drip irrigationtodealwithdrought,thetwostrategieswillhaveverydifferentprimaryandsecondarybenefitsand will avoid different types of damage. Choosing a mixture of all these categories of indicators may make theM&Eprocessquite complicated,and it canbedifficult toprioritisewhichof these indicatorsshouldhavemoreweightagethantheother.Evenwhenaspecificbasketofindicatorshasbeendesigned,they sometimes inadequately capture the phenomenon. A good measure for handling this problem is to enlist the processes that best capture the implementation of the adaptation intervention. In order to design an indicator system for monitoring and evaluation at the national level, identifying the criteria for successful adaptations that are appropriate for the country is important. These criteria determine the natureofsuccessfuladaptation.Thechoiceofrelevantindicatorswouldthendependonthespecificsofthe investment. It is within the realm of these success criteria that the indicators are chosen.
2.6.2 Measuring the Baseline
Measuring the stage zero against which the changes or progress are to be measured faces two problems. Firstly,giventheinfluenceofthechangingclimateandmultipleotherfactors,itisdifficulttoidentifythebase case. Secondly, the conditions that describe the baseline may be too broad to be captured. Quite oftenitisdifficulttosaydefinitivelywhetherthebasecaseexistedatt0 or t-1 or at any other time frame. Forexample,aparticulartimeperiodmaybeveryfacilitativeforaspecificcrop.Now,iftheeffectofanadaptation intervention is measured against this baseline, it will underestimate the contribution of the intervention under normal circumstances.Similarly, if targets are defined based on this baseline, theymay become too ambitious. In practice, it is common to assume the base time period as one in which the adaptation intervention was introduced. This issue to a certain extent can be dealt with by taking an averagescenarioforvarioustimeperiodsasthebaseperiod.Theotherwaytoistodefineanoperatingrange based on historical data against which progress can be measured. For example, if a base case for a drought-proneregionisbeingdefined,thenthiscouldtaketheformofarangeofindicatorslikeseasonalrainfall, water-table levels etc. Alternatively, average values of observations could be used. The limited availability of information, which usually is the case, hinders this process. There are also arguments that historical baselines are becoming less representative as the pace of climate change increases.
Monitoring and Evaluation of Climate Change Adaptation

22
Good Practice in Designing and Implementing National Monitoring Systems for Adaptation to Climate Change
2.6.3 Qualitative vs. Quantitative Indicators
While selecting indicators for M&E, the emphasis is placed on selecting SMART indicators. There is an inherent emphasis on the measurability of the indicators. In some cases it may just be important to have more qualitative indicators. For example, a farming community's experience of a specific agriculturetechnique introduced as an adaptation intervention may not be adequately captured by yield metrics or input–outputratios:itcouldalsobeintheshelflifeofthefinalproduct,oreveninhowtheendusersfindthetasteofthefinalproduct.Normayindicatorsbeabletocapturelabour-intensivepracticesadequatelyusing input–output ratios. Sometimes the adaptation process can best be evaluated from the narratives of beneficiaries.Thechoiceofqualitativeindicatorshastobepursuedevenmorecautiouslybecauseofthepossibility of multiple interpretations of the same phenomenon.
To deal with these issues, the M&E mechanism should not rely solely on one category of indicator. Having objectivity about the processes involved in the adaptation intervention and how best they can be captured throughindicatorsareessential.Qualitativeindicatorscaneffectivelyfillthegapsanddothevalidationforquantitative indicators.
2.6.4 Setting Intermediate Targets
Adaptation isanongoingprocess,andno interventioncanhave justonefinalgoal.As theadaptationprocessisveryspecifictocertainconditions,settingintermediatetargetsisacomplicatedtaskthatcreatesproblems in monitoring a measure. As there are no established practices, there are no intermediate benchmarks. The progress trajectory for an intervention cannot be uniform. For example, in training human resources for emergency management, there is a learning curve where people will start picking up faster towards the of the programme.
2.6.5 Smart Indicators
Often indicators are designed just in order to monitor the adaptation intervention, and evaluation is possible only once the adaptation intervention has ended. However, evaluation also entails that indicators help in evaluating a favourable adaptation intervention. The mechanisms as designed may not be equipped to make this choice. These problems arise primarily as a result of the time frame for evaluation and the locus ofthebenefitsbeingmeasured.Forexample,ifacoastalcityhastobeguardedagainstrisesinsealeveland storm surges, the indicators will not necessarily help in making a choice between building dykes and planting mangroves. Even if there are the mechanisms to make a choice, the choice would be different for different time frames. Dykes can be easily constructed within two to three years, but mangroves will take a lot more time to grow tall and dense enough for effective protection. If the assessment period is only three years, then having coastal dykes supersedes having mangrove plantations. The evaluation will differ when the assessment period increases to thirty years. Similarly, accounting for the primary and secondary benefitsmayyielddifferentchoices.Thequalityandavailabilityofdatacanhinderuseofcertainindicators.Oftenalackofwell-definedandconsistentmetricsforadaptationmakesthemeasurabilityofindicatorsproblematic. The indicators may not necessarily be smart, but the understanding of M&E has to be an integral part of adaptation planning processes. The indicators are not independent silos and cannot be introduced in the middle or at the end of the programme.
2.6.6 Replicability
Justlikeadaptationmeasures,theindicatorsdesignedforM&Eareverymuchcontext-specific.WhiletheydefinitelygivecuesfordesigningaframeworkwhenconductingM&Eforanotheradaptationintervention,they cannot be completely the same, even when the conditions are somewhat similar. The indicators will change based on the objective of the programme, the time frame, the scale of the intervention, the sector etc.Therefore,therecannotbeanybenchmarksforindicators.Thereisnospecificwaytodealwiththisproblem apart from treating the M&E as an independent exercise for each adaptation programme.

23
2.6.7 Efficiency vs. Effectiveness
The M&E process should not be very expensive and should justify the costs involved. This also raises the issueof theefficiencyandeffectivenessof the indicators.The indicatorsmustbeefficient, that is, theyshould be cost-effective in terms of the inputs required and the outputs achieved, as well as effective, that is,shouldsufficientlycapture theprocess.Toput itsimply, the indicatorand itsmodeofmeasurementshould justify the amount of information it captures per unit cost. For example, an adaptation intervention is used for the afforestation of a patch of land measuring 25km X 25km within a ten-year time frame. The growth progress can be monitored using an indicator of the ratio of the percentage of green cover very accurately by having a high-resolution satellite stay focussed on the patch for ten years. This level of detail and accuracy in information may not be needed because setting up a remote-sensing project for this small are will be very expensive. The same indicator can be measured through ground-level surveys once a year. The indicator will now have a higher margin of error, but the measurement cost is much lower. It is therefore importanttostrikeabalancebetweenefficiencyandeffectiveness.
2.6.8 Time Period of Evaluation
Evaluation time frames should be determined at the beginning of the intervention. Longer time frames may evaluate strategies differently than shorter ones. Some adaptation alternatives have a more sustainable approach and take a little longer to produce results. When evaluated prematurely, the intervention may completely fail. However, if the objective demands immediate results, the time period for evaluation should be shorter. An effective way of dealing with this would be to evaluate at multiple time periods unless this increases costs exorbitantly. This would depend on the nature of the intervention and programme objective.
Examples of different types of indicators for key sectors are given in Annex 1. Annex 2 lists examples of indicators in key priority areas.
2.6.9 Indicator Issues that are Distinctive at National Level
Hedgeretal. (2008)have identifiedanumberofchallenges,which,aside fromthegeneralchallengesdescribed in the above sections, relate to national-level M&E of adaptation. These include:
• Theimportanceof‘mainstreaming’inrelationtoadaptation.Whilespecificadaptationinterventions(e.g. the project level) may be measured in the context of the sector and local community at which they are targeted, at the national level, adaptation, and therefore also any evaluation, requires strong coordination across sectors, policies, strategies and plans. This is because progress in addressing climate change sees adaptation move from an environmental challenge to one that is relevant to the economy, social policy and development in general.
• The challenge of integrating adaptation into the potentially short lifetime of government plans, particularly in national contexts where stable governments may be short-lived or easily swayed from one policy priority to another.
• Overcoming some of the institutional issues, which may be present at all levels, but particularly challengingnationally,whereitmaybeundiplomatictoaddressthemspecifically,partlybecauseofpotential problems with corruption.
• The overriding drive towards achieving MDGs. Particularly nationally, it would be unproductive to introduce objectives which are separate from or perceived to be a distraction from the MDGs. Therefore, the pragmatic approach will look to develop targets and indicators for adaptation that can somehow be aligned with MDG priorities.
• In line with current approaches to development, adaptation efforts are highly integrated. Most projects make use of multiple strategies and address multiple sources of vulnerability. Many bridge sectoral boundaries and address more than one impact associated with climate change.
Monitoring and Evaluation of Climate Change Adaptation

25
3. Monitoring and Evaluation Frameworks
The M&E framework usually gives a bird’s eye view of how the process and activities are arranged in the overall M&E system. Typically, a framework will include indicators, data sources, tools and methods, timelines, decision-makers, executors etc. In the literature there are many sources that do not distinguish between the framework and the system. Many organisations treat the M&E framework in a simplistic manner as a template or table describing the indicators that will be used in making programme assessments. The purpose of having a framework for M&E is to provide a structure to the set of activities planned for M&E. Thismakes theassessmentofprogrammegoalsat various time intervalseasierandhelpsdefine therelationshipsamong internalactivities likeflowof inputs, inputsandoutputs,andexternal relationshipsto inputs and impacts. Generally, M&E frameworks are structured around the following structure was proposed by a report by United Nations High Commissioner for Refugees (UNHCR, 2003) on displaced people in the context of project management.
• Determine the overall objective of the M&E mechanism and identify the information requirements.
• Ensureinterventionshaveclearlydefinedobjectives.
• Draw up consistent reporting tools.
• Identify data sources for indicators.
• Identify resource requirements, including human resources.
• Assignresponsibilitiesforactivitieswithinadefinetimeframe.
• Set reporting and information dissemination and feedback mechanisms.
These steps also form part of the overall M&E system design process. There are no rules of thumb or well-definedguidelinesfordesigningaframeworkforevaluationandmonitoring.Thefollowingsectionspresenta general overview of commonly used frameworks for M&E in the context of climate change adaptation interventions.
3.1 General Overview of Approaches to M&E Frameworks for Climate Change Adaptation
In the following, the key characteristics of approaches to M&E frameworks are summarised. The frameworks are also presented in Annex 3.
3.1.1 Results-Based Monitoring and Evaluation
One of the most popular M&E approaches is the Results-Based M&E approach. This is based on the theory of 'Results-Based Management' (RBM), which encompasses the processes of planning, implementation and M&E. Results-based M&E assesses a programme or an activity continuously in order to achieve the targetedobjectives.Theevaluation isbasedonthe impactsand/orbenefits that theprogrammeor theactivity brings about for the targeted segments (Farrell 2009; Spreckley 2009; UNDG 2010; WFP 2009; Kusek and Rist 2004). It is different from conventional assessment mechanisms because of its emphasis on continuous feedback to achieve programme goals. Therefore, the M&E process is an ongoing process that does not happen at the end of the programme implementation. According to the United Nations Evaluation Group, RBM aims at ‘achieving improved performance and demonstrable results’ (UNEG, 2007).ItisdifferentfromPeterDruker'sManagementbyObjectiveasitoffersflexibilitythatisneededtooperateincaseswhereeitherthegoalsarenotwelldefinedortheykeepchangingalongwithprogramme

26
Good Practice in Designing and Implementing National Monitoring Systems for Adaptation to Climate Change
implementation or due to changes in factors external to the programme (ADB, 2006). This monitoring mechanism has been adopted by various agencies of the United Nations and many other organisations workinginthedevelopmentfield.AnexampleoftheRBMapproachtoM&EisdescribedinAnnex4.
3.1.2 Logical Framework Approach
The logical framework approach was developed for the United States Agency for International Development (USAID) in the late 1960s for use in participatory project planning by Practical Concepts Incorporated (PCI, 1979). It is a systematic approach for project planning and implementation and involves the preparation of a log frame matrix which gives an overview of the project or current situation. The matrix divides the programme information into problem, goal, purpose of the programme, outputs or deliverables of the programme,andactivities forachieving theoutputs.Foreachof these,objectivelyverifiable indicators(OVIs)areidentifiedalongthesourcesofinformationorthemeansofverificationfortheseindicatorsandtheir relevant assumptions (DFID 2011; EC-CSF 2011; Jensen 2010; CIDA 2001). In the planning process, these OVIs provide measures for tracking the progress of the programme. This approach is often criticised forlackofflexibilityoncetheOVIsaredefined,overtemphasisonthemeasurabilityoftheindicatorsandthe narrow focus on problems instead of solutions (Bakewell & Garbu, 2005). These affect the quality of OVIs and thus the M&E mechanism.
Figure 2. Illustration of a simple logic model
Source: Sambodhi (n.d.)
The logic model can also be illustrated from a simple illustration (see Table 2), which also captures M&E phases.

27
Table 2. Illustration of a simple logic model
Inputs Process Results Outcome Impact
- Money
- Staff
- Technology
Agricultural conservation technologies to small-scale rural farmers
Enhancedagriculturalproductivity andimproved availability of water
Improved drought-coping capacity
Reduction inpoverty
Monitoring Evaluation
3.1.3 Monitoring and Evaluation Framework
The United Nations Development Programme's (UNDP) framework on Monitoring and Evaluation Adaptation to climate change is focused more on processes than on planned actions. The framework is organised into seven thematic areas, viz., agriculture and food security; water resources and quality; public health; disaster risk management; coastal zone development; natural resources management; and infrastructure (UNDP, 2009). These thematic areas are mapped to the Millennium Development Goals (MDGs) (UNDP, 2007). The relationship to climate change impacts is more complex, as climate change has more cross-cutting issues, and the intervention may have an overlap across various thematic areas or may address multiple targets of MDGs (Sanahuja, 2011). The framework views adaptation interventions withtheobjectiveofimprovingadaptationcapacityandreducingthevulnerabilityofthespecificsectorsunderconsideration.TheM&Eindicatorguidanceisspecifictoprogrammeorportfolio.Thecategoriesofindicators for M&E can be clubbed together under the broad themes of coverage, impact, sustainability and replicability.
Figure 3. Illustration of the monitoring and evaluation framework
Source: Bours et al. (2013)
Monitoring and Evaluation Frameworks

28
Good Practice in Designing and Implementing National Monitoring Systems for Adaptation to Climate Change
3.1.4 Tracking Adaptation and Measuring Development
The tracking adaptation and measuring development (TAMD) framework is being developed by the International Institute for Environment and Development (IIED) and its partners. TAMD is an assessment framework for adaptation intervention that tracks and evaluates the effectiveness of an adaptation intervention (Brooks et al. 2011). The framework defines successful adaptation in terms of feasibility,effectiveness,efficiency,acceptability,equityandsustainabilityandthereforeisnotjustconfinedtocapacity-building. The M&E process tries to strike a balance between top-down and bottom-up mechanisms. The 'Track 1' or top-down assessment encompasses issues like the integration of climate change into policies, institutional arrangements for dealing with climate change etc. (IIED, 2014). The assessment in Track 1canbequalitative innature. 'Track2'or thebottom-upassessment focusseson the identificationofcontextually relevant indicators of development and vulnerability (IIED, 2013). An overall assessment of the success of an intervention is made by combining these two approaches.
3.1.5 Robust Decision-Making
Robust Decision-Making (RDM) is an analytical framework developed by the RAND Corporation. This framework is used for programmes in deep climate uncertainty. The decision-making process is not dependent on the future state of the climate. Therefore, RDM deals with how plans perform in a plausible future and which conditions may be crucial for the programme’s success (Hall et al. 2012; Lempert et al. 2006; Lempet and Kalra 2011; RAND Corporation 2013). This helps decision-makers decide on robust strategies that will work again in a wide range of future scenarios (Lempert and Collins 2007). Evaluation is based on the assessment of a future desirable state vis-à-vis the base case. RDM is primarily a decision-making tool, but it involves a trade off with assessment, and therefore it is also used for programme reviews aligned closely to iterative adaptation management concepts of M&E (Watkiss & Dynzynski, 2013).
3.1.6 Opportunistic Impact Measurement
Opportunistic impact evaluation assesses the adaptation intervention based on a comparison of the state ofagroup, regionorbeneficiarywithandwithout (orbeforeandafter) intervention (Karkoschkaetal.2013). In the same region, the framework measures the overall state at t0 before intervention and at t1 after implementation of the intervention. If measured at the same time, it measures two similar regions, one with the intervention and one without it. This is analogous to the control and treatment groups often used in the social sciences. This essentially measures impacts or evaluates the intervention and does not have any provision for monitoring. The degree to which planned impacts are achieved (depending upon the baseline) after the intervention determines the success of the adaptation. Since two states are being compared in this framework, it is heavily dependent on the baseline assessment.
3.1.7 Outcome Mapping Approach
The Outcome Mapping project assessment framework has been designed by the International Development Research Centre. The framework maps the activities of a programme to the outcomes it brings about in its beneficiaries(primary,secondaryetc.,called‘boundarypartners’).Outcomesaredefinedas‘changesinthe behaviour relationships activities or actions of the groups and organisations with whom a programme works directly’ (Earl, Carden, & Smutylo, 2001). The framework is used to increase the effectiveness of an intervention by linking the intervention activities directly to outcomes. The framework focusses on planning and M&E, and can therefore be used for assessments during the design, mid-term and post-hoc implementation of the programme (Jones & Hearn, 2009). In programmes seeking transformational changesinbehaviour,theframeworkspecifiesstakeholders,partnersandtheotherpeopleinvolvedandtheir respective duties (IDRC, n.d.). Hence, it facilitates iterative learning, accountability and collaborative learning. It can deal with complex issues in adaptation, but focuses more on contribution than intervention.

29
3.1.8 Objectives-Oriented Project-Planning (ZOPP)
Objective-Oriented Project-Planning (Called Zielorientierte Projektplanung in German) has evolved from the log frame approach which was developed for USAID. This has been developed by the Deutsche Gesellschaft für Technische Zusammenarbeit (GTZ - German Technical Cooperation) (GTZ, 2002). It entails forming a Project Planning Matrix as an M&E framework and lists the tasks of the programme, the intended outputs, the relationship between output and input, the responsibilities of stakeholders, intermediate goals, budget compliance, time line, etc. The pre-project planning phase also entails an assessment phase which reviews stakeholder participation, anticipated problems, objectives and possible alternatives to objectives, and resources in case of unanticipated problems (Helming & Göbel, 1997). Although it has been widely adoptedfortherigourofitsmethods,itislessflexibletochangesthatcomewithtimeandhencenotsuitedfor implementations under circumstances of deep uncertainty.
Monitoring and Evaluation Frameworks


31
4. Existing National-Scale Efforts to Monitor and Evaluate Adaptation Policies and Strategies
A number of countries have developed and are developing national monitoring and evaluation frameworks. Most frameworks are still at an early stage, where development and planning are still in progress. Implementation of the frameworks has started in a number of countries, including Norway, France and the UK. In Norway, existing initiatives and systems are used as a learning mechanism for assessing which approaches constitute effective means of reducing climate change vulnerability and risk. In the Philippines and France, the frameworks are used to specify the desired outputs and outcomes of adaptation, while those in Mozambique and Nepal are closely connected to and informed by other major adaptation initiatives. Other countries, such as the UK and Germany, target their frameworks to a number of selected priority areas. Most frameworks focus on monitoring, though a few countries include an evaluation part. In the Philippines, the framework focuses on identifying actions that are most effective in creating the changes that will decrease vulnerability to climate change, as well as in elaborating on what has enabled thisdesiredchange.Therefore,thePhilippineframeworkincludesthedesiredresultschainasidentifiedin the Philippines National Climate Change Action Plan 2011-2028, including ultimate, intermediate and immediate outcomes, activities, outputs and complementary indicators (GIZ 2013). In France, the objective of the monitoring system is to monitor progress in implementing actions under their National Adaptation Plan(NAP)andtheachievementofspecifiedNAPoutcomes.NAPimplementationisthususedasameanto monitor the resilience of the country to climate change, with the assumption that implementation of the NAP reduces the country's vulnerability to climate change (OECD 2015).
A report by GIZ (2014) provides a comparative analysis of national frameworks for the monitoring and evaluation of adaptation. An overview of the systems, their approach to monitoring and the status of implementation is provided in Table 3 below.
Table 3. Overview of existing national-level monitoring systems
Country Approach Status
Australia Identifiesriskstoessentialservices(e.g.energy and water supply) and allocation of responsibilities to persons or organisations best placed to address the risks.
Indicators of adaptation drivers, activities and outcomes.
National Adaptation Assessment Framework under development, initial set of twelve indicators identifiedandcurrentlysubjecttoconsultation. Under review.
Germany Climate change impacts and response indicatorsforfifteenactionandcross-sectionalfieldstomonitoradaptation.Periodicevaluation of the German Adaptation Strategy.
Indicator system under review. Reporting expected to start in 2015.
France Process indicators and some outcome indicators for twenty priority sectors.
Indicatorsystemreflectsthe230measuresidentifiedintheFrenchNational Adaptation Plan 2011-2015. Operational and ongoing.

32
Good Practice in Designing and Implementing National Monitoring Systems for Adaptation to Climate Change
Kenya Indicator-based system using outcome- and process-based monitoring, reporting andverification(MRV)ofactionsundertheindicators measured at the national and county levels.
Kenyan National Climate Change Action Plan, with top-down and bottom-upindicatorsidentifiedat the national and county level. System currently under review.
Morocco Using indicators to monitor changes in vulnerability, adaptation progress and their impacts.
Around thirty indicators in each of the two pilot regions.
Indicator system for the two regions integrated into the Regional Environmental Information System (SIRE). Under review.
Mozambique Monitor climate change impacts and inform national budget allocations and international climatefinance.
Draft framework proposed, including a set of indicators. Under development. Full implementation expected by 2020.
Nepal Programme-level indicators (based on PPCR core indicators). Indicator system piloted for eight climate change projects and indicators linked to National Adaptation Programmes of Action (NAPA) priorities; matched by individual project-level indicators.
Qualitative documentation of lessons learned.
149 sub-national ‘environmentally friendly’ indicators for different sectors (including climate) and scales (household to district).
Under development but piloted for eight major climate change projects that form the core of Nepal’s Climate Change Program.
Norway Process- and impact-monitoring using repeated surveys of exposure and adaptive capacity.
System focuses on learning by doing, structured around regular national vulnerability and adaptation assessments. Operational.
Philippines Indicators linked to results chains for seven strategic priority sectors.
Climate Change Vulnerability Indices for measuring, monitoring and evaluating local vulnerability and adaptation.
Preliminary set of mostly process indicators developed. Under review.
South Africa Established outcome-based system will be used to monitor climate change impacts at appropriate spatial densities and frequencies.
Report progress on the implementation of adaptation actions.
Preparatory phase, e.g. the monitoring and evaluation team is being assembled, South Africa’s climate change actions are being mapped, and the National Climate Change Response Database is being updated.
United Kingdom
Mixture of approaches: regular, detailed climate change vulnerability assessments; indicators to monitor changes in climate risks, uptake of adaptation actions and climate impacts; decision-making analysis to evaluate whetherdegreeofadaptationissufficienttoaddress current and future climate risks.
Regular, detailed adaptation-assessments to monitor changes in climate risks using indicators, and evaluating preparedness for future climate change by analysing decision-making processes. Operational.
Source: Based on GIZ (2014)

33
4.1 Indicators used in National Monitoring Systems for Tracking Adaptation
Allnationalmonitoringsystemsuse indicators to trackprogress inadaptation (reflected inTable4). Inaddition they combine these indicators with knowledge inputs from experts in order to interpret the reporting by indicators. Most frameworks mix qualitative and quantitative methods, pilot projects, expert judgements and, for example, group assessments.
Most national-level monitoring systems have organised their indicators according to categories such as exposure indicators, vulnerability indicators, climate change impact indicators, response indicators and so forth. In A few cases (France and Philippines) countries do not use categorisation, as they link their indicatorstospecificactivitiesintheirNAPs.
In Kenya’s national-level monitoring system, outcome-based indicators are provided at the county level to build and measure institutional capacity at that level. An example of such an indicator is the number ofcountyministriesthathavereceivedtraininginaspecificclimate-relatedareaasaresult(outcome)ofinitiatives taken at the national level.
Though both Finland and the United Kingdom use process-based indicators for evaluating progress in adaptation, Finland uses a sector approach, while the United Kingdom focusses on the different administrative levels. Examples of the indicators involved are given in Table 4 below.
Table 4. Comparison of process-based indicators used to evaluate progress in adaptation in Finland and the United Kingdom
Indicators used by the United Kingdom Indicators used by Finland
Getting started:
- Potential threats and opportunities across estate and services starting to be assessed
- Next steps to build on that assessment identifiedandagreedupon
- Need for adaptation recognised among a group of pioneers in the sector
- Little research done on the impacts of or adaptation to climate change
- Someadaptationmeasuresidentifiedbutnot yet implemented
Public commitment and impacts assessment
- Public commitment made to identify, communicate and manage climate-related risk
- Localrisk-basedassessmentofsignificantvulnerabilities and opportunities made
- Need for adaptation measures recognised to some extent in the sector
- Impacts of climate change known indicatively (qualitative information), taking account of the uncertainty involved in climate change scenarios
- Adaptationmeasuresidentifiedandplansmade for their implementation, some of them launched
- Comprehensive risk assessment
- Comprehensive risk-based assessment undertaken and priority risks for services identified
- Most effective adaptive responses identifiedandincorporatedintocouncilstrategies, plans, partnerships and operations
- Adaptive responses implemented in some priority areas
- Need for adaptation measures quite well recognised in the sector
- Impacts quite well known, taking into account uncertainty
- Adaptationmeasuresidentifiedandtheirimplementation launched
- Cross-sectoral cooperation on adaptation measures started
Existing National-Scale Efforts to Monitor and Evaluate Adaptation Policies and Strategies
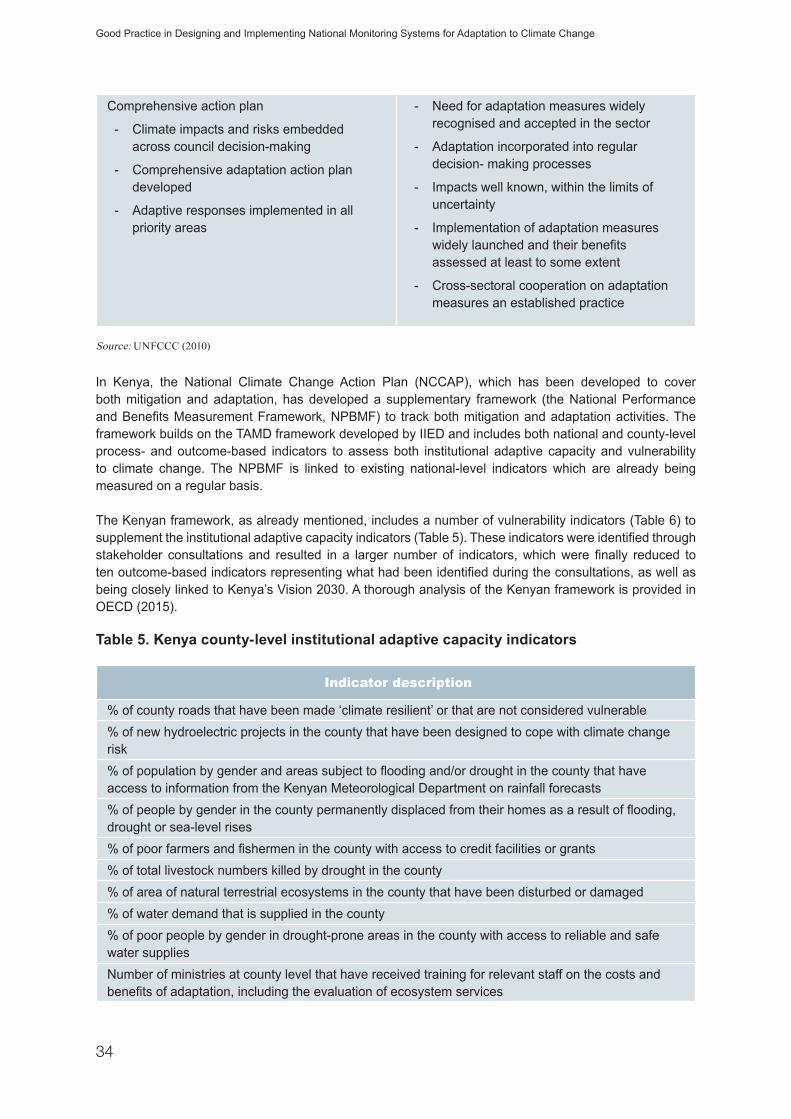
34
Good Practice in Designing and Implementing National Monitoring Systems for Adaptation to Climate Change
Comprehensive action plan
- Climate impacts and risks embedded across council decision-making
- Comprehensive adaptation action plan developed
- Adaptive responses implemented in all priority areas
- Need for adaptation measures widely recognised and accepted in the sector
- Adaptation incorporated into regular decision- making processes
- Impacts well known, within the limits of uncertainty
- Implementation of adaptation measures widelylaunchedandtheirbenefitsassessed at least to some extent
- Cross-sectoral cooperation on adaptation measures an established practice
Source: UNFCCC (2010)
In Kenya, the National Climate Change Action Plan (NCCAP), which has been developed to cover both mitigation and adaptation, has developed a supplementary framework (the National Performance andBenefitsMeasurementFramework,NPBMF) to trackbothmitigationandadaptationactivities.Theframework builds on the TAMD framework developed by IIED and includes both national and county-level process- and outcome-based indicators to assess both institutional adaptive capacity and vulnerability to climate change. The NPBMF is linked to existing national-level indicators which are already being measured on a regular basis.
The Kenyan framework, as already mentioned, includes a number of vulnerability indicators (Table 6) to supplementtheinstitutionaladaptivecapacityindicators(Table5).Theseindicatorswereidentifiedthroughstakeholder consultations and resulted in a larger number of indicators,whichwere finally reduced totenoutcome-basedindicatorsrepresentingwhathadbeenidentifiedduringtheconsultations,aswellasbeing closely linked to Kenya’s Vision 2030. A thorough analysis of the Kenyan framework is provided in OECD (2015).
Table 5. Kenya county-level institutional adaptive capacity indicators
Indicator description
% of county roads that have been made ‘climate resilient’ or that are not considered vulnerable % of new hydroelectric projects in the county that have been designed to cope with climate change risk%ofpopulationbygenderandareassubjecttofloodingand/ordroughtinthecountythathaveaccess to information from the Kenyan Meteorological Department on rainfall forecasts%ofpeoplebygenderinthecountypermanentlydisplacedfromtheirhomesasaresultofflooding,drought or sea-level rises%ofpoorfarmersandfishermeninthecountywithaccesstocreditfacilitiesorgrants% of total livestock numbers killed by drought in the county % of area of natural terrestrial ecosystems in the county that have been disturbed or damaged % of water demand that is supplied in the county% of poor people by gender in drought-prone areas in the county with access to reliable and safe water supplies Number of ministries at county level that have received training for relevant staff on the costs and benefitsofadaptation,includingtheevaluationofecosystemservices

35
Table 6. Kenya national-level vulnerability indicators
Indicator description RVD HRF SLR HFNumber of people by gender permanently displaced from their homesduetodrought,floodorsealevelrises
Y Y Y
Number of hectares of productive land lost to soil erosion Y% rural households with access to water from a protected source Y% urban households with access to piped water YCubic metres per capita of water storage Y % of land area covered by forest Y Y%ofclassifiedroadsmaintainedandrehabilitated YNumber of urban slums with physical and social infrastructure installed annually
Y Y
Number of households in need of food aid Y Y Y Number of County Stakeholder Fora held on climate change Y Y Y Y
Source: OECD (2015)
Key: RVD – increase in rainfall variability and drought; HRF – increase in heavy rainfall and floods; SLR – sea level rise; HF – increase in occurrence of abnormally large hailstones or frost in mountain areas. Note: The figures in [square brackets] are the reference numbers for county-level indicators to which these national-level indicators relate.
4.2 Data
Some national-level monitoring systems are not very data-intensive (Morocco and France) and utilise data which have already been collected, while other systems (United Kingdom) make an effort to collect and aggregate a more diverse and complex set of data. The approach to data aggregation also differs between national-level monitoring systems, with some aggregate data belonging to the sub-national level, some the sectoral or ministerial levels, and others the project and programme level. Few national-level monitoring systems propose to collect new data, and a common denominator between monitoring systems is that they all use data from existing systems. The German monitoring system for adaptation focusses on strengthening existing data sets (for example, in environmental monitoring) by adding adaptation aspects at the federal and state levels. In the Philippines data are taken from an already established community-based monitoring system, whereas in France the data for the adaptation monitoring system is extracted from existing national M&E systems constructed for other purposes at ministerial levels in France. The frameworksandtheirdatasourcesarereflectedinTable7below.
Table 7. National monitoring systems and data requirements
Country Indicators Framework Data resources
Australia Indicators of adaptation drivers, activities and outcomes.
Outcome-based framework
New and existing data sources
Germany Impacts indicators, response indicators
Mixture Existing data sources
France Process and outcome indicators Mixture Existing sectoral M&E systems and data basesfocus on easy access data and simple information
Existing National-Scale Efforts to Monitor and Evaluate Adaptation Policies and Strategies
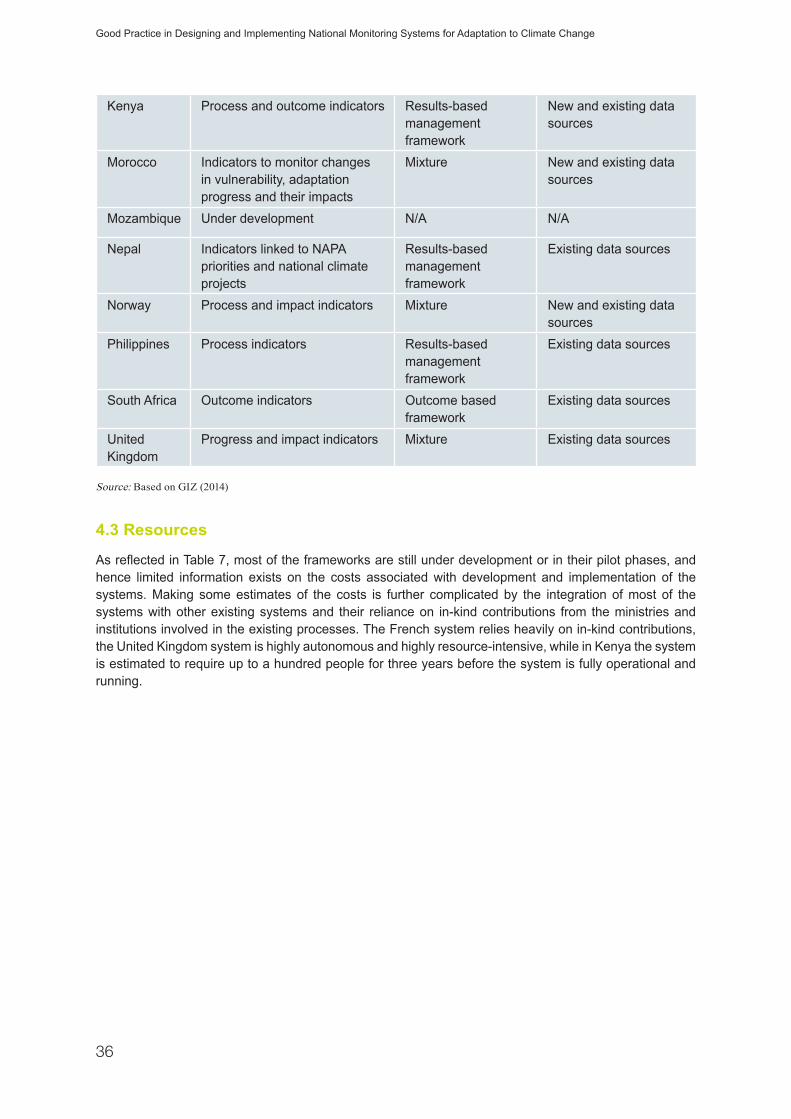
36
Good Practice in Designing and Implementing National Monitoring Systems for Adaptation to Climate Change
Kenya Process and outcome indicators Results-based management framework
New and existing data sources
Morocco Indicators to monitor changes in vulnerability, adaptation progress and their impacts
Mixture New and existing data sources
Mozambique Under development N/A N/A
Nepal Indicators linked to NAPA priorities and national climate projects
Results-based management framework
Existing data sources
Norway Process and impact indicators Mixture New and existing data sources
Philippines Process indicators Results-based management framework
Existing data sources
South Africa Outcome indicators Outcome based framework
Existing data sources
United Kingdom
Progress and impact indicators Mixture Existing data sources
Source: Based on GIZ (2014)
4.3 Resources
AsreflectedinTable7,mostoftheframeworksarestillunderdevelopmentorintheirpilotphases,andhence limited information exists on the costs associated with development and implementation of the systems. Making some estimates of the costs is further complicated by the integration of most of the systems with other existing systems and their reliance on in-kind contributions from the ministries and institutions involved in the existing processes. The French system relies heavily on in-kind contributions, the United Kingdom system is highly autonomous and highly resource-intensive, while in Kenya the system is estimated to require up to a hundred people for three years before the system is fully operational and running.


39
5. Monitoring and Evaluation Systems for Adaptation in the Latin American Region
All Latin American countries4 have developed at least one strategy or plan for climate change and/or adaptation to climate change that establishes development objectives, roles and institutional responsibilities. These long-term instruments guide government action on climate change or adaptation and determine sectoralpriorities.Typicallytheyhavebeendevelopedforthefieldofclimatechangeorforsectorsthatare key to sustainable development, such as in the areas of risk reduction and infrastructure. Although it iscommonforthedocumentsthatoutlinesuchstrategiesorplanstomentiontheimportanceofdefiningindicators in order to assess the country’s or region’s progress in adapting to climate change, few of them includesuchdefinitionsortheirimplementations.
Several examples of programme and project assessments that support the implementation of adaptation toclimatechangeactionsintheregionhavebeenidentified.Theseprogrammesandprojectsaremedium-terminstruments thatdefinetheobjectives typically found in thestrategiesandplansmentioned in thepreceding paragraph. Although their temporal and geographical scope and characteristics are different, we have included some of these experiences in this review not only because they demonstrate greater progress in defining indicators, but also because theyhavebeenassessed throughbaseline surveys,midtermassessmentsorfinalevaluations,aswellassystematisingsomelessonsaroundtheM&Eprocess.
In this analysis, we use publicly available information to present eleven M&E experiences carried out in countries in the region. These experiences include eight government strategies and plans (in Argentina, Brazil, Chile, Colombia, Honduras, Mexico and Panama) and two adaptation programmes and projects (in Bolivia and Peru) (Table 8). Evaluations of individual adaptation practices (see, for example, European Commission 2015; Aldunce et al. 2008) were not included in the analysis.
4 The analysis included a review of experiences from six Central American countries (Costa Rica, El Salvador, Guatemala, Honduras, Nicaragua and Panama) and eleven from South America (Argentina, Bolivia, Brazil, Chile, Colombia, Ecuador, Mexico, Panama, Paraguay, Peru, Uruguay and Venezuela).

40
Good Practice in Designing and Implementing National Monitoring Systems for Adaptation to Climate Change
Box 2. Good practices for the design and operation of M&E systems for adaptation
The M&E systems for programmes and projects that are more limited to regional or local spaces highlight other aspects for making planned adaptation actions more sustainable (see the National Adaptive Capacity Framework in Dixin et al. 2012). These aspects have been used as criteria for assessing good practices for adaptation to climate change actions (see the case of Bolivia in Flores et al. 2010):
• Complete. Refers to the inclusion of relevant factors in the formation of policies, norms and procedures.
• Transparency and Participation. Measures the degree of transparency and participation, evaluating to what extent the information is accessible to the public, has been disseminated and whether it can be utilised. It also assesses whether important stakeholders have access to decision-making through meetings, workshops or forums for consultation, and if decision-makers seek out inputs from different actors to design policies.
• Accountability. Assesses whether institutions have a clear mandate to carry out the adaptation functions; if the supervision systems are appropriate; if the coordination within the institution and with other institutions is adequate; and if there are systems in place for citizens to review and enforce decisions. Also assesses whether there are systems for the institution(s) involved to assume their responsibilities and to be accountable.
• Capacities. Evaluates whether institutions that develop and implement adaptation policies have appropriate knowledge, capacities and budgets.
• Implementation. Aims to learn if the plans and policies have been implemented by the responsible organisations and whether they are implementing plans and programmes.
Before presenting the conceptual frameworks, the types of indicators and the sustainability level of these experiences, we will highlight some aspects of their design and implementation:
• The long-term systems include indicators related to different government sectors and are implemented, or are expected to be implemented, through collaboration among different government agencies and other sectors of society. The programme and project systems place more emphasis on the characteristics of the adaptation process (such as transparency and participation), the progress of the institutional framework and the capacity-building support to civil organisations and local government (Table 9).
• The majority of long-term systems identify indicators only at the national level, without specifying other levels of analysis (such as regions, basins or administrative divisions). Medium-term programmes and projects focus on indicators at the regional or local levels.

41
Table 8. M&E systems related to climate change adaptation in Latin America selected for analysis
Country System Information source
Systems for monitoring government strategies and plans
Argentina National Strategy on Climate Change – Goals and Indicators for Adaptation Measures (ENCC-ARG)
Secretaría de Ambiente y Desarrollo Sustentable de la Nación (2013)
Brazil Health Sector Plan for Climate Change Mitigation and Adaptation (PSS)
Ministério da Saúde (Brasil) (2013)
Chile Mid-term evaluation of National Plan of Action on Climate Change (2008-2012) (PANCC)
Obreque (2011)
Colombia Plan 4C Cartagena de Indias Competitive and Compatible with the Climate (Plan 4C)
Alcaldía Cartagena, MADS, INVEMAR, CDKN, & C. Comercio Cartagena (2014)
Honduras Indicators of Climate Change with a Socioeconomic Approach (ENCC-HND)
UNAH & IHCIT (2014)
Mexico Indicators for the Monitoring and Evaluation of the Adaptation to Climate Change (IACC)
Zorrilla & Altamirano (2014)
Mexico Measurement,Reporting,andVerificationoftheSpecial Climate Change Program (PECC I y II)
CICC (2012), Gobierno de la República de México (2014)
Panama Action Plan for the implementation of National Climate Change Policy (PNCC)
ANAM (n.d.)
Evaluations of programmes and projects
Bolivia Institutional Analysis on Adaptation to Climate Change (ARIA)
Flores et al. (2010)
Bolivia Mid-term Evaluation of the Programme for Agricultural Sustainable Development (PROAGRO)
Kronik, Dockweiler, & Christoplos (2013)
Peru Programme of Adaptation to Climate Change (PACC)
PACC (2011, 2012), MINAM & COSUDE (2013)
Monitoring and Evaluation Systems for Adaptation in the Latin American Region
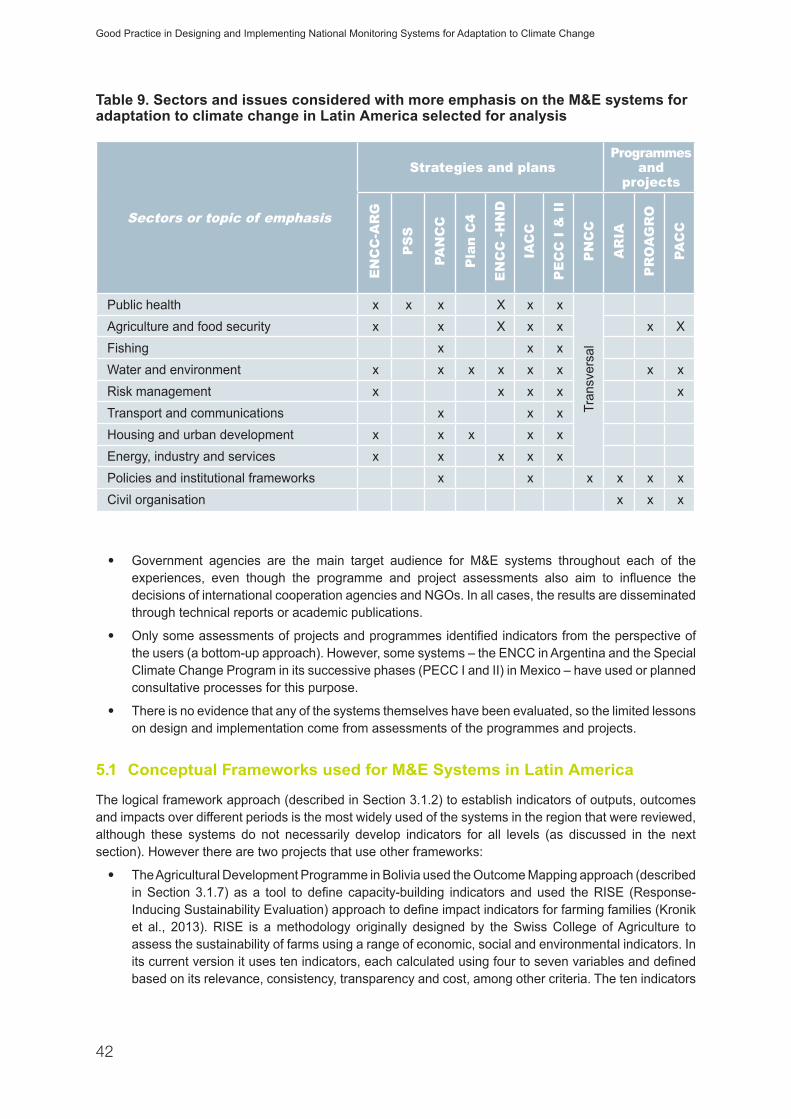
42
Good Practice in Designing and Implementing National Monitoring Systems for Adaptation to Climate Change
Table 9. Sectors and issues considered with more emphasis on the M&E systems for adaptation to climate change in Latin America selected for analysis
Sectors or topic of emphasis
Strategies and plansProgrammes
and projects
EN
CC
-AR
G
PS
S
PAN
CC
Pla
n C
4
EN
CC
-HN
D
IAC
C
PE
CC
I &
II
PN
CC
AR
IA
PR
OA
GR
O
PAC
C
Public health x x x X x x
Tran
sver
sal
Agriculture and food security x x X x x x XFishing x x xWater and environment x x x x x x x xRisk management x x x x xTransport and communications x x xHousing and urban development x x x x xEnergy, industry and services x x x x xPolicies and institutional frameworks x x x x x xCivil organisation x x x
• Government agencies are the main target audience for M&E systems throughout each of the experiences, even though the programme and project assessments also aim to influence thedecisions of international cooperation agencies and NGOs. In all cases, the results are disseminated through technical reports or academic publications.
• Onlysomeassessmentsofprojectsandprogrammesidentifiedindicatorsfromtheperspectiveofthe users (a bottom-up approach). However, some systems – the ENCC in Argentina and the Special Climate Change Program in its successive phases (PECC I and II) in Mexico – have used or planned consultative processes for this purpose.
• There is no evidence that any of the systems themselves have been evaluated, so the limited lessons on design and implementation come from assessments of the programmes and projects.
5.1 Conceptual Frameworks used for M&E Systems in Latin America
The logical framework approach (described in Section 3.1.2) to establish indicators of outputs, outcomes and impacts over different periods is the most widely used of the systems in the region that were reviewed, although these systems do not necessarily develop indicators for all levels (as discussed in the next section). However there are two projects that use other frameworks:
• The Agricultural Development Programme in Bolivia used the Outcome Mapping approach (described inSection3.1.7) asa tool to define capacity-building indicators andused theRISE (Response-InducingSustainabilityEvaluation)approachtodefineimpactindicatorsforfarmingfamilies(Kroniket al., 2013). RISE is a methodology originally designed by the Swiss College of Agriculture to assess the sustainability of farms using a range of economic, social and environmental indicators. In itscurrentversionitusestenindicators,eachcalculatedusingfourtosevenvariablesanddefinedbased on its relevance, consistency, transparency and cost, among other criteria. The ten indicators

43
are:landuse,animalproduction,flowofnutrients,wateruse,energyandclimate,biodiversityandcrop protection, working conditions, quality of life, economic viability, and farm management. RISE has always been applied at the farm level through research work with students (School of Agricultural Forest and Food Sciences, 2013).
• The Rapid Institutional Response for Adaptation method (ARIA) is based on the National Adaptive Capacity (NAC) framework, a methodology developed by the World Resources Institute to evaluate theinstitutionsresponsibleforadaptationtoclimatechange.Theframeworkdefinesfiveinstitutionalfunctions for adaptation: assessment, prioritisation, coordination, information management, and climate risk management (Dixit et al. 2012) (Table 10). The NAC framework can be used to develop indicators to monitor national adaptation programmes and to identify institutional weaknesses that need strengthening. In the case of Bolivia, it was used to assess good practices in implementing policies related to climate change adaptation (Foti et al. 2011).
Table 10. Institutional functions for adaptation, proposed by the National Adaptive Capacity Framework
Function Description
Assessment Adaptation requires that assessments be repeated over time, including assessments of a country’s vulnerability, the impacts of climate change, adaptation practices and the sensitivity of development activities to these impacts.
Prioritisation Assigning priorities at the national level to areas, sectors or populations must take into account the fact that climate impacts will be more severe in some places and that certain populations will be more vulnerable than others. Effective prioritisation involves the participation of a wide range of stakeholders, public transparency, and reviewingandadjustingprioritiesascircumstanceschange.Countriescandefinea wide range of values and criteria during the prioritisation process.
Coordination Adaptation requires action by different actors at multiple levels both within and outside the government in order to avoid duplication of effort and create economies of scale in responding to the challenges. Coordination can start with the establishment of relations and exchanges of information and awareness, and then move towards managing joint decision-making and action. It can be horizontal (e.g. among ministries), vertical (e.g. among national, global and sub-national actors), or among stakeholders (e.g. between government and the private sector).
Information management
This entails the collection, analysis and dissemination of information to support adaptation activities. Relevant information may vary across sectors, countries and the impacts of climate change, but at the least, it should cover climate variables, the state of natural and human systems, and existing coping strategies. Good information management will ensure that the information is useful and accessible to stakeholders. It can also involve awareness-raising or capacity-building for stakeholders to use the information for general adaptation.
Climate risk management
Themajorityofcountriesfacespecificclimaterisks.Climateriskmanagementexamines the institutional capacities needed to address those risks. This requires identifyingspecificrisks,evaluatingtherangeofoptionsforaddressingthem,andselecting and implementing measures to reduce risks. Countries typically apply risk management based on priority sectors.
Summarised from Dixit et al. 2012, p. 15
Monitoring and Evaluation Systems for Adaptation in the Latin American Region

44
Good Practice in Designing and Implementing National Monitoring Systems for Adaptation to Climate Change
5.2 Types of Indicators used in M&E systems in Latin America
The indicatorsused in theM&Esystemsforadaptation inLatinAmericacoverseveralfieldsrelated toclimatic, biophysical and social processes (unplanned processes), the results of planned adaptation actions, and the quality of the adaptation processes (institutional scope for assessment). In most cases, theindicatorsareorganisedbyproductionsectorsorarenotclassified.
The analysis of all the indicators using complementary logic (see Text Box 2) makes it possible to identify the following:
• As in the global experiences reviewed, the largest proportion (49%) of indicators refers to attaining products(outputs).Theseoutputsfallintofiveareas:i)researchanddevelopment;ii)education,training and communication; iii) identifying priorities for adaptation and planning; iv) the creation or strengthening of organisations (mainly public) and coordination among them; and v) the development ormodificationofpublicpoliciesandtheirinstruments.Theseareconsideredoutputsbecausetheindicators refer to the development and delivery of goods and services, regardless of changes in the capabilities of people and organisations or changes to the environment or infrastructure (Table 11).
• A much lower proportion (14%) focuses on results (outcomes). These outcomes correspond to: i) ‘hard’ adaptation measurement outcomes, aimed at reducing sensitivity or exposure to climate change and climate vulnerability, which involve real changes – albeit emerging ones – in the proportion of the exposed population, production models and use of natural resources, infrastructure design or adjustments, and the state of the environment; and ii) ‘soft’ adaptation measurement outcomes aimed at improving the responsiveness of society to threats and impacts, which involve real changes in the perception of climate change and climate variability, the implementation of monitoring and information systems, and the location of technical resources in at-risk sites or sectors.
• An even smaller proportion (9%) focuses on inputs (incomes). These indicators relate to committed financialandhumanresources.
• The total of the above indicators (incomes, outputs and outcomes) refers to the group of indicators of planned actions. Just over a quarter of the indicators (28%) are focused on threats, exposure, impacts and sensitivity to climate change (regarding contextual conditions).
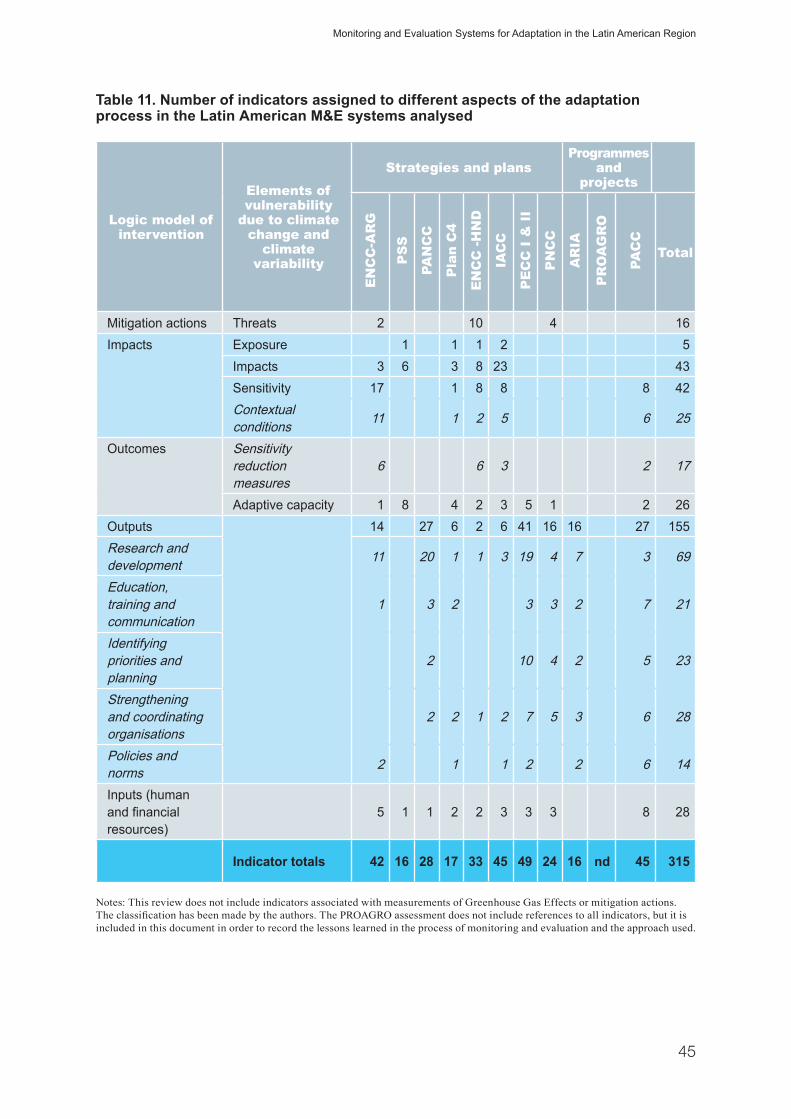
45
Table 11. Number of indicators assigned to different aspects of the adaptation process in the Latin American M&E systems analysed
Logic model of intervention
Elements of vulnerability
due to climate change and
climate variability
Strategies and plansProgrammes
and projects
EN
CC
-AR
G
PS
S
PAN
CC
Pla
n C
4
EN
CC
-HN
D
IAC
C
PE
CC
I &
II
PN
CC
AR
IA
PR
OA
GR
O
PAC
C
Total
Mitigation actions Threats 2 10 4 16Impacts Exposure 1 1 1 2 5
Impacts 3 6 3 8 23 43Sensitivity 17 1 8 8 8 42Contextual conditions 11 1 2 5 6 25
Outcomes Sensitivity reduction measures
6 6 3 2 17
Adaptive capacity 1 8 4 2 3 5 1 2 26Outputs 14 27 6 2 6 41 16 16 27 155Research and development 11 20 1 1 3 19 4 7 3 69
Education, training and communication
1 3 2 3 3 2 7 21
Identifying priorities and planning
2 10 4 2 5 23
Strengthening and coordinating organisations
2 2 1 2 7 5 3 6 28
Policies and norms 2 1 1 2 2 6 14
Inputs (human andfinancialresources)
5 1 1 2 2 3 3 3 8 28
Indicator totals 42 16 28 17 33 45 49 24 16 nd 45 315
Notes: This review does not include indicators associated with measurements of Greenhouse Gas Effects or mitigation actions. The classification has been made by the authors. The PROAGRO assessment does not include references to all indicators, but it is included in this document in order to record the lessons learned in the process of monitoring and evaluation and the approach used.
Monitoring and Evaluation Systems for Adaptation in the Latin American Region

46
Good Practice in Designing and Implementing National Monitoring Systems for Adaptation to Climate Change
Box 3. Types of indicators for M&E systems and their relationship to adaptation processes
For the purposes of this analysis, we empirically classify the indicators of the systems reviewed based on two complementary logics: the sequence of a logical intervention model (described in Section 3.1.2), andtheIPCCframeworktocharacterisevulnerability(IPCC2014).Thisclassificationisbasedontheproposal put forth by Hammill et al. (2014) using an extensive review of adaptation experiences at the global level.
We believe that the indicators that justify the relevance of adaptation actions and demonstrate their positive outcomes and impacts are associated with:
• climate threats(e.g.increasedfrequencyandintensityoffloods),indicatingtheevolutionofaclimate context in which adaptation strategies should respond.
• climate impacts: indicating the current effects of the threats (e.g. % of homes affected by flooding).Theirreductionistheultimategoalofadaptationtoclimatechange.
• exposure to climate hazards: indicating what proportion of the population and their resources couldpotentiallybeaffectedbyclimatethreats(e.g.%ofhousesinareasatriskofflooding).
• society and resource sensitivity: indicating a society’s conditions and the resources that affect its responses to changes in climate (e.g. % families with Unmet Basic Needs or % of arable land without access to irrigation).
• adaptive capacity: indicating a society’s capacity to meet climate change and climate variability threats, respond to the consequences, or – in rare cases – to take advantage of the positive consequences.
Most measures of ‘hard’ adaptation point to decreasing sensitivity by adapting production systems and use of resources, infrastructure and ecological restoration. Other measures of ‘hard’ adaptation aim to decrease exposure (e.g. housing relocation) (Barton, 2009). Consequently, depending on how these indicators are expressed, they can point to characteristics of the context or the impact of adaptation processes.
Most measures of ‘soft’ adaptation are aimed at enhancing adaptive capacity, that is, the population’s awareness of climate processes, the operation of monitoring and information systems, the dissemination of measures to address emergencies, and the allocation of technical resources in the most at-risk places.
We evaluate other indicators for monitoring compliance with planned outputs from adaptation initiatives and committed resources. These output indicators are evaluated because they refer to the production and delivery of goods and services, without necessitating evidence of changes in the capabilities of people and their organisations or in the environment or infrastructure. The review of regional experiences focuses on these outputs and resources:
• research and development
• education, training and communication
• identificationofprioritiesandplanning
• formulation or adapting policies and instruments, intersectoral coordination mechanisms and platforms to share information and come to agreements
• technical personnel and budget allocationInformation about products and resources to implement adaptation actions helps to follow up on the institutional commitments and to verify that attention is being directed to the country’s priorities.

47
• Finally, 28% of the indicators focus on the threats, exposure and impacts of climate change and climate variability, as well as the contextual conditions that define the society’s sensitivity andthe sensitivity of its resources. These indicators are clearly delimited when strategies and plans refer to a sector (PSS in Brazil) or a geographical area (PC4 in Colombia). In cases where plans or strategies are at the national level, they can sometimes cover very specific aspects (health,agriculture and biodiversity in the ENCC in Argentina and Honduras) or more sectors (urban areas and infrastructure, coastal and marine areas, education, water, energy and transport in the IACC inMexico).Apositiveaspectofthedefinitionofthreatindicatorsistheuseofindicesthattranslateclimate observations (e.g. average temperature and precipitation) into information that links changes in weather patterns. This is probably most useful for identifying priorities, such as concentration and precipitationdeficitindexesandtheratioandpercapitaavailabilityofwater.TheENCCinHondurasprovides good examples in this regard.
• Few monitoring systems organise their indicators based on the categories of threat, exposure, potential impacts, awareness and adaptive capacity. Most are based on a cause and effect logic. It is clear that some strategies and plans do not prioritise these indicators, even though they are systematically reported through other mechanisms such as in the CMNUCC’s national communications (but in any case, it would be advisable to mention them explicitly).
• Obviously the proportion of efforts devoted to each one of these aspects is not constant among the different experiences. It is clear that several strategies and plans place a greater focus on impacts and outcomes, such as the PSS in Brazil, the ENCCs in Argentina and Honduras or the IACC in Mexico.Thisisprobablyinordertodefinea“north”intheadaptationprocess.Ontheotherhand,the programmes and projects and the strategy and plan performance evaluations (PECC in Mexico and PANCC in Chile) are more focused on achieving outputs.
• What is not always obvious is the correspondence between the issues addressed by the indicators at the different levels within the same system. For example, in some cases, climate change impacts aredefinedat theagricultural level,whereas in thecaseofurban infrastructure,amorerelevantfocus uses indicators of exposure.
• The majority of systems use quantitative indicators almost exclusively.
5.3 Identification and Selection of Indicators
Several experiences mention the importance of making an inventory based on the M&E efforts carried out in the country. This inventory would include indicators or data related to the different aspects of the adaptation in order to capitalise on the efforts and experiences that already exist and to avoid duplication of effort.
Anotherimportantaspectistohaveclearandagreed-uponcriteriafortheidentificationandselectionofindicators. Some experiences evaluated a long list, while others merely mention their complementarity in a logical chain. A summary of criteria is presented in Table 12.
The ARIA (Flores et al. 2010) framework refers to the importance of including indicators of exposure and climate change impacts, aswell as broad participation and transparency in the identification andselection of indicators. Its recommendations stress the importance of an inventory of M&E efforts related to adaptation to climate change including sub-national initiatives, and of the inventory and selection being carried out in a transparent and well-recorded way, involving several stakeholders.
Monitoring and Evaluation Systems for Adaptation in the Latin American Region
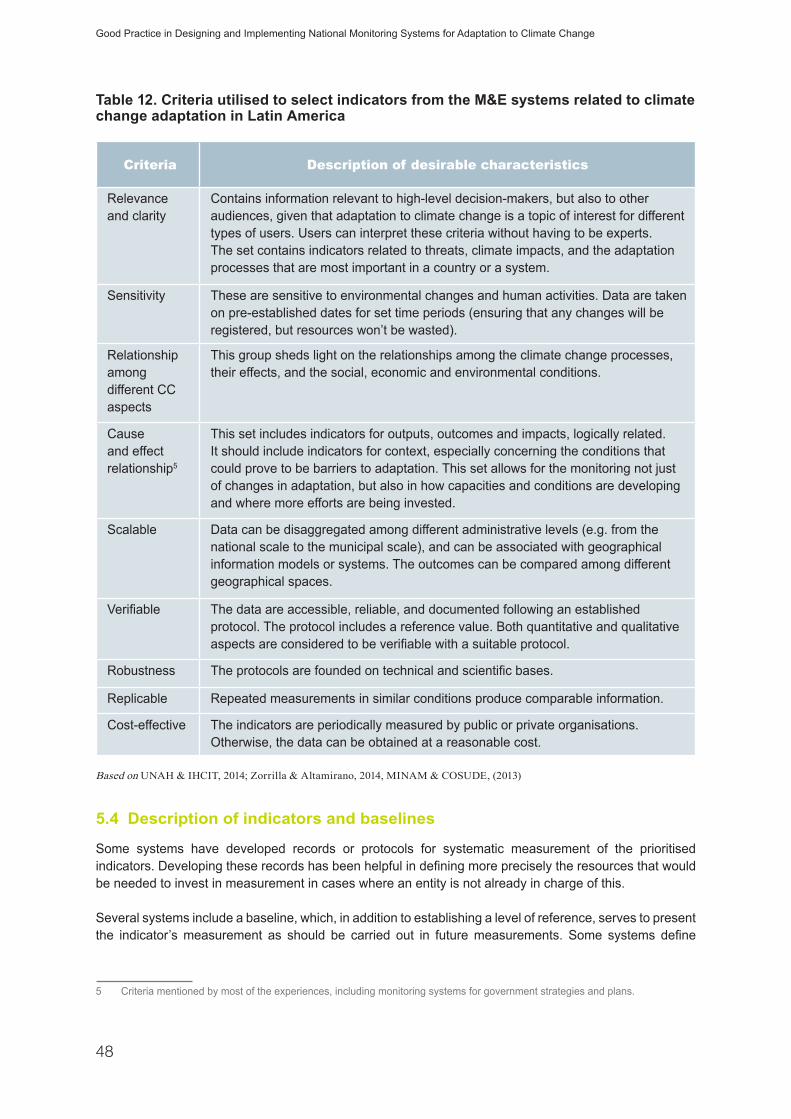
48
Good Practice in Designing and Implementing National Monitoring Systems for Adaptation to Climate Change
Table 12. Criteria utilised to select indicators from the M&E systems related to climate change adaptation in Latin America
Criteria Description of desirable characteristics
Relevance and clarity
Contains information relevant to high-level decision-makers, but also to other audiences, given that adaptation to climate change is a topic of interest for different types of users. Users can interpret these criteria without having to be experts. The set contains indicators related to threats, climate impacts, and the adaptation processes that are most important in a country or a system.
Sensitivity These are sensitive to environmental changes and human activities. Data are taken on pre-established dates for set time periods (ensuring that any changes will be registered, but resources won’t be wasted).
Relationship among different CC aspects
This group sheds light on the relationships among the climate change processes, their effects, and the social, economic and environmental conditions.
Cause and effect relationship5
This set includes indicators for outputs, outcomes and impacts, logically related. It should include indicators for context, especially concerning the conditions that could prove to be barriers to adaptation. This set allows for the monitoring not just of changes in adaptation, but also in how capacities and conditions are developing and where more efforts are being invested.
Scalable Data can be disaggregated among different administrative levels (e.g. from the national scale to the municipal scale), and can be associated with geographical information models or systems. The outcomes can be compared among different geographical spaces.
Verifiable The data are accessible, reliable, and documented following an established protocol. The protocol includes a reference value. Both quantitative and qualitative aspectsareconsideredtobeverifiablewithasuitableprotocol.
Robustness Theprotocolsarefoundedontechnicalandscientificbases.
Replicable Repeated measurements in similar conditions produce comparable information.
Cost-effective The indicators are periodically measured by public or private organisations. Otherwise, the data can be obtained at a reasonable cost.
Based on UNAH & IHCIT, 2014; Zorrilla & Altamirano, 2014, MINAM & COSUDE, (2013)
5.4 Description of indicators and baselines
Some systems have developed records or protocols for systematic measurement of the prioritised indicators.Developingtheserecordshasbeenhelpfulindefiningmorepreciselytheresourcesthatwouldbe needed to invest in measurement in cases where an entity is not already in charge of this.
Several systems include a baseline, which, in addition to establishing a level of reference, serves to present the indicator’smeasurement as should be carried out in futuremeasurements. Some systems define
5 Criteria mentioned by most of the experiences, including monitoring systems for government strategies and plans.
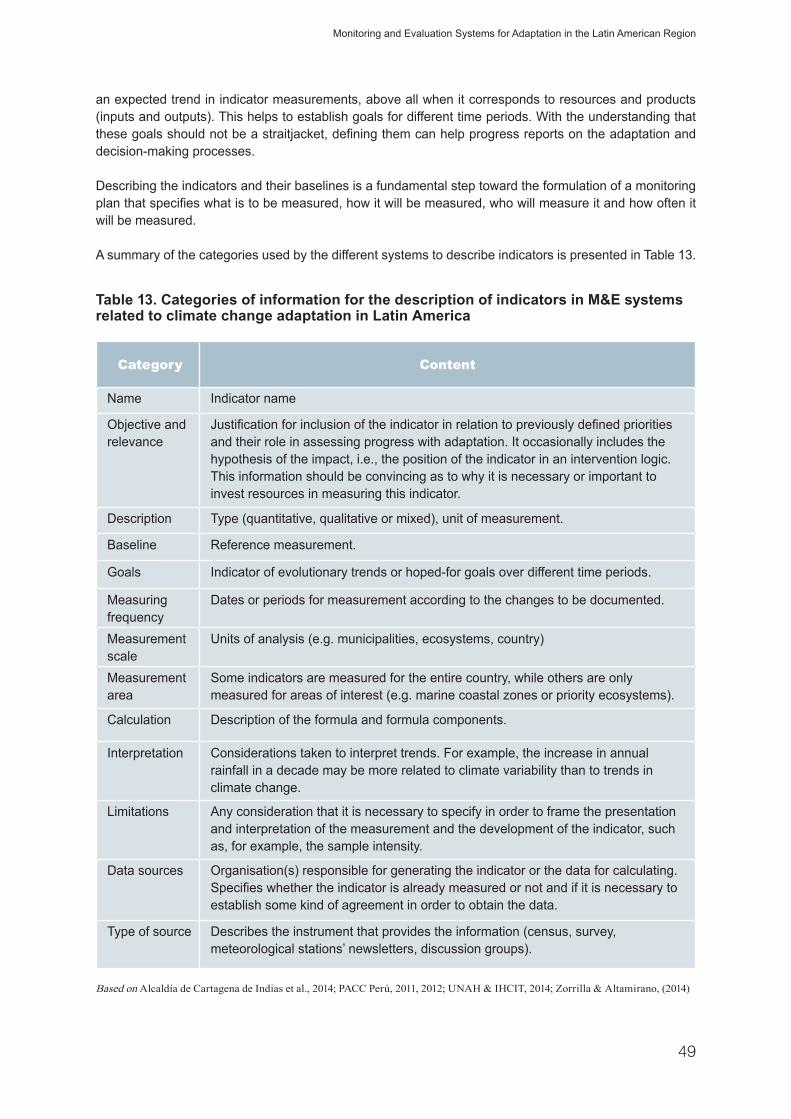
49
an expected trend in indicator measurements, above all when it corresponds to resources and products (inputs and outputs). This helps to establish goals for different time periods. With the understanding that thesegoalsshouldnotbeastraitjacket,definingthemcanhelpprogressreportsontheadaptationanddecision-making processes.
Describing the indicators and their baselines is a fundamental step toward the formulation of a monitoring planthatspecifieswhatistobemeasured,howitwillbemeasured,whowillmeasureitandhowoftenitwill be measured.
A summary of the categories used by the different systems to describe indicators is presented in Table 13.
Table 13. Categories of information for the description of indicators in M&E systems related to climate change adaptation in Latin America
Category Content
Name Indicator name
Objective and relevance
Justificationforinclusionoftheindicatorinrelationtopreviouslydefinedprioritiesand their role in assessing progress with adaptation. It occasionally includes the hypothesis of the impact, i.e., the position of the indicator in an intervention logic. This information should be convincing as to why it is necessary or important to invest resources in measuring this indicator.
Description Type (quantitative, qualitative or mixed), unit of measurement.
Baseline Reference measurement.
Goals Indicator of evolutionary trends or hoped-for goals over different time periods.
Measuring frequency
Dates or periods for measurement according to the changes to be documented.
Measurement scale
Units of analysis (e.g. municipalities, ecosystems, country)
Measurement area
Some indicators are measured for the entire country, while others are only measured for areas of interest (e.g. marine coastal zones or priority ecosystems).
Calculation Description of the formula and formula components.
Interpretation Considerations taken to interpret trends. For example, the increase in annual rainfall in a decade may be more related to climate variability than to trends in climate change.
Limitations Any consideration that it is necessary to specify in order to frame the presentation and interpretation of the measurement and the development of the indicator, such as, for example, the sample intensity.
Data sources Organisation(s) responsible for generating the indicator or the data for calculating. Specifieswhethertheindicatorisalreadymeasuredornotandifitisnecessarytoestablish some kind of agreement in order to obtain the data.
Type of source Describes the instrument that provides the information (census, survey, meteorological stations’ newsletters, discussion groups).
Based on Alcaldía de Cartagena de Indias et al., 2014; PACC Perú, 2011, 2012; UNAH & IHCIT, 2014; Zorrilla & Altamirano, (2014)
Monitoring and Evaluation Systems for Adaptation in the Latin American Region
50
Good Practice in Designing and Implementing National Monitoring Systems for Adaptation to Climate Change
5.5 Implementation and sustainability of M&E systems
The operation of systems to evaluate progress in government strategies and plans is usually internalised in government or inter-government agencies (e.g. the Ministry of Health in Brazil for PSS, the Inter-institutional Commission on Climate Change in Cartagena de Indias for Plan 4C). However, it was not alwayspossibletofindevidenceofitsimplementation.Othersystemswereimplementedbygovernmentagencies and had reports presented on their implementation, but they are no longer in operation (e.g. Measurement,ReportingandVerificationfortheSpecialProgrammeonClimateChangeinPhasesIandII with SERMANAT in Mexico).6 This is also the case for the M&E systems for projects and programmes, which,bytheirnature,haveadefinedperiodofexecution.
The experiences implemented make mention of some important criteria for implementation and sustainability over time. The main recommendations arising from the experiences relate to the use of the system in decision-making and in creating awareness, the institutionalisation of the system, the collection andprocessingofdata,continuousimprovementstothesystemanditsflexibility.Theserecommendationsare presented in the following chapter.
6 Foradetailedexampleofmeasuring,reportingandverificationmechanisms,seethePECCIreport,whichisavailable on-line (CICC, 2012).


53
6. Emerging Lessons
Thisreportisoneoftheearliesttoreviewsomeofthelessonsarisingfromthedevelopingfieldofbuildingindicator systems for monitoring and evaluating climate change adaptation at the national level, and then implementing such systems. Based on a review of methods, approaches and experiences for setting up an appropriate indicator system for the monitoring and evaluation of climate change adaptation, the following emerging lessons are suggested as supporting relevant stakeholders in designing and setting up such indicator systems.
On system design
One of the main challenges when designing and implementing an indicator system for M&E is to choose an appropriate set of indicators which focuses on the key issues and information needed for decision-making. To select appropriate indicators for decision-making, the indicators should reflect the context(local or national) and the processes that are to be monitored, while also capturing the progress of these processes. Before selecting indicators through clearly defined and previously agreed upon criteria,consideration should be given as to what would appropriately be relevant for the local contexts, as this can vary considerably even within, for example, a country or municipality. If indicators are not adequately context-specificordescribedinanunderstandableway,theymaybeinterpretedindifferentandconfusingways. To ensure clear understanding for those who will be implementing the indicator system, a hypothesis can be formulated and linked to each of the proposed indicators.
Someexperiencesrelyontheuseofatheoryofchangeinordertodefineasetofindicators,whileotherexperiencesusedifferentfactorsthatdefineclimatechangevulnerability(exposure,impacts,sensitivity)asaguide. Inanycase, thesetof indicatorsshouldestablishaclearrelationshipamongthe identifiedinterventions, threats, impacts and exposure. This does not require building a logical framework, but rather demonstrating that the prioritisation of actions is actually focusing on a useful priority.
On system implementation
A key lesson of existing indicator systems is that they rely mainly on data from existing systems, and focus on strengthening existing data sets either by adding adaptation or using well-established monitoring systems constructed for other purposes. Examples include the indicators for the Millenium Development Goals (UN), indicators for the Human Development Reports (UNDP) and the National Communications for the UNFCCC. Integrating the indicator system into existing development structures and procedures would, in addition to reducing the work burden, also highlight the fact that adaptation is an integral part of sustainable development. In any case, there must be a clear allocation to an organisation or group of organisations that have a mandate to implement and maintain the system (with adequately trained personnelandotherresourcestomaintainthesystemandtodevelopspecificreportsaboutadaptationto climate change). Several experiences show how the use of simple manuals and online platforms can facilitate data collection and effectively distribute the effort throughout a number of organisations, including the private sector and civil society.
On the use of the system in decision-making and raising awareness
The systematic inclusion of M&E reports in decision-making spaces involves defining mandates andreporting channels with established authorities, but also knowing the decision-makers’ informational needs. On the other hand, the use of M&E system outputs is a great opportunity to develop awareness of

54
Good Practice in Designing and Implementing National Monitoring Systems for Adaptation to Climate Change
the relevance of climate change and adaptation to climate change among decision-makers from different sectors, such as the government, the private sector and society in general. It is not enough to just report on the goals achieved; rather, it is also necessary to analyse how the context is evolving, how this relates to the success of the interventions, and whether the lines of intervention should be adjusted accordingly.
On system flexibility and adjustments
Measuring progress in adaptation to climate change in terms of what and howisstillanemergingfield.Adaptation is a complex process over the long term, one about which we still know very little. There is uncertainty associated with climate change and climate variability, as well as with the contextual conditions. Therefore,theapproachtosettingupanindicatorsystemformonitoringandevaluatingshouldbeflexibleandpragmaticintermsofsettinggoals,definingprocesses,selectingindicators,findingadequatedata,and so forth. Being too strict in one’s approach could entail the risk of not being able to fulfil all therequirements and hence never reaching the implementation stage.
It should be emphasised that monitoring and evaluation systems are ongoing processes that need continuous adjustments to changing and growing experiences, capacities and environments. Hence, regular reviews andadjustmentsarenecessary to reflectand incorporate thesechangesand tomaintainand improvethe performance of these systems. The use of feedback systems for improvement, or mechanisms such as peer review or independent evaluations to verify the quality of the reports, have proved helpful in this regard. Likewise, it is important to programme spaces to give value to the accumulated experiences in terms of system operation and the delivery of information to different target audiences.
On the participation of different stakeholders and the transparency of the system
As a country-driven process, the involvement of all relevant stakeholders is crucial during the design and implementation stages of an indicator system. The value of involving a wide range of relevant stakeholders is that the country will progress and become stronger in terms of tackling climate change because the processprovidesanidealsettingforstakeholdersthatplaysufficientlycrucialrolesinacountry’spolicyandplanning processes to become engaged in climate change issues. Having a participatory approach also ensures that different interests are well represented while simultaneously ensuring a political commitment to the indicator systems. Another important consideration for the process is to have mechanisms that guarantee transparency, accountability and capacity-building. The latter is important in terms of resource allocation and commitment during both the development and the implementation of the indicator system.

55
7. References
ADB. (2006). An Introduction to Results basesd Management: Principles, Implications and Applications. Manila: Asian Development Bank. http://www.adb.org/sites/default/files/institutional-document/32577/files/introduction-results-management.pdf
Adger, W. N., N. W. Arnell, and E. L. Tompkins. (2005). Successful adaptation to climate change across scales. Global Environmental Change-Human and Policy Dimensions 15 (2):77-86.
Adger, N. (2006). Vulnerability. Global Environmental Change 16: 268–281
Alcaldía de Cartagena de Indias, Ministerio de Ambiente y Desarrollo Sostenible (MADS), Instituto de Investigaciones Marinas y Costeras (INVEMAR), Climate and Development Knowledge Network (CDKN), and Cámara de Comercio de Cartagena de Indias. (2014). Plan 4C: Cartagena de Indias Competitiva y Compatible con el Clima. (A. P. Zamora, Á. López, V. Trujillo, C. Martínez, G. Llinás, and M. Lacoste, eds.). Cartagena de Indias, Colombia: Serie de publicaciones generales de INVEMAR No. 63. Retrieved from http://www.invemar.org.co/redcostera1/invemar/docs/12000063_Plan_4C_web.pdf
Aldunce, P., Neri Vidaurri, C., and Szlafsztein, C. (2008). Hacia la evaluación de prácticas de adaptación ante la variabilidad y el cambio climático. Belém: NUMA, UFPA.
Autoridad Nacional del Ambiente Panamá (ANAM). (n.d.). Plan de acción para la Implementación de la Política Nacional de Cambio Climático. Panamá: Autoridad Nacional del Ambiente. Retrieved from http://cambioclimatico.cridlac.org/wp-content/uploads/Plan_estrategico_CC_PA.pdf.
Barton,J.R.(2009).Adaptaciónalcambioclimáticoenlaplanificacióndeciudades-regiones.Revista de Geografía Norte Grande, 43, 5–30. http://doi.org/10.4067/S0718-34022009000200001
Bakewell, O., and Garbu, A. (2005). The Use and Abuse of the Logical Framework Approach. Stockholm: Swedish International Development Cooperation Agency (SIDA).
Bours, D., MacKinn, C. and Pringle, P. (2013). Monitoring and evaluation for climate change adaptation: A synthesis of tools, frameworks and approaches. SEA Change CoP, Phnom Penh and UKCIP, Oxford.
Brooks, N., Anderson, S., Ayers, J., Burton, I., and Tellam, I. (November 2011). Tracking and Measuring Development. IIED: Climate Change Working Paper No. 1, 1-36. http://pubs.iied.org/pdfs/10031IIED.pdf
CIDA. (2001). Logical Framework: Making it Results-Oriented. Ethiopia-Canada Cooperation Office – CanadianInternational Development Agency. http://www.cida-ecco.org/CIDARoadMap/RoadMapEnvoy/documents/LFA%20-%20Making%20it%20Results%20Oriented.pdf
Comisión Europea. (2015). Compendio de experiencias latinoamericanas y europeas en adaptación y mitigación con beneficios adicionales. Bruselas: Programa EUROCLIMA, Dirección General de Desarrollo y Cooperacion - EuropeAid, Comisión Europea.
Comisión Intersecretarial de Cambio Climático (CICC). (2012). Informe de Avances del Programa Especial de Cambio Climático 2009 - 2012. México DF: Secretaría de Medio Ambiente y Recursos Naturales (SERMANAT). Retrieved from http://www.conagua.gob.mx/CONAGUA07/Contenido/Documentos/pecc12.pdf
DFID. (2011). Guidance on using the revised Logical Framework: a DFID practical paper. London, The United Kingdom: Department for International Development. https://www.gov.uk/government/uploads/system/uploads/attachment_data/file/253889/using-revised-logical-framework-external.pdf
Dixit, A., McGray, H., Gonzáles, J., and Desmond, M. (2012). Ready or Not: Assessing Institutional Aspect of National Capacity for Climate Change Adaptation. Washington DC: World Resources Institute.

56
Good Practice in Designing and Implementing National Monitoring Systems for Adaptation to Climate Change
Eakin H., Luers, A. L. (2006) Assessing the vulnerability of social environmental systems. Ann Rev Environ Resour 31:365–394
Earl, S., Carden, F., and Smutylo, T. (2001). OutcomeMapping:building learningand reflection intodevelopmentprogram. Ottawa: International Development Research Centre. http://www.idrc.ca/EN/Resources/Publications/Pages/IDRCBookDetails.aspx?PublicationID=121
EC-CSF. (2011). Introduction to Monitoring and Evaluation Using the Logical Framework Approach. European Commission Civil Society Fund in Ethiopia.
Farrell, G. M. (2009). Results-Based Monitoring and Evaluation at the Commonwealth of Learning: A Handbook. Commonwealth of Learning: Vancouver. http://www.col.org/PublicationDocuments/pub_MEHandbook_web.pdf
Flores, T., Solíz, C. A., Nagumo, K., and Carpiles, C. H. (2010). Análisis Institucional sobre la Adaptación al Cambio Climático en Bolivia: una evaluación de la sociedad civil y recomendaciones para la acción. La Paz. Retrieved from http://kp.iadb.org/Adaptacion/es/Cono-Sur/Documentos Cono Sur/Analisis_institucion_ACC. Bolivia.pdf
Foti, J., Flores-Bedregal, T., and Saeed, A.-R. (2011). Demand for Climate Change Governance: An Approach with Case Studies from Ghana and Bolivia. Washington DC: World Resources Institute. Retrieved from http://www.wri.org/sites/default/files/uploads/aria_wp_v2.pdf
GEF. (2014) Updated results-based management framework for adaptation to climate change under the least developed countries fund and the special climate change fund. Global Environment Facility, Washington, US. http://www.thegef.org/gef/sites/thegef.org/files/GEF-LDCF.SCCF_.17-05%2C%20Updated%20RBM%20Framework%20for%20Adaptation%20to%20Climate%20Change%2C%202014-10-08.pdf
GIZ. (2013). Philippines: Developing an M&E system for the National Climate Change Action Plan. Available at: https://gc21.giz.de/ibt/var/app/wp342deP/1443/index.php/knowledge/monitoring-evaluation/philippinesdeveloping-an-me-system-for-the-national-climatechange-action-plan/
GIZ. (2014) Monitoring and Evaluating Adaptation at Aggregated Levels: A Comparative Analysis of Ten Systems. GIZ. Bonn, Germany. Available at: http://www.giz.de/expertise/html/12269.html
Gobierno de la República de México. (2014). Versión de difusión del Programa Especial de Cambio Climático 2014-2018. México DF: Gobierno de la República de México. Retrieved from http://www.cenapred.unam.mx/es/documentosWeb/Avisos/cambio_climatico.pdf
GTZ. (15. May 2002). Interactive Community Planning: ZOPP : Goal Oriented Project Planning. Massachusetts Institute of Technology: http://web.mit.edu/urbanupgrading/upgrading/issues-tools/tools/ZOPP.html
Hall, J. W., Lempert, R. J., Keller, K., Hackbarth, A., Mijere, C., and McInerney, D. J. (2012). Robust Climate Policies Under Uncertainty: A Comparison of Robust Decision Making and Info-Gap Methods. Risk Analysis, 32(10), 1657–1672.
Hammill, A., Dekens, J., Leiter, T., Klockemann, L., Stock, E., and Gläser, A. (2014). Repository of Adaptation Indicators: real cases examples from national monitoring and evaluation systems. Bonn: GIZ.
Hedger, M., Mitchell, T., Leavy, J., Greeley, M., Downie, A., and Horrocks, L. (2008). Desk Review: Evaluation of Adaptation to Climate Change from a Development Perspective. Brighton: Institute of Development Studies. Retrieved January9,2015,fromhttp://www.unisdr.org/files/7845_GEF20final20report20Oct20081.pdf
Helming, S., and Göbel, M. (1997). ZOOP: Objectives-oriented Project Planning -A planning guide for new and ongoing projects and programmes. Eschborn: Deutsche Gesellschaft für Technische Zusammenarbeit (GTZ) GmbH.
IDRC. (n.d.). The Challenges of Assessing Development Impacts. Hentede February. International Development ResearchCentre:http://www.idrc.ca/EN/Programs/Evaluation/Documents/om_pamplet_final.pdf
IFRC. (2011). Project/programme monitoring and evaluation guide. Geneva: The International Federation of Red Cross and Red Crescent Societies. Retrieved from http://www.ifrc.org/Global/Publications/monitoring/IFRC-ME-Guide-8-2011.pdf

57
IIED. (2013). Tracking Adaptation and Measuring Development (TAMD) climate change indicators: methodological notes. PreventionWeb: http://www.preventionweb.net/english/professional/publications/v.php?id=31807
IIED. (28. October 2014). The Tracking Adaptation and Measuring Development (TAMD) framework. Hentede 23. February 2015 fra International Institute for Environment and Development: http://www.iied.org/tracking-adaptation-measuring-development-tamd-framework
Imbach, A. C., Dudley, E., Ortiz, N., & Sánchez, H. (1997). Participatory and Reflective Analytical Mapping forSustainability (PRAM). IUCN/IDRC International Assessment Team and pilot country teams in Colombia, India and Zimbabwe. IUCN Publication Services Unit, Cambridge. UK
IPCC, Intergovernmental Panel on Climate Change (2001). Third Assessment Report of the IPCC. Cambridge University Press, Cambridge, UK
IPCC, Intergovernmental Panel on Climate Change (2007). Climate Change 2007: Impacts, adaptation and vulnerability. Contribution of Working Group II to the fourth assessment report of the Intergovernmental Panel on Climate Change. Cambridge University Press, Cambridge UK
IPCC, Intergovernmental Panel on Climate Change (2014). Climate Change 2014: Impacts, Adaptation, and Vulnerability. Summary for policymakers. (C. B. Field and V. R. Barros, Eds.). IPCC.
Jensen, G. (July 2010). The Logical Framework Approach. Accessed 19. February 2015 from Dochas: The Irish Association for Non-Governemtal Development Organizations: http://www.dochas.ie/Shared/Files/4/BOND_logframe_Guide.pdf
Jones, H., and Hearn, S. (October 2009). Outcome Mapping: a realistic alternative for planning, monitoring and evaluation.Hentede19.February2015fraOverseasDevelopmentInstitute:http://www.odi.org/sites/odi.org.uk/files/odi-assets/publications-opinion-files/5058.pdf
Karkoschka, O., Menzel, S., Olivier, J., and Scholze, M. (2013). Guidance for Integrating Monitoring and Evaluation of Climate Change Adaptation into Strategies in Mongolia.Eschborn,Germany:ClimateChangeCoordinationOffice,MEGD and Deutsche Gesellschaft für Internationale Zusammenarbeit (GIZ) Gmb. http://www.seachangecop.org/sites/default/files/documents/2013%2007%20GIZ%20-%20Guidance%20for%20Integrating%20M%26E%20of%20CCA%20into%20Strategies.pdf
Kronik, J., Dockweiler, M., and Christoplos, I. (2013). Evaluación de Medio Término del Programa de Desarrollo Agropecuario Sustentable PROAGRO - Bolivia. Estocolmo.
Kusek, J. Z., and Rist, R. C. (2004). Ten Steps to a Results-Based Monitoring and Evaluation System: A Handbook boxfor Development Practitioners. Washington D.C.: The World Bank. https://openknowledge.worldbank.org/bitstream/handle/10986/14926/296720PAPER0100steps.pdf?sequence=1
Lempert, R. J., and Collins, M. T. (2007). Managing the Risk of Uncertain Threshold Responses: Comparison of Robust, Optimum, and Precautionary Approaches. Risk Analysis, 27(4), 1009–1026.
Lempert, R. J., Groves, D. G., Popper, S. W., and Bankes, S. C. (2006). A General, Analytic Method for Generating Robust Strategies and Narrative Scenarios. Management Science, 52(4), 514 - 528.
Lempet, R. J., and Kalra, N. (2011). Managing Climate Risks in Developing Countries with Robust Decision Making. Washington D.C.: World Resources. http://www.wri.org/sites/default/files/uploads/wrr_lempert_and_kalra_uncertainty_.pdf
McCarthy, J. J., Canziani, O., Leary, N. A., Dokken, D. J., White, K. S. (eds.) (2001). Climate Change 2001: Impacts, Adaptation and Vulnerability. IPCC Working Group II. Cambridge University Press, Cambridge
Mertz O, Halsnæs K, Olesen JE, Rasmussen K (2009a). Adaptation to Climate Change in Developing Countries. Environmental Management 43: 743-752.
Ministério da Saúde (Brasil). (2013). Plano Setorial da Saúde para Mitigação e Adaptação à Mudança do Clima. Brasilia: Gobierno Federal. Retrieved from http://www.mma.gov.br/images/arquivo/80076/Saude.pdf
References
58
Good Practice in Designing and Implementing National Monitoring Systems for Adaptation to Climate Change
Ministerio del Ambiente (Perú), and Agencia Suiza para el Desarrollo y la Cooperación (COSUDE). (2013). Propuesta de Plan de Segunda Fase Fortaleciendo capacidades públicas y privadas para la adaptación al cambio climático de la Población Rural Altoandina de Agricultura de Subsistencia.
OECD (2015), National Climate Change Adaptation: Emerging Practices in Monitoring and Evaluation, OECD Publishing, Paris. Available at: http://dx.doi.org/10.1787/9789264229679-en
Obreque, F. (2011). Evaluación de Medio Término del Plan de Acción Nacional de Cambio Climático 2008- 2011. Retrieved from http://www.sinia.cl/1292/w3-article-51202.html
PCI. (1979). TheLogicalFramework:AManager'sGuidetoaScientificApproachtoDesignandEvaluation. Washington D.C.: Practical Concepts Incorporated. http://usaidprojectstarter.org/sites/default/files/resources/pdfs/The-Logical-Framework-A-Managers-Guide.pdf
Programa de Adaptación al Cambio Climático (Perú). (2011). Informe de Línea de Base: Sistema de Monitoreo y Evaluacion de Contexto, Resultados e Impactos del Programa de Adaptación al Cambio Climático - PACC Perú. Retrieved from http://www.paccperu.org.pe/publicaciones/pdf/86.pdf
Programa de Adaptación al Cambio Climático (Perú). (2012). Informe Final del Sistema de Monitoreo y Evaluación del Contexto, Resultados e Impactos del Programa de Adaptación al Cambio Climático - PACC Perú. Retrieved from http://www.paccperu.org.pe/publicaciones/pdf/85.pdf
Roche, C. J. (1999). Impact Assessment for Development Agencies: Learning to Value Change. Oxford, UK: Oxfam.
RAND Corporation. (2013). Research Briefs: Making Good Decisions Without Predictions – Robust Decision Making for Planning Under Deep Uncertainty. (Rand Corporation) http://www.rand.org/pubs/research_briefs/RB9701.html
Sanahuja, H. E. (2011). Tracking Progress for Effective Action: A Framework for Monitoring and Evaluating Adaptation to Climate Change.WashingtonD.C.: Climate-Eval. https://www.climate-eval.org/sites/default/files/studies/Climate-Eval%20Framework%20for%20Monitoring%20and%20Evaluation%20of%20Adaptation%20to%20Climate%20Change.pdf
Sambodhi (n.d.) A Framework for Monitoring and Evaluation of Climate Change Adaptation Interventions. Discussion Paper 5. Sambodhi Research and Communications Pvt. Ltd. India.
Schiavo-Campo, S. (1999). Performance in the public sector. Asian Journal of Political Science, 7(2), 75-87.
School of Agricultural Forest and Food Sciences. (2013). RISE (Response Inducing Sustainability Evaluation): Análisis desostenibilidadaniveldefincaparainducircambiosenlaproducciónagropecuaria.Burgdorf,Suiza.Retrievedfromhttps://www.hafl.bfh.ch/fileadmin/docs/Forschung_Dienstleistungen/Agrarwissenschaften/Nachhaltigkeitsbeurteilung/RISE/Descripcion_de_RISE_es.pdf
Scriven, M. (1998). The new science of evaluation. Scandinavian Journal of Social Welfare, 7(2), 79-86.
Secretaría de Ambiente y Desarrollo Sustentable de la Nación (Argentina). (2013). Estrategia Nacional en Cambio Climático: Medidas de Adaptación - Desarrollo de Indicadores y Metas. Buenos Aires. Retrieved from http://www.ambiente.gov.ar/archivos/web/UCC/file/2013_12_05_Estrategia Nacional en Cambio Climático - IndicadoresAdaptación VF(1).pdf
Smit, B., Pilifosova, O. (2001) Adaptation to Climate Change in the Context of Sustainable Development and Equity. Chapter 18 in McCarthy, J. J., Canziani, O., Leary, N. A., Dokken, D. J., White, K. S. (eds.), Climate Change 2001: Impacts, Adaptation, and Vulnerability – Contribution of Working Group II to the Third Assessment Report of the Intergovernmental Panel on Climate Change. Cambridge University Press, Cambridge, UK.
Spearman, M., and McGray, H. (2011). Making Adaptation Count: Concepts and Options for Monitoring and Evaluation of Climate Change Adaptation. Eschborn: Deutsche Gesellschaft für Internationale Zusammenarbeit (GIZ). Retrieved January 8, 2015, from http://pdf.wri.org/making_adaptation_count.pdf
59
Spreckley, F. (2009). Results Based Monitoring and Evaluation Toolkit (2nd udg.). (S. Hunt, Red.) Herefordshire, the United Kingdom: Local Livelihoods. http://www.theoryofchange.org/wp-content/uploads/toco_library/pdf/RBPME_Toolkit.pdf
Swart, R., Robinson, J., Cohen, S. (2003) Climate Change and Sustainable Development: Expanding the Options. Climate Policy 3(1), S19-S40
Universidad Nacional Autónoma de Honduras (UNAH), and Instituto Hondureño de Ciencias de la Tierra (IHCIT). (2014). Indicacores de Cambio Climático con enfoque socioeconómico.
UNDG. (2010). Results-Based Management Handbook: strengthening RBM harmonization for improved development results.UnitedNationsDevelopmentGroup.http://www.un.cv/files/UNDG%20RBM%20Handbook.pdf
UNDP. (July 2007). UNDP's Draft Monitoring and Evaluation Framework for Adaptation. http://www.seachangecop.org/files/documents/2007_UNDP_ME_Framework_for_CCA_draft.pdf
UNDP. (2009). Handbook on Planning, Monitoring and Evaulating for Development Results. New York: United Nations Development Programme. http://web.undp.org/evaluation/handbook/documents/english/pme-handbook.pdf
UNEG. (2007). The Role of Evaluation in Results Based Management. New York: United Nations Evaluation Group. http://www.unevaluation.org/document/detail/87
UNFCCC (2010). Synthesis report on efforts undertaken to monitor and evaluate the implementation of adaptation projects, policies and programmes and the costs and effectiveness of completed projects, policies and programmes, and views on lessons learned, good practices, gaps and needs. UNFCCC, Bonn, Germany. http://unfccc.int/resource/docs/2010/sbsta/eng/05.pdf
UNHCR. (2003). Sexual and Gender-Based Violence against Refugees, Returnees and Internally Displaced Persons: Guidelines for Prevention and Response. Geneva: United Nations High Commissioner for Refugees. Retrieved from http://www.unhcr-centraleurope.org/pdf/what-we-do/caring-for-vulnerable-groups/sexual-and-gender-based-violence/unhcr-guidelines-for-prevention-and-response-to-sexual-and-gender-based-violence.html
Vincent K. (2007). Uncertainty in adaptive capacity and the importance of scale. Global Environmental Change 17: 12-24.
Watkiss, P., and Dynzynski, J. (2013). Decision Support Methods for Climate Change Adaptation: Robust Decision Making; Summary of Methods and Case study Examples from the MEDIATION Project. Oxford: Stockholm Environment Institute. http://www.sei-international.org/publications?pid=2397
WFP. (2009). Monitoring and Evaluation Guidelines. Rome: United Nations World Food Programme: Office ofEvaluation. http://documents.wfp.org/stellent/groups/public/documents/ko/mekb_module_14~4.pdf
Zorrilla, M., andAltamirano,M. Á. (2014). Identificación de Indicadores para el Monitoreo y la Evaluación de laAdaptación al Cambio Climático en Mexico. México DF. Retrieved from https://gc21.giz.de/ibt/var/app/wp342deP/1443/wp-content/uploads/filebase/uploads/Sistema_de_Indicadores_para_MandE_de_la_Adaptacion.pdf
References


61
60
Anne
x 1.
Sec
tor-
Spec
ific I
ndic
ator
s
Sect
or
Inte
rven
tion
Indi
cato
r Ty
pe
Indi
cato
r Ev
alua
tion
Crite
ria
Data
Req
uire
men
t M
easu
rem
ent T
ool
1 In
frastr
uctu
re
Cons
truct
ion
of d
yke
for p
reve
ntin
g coa
stal
flood
ing
Proc
ess
Desig
n co
mpl
iance
Im
plem
enta
tion/
Co
mpl
iance
De
sign
Docu
men
ts Fie
ld ev
aluat
ion
Outc
ome
Cost
of i
nves
tmen
t vs.
bene
ficiar
ies
Effic
iency
Av
erag
e use
rs fo
r a ti
me p
erio
d an
d co
st
of in
vest
men
t Pr
ojec
t Acc
ount
s for
tota
l and
sa
mpl
e sur
vey f
or u
sers
Impa
ct In
crea
se in
num
ber o
f be
nefic
iaries
Be
nefic
iaries
Nu
mbe
r of b
enef
iciar
ies w
ith an
d wi
thou
t inf
rast
ruct
ure
Sam
ple s
urve
y
2 He
alth
Adm
inist
ratio
n of
a va
ccin
e to
prev
ent
viral
infe
ctio
n
Proc
ess
Med
ical p
roce
dure
co
mpl
iance
Im
plem
enta
tion/
Co
mpl
iance
Gu
idan
ce d
ocum
ent
Sam
ple s
urve
y
Outc
ome
Num
ber o
f peo
ple
imm
unize
d Be
nefic
iaries
Nu
mbe
r of p
eopl
e adm
inist
ered
vacc
ine
Med
ical r
ecor
ds
Impa
ct In
crea
se in
aver
age
lifes
pan
Effe
ctive
ness
Av
erag
e age
of l
ife sp
an o
f tar
get
popu
latio
n Fie
ld su
rvey
s; ce
nsus
reco
rds
3 Ag
ricul
ture
Ad
min
istra
tion
of a
new
crop
ping
te
chni
que
Proc
ess
Amou
nt o
f pes
ticid
e ad
min
ister
ed
Impl
emen
tatio
n/
Com
plian
ce
Guid
ance
doc
umen
t So
il tes
ting
Outc
ome
Incr
ease
in yi
eld p
er u
nit
area
Ef
ficien
cy
Yield
per
hec
tare
of b
aseli
ne an
d pos
t im
plem
enta
tion
Field
surv
ey
Impa
ct De
crea
se in
num
ber o
f ca
ses o
f maln
ouris
hmen
t Ef
fect
ivene
ss/
Bene
ficiar
ies/
Equi
ty
Num
ber o
f peo
ple i
ncid
ence
s of
maln
ouris
hmen
t in
a reg
ion
Med
ical r
ecor
ds
4 Fo
rest
Affo
rest
atio
n Pr
oces
s Av
erag
e dist
ance
be
twee
n ea
ch p
lant
Impl
emen
tatio
n/
Com
plian
ce
Dist
ance
bet
ween
two
plan
ts Fie
ld su
rvey
/rem
ote s
ensin
g
Outc
ome
Incr
ease
in p
er u
nit
plan
tatio
n Ef
ficien
cy
Plan
tatio
n de
nsity
per
unit
area
of
base
line a
nd p
ost i
mpl
emen
tatio
n Re
mot
e sen
sing
Impa
ct In
crea
se in
num
ber o
f be
nefic
iaries
Be
nefic
iaries
Nu
mbe
r of b
enef
iciar
ies re
ceivi
ng
spillo
ver b
enef
its ad
apta
tion
inter
vent
ion
Sam
ple s
urve
y
5 Bi
odive
rsity
Co
nser
vatio
n zo
ne fo
r en
dang
ered
plan
t sp
ecies
Proc
ess
Lega
l App
rova
l Fe
asib
ility/
Im
plem
enta
tion/
Co
mpl
iance
Appr
opria
te B
are A
ct /
Law
Annex1.Sector-SpecificIndicators
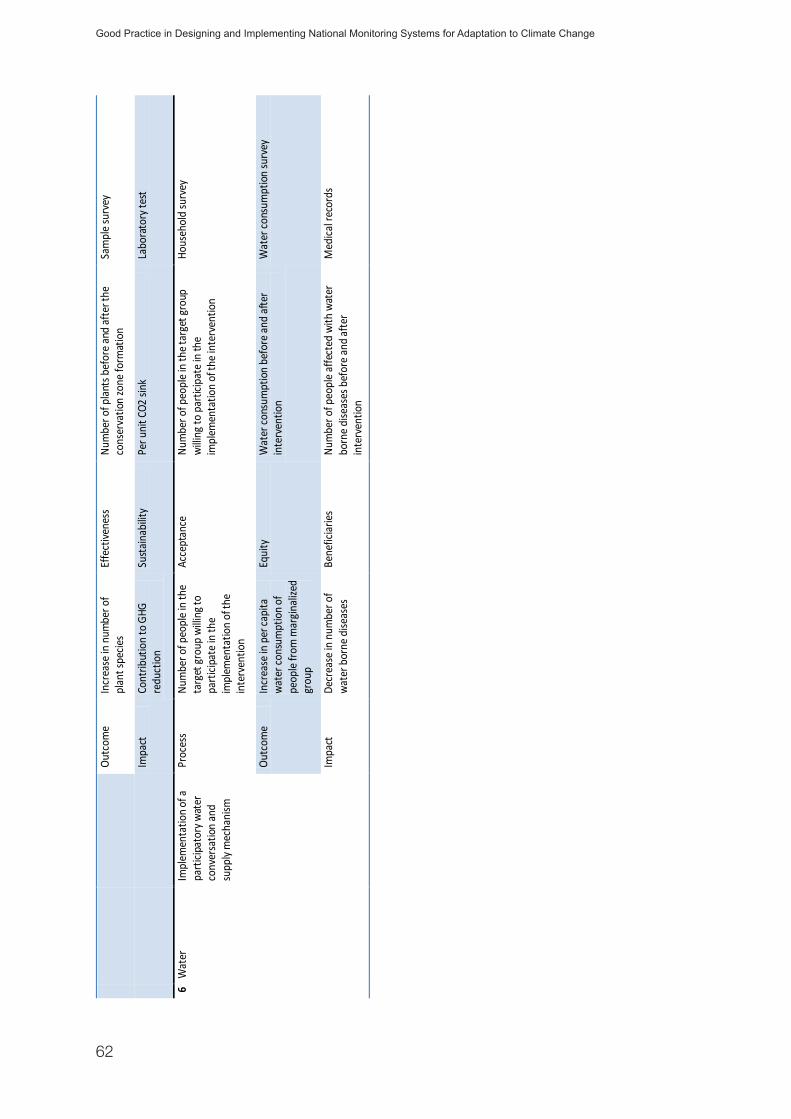
62
Good Practice in Designing and Implementing National Monitoring Systems for Adaptation to Climate Change
61
Outc
ome
Incr
ease
in n
umbe
r of
plan
t spe
cies
Effe
ctive
ness
Nu
mbe
r of p
lants
bef
ore a
nd af
ter t
he
cons
erva
tion
zone
form
atio
n Sa
mpl
e sur
vey
Impa
ct Co
ntrib
utio
n to
GHG
re
duct
ion
Susta
inab
ility
Per u
nit C
O2 si
nk
Labo
rato
ry te
st
6 W
ater
Im
plem
enta
tion o
f a
parti
cipat
ory w
ater
co
nver
satio
n an
d su
pply
mec
hani
sm
Proc
ess
Num
ber o
f peo
ple i
n th
e ta
rget
grou
p wi
lling t
o pa
rticip
ate i
n th
e im
plem
enta
tion
of th
e in
terv
entio
n
Acce
ptan
ce
Num
ber o
f peo
ple i
n th
e tar
get g
roup
wi
lling t
o pa
rticip
ate i
n th
e im
plem
enta
tion
of th
e int
erve
ntio
n
Hous
ehol
d su
rvey
Outc
ome
Incr
ease
in p
er ca
pita
wa
ter c
onsu
mpt
ion o
f pe
ople
from
mar
ginali
zed
grou
p
Equi
ty
Wat
er co
nsum
ption
bef
ore a
nd af
ter
inte
rven
tion
Wat
er co
nsum
ption
surv
ey
Impa
ct De
crea
se in
num
ber o
f wa
ter b
orne
dise
ases
Be
nefic
iaries
Nu
mbe
r of p
eopl
e affe
cted
with
wat
er
born
e dise
ases
bef
ore a
nd af
ter
inte
rven
tion
Med
ical r
ecor
ds
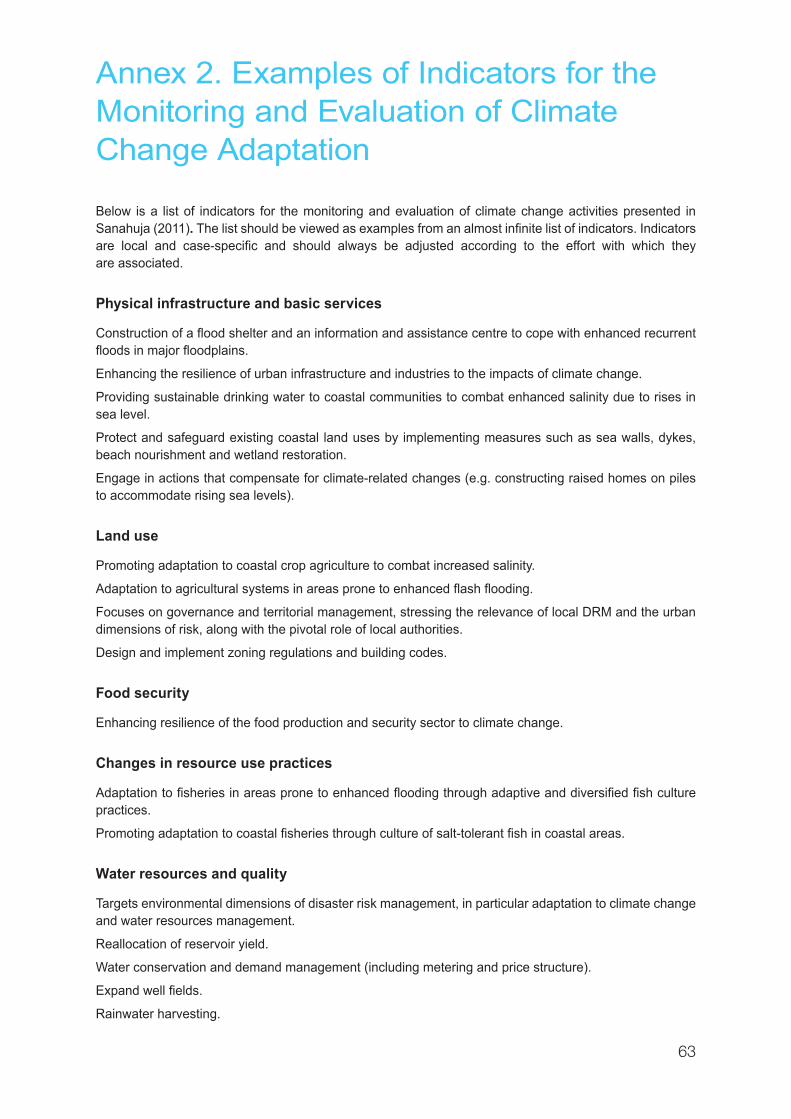
63
Annex 2. Examples of Indicators for the Monitoring and Evaluation of Climate Change Adaptation
Below is a list of indicators for the monitoring and evaluation of climate change activities presented in Sanahuja (2011). Thelistshouldbeviewedasexamplesfromanalmostinfinitelistofindicators.Indicatorsare local and case-specific and should always be adjusted according to the effort with which they are associated.
Physical infrastructure and basic services
Constructionofafloodshelterandaninformationandassistancecentretocopewithenhancedrecurrentfloodsinmajorfloodplains.
Enhancing the resilience of urban infrastructure and industries to the impacts of climate change.
Providing sustainable drinking water to coastal communities to combat enhanced salinity due to rises in sea level.
Protect and safeguard existing coastal land uses by implementing measures such as sea walls, dykes, beach nourishment and wetland restoration.
Engage in actions that compensate for climate-related changes (e.g. constructing raised homes on piles to accommodate rising sea levels).
Land use
Promoting adaptation to coastal crop agriculture to combat increased salinity.
Adaptationtoagriculturalsystemsinareaspronetoenhancedflashflooding.
Focuses on governance and territorial management, stressing the relevance of local DRM and the urban dimensions of risk, along with the pivotal role of local authorities.
Design and implement zoning regulations and building codes.
Food security
Enhancing resilience of the food production and security sector to climate change.
Changes in resource use practices
Adaptationtofisheriesinareaspronetoenhancedfloodingthroughadaptiveanddiversifiedfishculturepractices.
Promotingadaptationtocoastalfisheriesthroughcultureofsalt-tolerantfishincoastalareas.
Water resources and quality
Targets environmental dimensions of disaster risk management, in particular adaptation to climate change and water resources management.
Reallocation of reservoir yield.
Water conservation and demand management (including metering and price structure).
Expandwellfields.
Rainwater harvesting.
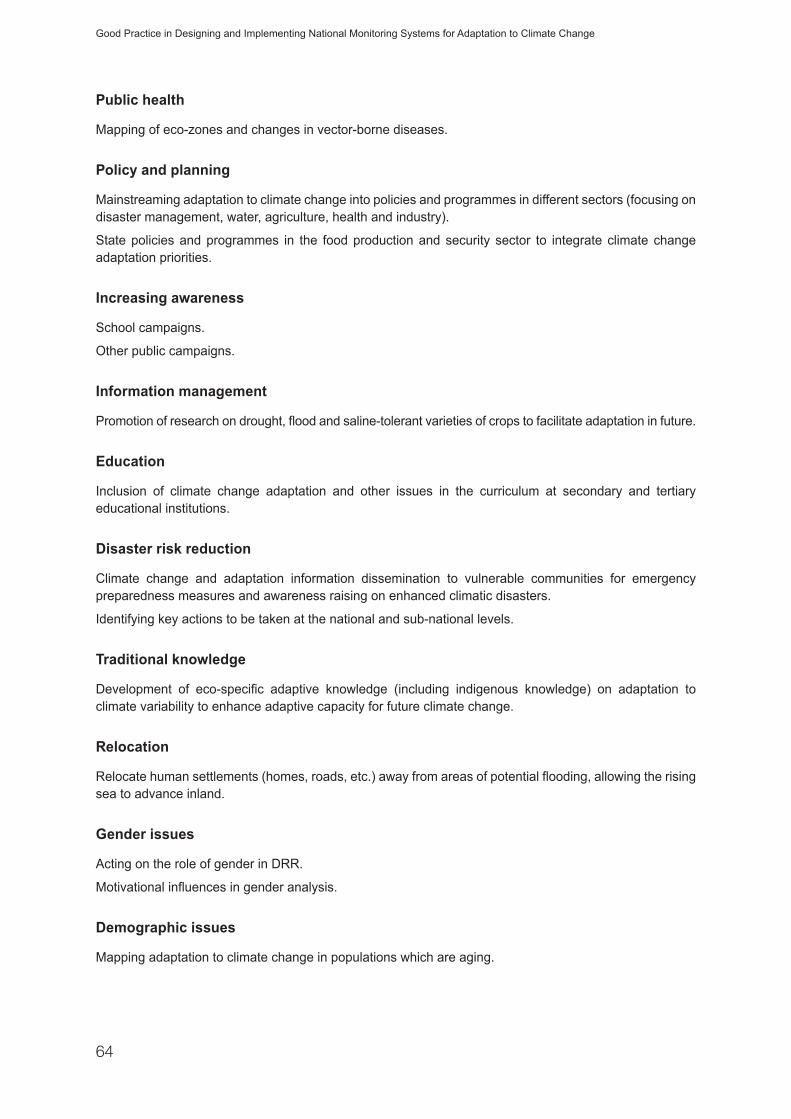
64
Good Practice in Designing and Implementing National Monitoring Systems for Adaptation to Climate Change
Public health
Mapping of eco-zones and changes in vector-borne diseases.
Policy and planning
Mainstreaming adaptation to climate change into policies and programmes in different sectors (focusing on disaster management, water, agriculture, health and industry).
State policies and programmes in the food production and security sector to integrate climate change adaptation priorities.
Increasing awareness
School campaigns.
Other public campaigns.
Information management
Promotionofresearchondrought,floodandsaline-tolerantvarietiesofcropstofacilitateadaptationinfuture.
Education
Inclusion of climate change adaptation and other issues in the curriculum at secondary and tertiary educational institutions.
Disaster risk reduction
Climate change and adaptation information dissemination to vulnerable communities for emergency preparedness measures and awareness raising on enhanced climatic disasters.
Identifying key actions to be taken at the national and sub-national levels.
Traditional knowledge
Development of eco-specific adaptive knowledge (including indigenous knowledge) on adaptation toclimate variability to enhance adaptive capacity for future climate change.
Relocation
Relocatehumansettlements(homes,roads,etc.)awayfromareasofpotentialflooding,allowingtherisingsea to advance inland.
Gender issues
Acting on the role of gender in DRR.
Motivationalinfluencesingenderanalysis.
Demographic issues
Mapping adaptation to climate change in populations which are aging.

65
Multi-sector holistic efforts
Focus on social development and compensatory measures to reduce vulnerability, identifying concrete tasks for the Ministry of Education, Ministry of Housing and Territorial Zoning, National Environmental Authority and the Ministry of Health, to further DRR through education, land-use planning and vulnerability reduction of critical infrastructure, such as schools and health-care facilities.
Human security
Displaced populations.
Climate change refugees.
Changes in migrants and migrant working.
Increased rural–urban migration.
Increased social unrest over resources.
Economics
Government takingresponsibility fordevelopingfinancialmechanismstoreducethevulnerabilityof theportfolio of public investments by introducing DRR considerations into investment planning processes, as wellasdevelopingmechanismsforfinancialprotection.
Compensationforflooddamage.
Facilitate access to credit.
Insurance
Adequately addressing loss and damage from the impacts of climate change.
Exploring options for insurance and other emergency preparedness measures to cope with enhanced climatic disasters.
Financial sector
Recognizing the reality of climate change and mainstream it into all business processes. This is a decision factor for business planning and strategies, portfolio management, and an individual transaction level.
Developing and supplying products and services for the new markets which will come into being with integrated adaptation, e.g. at the micro-level in developing countries, and for ecological services.
Working with policymakers to realize the transition to integrated adaptation.
Ensuring that contingency plans consider ‘worst case’ disasters.
Social mobilization
Adaptation to climate change involving civil organizations active and functioning.
Annex 2


67
Annex 3. Existing Frameworks
65
Anne
x 3.
Exi
stin
g fr
amew
orks
Fr
amew
ork
De
velo
per
or
prop
onen
t
Desc
riptio
n Re
sour
ce
type
/ st
epw
ise
guid
ance
Defin
ition
of
adap
tatio
n ef
fect
iven
ess
Adap
tatio
n in
dica
tor
guid
ance
Sect
or re
leva
nce
Appl
icabi
lity
Resu
lts b
ased
m
onito
ring
and
eval
uatio
n
M
&E
stra
tegy
focu
sed
on
perfo
rman
ce a
nd a
chie
vem
ent
of o
utpu
ts, o
utco
mes
and
im
pact
s whi
ch u
se fe
edba
ck
loop
s to
achi
eve
goal
s
Yes
Com
plia
nce
with
in
dica
tors
that
ha
ve d
ynam
ic go
als.
Proa
ctiv
e M
&E
tool
Ope
n (O
utco
me
Indi
cato
rs)
Mixe
d
All
Prog
ram
me
leve
l
Robu
st D
ecisi
on-
Mak
ing
Rand
Co
rpor
atio
n De
cisio
n-m
akin
g pr
oces
s tha
t id
entif
ies f
utur
e co
nditi
ons
criti
cal f
or a
pla
n's s
ucce
ss
with
out p
redi
ctin
g fu
ture
Yes
Com
plia
nce
with
co
nditi
ons c
ritica
l to
a p
ossib
le
futu
re st
ate
Ope
n (O
utco
me
Indi
cato
rs)
Mixe
d
All
Prog
ram
me
leve
l
Opp
ortu
nist
ic im
pact
m
easu
rem
ent
GIZ
Impa
ct e
valu
atio
n fra
mew
ork
that
mea
sure
s tw
o st
ates
of a
sy
stem
, i.e
. with
and
with
out
the
inte
rven
tion
in ca
se o
f ev
ent.
No
Dam
ages
avo
ided
No
Al
l Pr
ogra
mm
e le
vel
Trac
king
Ad
apta
tion
and
Mea
surin
g De
velo
pmen
t (T
AMD)
IIED
Com
bina
tion
of h
ow w
idel
y an
d ho
w w
ell c
ount
ries o
r in
stitu
tions
man
age
clim
ate
risks
and
how
succ
essf
ul
adap
tatio
n in
terv
entio
ns a
re in
re
ducin
g cli
mat
e vu
lner
abilit
y an
d in
keep
ing
deve
lopm
ent
on co
urse
Yes
Com
plia
nce
with
ni
ne su
gges
ted
indi
cato
r ca
tego
ries
Yes
All
Prog
ram
me
natio
nal
Out
com
e M
appi
ng
Appr
oach
IDRC
Pr
ovid
es a
set o
f too
ls to
de
sign
and
gath
er in
form
atio
n on
the
outc
omes
, def
ined
as
Yes
Posit
ive
beha
viou
ral
chan
ges i
n
No
Sect
ors t
hat n
eed
hum
an in
tera
ctio
n Pr
ogra
mm
e
leve
l

68
Good Practice in Designing and Implementing National Monitoring Systems for Adaptation to Climate Change
66
beha
viou
ral c
hang
es
boun
dary
par
tner
s Lo
gica
l Fr
amew
ork
Appr
oach
USAI
D A
syst
emat
ic ap
proa
ch to
de
signi
ng, e
xecu
ting
and
asse
ssin
g pro
ject
s tha
t has
ob
ject
ively
ver
ifiab
le in
dica
tors
fo
r goa
ls, p
urpo
se, a
ctiv
ities
an
d ou
tput
s in
a pr
ojec
t. RB
M d
iffer
s fro
m th
e LF
A in
its
stro
ng co
mm
itmen
t to
achi
evin
g re
sults
.
The
RBM
gen
eral
ly le
aves
in
puts
out
of t
he p
ictur
e, a
nd
ther
efor
e it
may
miss
one
of
the
build
ing
bloc
ks o
f the
re
sults
chai
n.
Yes
Com
plia
nce
with
pr
e-de
term
ined
ob
ject
ively
ve
rifia
ble
indi
cato
rs
No
All
Prog
ram
me
leve
l
Obj
ectiv
es
Orie
nted
Pro
ject
Pl
anni
ng (Z
OPP)
GTZ
Prov
ides
a sy
stem
atic
stru
ctur
e fo
r the
iden
tifica
tion,
pla
nnin
g,
and
man
agem
ent o
f pro
ject
s.
No
Com
plia
nce
with
in
dica
tors
No
Al
l Pr
ogra
mm
e le
vel
Mon
itorin
g an
d Ev
alua
tion
Fram
ewor
k
UNDP
Pr
ovid
es g
uida
nce
and
build
s ad
apta
tion
capa
city
to d
esig
n rig
orou
s ini
tiativ
es a
nd
mon
itor p
rogr
ess.
No
Broa
d in
dica
tors
ca
tego
ries
Yes
Natu
ral r
esou
rces
, fo
od se
curit
y,
wat
er, c
oast
al
zone
s, di
sast
er ri
sk
man
agem
ent,
heal
th
Prog
ram
me
leve
l
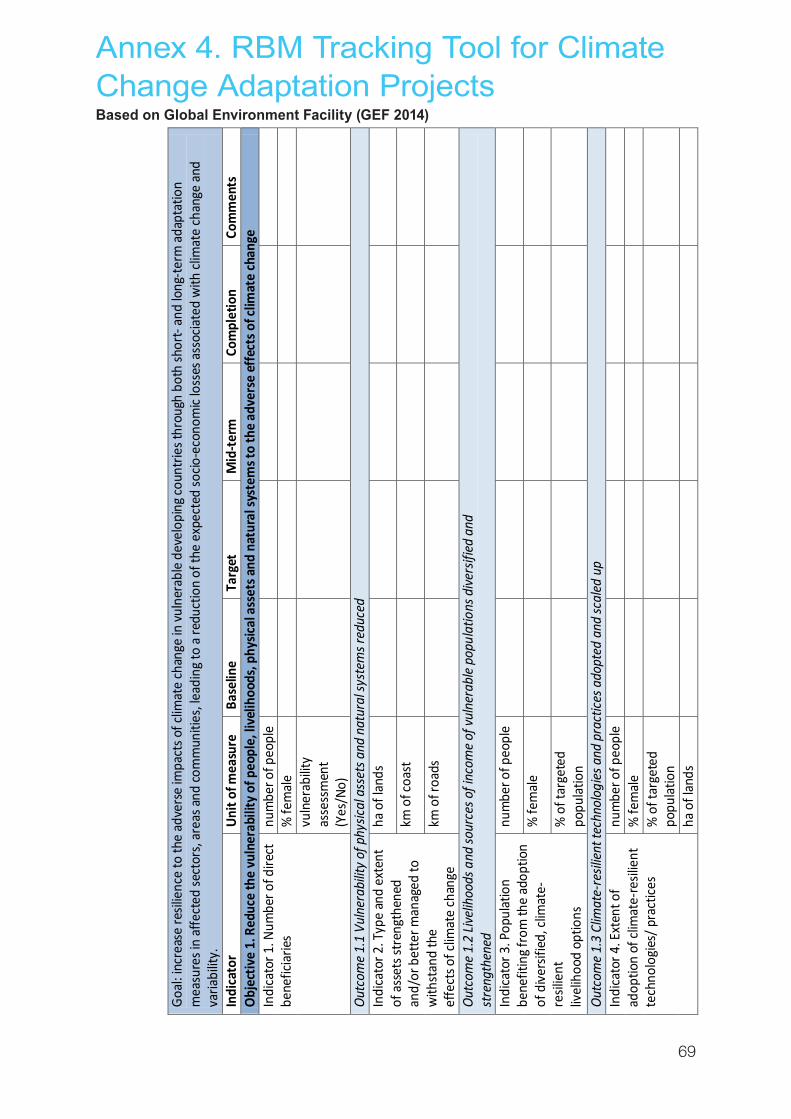
69
Annex 4. RBM Tracking Tool for Climate Change Adaptation ProjectsBased on Global Environment Facility (GEF 2014)
67
Anne
x 4.
RBM
Tra
ckin
g To
ol fo
r Clim
ate
Chan
ge A
dapt
atio
n Pr
ojec
ts
Base
d on
Glo
bal E
nviro
nmen
t Fac
ility
(GEF
201
4)
Goal
: inc
reas
e re
silie
nce
to th
e ad
vers
e im
pact
s of c
limat
e ch
ange
in vu
lner
able
dev
elop
ing c
ount
ries t
hrou
gh b
oth
shor
t- an
d lo
ng-te
rm a
dapt
atio
n m
easu
res i
n af
fect
ed se
ctor
s, ar
eas a
nd co
mm
uniti
es, l
eadi
ng to
a re
duct
ion
of th
e ex
pect
ed so
cio-e
cono
mic
loss
es a
ssoc
iate
d w
ith cl
imat
e ch
ange
and
va
riabi
lity.
In
dica
tor
Unit
of m
easu
re
Base
line
Targ
et
Mid
-term
Co
mpl
etio
n Co
mm
ents
O
bjec
tive
1. R
educ
e th
e vu
lner
abili
ty o
f peo
ple,
live
lihoo
ds, p
hysic
al a
sset
s and
nat
ural
syst
ems t
o th
e ad
vers
e ef
fect
s of c
limat
e ch
ange
In
dica
tor 1
. Num
ber o
f dire
ct
bene
ficia
ries
num
ber o
f peo
ple
%
fem
ale
vu
lner
abilit
y as
sess
men
t (Y
es/N
o)
Outc
ome
1.1
Vuln
erab
ility
of p
hysic
al a
sset
s and
nat
ural
syst
ems r
educ
ed
Indi
cato
r 2. T
ype
and
exte
nt
of a
sset
s str
engt
hene
d an
d/or
bet
ter m
anag
ed to
w
ithst
and
the
effe
cts o
f clim
ate
chan
ge
ha o
f lan
ds
km o
f coa
st
km o
f roa
ds
Outc
ome
1.2
Livel
ihoo
ds a
nd so
urce
s of i
ncom
e of
vuln
erab
le p
opul
atio
ns d
ivers
ified
and
st
reng
then
ed
Indi
cato
r 3. P
opul
atio
n be
nefit
ing f
rom
the
adop
tion
of d
ivers
ified
, clim
ate-
resil
ient
liv
elih
ood
optio
ns
num
ber o
f peo
ple
% fe
mal
e
% o
f tar
gete
d po
pula
tion
Outc
ome
1.3
Clim
ate-
resil
ient
tech
nolo
gies
and
pra
ctice
s ado
pted
and
scal
ed u
p In
dica
tor 4
. Ext
ent o
f ad
optio
n of
clim
ate-
resil
ient
te
chno
logi
es/ p
ract
ices
num
ber o
f peo
ple
%
fem
ale
%
of t
arge
ted
popu
latio
n
ha o
f lan
ds
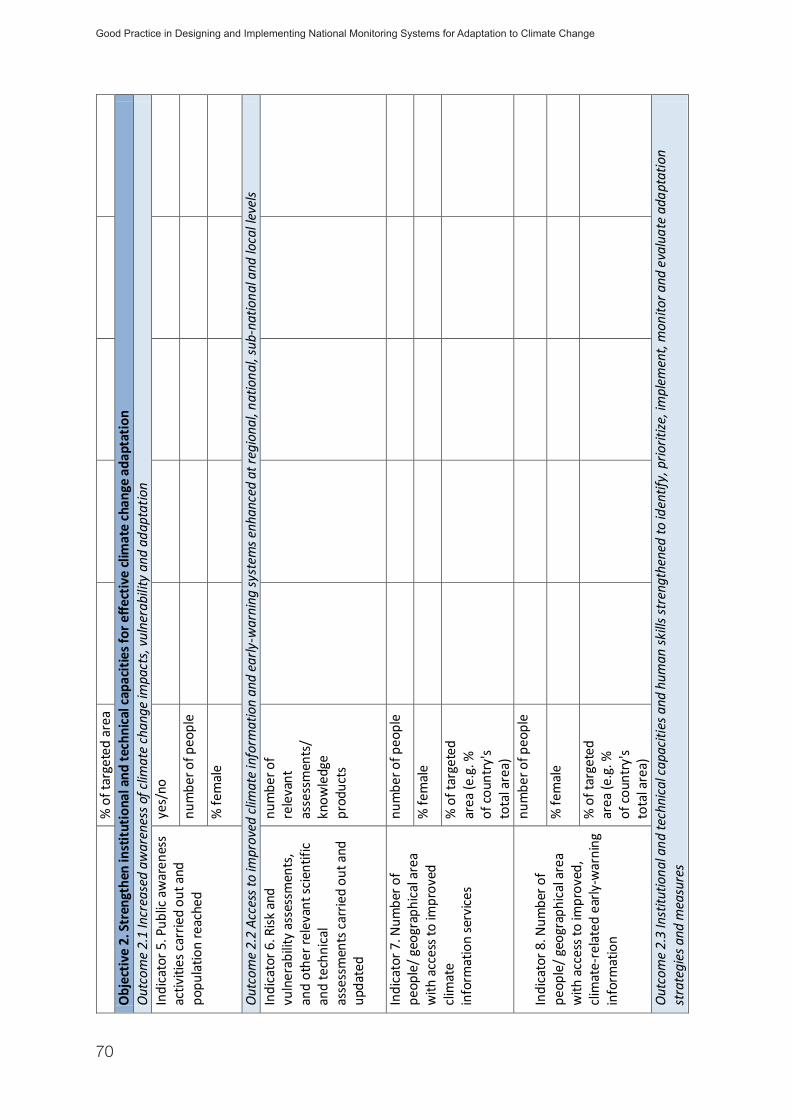
70
Good Practice in Designing and Implementing National Monitoring Systems for Adaptation to Climate Change
68
% o
f tar
gete
d ar
ea
O
bjec
tive
2. S
tren
gthe
n in
stitu
tiona
l and
tech
nica
l cap
aciti
es fo
r effe
ctiv
e cli
mat
e ch
ange
ada
ptat
ion
Outc
ome
2.1
Incr
ease
d aw
aren
ess o
f clim
ate
chan
ge im
pact
s, vu
lner
abili
ty a
nd a
dapt
atio
n In
dica
tor 5
. Pub
lic a
war
enes
s ac
tiviti
es ca
rrie
d ou
t and
po
pula
tion
reac
hed
yes/
no
num
ber o
f peo
ple
% fe
mal
e
Outc
ome
2.2
Acce
ss to
impr
oved
clim
ate
info
rmat
ion
and
early
-war
ning
syst
ems e
nhan
ced
at re
gion
al, n
atio
nal,
sub-
natio
nal a
nd lo
cal l
evel
s In
dica
tor 6
. Risk
and
vu
lner
abilit
y as
sess
men
ts,
and
othe
r rel
evan
t scie
ntifi
c an
d te
chni
cal
asse
ssm
ents
carr
ied
out a
nd
upda
ted
num
ber o
f re
leva
nt
asse
ssm
ents
/ kn
owle
dge
prod
ucts
Indi
cato
r 7. N
umbe
r of
peop
le/ g
eogr
aphi
cal a
rea
with
acc
ess t
o im
prov
ed
clim
ate
info
rmat
ion
serv
ices
num
ber o
f peo
ple
% fe
mal
e
% o
f tar
gete
d ar
ea (e
.g. %
of
coun
try's
tota
l are
a)
Indi
cato
r 8. N
umbe
r of
peop
le/ g
eogr
aphi
cal a
rea
with
acc
ess t
o im
prov
ed,
clim
ate-
rela
ted
early
-war
ning
in
form
atio
n
num
ber o
f peo
ple
% fe
mal
e
% o
f tar
gete
d ar
ea (e
.g. %
of
coun
try's
tota
l are
a)
Outc
ome
2.3
Inst
itutio
nal a
nd te
chni
cal c
apac
ities
and
hum
an sk
ills st
reng
then
ed to
iden
tify,
prio
ritize
, im
plem
ent,
mon
itor a
nd e
valu
ate
adap
tatio
n st
rate
gies
and
mea
sure
s

71
69
Indi
cato
r 9. N
umbe
r of
peop
le tr
aine
d to
iden
tify,
pr
iorit
ize, i
mpl
emen
t, m
onito
r and
ev
alua
te a
dapt
atio
n st
rate
gies
and
mea
sure
s
num
ber o
f peo
ple
% fe
mal
e
Indi
cato
r 10.
Cap
aciti
es o
f re
gion
al, n
atio
nal a
nd su
b-na
tiona
l inst
itutio
ns to
id
entif
y,
prio
ritize
, im
plem
ent,
mon
itor a
nd e
valu
ate
adap
tatio
n st
rate
gies
and
mea
sure
s
Num
ber o
f in
stitu
tions
Obj
ectiv
e 3.
Inte
grat
e cli
mat
e ch
ange
ada
ptat
ion
into
rele
vant
pol
icies
, pla
ns a
nd a
ssoc
iate
d pr
oces
ses
Outc
ome
3.1
Inst
itutio
nal a
rran
gem
ents
to le
ad, c
oord
inat
e an
d su
ppor
t the
inte
grat
ion
of cl
imat
e ch
ange
ada
ptat
ion
into
rele
vant
pol
icies
, pla
ns a
nd
asso
ciate
d pr
oces
ses e
stab
lishe
d an
d st
reng
then
ed
Indi
cato
r 11.
Inst
itutio
nal
arra
ngem
ents
to le
ad,
coor
dina
te a
nd su
ppor
t the
in
tegr
atio
n of
cli
mat
e ch
ange
ada
ptat
ion
into
rele
vant
pol
icies
, pla
ns
and
asso
ciate
d pr
oces
ses
Num
ber o
f in
stitu
tions
Outc
ome
3.2
Polic
ies,
plan
s and
ass
ocia
ted
proc
esse
s dev
elop
ed a
nd st
reng
then
ed to
iden
tify,
prio
ritize
and
inte
grat
e ad
apta
tion
stra
tegi
es a
nd m
easu
res
Indi
cato
r 12.
Reg
iona
l, na
tiona
l and
sect
or-w
ide
polic
ies,
plan
s and
pro
cess
es
deve
lope
d an
d st
reng
then
ed to
iden
tify,
pr
iorit
ize a
nd in
tegr
ate
num
ber o
f po
licie
s/
plan
s/
proc
esse
s
Annex 4

72
Good Practice in Designing and Implementing National Monitoring Systems for Adaptation to Climate Change
70
adap
tatio
n st
rate
gies
and
mea
sure
s In
dica
tor 1
3. S
ub-n
atio
nal
plan
s and
pro
cess
es
deve
lope
d an
d st
reng
then
ed
to id
entif
y,
prio
ritize
and
inte
grat
e ad
apta
tion
stra
tegi
es an
d m
easu
res
num
ber o
f po
licie
s/
plan
s/
proc
esse
s
Outc
ome
3.3
Syst
ems a
nd fr
amew
orks
for t
he co
ntin
uous
mon
itorin
g, re
port
ing
and
revie
w o
f ad
apta
tion
esta
blish
ed a
nd st
reng
then
ed
Indi
cato
r 14.
Cou
ntrie
s with
sy
stem
s and
fram
ewor
ks fo
r th
e co
ntin
uous
mon
itorin
g,
repo
rtin
g an
d re
view
of
adap
tatio
n
num
ber o
f co
untr
ies

73
Annex 5. Templates for M&E of Climate Change Adaptation
This annex provides 3 examples of how M&E frameworks can be structured.
Template 1:
This template is based on the ´Objective Oriented Planning (ZOPP)´ framework. ZOPP entails formulating a Project Planning Matrix (PPM), a sample of which is presented in this template. Typical components of thePPMareprojectdetails,technicalspecification,resourceuse,timelinesandtheirsubsequentstatusifthe project is going on. Some binary variables for compliance (Yes/No; 0/1) etc. can also be introduced to track progress. The template presented here is using outcome indicators and is tracking the progress of an ongoingproject.Thistemplatecanbemodifiedtoincludeindicatorscapturingtheimpactoftheprogrammeif evaluation has to be carried out at the end of the programme. Similarly, just with the objectives, targets and resource plans it can be a pre-project plan which can also be used to effectively use this for programme implementation.
Template 2:
This template has a focus on process indicators. When interventions seek compliance, and compliance with standard operating practices can be crucial for the success of the intervention, then this template can be used. This entails enlisting all the processes involved in the intervention. For each of the compliance factor, an indicator can be designed. Typically they can be binary variables where whether the procedure was followed appropriately or not is checked. In some cases the processes may involve attaining certain value over a time period in which case the indicators can be actual numbers or are based on some observations where qualitative indicators can be used.
Template 3:
UNDP’s handbook on Handbook on Planning, Monitoring and Evaluating for Development Results illustrates this template for M&E. This template is descriptive and elaborates each of the components like variables used, baseline, targets etc. in detail. The template highlights what needs to be monitored in a programme. The details in the template facilitate participation and also provide an overview to those not involved in the intervention on the deliverables of the intervention and those responsible for it. This can also be adapted for local conditions at programme, portfolio and regional levels. (Source: http://web.undp.org/evaluation/handbook/ch3-2.html)

74
Good Practice in Designing and Implementing National Monitoring Systems for Adaptation to Climate Change
Proj
ect N
ame
Proj
ect L
ead
Repo
rtin
g Pe
riod
Prog
ram
me
Targ
et66
%An
nual
Tar
get
33%
Loca
tion
Proj
ect S
tart
Actu
al C
over
age
66%
Year
to D
ate
Actu
al33
%
Sect
orPr
ojec
t End
% o
f LoP
Tar
get
100%
% o
f Ann
ual
Targ
et10
0%
Indi
cato
rSu
ppor
t Per
son
Data
Req
uire
dIn
form
atio
n Co
llect
ion
Met
hod
Unit
of
Mea
sure
men
tEs
timat
ed M
onito
ring
Cost
Date
Valu
eA
TV
AT
VA
TV
AT
V
Objective:
Outc
ome
: Effi
cienc
y &
Effe
ctive
ness
Indi
cato
r 1.1
: Out
put p
er
unit
inpu
t cos
tAB
Unit
Inpu
t Cos
tFie
ld Su
rvey
USD
500
USD
Mar
ch 2
012
300
600
500
-100
Unit
Outp
utFie
ld Su
rvey
Tonn
es p
er h
ecta
re50
0 US
DM
arch
201
240
040
050
010
0
Indi
cato
r 1.2
: Far
m Y
ield
BCPr
oduc
tion
Field
Surv
eyTo
nnes
300
Mar
ch 2
012
1600
2500
3000
-500
Farm
Are
aSe
cond
ary S
tudy
from
Pr
ojec
t Doc
umen
tHe
ctar
e0
Mar
ch 2
012
200
00
0
Outc
ome
2: B
enef
iciar
ies
(Cov
erag
e)
Indi
cato
r 2.1
:Pro
porti
on o
f Fa
rm La
nd C
over
edCD
Farm
Are
a of
Im
plem
enta
tion
Seco
ndar
y Stu
dy fr
om
Proj
ect D
ocum
ent
Hect
are
0M
arch
201
210
075
010
00-2
50
Tota
l Far
m A
rea
Seco
ndar
y Stu
dy fr
om
Dist
rict D
evel
opm
ent
Plan
Hect
are
0M
arch
201
2
Indi
cato
r 2.2
Indi
cato
r 2.3
Outc
ome
n
Indi
cato
r n
Proj
ect R
esou
rces
Proj
ect O
utre
ach
Till
2015
Targ
etKe
y
Impl
emen
tors
5Fa
rm A
rea
Cove
red
1000
hec
tare
1200
hec
tate
Core
Indi
cato
rsA
Actu
alV
Eval
uato
rs3
Hous
ehol
ds C
over
ed70
070
0Ot
her I
ndica
tors
TTa
rget
Varia
tion
Incr
ease
farm
land
pro
duct
ivity
of r
ice b
y int
rodu
cing
micr
o irr
igat
ion
sche
me
Proj
ect B
asel
ine
Intro
duct
ion
of M
icro
Irrig
atio
n Sc
hem
e in
dist
rict A
of T
anza
nia
ABC
Dist
rict A
- Ta
nzan
ia
Repo
rting
Per
iod
2
T2Im
plem
enta
tion
Budg
et u
tliza
tion
Sust
aina
ble
Agric
ultu
re
2014
-201
5
01 A
pril 2
012
31 M
arch
201
5
T1
Repo
rting
Per
iod
1 Impl
emen
tatio
n Bu
dget
utli
zatio
n
Tem
plat
e 1

75
Inve
stig
ator
Star
t Ti
me
Perio
d
End
Tim
e Pe
riod
Tim
e Re
quire
dAc
tual
Ti
me
Varia
nce
Budg
et
Requ
ired
Actu
al
Budg
etVa
rianc
eCo
mpl
ianc
e Cr
iteria
Com
plia
nce
(0-N
o, 1
-Yes
)Re
port
Diss
emin
ate
Feed
back
Proc
ess 1
ABC
T1T3
2 T
2T0
1 B
3 B
- 2 B
I1: D
escr
iptio
n1
00
0I2
: Des
crip
tion
10
00
I3: D
escr
iptio
n1
00
0I4
: Des
crip
tion
10
01
Proc
ess 2
DEF
T2T4
2 T
2T0
2 B
2 B
0I5
: Des
crip
tion
01
11
I6: D
escr
iptio
n1
00
0I7
: Des
crip
tion
10
01
Proc
ess n
XYZ
T3T5
2T3T
- T2
B2
B0
I8: D
escr
iptio
n0
11
1I9
: Des
crip
tion
01
11
I0: D
escr
iptio
n0
11
1
Tem
plat
e 2
Annex 5

76
Good Practice in Designing and Implementing National Monitoring Systems for Adaptation to Climate Change
Sour
ce: h
ttp:
//w
eb.u
ndp.
org/
eval
uatio
n/ha
ndbo
ok/c
h3-2
.htm
l
Expe
cted
Re
sults
(O
utco
mes
&
Out
puts
)
Indi
cato
rs (w
ith
Base
lines
&
Indi
cativ
e Ta
rget
s)
and
Oth
er K
ey A
reas
to
Mon
itor
M&
E Ev
ent w
ith
Data
Col
lect
ion
Met
hods
Tim
e or
Sch
edul
e an
d Fr
eque
ncy
Resp
onsi
bilit
ies
Mea
ns o
f Ve
rific
atio
n: D
ata
Sour
ce a
nd T
ype
Reso
urce
sRi
sks
Tem
plat
e 3

Thisreportreviewslessonsarisingfromthedevelopingfieldofbuildingindicatorsystemsformonitoringandevaluating climate change adaptation at the national level, as well as experiences from implementing such systems. International good practices for the design and implementation of national monitoring and evaluation (M&E)forclimatechangeadaptationareidentified,analysedandcompared.Inaddition,thereportprovidesanintroduction to context of, and key terminology for, M&E and climate change adaptation. It reviews approaches to M&E and discusses the application and relevance of existing frameworks for M&E globally, and particularly in Latin America. The report is a product of technical assistance being delivered in Colombia by the Climate Technology Centre and Network (CTCN) and in close partnership with national stakeholders. The objective of this technical assistance is to support the development of the Colombian national monitoring system to strengthen climate change adaptation.
The Climate Technology Centre and Network (CTCN) promotes the accelerated development and transfer ofclimate technologies forenergy-efficient, low-carbonandclimate-resilientdevelopment.As theoperationalarm of the United Nations Framework Convention on Climate Change Technology Mechanism, the Climate Technology Centre is hosted and managed by the United Nations Environment Programme in collaboration with the United Nations Industrial Development Organization and supported by 11 partner institutions around the world. The Centre utilizes the expertise of these institutions, as well as an international Network of civil society, private sector, and research institutions, to deliver technical assistance and capacity building at the request of developing countries.
For more information, visit http://www.ctc-n.org.