Good Harbor Bay Watershed Protection Plan...
47
Good Harbor Bay Watershed Protection Plan 2015 35 2.3 GEOLOGY AND SOILS (written by Jaime Leanderson) Geology The geology of the Good Harbor Bay watershed consists of sand, gravel and related deposits that overlie much older limestone and shale, found only at depths below about 400’ to 500’. The surface deposits that host the aquifers, lakes, streams, etc, and the morphologies of the deposits are the result of glaciation during the continental Wisconsin Glacial stage. This stage began about 85,000 years ago and reached its peak about 21,000 years ago. However, the glacial deposits in the watershed were deposited during the last three glacial advances, the Port Huron Stadial (~13,300 to ~13,000 years ago), the Greatlakean Stadial (~>11,800 to ~11,500 years ago). Continental glaciers form at times of global cooling when ice accumulates at high latitudes and moves south. During especially cold periods the advance of the leading margin was relatively rapid. During warmer periods, the leading edge would melt faster than the ice was advancing. The leading edge then retreated back to the north even though the glacier was still moving south. The glaciers eroded the rocks they were moving over and transported the loose debris in the ice, which was then released when the ice melted. In the watershed area, the transport and deposition of this sediment was accomplished by three agents: ice, water and wind. Ice was the dominant transporting agent because it has a high viscosity that allowed it to transport particles up to boulder size, which are found in the gravels today. However, that same high viscosity prevented particles from sinking so there was no deposition directly from the ice. Water and wind were the main transport and deposition agents once the ice melted. Because water has a higher viscosity than air, it can transport larger particles. The velocity of both determines the maximum size of the particles that could be transported by each agent. Fast‐ moving water transported boulder‐sized particles, while slower moving water carried only sand and finer particles. Fluctuations in velocity led to the formation of alternating and discontinuous layers of sand and gravel. Very slow moving or stagnant water, e.g., in lakes, led and still leads to the deposition of clay. Wind is capable of transporting and depositing particles that are sand‐sized and smaller. The distribution of clay, sand and gravel layers has a significant impact on the formation of aquifers and on the movement of subterranean water
Transcript of Good Harbor Bay Watershed Protection Plan...
GoodHarborBayWatershedProtectionPlan 2015
35
2.3 GEOLOGY AND SOILS
(written by Jaime Leanderson)
Geology
The geology of the Good Harbor Bay watershed consists of sand, gravel and related deposits that overlie much older limestone and shale, found only at depths below about 400’ to 500’. The surface deposits that host the aquifers, lakes, streams, etc, and the morphologies of the deposits are the result of glaciation during the continental Wisconsin Glacial stage. This stage began about 85,000 years ago and reached its peak about 21,000 years ago. However, the glacial deposits in the watershed were deposited during the last three glacial advances, the Port Huron Stadial (~13,300 to ~13,000 years ago), the Greatlakean Stadial (~>11,800 to ~11,500 years ago).
Continental glaciers form at times of global cooling when ice accumulates at high latitudes and moves south. During especially cold periods the advance of the leading margin was relatively rapid. During warmer periods, the leading edge would melt faster than the ice was advancing. The leading edge then retreated back to the north even though the glacier was still moving south.
The glaciers eroded the rocks they were moving over and transported the loose debris in the ice, which was then released when the ice melted. In the watershed area, the transport and deposition of this sediment was accomplished by three agents: ice, water and wind. Ice was the dominant transporting agent because it has a high viscosity that allowed it to transport particles up to boulder size, which are found in the gravels today. However, that same high viscosity prevented particles from sinking so there was no deposition directly from the ice.
Water and wind were the main transport and deposition agents once the ice melted. Because water has a higher viscosity than air, it can transport larger particles. The velocity of both determines the maximum size of the particles that could be transported by each agent. Fast‐moving water transported boulder‐sized particles, while slower moving water carried only sand and finer particles. Fluctuations in velocity led to the formation of alternating and discontinuous layers of sand and gravel. Very slow moving or stagnant water, e.g., in lakes, led and still leads to the deposition of clay. Wind is capable of transporting and depositing particles that are sand‐sized and smaller. The distribution of clay, sand and gravel layers has a significant impact on the formation of aquifers and on the movement of subterranean water
GoodHarborBayWatershedProtectionPlan 2015
36
through them, which is difficult to predict due to complex geometry of the different layers of sediment.
During the Port Huron Stadial the ice margin was located south of Traverse City and extended down to the east of Manistee; the watershed was covered with ice at this time. Melting of the ice and transport of the sediment to the glacial margin formed the Port Huron Moraine. Either during the advance or retreat of the glacier wide areas of sediment (till) was deposited across most of Good Harbor Bay watershed and is exposed today in large patches both to the east and west of Little Traverse and Lime Lakes. Much of this till is consolidated as the result compaction by the weight of the overlying Greatlakean ice Stadial ice sheet that overrode the Port Huron till. The movement of the Greatlakean ice sculpted the Port Huron till into linear hills, called “drumlins”. Most of the drumlins have the shape of overturned canoes. However, Sugar Loaf has a steep northern end and a long tail that extends to the south. The orientation of the drumlins indicates the Greatlakean ice moved from the north‐northeast to the south‐southwest.
The margin of a continental glacier is lobate with lobes the width of a state or country down to the width of a township. One large lobe scoured out Lake Michigan. Melting of the ice underneath the glacier resulted in accumulation of bodies of water that were under tremendous pressure. Locally, this water would erupt from the front of the glacier in a massive flood. If there was semi‐consolidated sediment under the ice, it was scoured out in linear tunnels and deposited in sheets of sediment in front of the glacier.
At the beginning of the Greatlakean Stadial it appears that glacial margin extended from south of Lake Leelanau northwest to the south end of the watershed where the swampy ground is located along County Rd. 667, 4 miles south of Maple City, and then west to the south of Glen Lake. Melting under the ice sheet, probably east of North Manitou Island, led to the flow of subterranean water south under what is now Good Harbor Bay into the Little Traverse‐Lime Lake basin south to the ice margin. A minor arm of this tunnel formed the basin that is occupied by Bass and School Lakes. The water exited in floods, probably forming outwash gravel deposits, and then was covered by loose sediment that washed down and to the south from the top of the glacier. This sediment was deposited in a terminal moraine that marks the high ground at the south end of the watershed. The last advance of the ice sheet was confined to the tunnel valleys. Melting of this ice deposited till on the east side of Little Traverse and Lime Lakes forming the boundary between the Good Harbor Bay and Lake Leelanau watersheds, represented by the ridge between the villages of Maple City and Cedar.
GoodHarborBayWatershedProtectionPlan 2015
37
The 55’ deep circular depression on the northwest part of Little Traverse Lake may be a kettle formed by a block of ice that remained from this glacial tongue and melted in place..
Melting of the retreating Greatlakean ice created lakes that fluctuated in elevation in the Lake Michigan basin. This marked the beginning of a period of water and wind transport and deposition and of erosion that is still going on today. Two of these lakes had the greatest effect on the watershed. The first was the Main Algonquin Lake, around 11,000 years ago. Landforms related to the Lake range in elevation between about 630 to 650 feet. Likewise, Lake Nipissing produced near shore features ~5,000 years ago that are present at an elevation of about 605 feet.
Lake Algonquin lay at an elevation about 60 feet above present day Lake Michigan and eroded the Late Wisconsin till along the shoreline forming bluffs, which can still be seen today. Northeast of the intersection of M22 and Good Harbor Road it appears that the base of the lake Algonquin bench remains. West of Bass and School Lakes, the edge of the Algonquin bluffs run west to the south of M22 past the bend in the road at Kelderhouse Cemetery, and then over the present boundary between the Glen Lake and Good Harbor Bay watersheds. As is typical of this shoreline, the boundary is a straight or a smooth, arcuate landform. The high hills at Pyramid Point and north of the Leelanau School were islands at this time.
Lake Algonquin also formed two finger‐like embayments that lay in the Little Traverse Lake‐Lime Lake and Bass Lake‐School Lake embayments that formed under the ice. The shoreline of Lake Algonquin in the Little Traverse Lake‐Lime Lake embayment extended from Good Harbor Bay to about 1 ½ miles north of Maple City. In the Bass Lake‐School Lake embayment it extended about 1 ½ miles south of School Lake.
Lake Nipissing locally eroded the Algonquin bench leaving flat benches in some locations. Parts of M22 appear to lie on a Nipissing bench between Little Traverse Lake and Duck Lake. Elsewhere, the Algonquin bench and shoreline remain but the bench was eroded back by Nipissing wave action. Dune building occurred during or immediately after the Nipissing phase, including on the bench between Little Traverse Lake and Duck Lake, the high dunes that extend from Good Harbor south to the east end of Little Traverse Lake and at Pyramid Point. At Bufka’s farm on M22, the base of the hills that lie on and near M22 mark the base of the Algonquin bluffs. The farm sits on the Algonquin bench. Immediately behind the barn to the north, the land drops off about 6‐8 feet, which marks the Nipissing bluff. A few 10’s of yards further are the high dunes that formed after the drop in the level of Lake Nipissing.
GoodHarborBayWatershedProtectionPlan 2015
38
The most notable features along and near the Lake Michigan shoreline formed in the past 3,750 years. Like Lake Algonquin, Lake Nipissing occupied the Little Traverse Lake‐Lime Lake and Bass Lake‐School Lake embayments, where marl has been deposited over much of the lake bottoms. During retreat of Lake Nipissing, the water level paused at an elevation of about 595 feet (Lake Algoma) between 3,000 and 3,750 years ago. This appears to be the time when the sandy ridge formed that separates Little Traverse and Lime Lakes today. Further retreat of Lake Nipissing left Little Traverse Lake isolated behind a series of gentle lake‐bottom hills and small dunes about ½ mile from the Little Traverse Lake shore line. It was probably at this time that the high dunes at the east end of Little Traverse Lake formed. These dunes probably blocked drainage of the lake into Lake Nipissing resulting in the formation of Shalda Creek, which flowed initially to the west. The direction of Shalda Creek then alternated from west to east and back again numerous times as it migrated to the north forming distinct swales and dune/beach ridges that parallel the Lake Michigan shoreline. Shalda Creek extended from the dunes at the east end of Little Traverse Lake to northwest of Shell Lake, a distance of about 7 miles. The changes in the direction of the flow of Shalda Creek were the result of changes in the prevailing winds and associated longshore current in Lake Michigan. The long shore current deposited sand where the creek exits into Lake Michigan, blocking the up‐current side. This forces the creek to migrate in the direction of the long shore current. When the current reverses direction, it closes off the creeks exit point and the water level rises upstream until it overflows one or more of the ridges and finds a new exit into the lake. It then migrates in the direction of the prevailing longshore current. This process has been repeated numerous times resulting in the modern topography. Today, the creek flows northwest and around most of the dune ridges and then cuts across several ridges down to the lake. Apparently, the latest blockage of the creek’s exit backed the water level up in the old channels until the creek returned to its original northwest‐trending channel that it occupied after the drop in the lake level. However, the creek is again being influenced by the long shore current coming running from the northwest to the southeast down the Good Harbor Bay shoreline. Immediately after the creek crosses Lake Michigan Rd., it swings to the east and is separated from Lake Michigan by a newly formed, narrow dune ridge as the creek’s exit continues to migrate to the east. This will continue until the prevailing current reverses direction back to the west.
Erosion of the hills began as soon as the ice melted and resulting in the numerous valleys that incise the glacial features. These valleys provide vehicle access to the top of the glacial plains and to the drumlin hills, e.g., Schomberg, Good Harbor, Sugar Loaf Mtn. and Basch Roads. Sediment that washes down valleys such as these usually accumulate at the bottom in fan‐
GoodHarborBayWatershedProtectionPlan 2015
39
shaped deposits but because of the fluctuating lake levels, much of it has been washed away or was buried under later sediment. The topography of the tip of Pyramid Point suggests that some of the dune sand slid directly into Lake Michigan. On steep hillsides, the soil is still moving slowly downward (soil creep) as evidenced by trees that are bent down slope at their base.
Soils and Topography
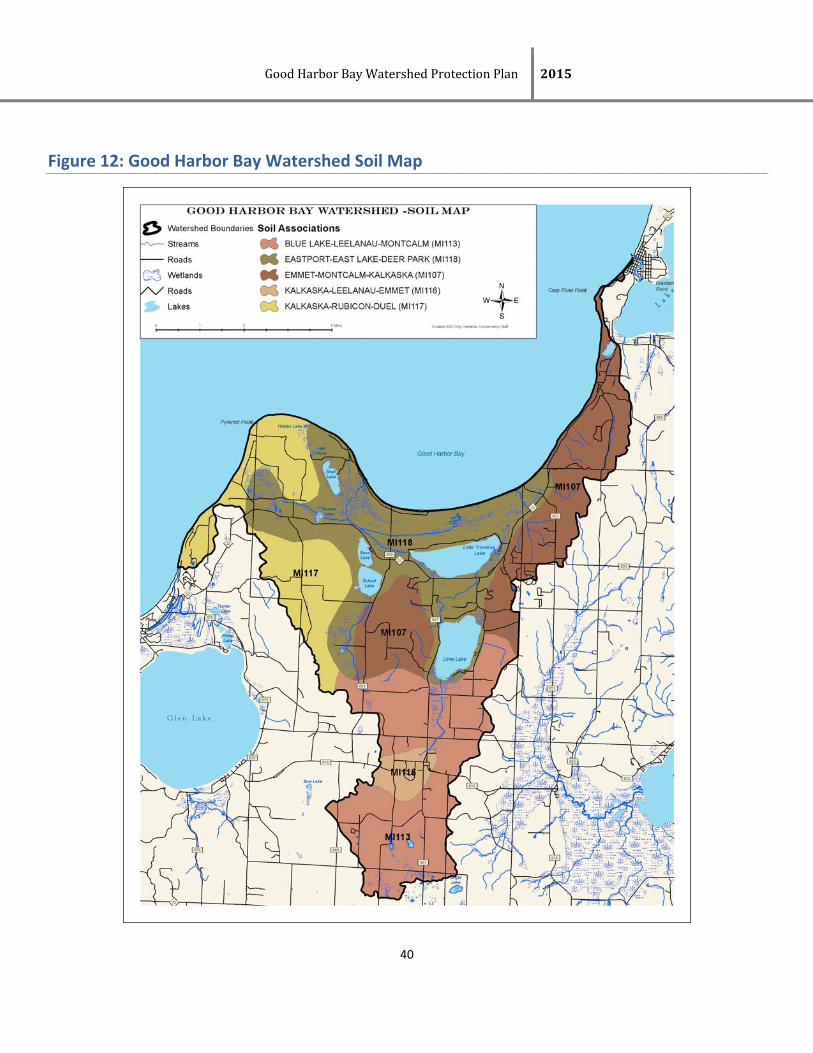
There are five main soil associations in the Good Harbor Bay watershed:
Eastport‐East Lake‐Deer Park association makes up the majority of the soil associations comprising 34% and the Blue Lake‐Leelanau‐Montcalm association comprises 25%. The Emmet‐Montcalm‐Kalkaska association comprises 22%, the Kalkaska‐Rubicon‐Duel association comprises 16%, and the Kalkaska‐Leelanau‐Emmet association, 3% (Figure 12).
The Blue Lake association is characterized by well‐drained, nearly level to strongly sloping, gravelly, loamy and sandy soils on outwash plains. The Deer Park association is made up of sandy soils that are well drained and strongly sloping to very steep. Eastport associations are well to moderately well drained, nearly level to gently sloping, sandy soils. Nearly level to strongly sloping sandy soils on outwash plains characterize the Kalkaska‐Leelanau association. In contrast, the Kalkaska‐Rubicon association is found on moraines. Watershed valley floors, lakeshores and wetlands are typically composed of Lupton‐Markey mucks or marl with a high pH.
GoodHarborBayWatershedProtectionPlan 2015
40
Figure 12: Good Harbor Bay Watershed Soil Map
GoodHarborBayWatershedProtectionPlan 2015
41
Soil Types and Origins in the Good Harbor Watershed
Soil is a natural blanket of layered, decomposed and unconsolidated rock fragments, organic material, water and air that overlies bedrock or unconsolidated material at the earth’s surface (Kohnke and Franzmeier, 1995). The properties of soil depend on five factors that governed how they formed. Parent material and topography were the conditions that defined the setting when the formation of the soil began. In the Good Harbor Bay watershed the source material is glacial deposits (containing, in part, igneous, metamorphic and sedimentary rocks), water deposits and wind deposits (see the Geology Section). The glacial deposits consist of various layers of clay, silt, sand and gravel, much of which is high in calcium. The high calcium content explains the common occurrence of hard water in the watershed. The silt and sand deposits are particularly susceptible to wind erosion and often fail to develop well‐developed soil horizons because of migration of the sand.
The topography at the end of the glacial periods (see Geology Section) defined the initial rates of erosion. Until plants took root and developed thin soils, wind and water were able to erode the hills producing many of the moderate‐scale landforms present today. Once plants took hold and developed stable soil horizons, the rate of erosion decreased. Topography also plays an important role in the shape of the water table and of the rate of flow of subterranean water. The water table is highest under hills and lowest under low‐lying areas. Flat landscapes often have water‐logged soils and near stagnant subterranean water.
Further development of soil horizons relies on the three active factors: climate, organisms and time. The processes involved are physical, chemical and biological. The action of these processes results in a wide variety of soil types.
Soils are classified using a hierarchical system. Soils in the watershed belong almost entirely to the Spodosol Order marked by a spodic horizon of aluminum, organic matter and usually iron that forms on a sandy substrate under forest vegetation that is often dominated by conifers. Organic‐rich Histosols may be present locally in the watershed in shallow lakes and in the wet lands around the margins of some lakes and creeks.
Some of the finer levels of the classification system are combined in the classification system shown on the detailed map. Particle size terms are a Family name and include: the smallest particles, which are clay minerals and silt that constitute ‘loam’; sand; and gravel, which has a wide range of particle sizes from the smallest up to boulders. The use of the term as an
GoodHarborBayWatershedProtectionPlan 2015
42
adjective indicates the relative amounts of a particular particle size component. For example, ‘loamy sand’ indicates minor amounts of clay and/or silt in sand while ‘sandy loam’ indicates clay and/or silt with minor sand. It is important to note that none of the units in the watershed contain more than about 20% clay or 40% silt at the surface, although it is known that there are clay layers at depth. The highest silt content in the watershed is in ‘loam’, e.g., the Hettinger‐Tonkey loams. The distribution and amount of clay and silt is important because they can reduce the porosity and permeability of the soil and, therefore, the movement of water into and through it. The percent slope is also given in the table, which gives a good indicator of the rate of runoff of rain and snow melt and, therefore, of areas of potential local flooding. The location names preceding the different soil types indicate the area where that type of soil was first described.
It is clear that there is a wide variety of soil types across the watershed (cf. Soil Summary Table and the detailed soil map). Loamy sands (Ll and Ea soils) form large patches from Pyramid Point and around to the south and west of M22. Gravely sandy loams (Eo and Km), sandy loams (Es) and sand (Ka soils) are also locally abundant in the same area. This overall area corresponds to the glacial tills and deposits in the watershed (see Geology section).
Mostly north of M22, Little Traverse Lake and Shell Lake are sands (D soils) and muck (R soils). These formed during retreat of the last glacial lake and the repeated eastward and westward migrations of Shalda Creek (see the Geology section). The sands are in part dune deposits, which are locally eroded, and marsh and swamp deposits.
The soil association map shows a good correlation with the parent material and eliminates much of the detail associated with the topography on the detailed soil map. Association M107 agrees quite well with the till located between Bass and School Lakes and Little Traverse and Lime Lakes and from Little Traverse Lake and Lime Lakes northeast to the mouth of the Carp River, which is all one geologic unit based. The till extending from Pyramid Point south to the watershed boundary is slightly different and is characterized by soil association M117; it also includes finer‐grained silts and sands. M113 and M116 are associated with till, sand and silt south of Maple City. The Little Traverse and Lime Lake and the Bass and School Lake embayments, the area north of Little Traverse Lake and northwest to beyond Shell Lake and to the west of Navara Lake all belong to association M118. The substrate here is sand, marshes and swamps as mentioned above and in the Geology section.
GoodHarborBayWatershedProtectionPlan 2015
43
Climate and time both had an important role in the formation of the soil types in the watershed but neither one varied across the watershed during soil formation and, therefore, are not responsible for the variations in soil types seen today. Source material and topography were the dominant factors that determined the different soil types on the scale of the detailed map and the associations on the association map. Biologic activity has been most important in areas of low relief where there has been extensive plant growth, but again that is tied into the topography. In other words, the early formation of soils in the watershed is largely responsible for the types of soils and their distribution that is seen today and both the source material and topography relate back to the glacial geologic events and history.
GoodHarborBayWatershedProtectionPlan 2015
44
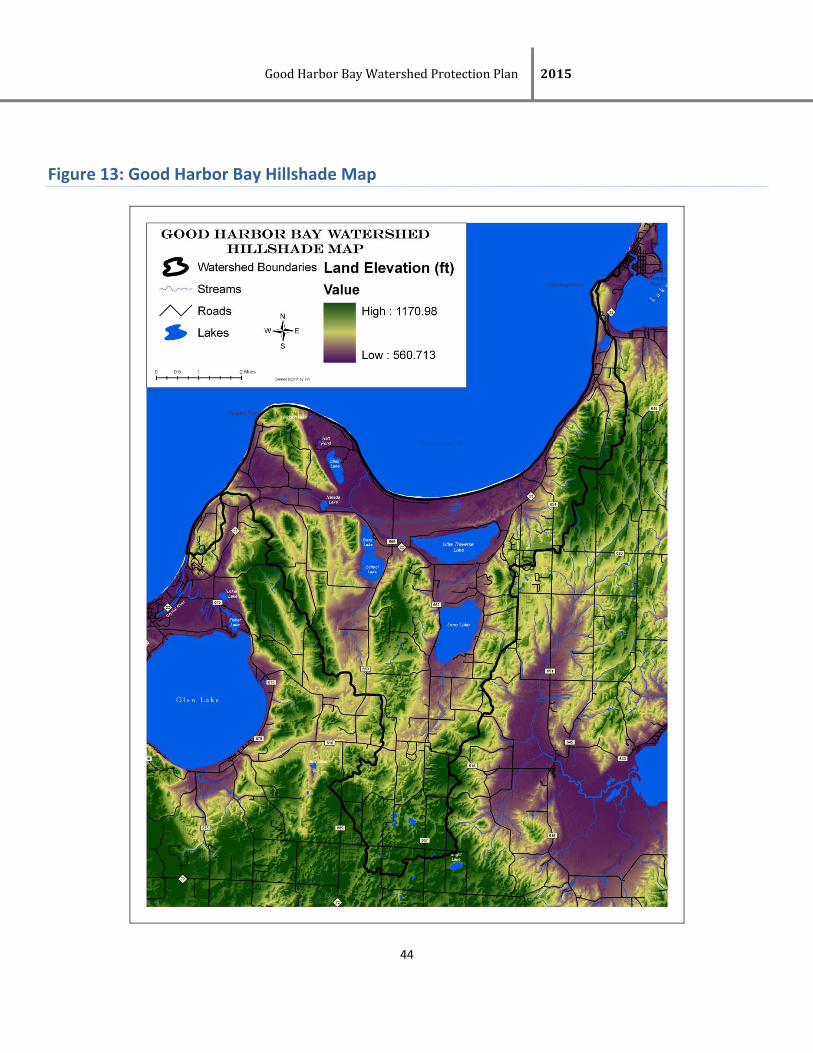
Figure 13: Good Harbor Bay Hillshade Map
GoodHarborBayWatershedProtectionPlan 2015
45
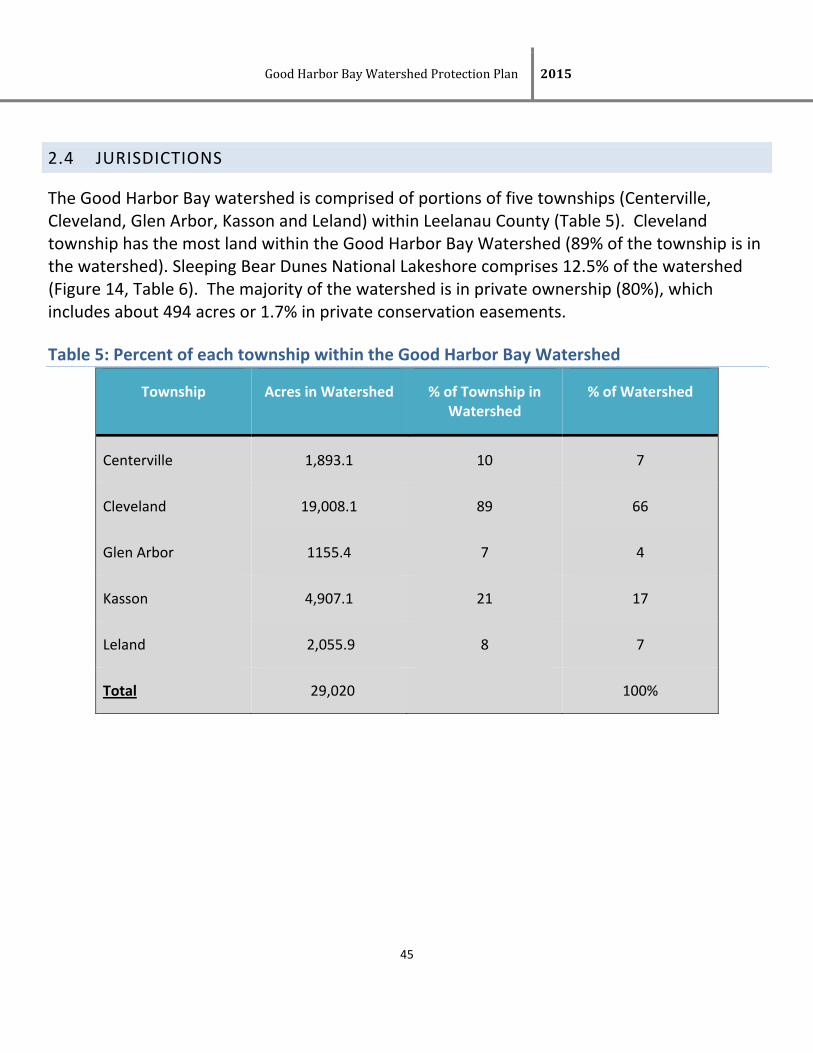
2.4 JURISDICTIONS
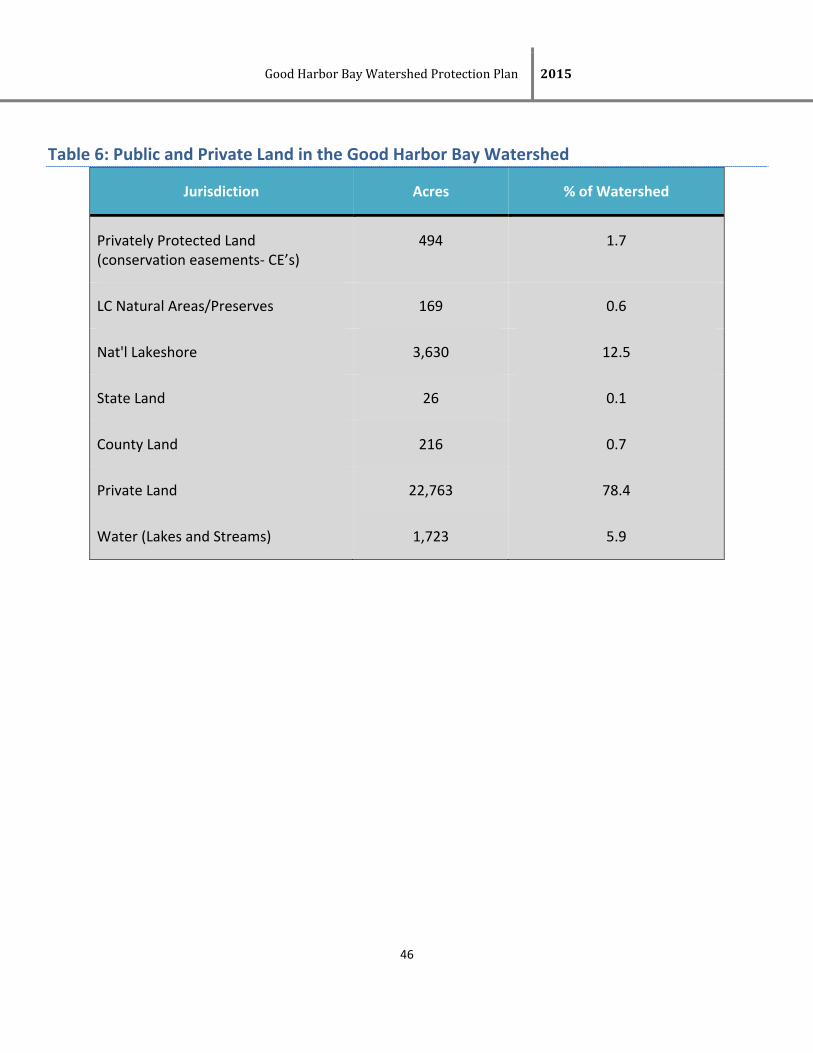
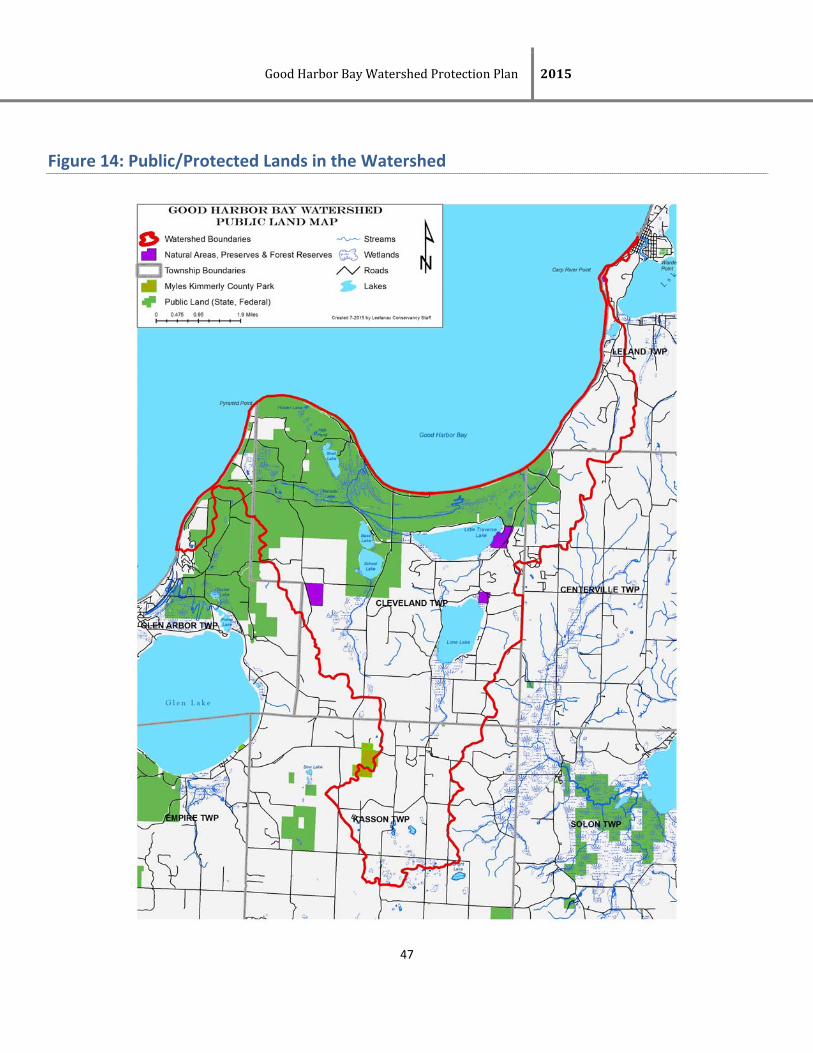
The Good Harbor Bay watershed is comprised of portions of five townships (Centerville, Cleveland, Glen Arbor, Kasson and Leland) within Leelanau County (Table 5). Cleveland township has the most land within the Good Harbor Bay Watershed (89% of the township is in the watershed). Sleeping Bear Dunes National Lakeshore comprises 12.5% of the watershed (Figure 14, Table 6). The majority of the watershed is in private ownership (80%), which includes about 494 acres or 1.7% in private conservation easements.
Table 5: Percent of each township within the Good Harbor Bay Watershed
Township Acres in Watershed % of Township in Watershed
% of Watershed
Centerville 1,893.1 10 7
Cleveland 19,008.1 89 66
Glen Arbor 1155.4 7 4
Kasson 4,907.1 21 17
Leland 2,055.9 8 7
Total 29,020 100%
GoodHarborBayWatershedProtectionPlan 2015
46
Table 6: Public and Private Land in the Good Harbor Bay Watershed
Jurisdiction Acres % of Watershed
Privately Protected Land (conservation easements‐ CE’s)
494 1.7
LC Natural Areas/Preserves 169 0.6
Nat'l Lakeshore 3,630 12.5
State Land 26 0.1
County Land 216 0.7
Private Land 22,763 78.4
Water (Lakes and Streams) 1,723 5.9
GoodHarborBayWatershedProtectionPlan 2015
47
Figure 14: Public/Protected Lands in the Watershed
GoodHarborBayWatershedProtectionPlan 2015
48
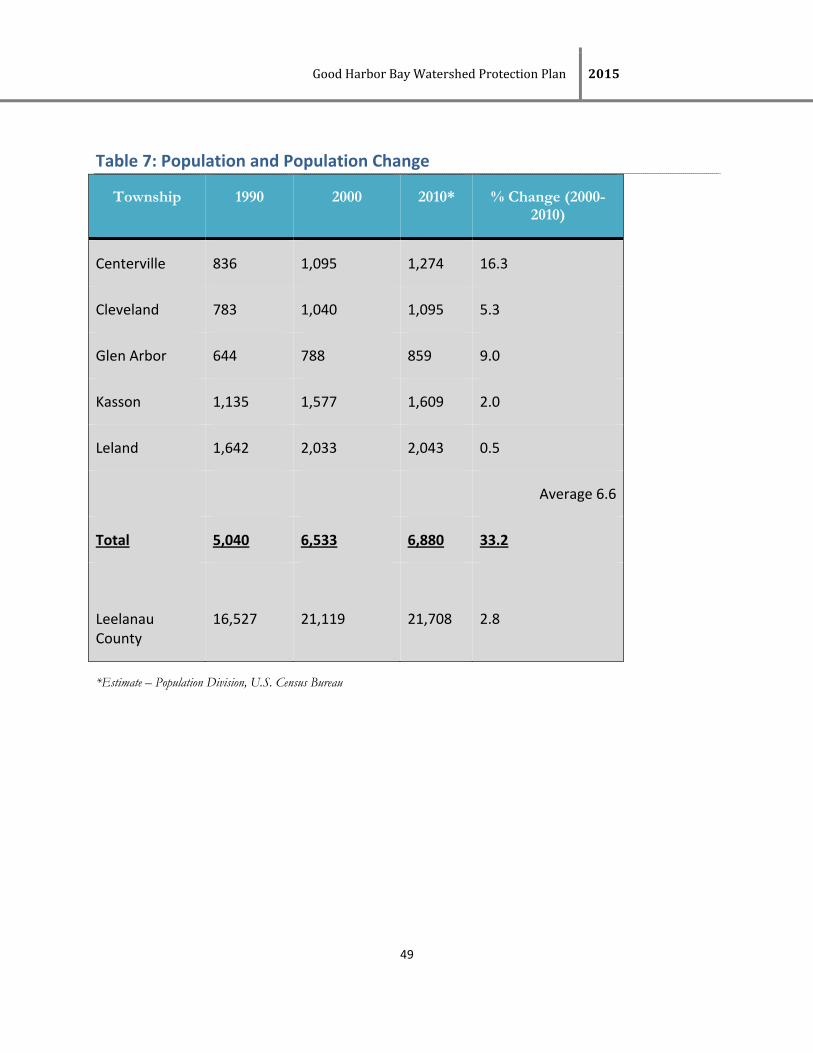
2.5 POPULATION
Rich in land and water resources, the Good Harbor Bay Watershed is home to both seasonal and year round residents living in Leelanau County and covering five Townships (Table 7). Since the Good Harbor Bay Watershed does not directly follow census boundaries, it is difficult to evaluate demographic characteristics of the exact population within the watershed boundary. According to the last census Leelanau County is one of the counties that grew at one of the fastest rates in Northwest Michigan. From 2000 to 2010 the area’s population rose 10% (Table 7) and future projections indicate a steady growth rate for years to come. Leelanau County showed a percent population change of 2.8% (Table 7)
The greatest individual township population increases between 2000 and 2010 were found in Centerville and Glen Arbor Townships, with 16.3 % and 9% increases respectively. Leelanau County’s population doubles during summer months to nearly 26,000 persons. These increases in population and future development have the potential to impact the entire watershed through nonpoint source pollutants, increased stormwater runoff, loss of wetlands, land fragmentation and potential degradation of important groundwater recharge areas.
GoodHarborBayWatershedProtectionPlan 2015
49
Table 7: Population and Population Change
Township 1990 2000 2010* % Change (2000-2010)
Centerville 836 1,095 1,274 16.3
Cleveland 783 1,040 1,095 5.3
Glen Arbor 644 788 859 9.0
Kasson 1,135 1,577 1,609 2.0
Leland 1,642 2,033 2,043 0.5
Average 6.6
Total 5,040 6,533 6,880 33.2
Leelanau County
16,527
21,119
21,708
2.8
*Estimate – Population Division, U.S. Census Bureau
GoodHarborBayWatershedProtectionPlan 2015
50
2.6 LAND USE/LAND COVER
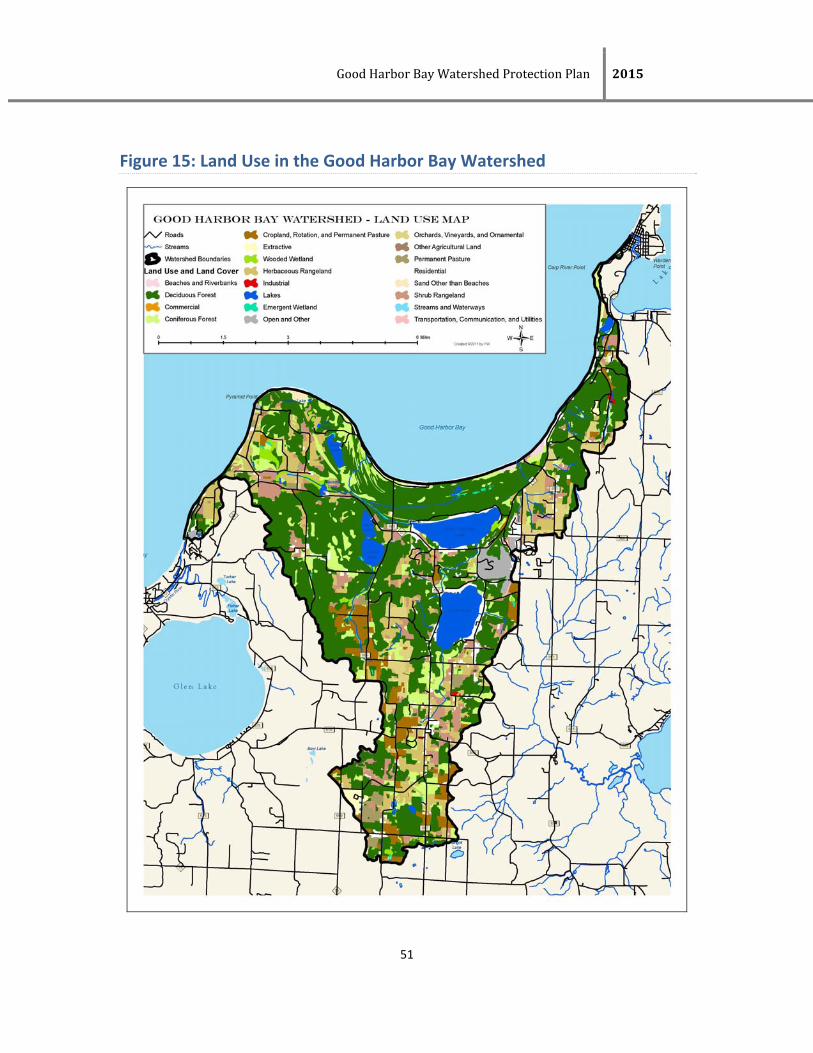
The land use within the watershed is dominated by 53.5% forested lands, (44.9% deciduous and 8.6 % coniferous), followed by 18.1 % Open shrub/Grassland and 9.6% agriculture (5.4% cropland, 3% orchards and vineyards, and 1.2 % permanent pasture or other agriculture), 6.7 % water, Urban uses comprising 5.7% and 1.4 % wetlands, (Figure 15, Tables 8 & 9).
The Good Harbor Bay watershed is blessed with more than 53% of its land in a forested condition (Table 8 & 9). Deciduous forest stands comprise the single largest land use of the watershed and, with sustainable management, provide an economic resource. At the same time, these forests have vital ecological roles. Following behind forests, Open shrub/Grassland (18.1%) and agriculture (9.6%) cover the majority of the remaining portions of the watershed (Table 8).
According to the land use layer, the major human land use of the watershed is agricultural (9.6%) along with residential homes, which comprise nearly 6% of the watershed (Table 8). Agriculture is an important part of the Good Harbor Bay Watershed, especially cherry orchards. The lack of significant industry in the watershed is a legacy of the 1950’s resort era that followed the crash of the resource dependent early 1900’s economy. The economy of the watershed has become more reliant seasonal tourism and summer residents that are drawn to the natural scenery found few other places. The high percentage of forested land in the watershed provides scenic beauty enjoyed by thousands of tourists while simultaneously protecting wildlife habitat, groundwater recharge and important water quality functions.
GoodHarborBayWatershedProtectionPlan 2015
51
Figure 15: Land Use in the Good Harbor Bay Watershed
GoodHarborBayWatershedProtectionPlan 2015
52
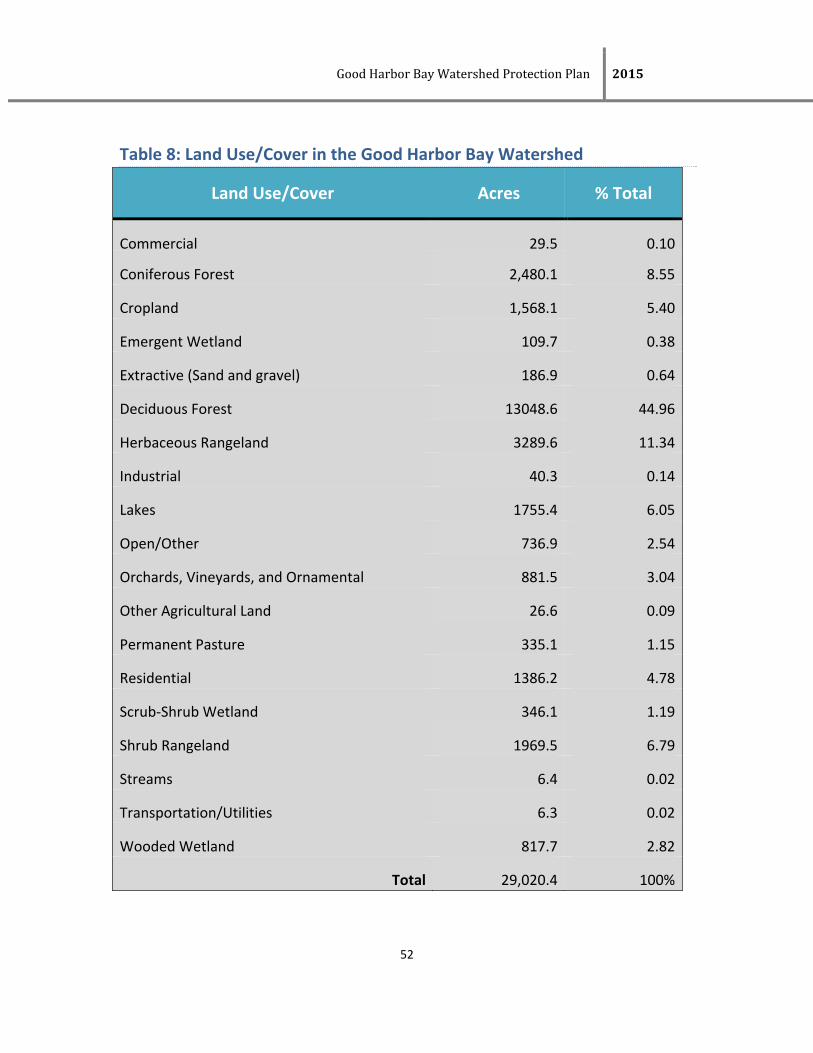
Table 8: Land Use/Cover in the Good Harbor Bay Watershed
Land Use/Cover Acres % Total
Commercial 29.5 0.10
Coniferous Forest 2,480.1 8.55
Cropland 1,568.1 5.40
Emergent Wetland 109.7 0.38
Extractive (Sand and gravel) 186.9 0.64
Deciduous Forest 13048.6 44.96
Herbaceous Rangeland 3289.6 11.34
Industrial 40.3 0.14
Lakes 1755.4 6.05
Open/Other 736.9 2.54
Orchards, Vineyards, and Ornamental 881.5 3.04
Other Agricultural Land 26.6 0.09
Permanent Pasture 335.1 1.15
Residential 1386.2 4.78
Scrub‐Shrub Wetland 346.1 1.19
Shrub Rangeland 1969.5 6.79
Streams 6.4 0.02
Transportation/Utilities 6.3 0.02
Wooded Wetland 817.7 2.82
Total 29,020.4 100%
GoodHarborBayWatershedProtectionPlan 2015
53
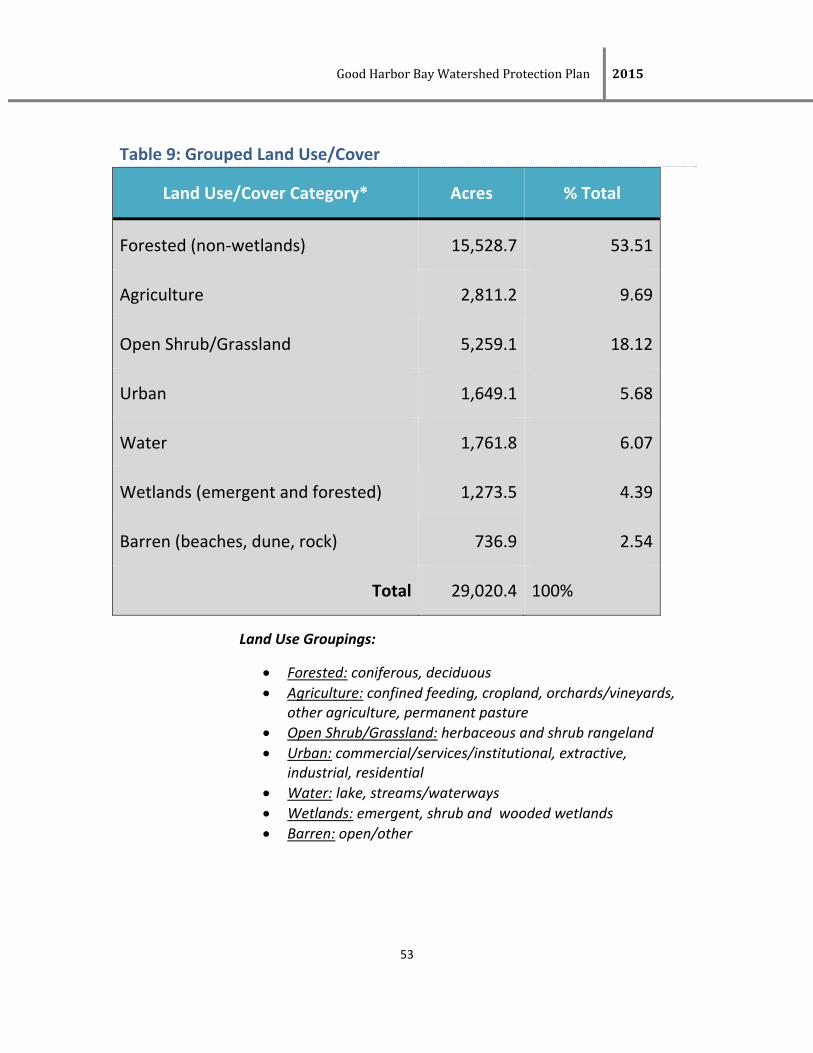
Table 9: Grouped Land Use/Cover
Land Use/Cover Category* Acres % Total
Forested (non‐wetlands) 15,528.7 53.51
Agriculture 2,811.2 9.69
Open Shrub/Grassland 5,259.1 18.12
Urban 1,649.1 5.68
Water 1,761.8 6.07
Wetlands (emergent and forested) 1,273.5 4.39
Barren (beaches, dune, rock) 736.9 2.54
Total 29,020.4 100%
Land Use Groupings:
Forested: coniferous, deciduous
Agriculture: confined feeding, cropland, orchards/vineyards, other agriculture, permanent pasture
Open Shrub/Grassland: herbaceous and shrub rangeland
Urban: commercial/services/institutional, extractive, industrial, residential
Water: lake, streams/waterways
Wetlands: emergent, shrub and wooded wetlands
Barren: open/other
GoodHarborBayWatershedProtectionPlan 2015
54
2.7 THREATENED AND ENDANGERED SPECIES
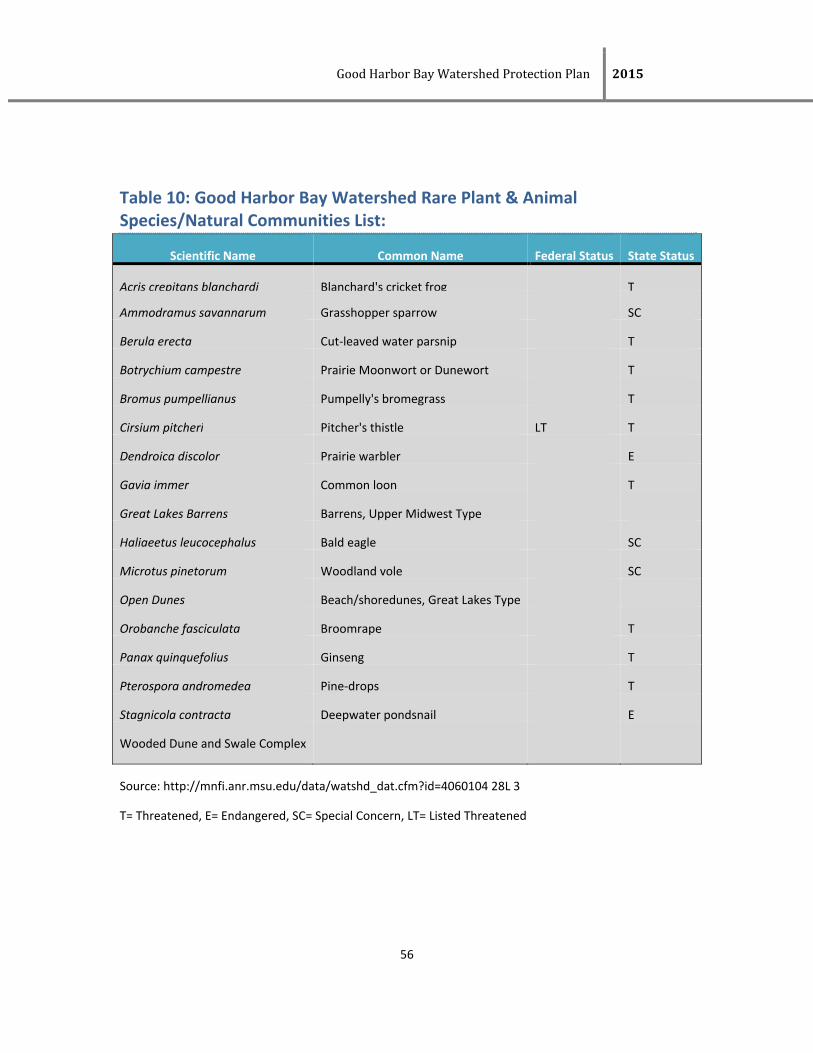
This is a listing of all known occurrences of the Endangered (E), Threatened (T), and Probably Extirpated (X) plant and animal species of Michigan, and high quality natural communities occurring within the Good Harbor Bay watershed (Table 10). The species and community information is derived from the MNFI database. The watersheds are based on the 14 digit Hydraulic Unit Codes (HUC).
The species on this list are protected under the Endangered Species Act of the State of Michigan (Part 365 of PA 451, 1994 Michigan Natural Resources and Environmental Protection Act). The current list became effective on April 9, 2009, after extensive review by technical advisors to the Michigan Department of Natural Resources and the citizenry of the state. Also included in this list are Natural Communities, plant and animal species of Special Concern. While not afforded legal protection under the Act, many of these species are of concern because of declining or relict populations in the state. Should these species continue to decline, they would be recommended for Threatened or Endangered status. Protection of Special Concern species now, before they reach dangerously low population levels, would prevent the need to list them in the future by maintaining adequate numbers of self‐sustaining populations within Michigan. Some other potentially rare species are listed as of Special Concern pending more precise information on their status in the state; when such information becomes available, they could be moved to threatened or endangered status or deleted from the list.
The listing is based on the polygon representation of the occurrences. Consequently any single occurrence may span watershed boundaries and be listed in more than one watershed. This list is based on known and verified sightings of threatened, endangered, and special concern species and represents the most complete data set available. It should not be considered a comprehensive listing of every potential species found within a watershed. Because of the inherent difficulties in surveying for threatened, endangered, and special concern species and inconsistency of

GoodHarborBayWatershedProtectionPlan 2015
55
inventory effort across the State species may be present in a watershed and not appear on this list.
This list was produced by the Endangered Species Program of the Michigan Department of Natural Resources and the Michigan Natural Features Inventory. English names in common usage or from published sources have been incorporated, when possible, to promote public understanding of and participation in the Endangered Species Program. To comment on the list or request additional copies, or for information on the Endangered Species Program, contact the Endangered Species Coordinator, Wildlife Division, Michigan Department of Natural Resources, P.O. Box 30028, Lansing, MI 48909 (517‐373‐1263). To report occurrences of these species, please contact: [email protected].
Source: http://mnfi.anr.msu.edu/
GoodHarborBayWatershedProtectionPlan 2015
56
Table 10: Good Harbor Bay Watershed Rare Plant & Animal Species/Natural Communities List:
Scientific Name Common Name Federal Status State Status
Acris crepitans blanchardi Blanchard's cricket frog T
Ammodramus savannarum Grasshopper sparrow SC
Berula erecta Cut‐leaved water parsnip T
Botrychium campestre Prairie Moonwort or Dunewort T
Bromus pumpellianus Pumpelly's bromegrass T
Cirsium pitcheri Pitcher's thistle LT T
Dendroica discolor Prairie warbler E
Gavia immer Common loon T
Great Lakes Barrens Barrens, Upper Midwest Type
Haliaeetus leucocephalus Bald eagle SC
Microtus pinetorum Woodland vole SC
Open Dunes Beach/shoredunes, Great Lakes Type
Orobanche fasciculata Broomrape T
Panax quinquefolius Ginseng T
Pterospora andromedea Pine‐drops T
Stagnicola contracta Deepwater pondsnail E
Wooded Dune and Swale Complex
Source: http://mnfi.anr.msu.edu/data/watshd_dat.cfm?id=4060104 28L 3
T= Threatened, E= Endangered, SC= Special Concern, LT= Listed Threatened
GoodHarborBayWatershedProtectionPlan 2015
57
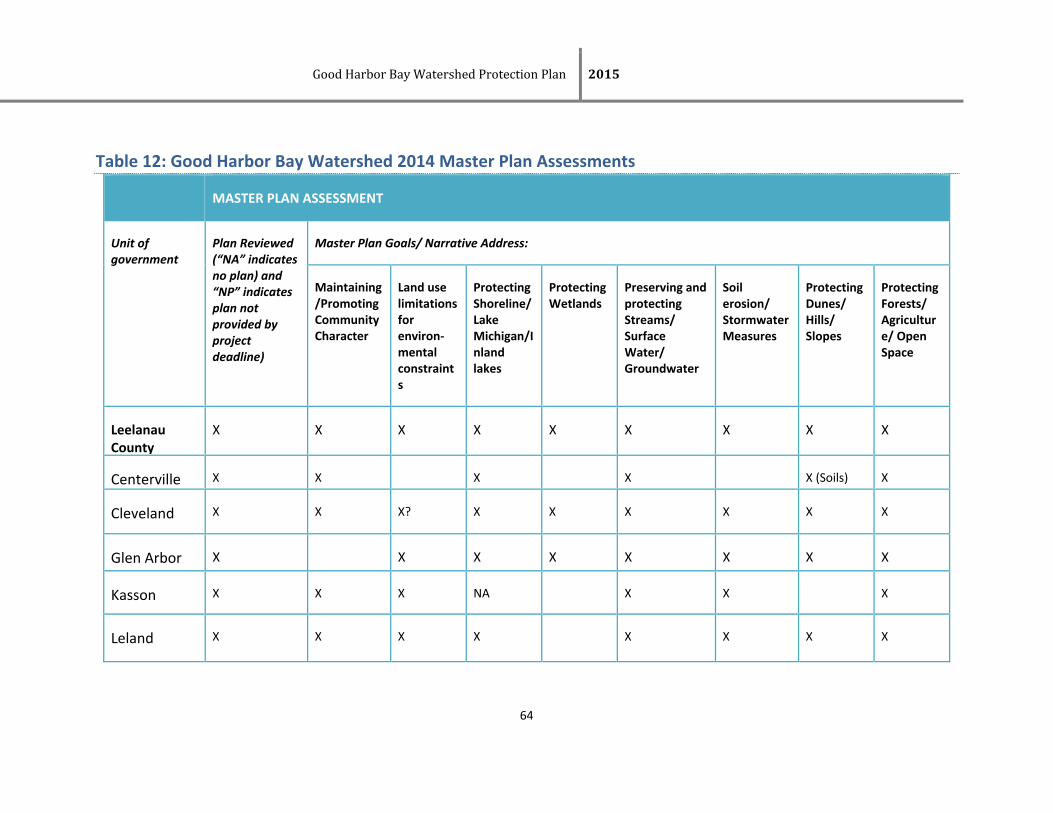
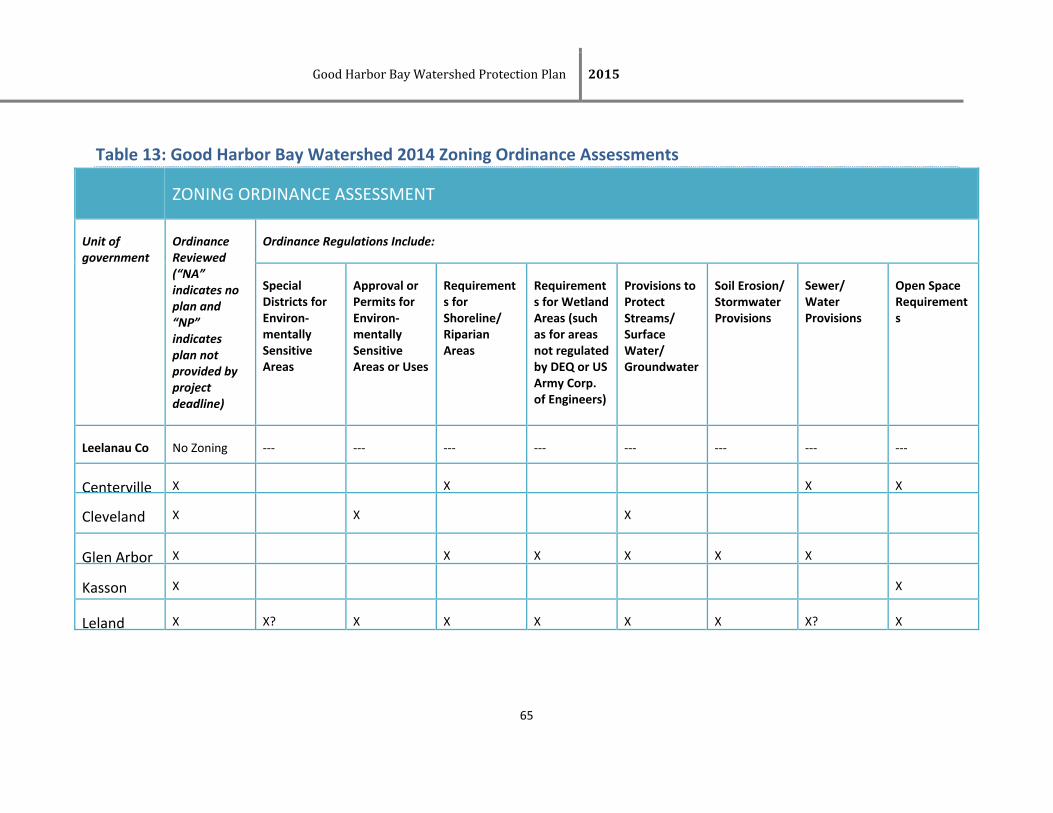
2.8 MASTER PLANS AND ZONING ORDINANCES
Master Plans and Zoning Ordinances
How communities manage their land use has a direct impact on the community’s water resources. Zoning, master plans, and special regulations are a few of the more commonly used land management tools. Zoning ordinances, if enforced, establish the pattern of development, protect the environment and public health, and determine the character of communities. In 2006, PA 110, The Michigan Zoning Enabling Act was signed into law. This act codified the laws regarding local units of government regulating the development and use of land. It also provides for the adoption of zoning ordinances; to provide for the establishment in counties, townships, cities, and villages of zoning districts; prescribes the powers and duties of certain officials; to provide for the assessment and collection of fees; authorizes the issuance of bonds and notes; and prescribes penalties and provide remedies. In 2008, PA 33, titled Michigan Planning and Enabling Act, was signed into law. This law consolidated previous planning acts under one statute, creating a standard structure for all local planning commissions and one set of requirements that will apply to the preparation of all master plans. Since protecting water quality requires looking at what happens on land, zoning is an important watershed management tool.
Planners should recognize that water quality is directly impacted by adjacent land use with the amount of impervious surfaces being particularly paramount. Land use planning techniques should be applied that preserve sensitive areas, redirect development to those areas that can support it, maintain or reduce impervious surface cover, (such as roads, driveways and parking lots) and reduce or eliminate nonpoint sources of pollution.
Zoning’s effectiveness depends on many factors, such as the restrictions in the language, the enforcement, and public support. Many people assume existing laws protect sensitive areas, only to find otherwise when development is proposed. Zoning can be used very effectively for
GoodHarborBayWatershedProtectionPlan 2015
58
managing land uses in a way that is compatible with watershed management goals. A wide variety of zoning and planning techniques can be used to manage land use and impervious cover in the watershed. Some of these techniques include: watershed based zoning, overlay zoning, impervious overlay zoning, floating zones, incentive zoning, performance zoning, urban growth boundaries, large lot zoning, infill/community redevelopment, transfer of development rights (TDRs), and limiting infrastructure extensions. Some benefits of zoning include: increased local control/autonomy over land use decision‐making; communicating clear expectations with developers based on community needs; and, an opportunity for the residents of the area to design the type of community they want to live in – one that respects their unique cultural, historic, and natural resource values.
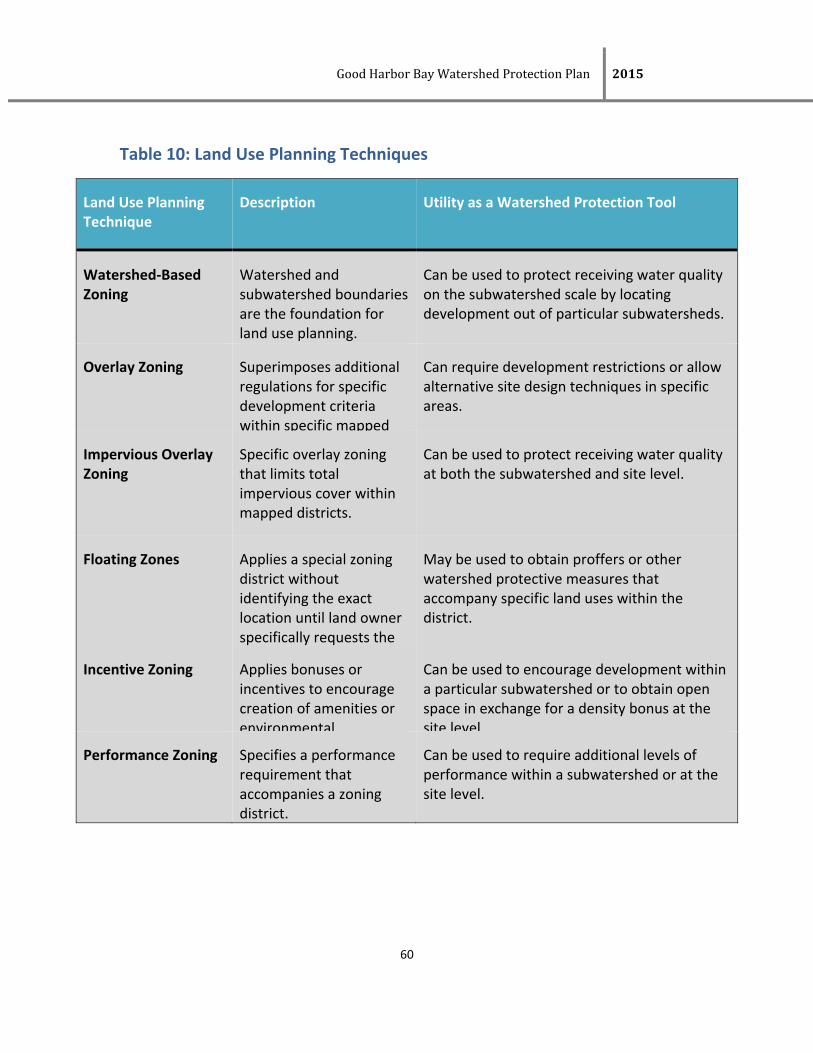
Local officials face hard choices when deciding which land use planning techniques are the most appropriate to modify current zoning. Table 10, adapted from the Center for Watershed Protection’s Rapid Watershed Planning Handbook, provides further details on land use planning techniques and their utility for watershed protection (CWP 1998). While most of these techniques are for watersheds much bigger than the Good Harbor Bay watershed, it still presents a good picture of available land use planning techniques. In addition, the DEQ has published a book titled Filling the Gaps: Environmental Protection Options for Local Governments that equips local officials with important information to consider when making local land use plans, adopting new environmentally focused regulations, or reviewing proposed development (Ardizone, Wyckoff, and MCMP 2003). An overview of Federal, State, and local roles in environmental protection is provided, as well as information regarding current environmental laws and regulations including wetlands, soil erosion, inland lakes and streams, natural rivers, floodplains, and more. The book also outlines regulatory options for better natural resources and environmental protection at the local level. (A copy of this guidebook is available via the DEQ website: WWW.MICHIGAN.GOV/DEQ Water Surface Water Nonpoint Source Pollution (look under Information/Education heading).
GoodHarborBayWatershedProtectionPlan 2015
59
Local governance can be a complicated issue. Generally, local governments may enact zoning laws that are more stringent than the next highest ranking form of government, but not less. In any case, all applicable State laws must be followed. Most of the townships located in the Good Harbor Bay watershed have both a Master Plan and Zoning Ordinance (Tables 12 & 13). Assisting local governments in updating and enacting strong zoning ordinances to protect water quality and secure natural areas is extremely important in the Good Harbor Bay watershed and is a high priority for implementation efforts (Chapter 8). Master plans and zoning ordinances have great potential to affect water quality. Zoning ordinances have a direct role in determining the type and density of land use allowed. They regulate permitted uses of the land, for example, setting minimum/maximum lot sizes and setback requirements (from neighbors, roads, water bodies). Overall, zoning ordinances are enacted to ensure that the use of private property does not negatively affect the public’s safety, health, and welfare. Since protecting water quality requires looking at what happens on land, zoning can be an extremely important watershed management tool.
Examples of zoning to protect water quality include requiring vegetative buffer zones along bodies of water (see earlier section on Lack of Riparian Buffer), requiring greenbelt areas, protecting the integrity of soil by having filtered views along stream corridors (protects banks from erosion), or protecting wetlands.
GoodHarborBayWatershedProtectionPlan 2015
60
Table 10: Land Use Planning Techniques
Land Use Planning Technique
Description Utility as a Watershed Protection Tool
Watershed‐Based Zoning
Watershed and subwatershed boundaries are the foundation for land use planning.
Can be used to protect receiving water quality on the subwatershed scale by locating development out of particular subwatersheds.
Overlay Zoning Superimposes additional regulations for specific development criteria within specific mapped
Can require development restrictions or allow alternative site design techniques in specific areas.
Impervious Overlay Zoning
Specific overlay zoning that limits total impervious cover within mapped districts.
Can be used to protect receiving water quality at both the subwatershed and site level.
Floating Zones Applies a special zoning district without identifying the exact location until land owner specifically requests the
May be used to obtain proffers or other watershed protective measures that accompany specific land uses within the district.
Incentive Zoning Applies bonuses or incentives to encourage creation of amenities or environmental
Can be used to encourage development within a particular subwatershed or to obtain open space in exchange for a density bonus at the site level.
Performance Zoning Specifies a performance requirement that accompanies a zoning district.
Can be used to require additional levels of performance within a subwatershed or at the site level.
GoodHarborBayWatershedProtectionPlan 2015
61
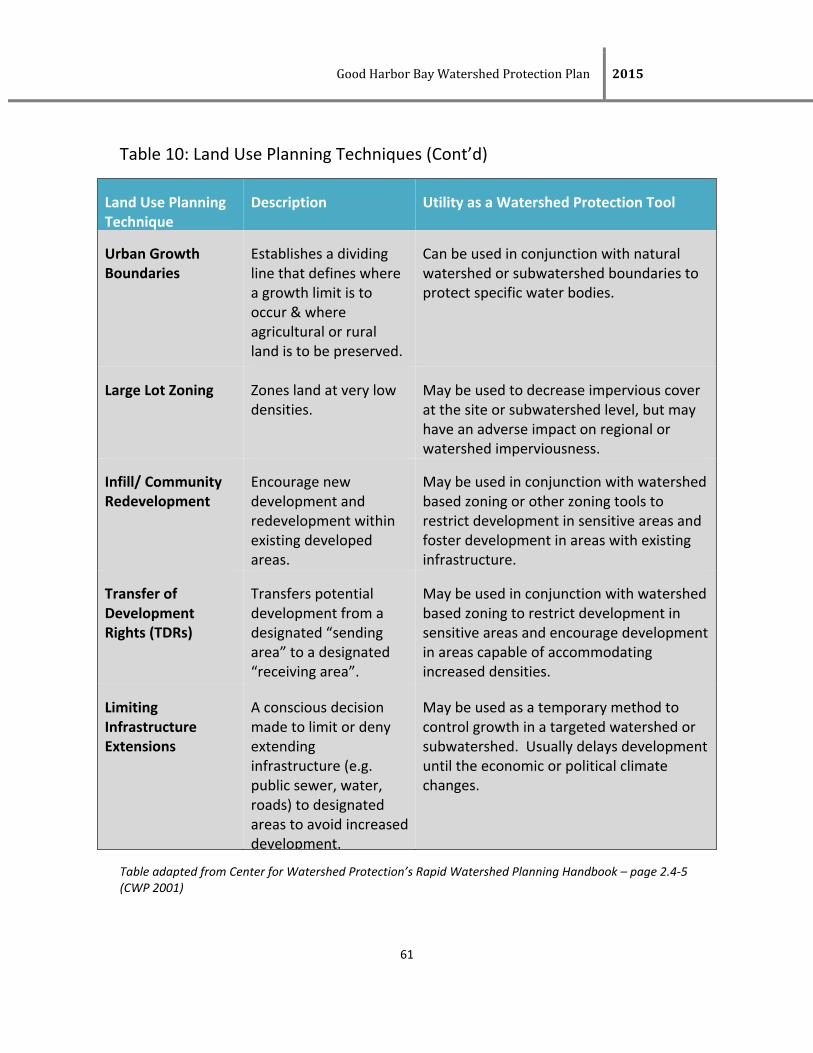
Table 10: Land Use Planning Techniques (Cont’d)
Land Use Planning Technique
Description Utility as a Watershed Protection Tool
Urban Growth Boundaries
Establishes a dividing line that defines where a growth limit is to occur & where agricultural or rural land is to be preserved.
Can be used in conjunction with natural watershed or subwatershed boundaries to protect specific water bodies.
Large Lot Zoning Zones land at very low densities.
May be used to decrease impervious cover at the site or subwatershed level, but may have an adverse impact on regional or watershed imperviousness.
Infill/ Community Redevelopment
Encourage new development and redevelopment within existing developed areas.
May be used in conjunction with watershed based zoning or other zoning tools to restrict development in sensitive areas and foster development in areas with existing infrastructure.
Transfer of Development Rights (TDRs)
Transfers potential development from a designated “sending area” to a designated “receiving area”.
May be used in conjunction with watershed based zoning to restrict development in sensitive areas and encourage development in areas capable of accommodating increased densities.
Limiting Infrastructure Extensions
A conscious decision made to limit or deny extending infrastructure (e.g. public sewer, water, roads) to designated areas to avoid increased development.
May be used as a temporary method to control growth in a targeted watershed or subwatershed. Usually delays development until the economic or political climate changes.
Table adapted from Center for Watershed Protection’s Rapid Watershed Planning Handbook – page 2.4‐5 (CWP 2001)
GoodHarborBayWatershedProtectionPlan 2015
62
During the process of drafting the GHBWPP a review and summary of master plans and zoning ordinances was conducted (Tables 12 and 13). For the most part, community master plans usually have good intentions when it comes to protecting natural resources. The natural resources of this area are why most people choose to live in the Good Harbor Bay region. In general however, townships and communities often lack the knowledge on how to draft and enact effective, yet enforceable, zoning requirements. The validity of a zoning ordinance, particularly those that are more restrictive is often challenged by developers, among others. Local governments may have trouble obtaining information to back up their ordinances that will stand up in court. Additionally, it is often an argument of property rights vs. the public good, with local governments trying to show and prove that a certain ordinance is important to protect water quality.
Soil Erosion and Stormwater Ordinances
It is important to note that, in addition to township zoning ordinances, Leelanau County has a separate “Soil Erosion, Sedimentation and Stormwater Runoff Control Ordinance (SESSRC). This ordinance incorporates Part 91 of Act 451, Michigan’s Soil Erosion and Sedimentation Control Law, which regulates and requires a permit for earthwork within 500 feet of a lake or stream or for any soil disturbance of 1 acre or more regardless of the location of that land to water. The county ordinance goes beyond those State requirements by requiring permits for all commercial projects that disturb soil, for any project within 100 feet of a regulated wetland, for construction of a driveway with a slope of 10% or greater and for any site determined to be in an environmentally sensitive area. This ordinance is an extremely valuable tool in protecting water quality.
In Leelanau County the Leelanau Conservation District has been authorized by the County to administer the SESSRC Ordinance. Upon receiving a permit application the Soil Erosion Control Officer completes a site visit to insure that all necessary soil erosion control measures and sediment control measures are properly planned and installed prior to the start of a project. It is necessary to obtain a soil erosion permit before any soil
GoodHarborBayWatershedProtectionPlan 2015
63
disturbance takes place. Further information and details can be obtained by contacting Leelanau Conservation District.
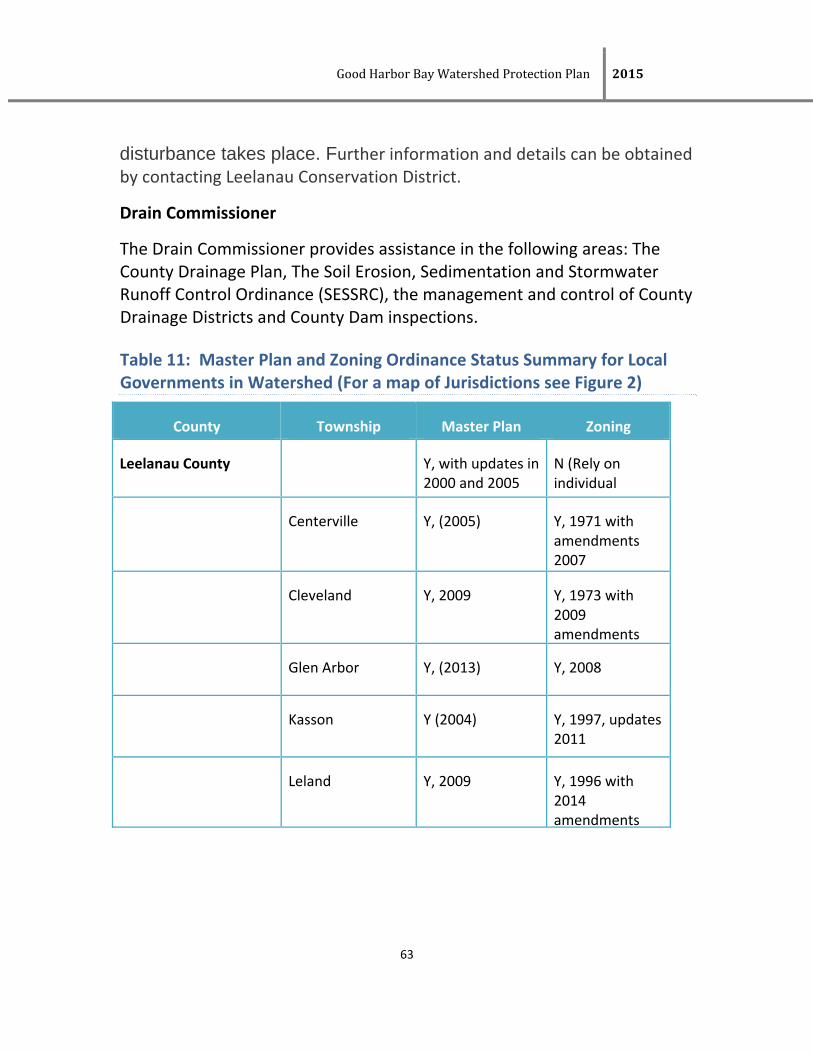
Drain Commissioner
The Drain Commissioner provides assistance in the following areas: The County Drainage Plan, The Soil Erosion, Sedimentation and Stormwater Runoff Control Ordinance (SESSRC), the management and control of County Drainage Districts and County Dam inspections.
Table 11: Master Plan and Zoning Ordinance Status Summary for Local Governments in Watershed (For a map of Jurisdictions see Figure 2)
County Township Master Plan Zoning
Leelanau County Y, with updates in 2000 and 2005
N (Rely on individual
) Centerville Y, (2005) Y, 1971 with
amendments 2007
Cleveland Y, 2009 Y, 1973 with 2009 amendments
Glen Arbor Y, (2013) Y, 2008
Kasson Y (2004) Y, 1997, updates 2011
Leland Y, 2009 Y, 1996 with 2014 amendments
GoodHarborBayWatershedProtectionPlan 2015
64
Table 12: Good Harbor Bay Watershed 2014 Master Plan Assessments
MASTER PLAN ASSESSMENT
Unit of government
Plan Reviewed (“NA” indicates no plan) and “NP” indicates plan not provided by project deadline)
Master Plan Goals/ Narrative Address:
Maintaining/Promoting Community Character
Land use limitations for environ‐mental constraints
Protecting Shoreline/ Lake Michigan/Inland lakes
Protecting Wetlands
Preserving and protecting Streams/ Surface Water/ Groundwater
Soil erosion/ Stormwater Measures
Protecting Dunes/ Hills/ Slopes
Protecting Forests/ Agriculture/ Open Space
Leelanau County
X X X X X X X X X
Centerville X X X X X (Soils) X
Cleveland X X X? X X X X X X
Glen Arbor X X X X X X X X
Kasson X X X NA X X X
Leland X X X X X X X X
GoodHarborBayWatershedProtectionPlan 2015
65
Table 13: Good Harbor Bay Watershed 2014 Zoning Ordinance Assessments
ZONING ORDINANCE ASSESSMENT
Unit of government
Ordinance Reviewed (“NA” indicates no plan and “NP” indicates plan not provided by project deadline)
Ordinance Regulations Include:
Special Districts for Environ‐mentally Sensitive Areas
Approval or Permits for Environ‐mentally Sensitive Areas or Uses
Requirements for Shoreline/ Riparian Areas
Requirements for Wetland Areas (such as for areas not regulated by DEQ or US Army Corp. of Engineers)
Provisions to Protect Streams/ Surface Water/ Groundwater
Soil Erosion/ Stormwater Provisions
Sewer/ Water Provisions
Open Space Requirements
Leelanau Co No Zoning ‐‐‐ ‐‐‐ ‐‐‐ ‐‐‐ ‐‐‐ ‐‐‐ ‐‐‐ ‐‐‐
Centerville X X X X
Cleveland X X X
Glen Arbor X X X X X X
Kasson X X
Leland X X? X X X X X X? X
GoodHarborBayWatershedProtectionPlan 2015
66
2.9 FISHERIES
The two fisheries reports for the two major lakes (Lime and Little Traverse) in the watershed written by the Michigan Department of Natural Resources are summarized below. The full reports can be found in Appendix A.
Lime Lake Fisheries (adapted from Seites/Hettinger report 2010)
Lime Lake is fed by several hillside seeps, springs, and small creeks, with the largest being Lime Creek which flows in at the southern end of the lake. Shetland Creek flows out of the north end of Lime Lake and into Little Traverse Lake, and from there Shalda Creek flows out of Little Traverse Lake and into Good Harbor Bay on Lake Michigan (Seites 2011). In years of high water migratory fish from Lake Michigan have access to Lime Lake through Shalda Creek, which flows from Little Traverse Lake to Lake Michigan. Shalda Creek is a Type 4 designated trout stream. (Seites 2011). Type 4 trout streams are open for the entire year. The Possession season for brook trout, brown trout and Atlantic salmon is the last Saturday in April through September 30. For all other species of trout and salmon the season is open for the entire year. Artificial lures and all types of natural bait may be used. The Daily Possession Limit is five (5) trout and salmon in any combination, except that the daily possession limit shall not include more than three (3) trout 15 inches or greater. The size limit is 7 inches for Brook Trout and 10 inches for Brown Trout. (FO‐200.15. Statewide Trout, Salmon, Whitefish, Lake Herring, and Smelt Regulations)
Lime Lake is a Type C designated trout lake that is open to trout fishing for the entire year (Seites 2011). Type C Lakes have a fishing and possession season open for the entire year. All types of natural bait and artificial lures may be used and the daily possession limit is five trout and the minimum size is 8 inches for Brook Trout, Brown Trout, Rainbow Trout, Lake Trout and Splake (FO‐200.15. Statewide Trout, Salmon, Whitefish, Lake Herring, and Smelt Regulations). The lake is accessible via a Michigan Department of Natural Resources (MDNR) public boat launch. This launch is located on the southwestern shore of the lake and has one dock, two slips to launch and retrieve boats, vault toilet facilities, and approximately six gravel parking spaces. The Lime Lake Association is the only riparian association that is currently active on Lime Lake. The Cedar Rod and Gun
GoodHarborBayWatershedProtectionPlan 2015
67
Club in nearby Cedar, MI is a local sportsman's group that has historically been interested in the management of Lime Lake. MDNR Fisheries Division often receives fishing reports from both local and out‐of‐town anglers.
According to Fisheries Division records, Lime Lake was first stocked with walleye fry in 1910. A mixture of cold and cool water species such as lake trout, walleye, bluegill, smallmouth bass, largemouth bass, yellow perch, and northern pike were stocked from 1920 until 1949. At this time the Michigan Department of Conservation (MDOC, precursor to today's MDNR) switched the focus of Lime Lake to the management of trout and began stocking rainbow trout. During the 1960's the trout fishery declined and the MDOC stocked a mix of brown trout and rainbow trout in order to determine which species would create a better fishery. In 1968 the MDOC decided to stock brown trout exclusively. With the exception of 1987 when both brown trout and rainbow trout were stocked, and 1969 and 1991 when no fish were stocked, Lime Lake has been stocked with brown trout annually from 1968 to 2011 (Fisheries Division files, Cadillac).
Lime Creek was also stocked by the MDOC for a number of years. Brook trout were first stocked in 1933, annually from 1935 to 1944, and for one final year in 1949 before this stocking was discontinued.
Current Status
The most recent Lime Lake fisheries survey was conducted in 2010 using Status and Trends protocols (Wehrly et al. 2009), and was intended to evaluate the success of brown trout stocking. During the 2010 survey a total of 1,912 fish representing 19 species were caught. Rock bass, yellow perch, and spottail shiners comprised the largest portion of the catch. A total of 1,203 rock bass made up 63% of the catch by number, ranging from 2 to 11 inches in length. Additionally rock bass represented 38% of the total catch by weight with 194 total pounds. Yellow perch represented 28% of the total catch by weight with 186 individuals collected.
Game fish caught in the 2010 fisheries survey included brown trout, smallmouth bass, largemouth bass, yellow perch, longear sunfish, bluegill, and northern pike. Although smallmouth bass only represented 3.7% of the catch by number, they
GoodHarborBayWatershedProtectionPlan 2015
68
represented 85.4% of the catch by weight with 71 individuals ranging in size from 3 to 20 inches. Twenty‐eight brown trout ranging in size from 6 to 14 inches represented 6.9% of the total catch by number. Most species caught in May had growth rates slightly below the State average length at age. Bluegill and rock bass were the only two species with growth rates above State average. Yellow perch growth rates were significantly below State average. Not enough largemouth bass or northern pike from any one age class were collected to make statistical inferences regarding age and growth; however as individuals the northern pike were growing above State average and the largemouth were growing below State average.
Scale samples were collected in the July electro fishing survey from rock bass, yellow perch, and smallmouth bass to be aged and compared to the State average length at age. Not enough smallmouth bass or yellow perch from any one age class were collected to make statistical inferences regarding age and growth; however rock bass were growing just slightly below State average. As individuals, both the smallmouth bass and yellow perch were growing either just below or right at the State average.
Analysis and Discussion
The 2010 MDNR fisheries survey showed Lime Lake hosts a healthy fish community with abundant species diversity. Game fish species collected include brown trout, largemouth bass, northern pike, and smallmouth bass. Brown trout were represented by two year classes (ages 1 and 3), indicating that some holdover of stocked trout is occurring. Smallmouth bass were represented by 10 year classes and are growing at a fairly good (‐0.1 inches) pace compared to the State average. Very few largemouth bass or northern pike were collected. It is important to note that in the time that Lime Lake has been a managed fishery, northern pike have only occurred in low densities. In Lime Lake where maintaining a trout fishery is one of the management goals it is critical to keep northern pike densities low to reduce predation on stocked trout.
Panfish species collected in the survey include bluegill, yellow perch, longear sunfish, and rock bass. Yellow perch were represented by five year classes and exhibited very slow growth rates compared to the State average (‐1.2 inches),
GoodHarborBayWatershedProtectionPlan 2015
69
supporting angler comments reporting catching low numbers of very large perch, mostly in the winter months or early spring. Rock bass were represented by eight year classes and were growing above State average (+0.5 inches).
There are notable differences between the fish communities collected in the 2010 fisheries survey and the fish communities collected in the prior surveys. A sharp decline occurred in alewife numbers from the 1999 survey. This could partially be attributed to gear bias, as more fyke nets were used in the 1999 survey. Fyke nets could be more effective at collecting alewife than the trap nets used in the 2010 survey. It could also be due to the fact that connectivity between Lime Lake and Lake Michigan has declined over the years. Both Shalda Creek and Sheltland Creek have experienced low water, beaver activity, and other blockages which may be preventing migratory species from reaching Lime Lake as they have in the past. Species absent from the 2010 catch included pumpkinseed sunfish, green sunfish, and fathead minnows. New species collected in the 2010 survey included longear sunfish, creek chub, bowfin, Johnny darter, mimic shiner, and sand shiner. Based on the three species of sunfish that have shown up in the catch through the years, there is potential that hybridization of panfish is making identification difficult.
Management Direction
Any remaining riparian wetlands adjacent to Lime Lake and its tributaries should be protected as they are critical to the continued health of the watershed. Appropriate watershed management is necessary to sustain healthy biological communities, including fish, invertebrates, amphibians, reptiles, birds and aquatic mammals. Generally for lakes this includes maintenance of good water quality, keeping nutrients balanced, preservation of natural shorelines; especially shore contours and vegetation, and preservation of bottom contours, vegetation, and woody structure within the lake.
Additionally, dredging of the littoral zone should be avoided if possible on Lime Lake, particularly where gravel and cobble substrates are located. Most of the near shore properties that are developed on Lime Lake have gravel and cobble substrates present which is critical for a number of important Lime Lake fish species. MDNR Fisheries Division should work collaboratively with the Lime Lake
GoodHarborBayWatershedProtectionPlan 2015
70
Association, MDEQ, National Park Service, and various non‐profit environmental agencies to identify aquatic connectivity barriers and sustain or enhance aquatic connectivity among all the basins within the Lime Lake watershed, specifically Lime Creek, Shetland Creek, Shalda Creek, and Little Traverse Lake. Enhanced aquatic connectivity will help sustain healthy fish populations into the future.
Native species like smallmouth bass, rock bass, and yellow perch should continue to thrive in Lime Lake. The smallmouth bass population in Lime Lake is exceptional, and Lime Lake has an excellent reputation among anglers for its smallmouth bass fishery. The brown trout stocking program for Lime Lake should continue. Although the current Lime Lake northern pike densities appear low, this lake should be a candidate for a no minimum size limit classification and 5 fish per day limit for northern pike. It is recommended to have the MDNR Fisheries Division survey Lime Lake again within the next five to ten years in order to continually assess the fish community and evaluate brown trout stocking efforts (Seites 2011). Fisheries Division should also survey the major tributaries to Lime Lake to better understand their contributions to this watershed. Many of these streams have never been surveyed or have not been surveyed in many years.
Little Traverse Lake Fisheries‐(adapted from Seites/Hettinger report 2014)
Little Traverse Lake is classified as a mesotrophic, slightly eutrophic lake. A combination of sand and marl dominates the bottom substrate. Much of the lake is less than 20 feet in depth, with good vegetative growth and areas of heavily wooded natural shoreline. Water clarity is impacted by tannic acid contribution from the watershed, as well as the marl bottom substrates. The surrounding topography of the 640 acre Little Traverse Lake is wooded, with adjacent sand dunes, rolling hillsides, and lowland cedar swamps (Hettinger 2014). While Little Traverse Lake is moderately developed with homes and cottages, much of the surrounding shoreline has been left unarmored. Numerous small seeps and creeks drain the surrounding hillsides and feed Little Traverse Lake (Hettinger 2014). Much of the shoreline is wooded or wetland area, with some areas of shore being sandy beaches or lightly armored with rock rip rap. Shallow near shore areas are predominately sand and marl, with water depths of 1‐5 feet (Hettinger 2014). The remaining deep water areas are marl or a pulpy peat and
GoodHarborBayWatershedProtectionPlan 2015
71
marl combination. The lake has an average depth of 5‐10 feet and reaches a maximum depth of about 50 feet (Hettinger 2014). There are two public access sites that provide boat launching facilities on Little Traverse Lake. The most accessible is a Cleveland Township Park located in the northwest corner of the lake. The second site is a Leelanau County parcel on the north east corner of the lake. There is one lake association on Little Traverse Lake, the Little Traverse Lake Property Owners Association. This association was founded originally as the Little Traverse Lake Association, and throughout the years has very active in the watershed. There is one nature preserve managed by the Leelanau Conservancy that is found along the shore of Little Traverse Lake; the Swanson Preserve (Hettinger 2014). History The earliest recorded fish stocking in Little Traverse Lake was in 1933. Fish were stocked annually by the Michigan Department of Conservation (MDOC, pre‐cursor to the present Michigan Department of Natural Resources) from 1933 to 1944. A variety of species such as yellow perch, bluegill, largemouth bass, walleye, and northern pike were stocked during this time frame (Hettinger 2014). Once the Department of Conservation stopped raising cool water species in the hatchery system, Little Traverse Lake was no longer stocked with fish. Adult panfish were transferred to the lake on three occasions in 1991, 1992, and 1993, when fish were available. These fish came from nearby Turtle Lake in Benzie County. No fish have been stocked in Little Traverse Lake since the last panfish transfer in 1993. The first known work completed by the MDOC on Little Traverse Lake, aside from stocking, started in 1949 (Hettinger 2014). Limnology surveys were also conducted throughout the years, with the first being in August of 1949. Subsequent limnology samples were taken in 1970, 1978, 1989, and 2013. The first fisheries survey on Little Traverse Lake took place in 1965 (Hettinger 2014). At this time the fishing was described as good, with the catches being predominately bluegill. Nets were set again in August of 1970, when a combination of experimental gill nets, trap nets, fyke nets, and electroshocking was used to assess the fish community (Hettinger 2014). This
GoodHarborBayWatershedProtectionPlan 2015
72
was the only survey where cisco were ever collected in Little Traverse Lake. These fish may have had free movement out to Good Harbor Bay in many years of high water, but once water levels declined and fish passage began to become obstructed via undersized culverts, the movement of cisco most likely was inhibited, thus preventing new stocks from migrating into the lake (Hettinger 2014). A request was made by the Little Traverse Lake Association in 1989 for a lake survey to be conducted after angling success reportedly declined (Hay 1989). Therefore, in June of that year the Michigan Department of Natural Resource Fisheries Division surveyed the lake using a combination of experimental gill nets and large mesh fyke nets set for three net nights (Hettinger 2014). In the summer of 1990 Fisheries Division worked with the Little Traverse Lake Association to place bundles of 12 Christmas trees at three locations in the lake to improve fish habitat (Hettinger 2014). Little Traverse Lake was surveyed again in June of 1995, using experimental gill nets, large mesh fyke nets, and small mesh fyke nets set for three net nights. The purpose of this survey was to evaluate the stocking of panfish that occurred in the early 1990's. Current Status In 2013, Fisheries Division conducted a Discretionary Survey in Little Traverse Lake which followed Status & Trends protocol (Wehrly et al 2009). This protocol uses the same types of collection gear and protocols in lakes of similar sizes, and allows the data collected in Little Traverse Lake to be compared with data collected from similar lakes across the state (Hettinger 2014). . Three sections of shoreline were electrofished using a boom electroshocking boat, and four beach locations were sampled with a seine net on July 23, 2013. During this survey a total of 861 fish representing 17 species and 18 turtles representing two species were collected (Hettinger 2014). Rock bass were the most abundant species by number, with 261 individuals collected (Table 3). Rock bass also had the highest percent by number making up 30.3 % of the catch, followed by pumpkinseed which comprised 13.1% of the catch by number with 113 individuals. The biomass of the catch was
GoodHarborBayWatershedProtectionPlan 2015
73
predominated with 68.2 lbs. of smallmouth bass and 43.6 lbs. of northern pike. Smallmouth bass represented 23.3 % of the catch by weight, while northern pike accounted for 14.9 % of the catch by weight. Growth rates for all species aged were above the state of Michigan average length at age, with the exception of northern pike which were growing 2.2 inches below average, and yellow perch which were growing 0.1 inches below average (Table 4). While most species were only slightly above average, smallmouth bass were growing well above average with growth at 1.7 inches above the state of Michigan average length at age. Not enough largemouth bass were collected from any one year class to make statistical inferences about growth (Hettinger 2014). . Analysis and Discussion Overall the growth of most fish species found in the most recent survey of Little Traverse Lake is comparable to the State average, and is in the acceptable ranges for a lake with a slightly mesotrophic/eutrophic classification (Hettinger 2014). Good numbers of smaller forage fish such as shiners and minnows produce higher growth rates in species such as the smallmouth bass; however the low numbers of smaller panfish and a relatively short growing seasons result in below average growth for northern pike (Hettinger 2014). Throughout its management history, Little Traverse Lake has been plagued with reports of a poor panfish fishery. Despite having adult panfish transferred into the lake in the early 1990's, this issue has persisted until recent times (Hettinger 2014). While numbers of bluegill still appear to be low, the numbers of longear sunfish and pumpkinseed sunfish are on the rise. One phenomenon that could be attributing to the increasing success of these panfish species is in fact the troublesome culvert located on Traverse Lake Road. Since the culvert's replacement in the late 1990's, water levels in Little Traverse Lake in the spring and the fall have been much higher than when the old culvert was in place, so high in fact that riparian owners have expressed major concerns over the flooding of their properties. However, in the spring when panfish are spawning these higher water levels and thus the increased nearshore vegetated areas may be aiding the spawning success of panfish by increasing available spawning areas and providing additional protection for newly hatched fry (Hettinger 2014).
GoodHarborBayWatershedProtectionPlan 2015
74
Management Direction Little Traverse Lake has a well preserved natural shoreline across many areas of the lake. Efforts should be made to protect remaining riparian wetlands from development in order to maintain the healthy aquatic ecosystem that currently exists (Hettinger 2014). Future unwise riparian development and wetland loss may result in deterioration of the water quality and aquatic habitat. Healthy biological communities on inland lakes and streams require suitable natural habitat (Hettinger 2014). Appropriate watershed management is necessary to sustain healthy biological communities, including fish, invertebrates, amphibians, reptiles, birds and aquatic mammals (Hettinger 2014). Additionally, dredging of the littoral zone should be avoided on Little Traverse Lake, particularly where woody debris and cobble substrates are located (Hettinger 2014). Most of the nearshore properties that are developed on Little Traverse Lake have sand and cobble substrates present, and many have high quality woody debris. This nearshore habitat is critical for a number of important Little Traverse Lake fish species, as cobble substrates and woody debris provide spawning habitat and also host many important aquatic invertebrates that help to sustain healthy fish populations (Hettinger 2014). Currently Little Traverse Lake has excellent fisheries for multiple species, such as smallmouth bass and pumpkinseed sunfish. These are well maintained by natural reproduction, and thus no fish stocking is required at this time (Hettinger 2014). However, another Discretionary or Status & Trends fisheries netting survey should be conducted on Little Traverse Lake within the next ten years in order to continually assess the fish community (Hettinger 2014). Fisheries Division should continue to work with the Little Traverse Lake Property Owners Association, the National Park Service, the Leelanau Conservancy, and the Grand Traverse Band of Ottawa and Chippewa Indians (GTB) to help develop and implement the Good Harbor Bay Watershed Protection Plan, as well as to help develop a solution for the poor road stream crossing at Traverse Lake Road (Hettinger 2014). These collaborations should also work to address additional aquatic connectivity barriers and sustain or enhance aquatic connectivity among

GoodHarborBayWatershedProtectionPlan 2015
75
all the basins within the Good Harbor Bay watershed, specifically Lime Creek, Shetland Creek, and Shalda Creek. Enhanced aquatic connectivity will help sustain healthy fish populations into the future (Hettinger 2014).
GoodHarborBayWatershedProtectionPlan 2015
76
2.10 HUMAN HISTORY
Written by Dean Manikas
Humans have inhabited the Good Harbor Watershed since before recorded time. Different bands of Native Americans trapped, hunted, fished, farmed and traded in the region before a written record was made. European settlers would later appropriate their trails as the first network of roads. Initial contact between Europeans and Native Americans was along the shore of Lake Michigan trading for goods from the natural bounty of the region. A treaty in 1836 between the United States of America and local tribes opened the region to settlement by European immigrant groups.
Steam shipping around the Great Lakes required fueling stops for wood to feed the boilers. The earliest settlements (approximately 1860) in the watershed were at New Harmony and Good Harbor (Schomberg). Both were based on the cutting and selling of wood to the hundreds of steamboats navigating the lakes. The work force, all arriving by water, were German, Czech, and Polish immigrants. Carving out a living in this harsh environment required reliance on neighbors to survive in the region, especially during rough winters. All supplies came by water, often leading to shortages of essential goods in the winter months. A story from New Harmony claims how the settlement survived the first winter thanks to the migration and easy hunting of the now extinct passenger pigeon. The continuous removal of timber began to open areas for agriculture. Potatoes, cabbage, beans, a little wheat, and game from the lakes and forests became the foodstuff of the settlers. Sawmills operated in both villages. Families would work the land during growing season and shift their labor to culling wood from the forests and working the sawmills in the winter.
Sawmills and lumbering were the primary sources of income in the region. Lumbering peaked in the early 1890’s and faded quickly at the start of the 20th century. Sawmills dotted streams and lakes. Remnants of the sawmill and fueling industry can be seen at the bottom of Lime Lake and the pilings stretching into Lake Michigan at a couple of locations along the shore of Good Harbor. Gradually,
GoodHarborBayWatershedProtectionPlan 2015
77
as the woods were cleared, settlers moved inland, away from the lakeshore. The villages of New Harmony and Good Harbor were abandoned in the early 1900s.
Maple City was founded in 1866. Initially its name was Peg town in recognition of the primary business, the manufacture of wood pegs for shoe making. The factory burnt down in 1880 but the newly named Maple City persisted even being home to a hotel.
Cedar, founded in 1892, was the last community to develop within the interior of Leelanau County. The Railroad passed through and provided easy distribution for the cedar shingle and barrel products from the local factory. 1916 saw the demise of the wood product factory but Cedar persevered.
Agriculture has been rooted in the watershed, on small plots in the earliest of times to multiple acre orchards into the modern era. Potatoes were the first cash crop in the late 1800s. Apple and cherry orchards have been prevalent since the early 1900s and remain viable in the present. But agriculture only makes up a small portion of taxable property in the modern era. Residential property dominates the taxable rolls distantly followed by commercial property. The majority of residents make their living outside the watershed.
Within the heart of Good Harbor Watershed sits Sugar Loaf Mountain. The earliest settlers, harkening memories of the hills in their native lands, admired Sugar Loaf. During Sugar Loaf’s 35 years of operation as a resort, it was the largest employer in Leelanau County. Presently, the golf courses of Sugar Loaf, the National Lake Shore, and the inland lakes and streams, attract thousands of visitors every year to the region.
GoodHarborBayWatershedProtectionPlan 2015
78
2.11 ECONOMY, TOURISM, AND RECREATION
(written by Dean Manikas)
The Good Harbor Watershed is naturally beautiful; forests, wetlands and lakes compose the majority of the surface area. Township reports show that greater than 50% of local residents are employed outside Leelanau County. The population is educated (95% with a high school diploma and 32% holding a college degree) with over 30% working in professional and managerial roles, 22% in sales/office work, 17% in services, 13% construction trades, 5% agriculture and forestry occupations. The fastest growing employment sector is in the service industry. Major employers include the Grand Traverse Band, school districts, the park service, Triple D Orchards, Leelanau Fruit, and Leelanau Redi‐Mix.Poverty rates hover around 16%. Taxable property value is derived from 92% residential, 3% agriculture, and 5% commercial. Residential property value had been greatly increasing for the past 20 years, just slowed by the recent recession.
The Sleeping Bear Dunes National Lakeshore, Sugar Loaf golf courses, and abundant lakes are the major recreational attractions. Seasonal and day visitors can swell the area’s populations by 400%. Until its closure, Sugar Loaf Resort was the largest employer in the county. Sugar Loaf is in the heart of the Good Harbor Watershed. Townships within the watershed state the following economic goals: embrace year round employment opportunities, preserve tourist friendly qualities, and protecting farmland and agricultural enterprises.
(Sources include Cleveland and Centerville Township Plans)
GoodHarborBayWatershedProtectionPlan 2015
79
SWIMMER’S ITCH SUMMARY
Ron Reimink, Lime Lake Association (LLA Biologist), wrote a summary on swimmer’s itch for the LLA and will be involved in a study of Swimmer’s Itch in Northern Michigan. He will work with the LLA and steering committee to help with some of the tasks identified in Chapter 8, Table 34) and will keep the lake associations and steering committee for this watershed informed on what is learned and what programs might be implemented in this watershed.
Below is an overview of Swimmer’s Itch adapted from the website:
Swimmer’s Itch is an infliction generated by a parasite in the water which is part of cycle involving Merganser ducks, other water fowl, and snails. The parasite burrows into one’s skin and generates a ‘mosquito bite’ type irritation which swells into a node on the skin. Swimmer’s Itch is of high concern in the inlands lakes in this watershed, particularly Lime and Little Traverse Lakes which have an increase in visitors during the swimming or summer months.
Prevention & Treatment
Until a viable, environmentally safe solution is found, here are few suggestions that many have found helpful. Obviously they are not guaranteed therapies.
Shower and towel off with vigor and thoroughness after swimming.
Avoid swimming at midday and in areas exposed to shore winds
Swim in deeper water where the infecting snails are less likely to occur.
Avoid feeding waterfowl in your swimming areas
In case of exposure, application of topical antihistamines (such a Benadryl) or a topical hydrocortisone can help reduce inflammation and relive itching
Some have reported success using Swimmer’s Itch Guard before entering the water as a preventative.
GoodHarborBayWatershedProtectionPlan 2015
80
Tracking Program
The Lime Lake Association Swimmer’s Itch Program tracks where and when anyone contracts swimmer’s itch. The LLA Board has a keen interest in keeping abreast of the latest progress in methods to alleviate swimmer's itch. Ron has been actively involved in swimmer's itch education, research, and control for the past 30 years in Michigan, Wisconsin, Indiana, and Maine and has volunteered to spearhead the efforts to keep Lime Lake on the front edge of any new control developments. Due to roadblocks at the state and national level, most control efforts involving waterfowl are limited. Anyone who decides to take control efforts into their own hands by illegally killing the ducks on Lime Lake is strongly discouraged by the LLA board. In fact, past experience has shown that such efforts actually increase the incidence of swimmer's itch. Please work within the law to maximize efforts.
To begin the assessment process, Ron is taking information from watershed users. Please contact him at his email address with any and all swimmer's itch cases from Lime Lake. Please include all of the following information for EACH PERSON INFECTED (also include repeat infections):
1. Date of contact
2. Approximate age of person infected
3. Approximate number of spots and where located
4. Approximate time of swimming (morning, afternoon, evening)
5. Approximate wind direction and speed
6. Address or location on lake most likely contacted
7. Photo of the swimmer's itch bumps (optional)
Please note: this reported data will help the LLA address this lake issue. Although he may not be able to respond to your email, please rest assured that each contact will be recorded, compiled, and shared with the LLA board and general

GoodHarborBayWatershedProtectionPlan 2015
81
membership. Thanks for helping in our quest to alleviate problems with swimmer's itch! Ron Reimink, Lime Lake Association (LLA Biologist), email: [email protected]