Golf Participation Report for Europe 2016€¦ · Golf participation rate in the top 10 European...
18
Golf Participation Report for Europe 2016 Golf Advisory Practice in EMEA GOLFBENCHMARK.com Sponsor:
Transcript of Golf Participation Report for Europe 2016€¦ · Golf participation rate in the top 10 European...

Golf Participation Report for Europe 2016Golf Advisory Practice in EMEA
GOLFBENCHMARK.com
Sponsor:

Golf Participation Report for Europe 20162

Golf Participation Report for Europe 2016 3
Dear Reader,I am delighted to present the latest Golf Participation Report for Europe. This report examines current demand and supply trends, and it presents initiatives from the various local golf associations aimed at helping the development of golf across Europe.
In 2015 our research demonstrated that the European golf market had started to stabilize in terms of numbers of registered golfers and golf courses in operation, compared to the trend of decline following the global economic downturn.
Though there are several key markets which have experienced a minor decline in demand, local golf associations have come up with a number of effective initiatives to identify and address how to attract and retain golfers, especially newcomers.
In contrast to our previous golf participation reports, this year we have put together the relevant data compiled directly from the respective golf associations across Europe. Hence, we would like to thank all of the golf associations who contributed to the preparation of this report. We would also like to thank Gary Player Design who have financially supported this research.
We hope that you will find our results both interesting and valuable. If you require any additional clarifications or if you wish to discuss our findings, please feel free to contact one of the members of our team in KPMG’s Golf Advisory Practice or myself.
Yours sincerely,
Andrea Sartori
Andrea Sartori Partner KPMG Global Head of Sport [email protected]
© 2016 KPMG Advisory Ltd., a Hungarian limited liability company and a member firm of the KPMG network of independent member firms affiliated with KPMG International Cooperative (“KPMG International”), a Swiss entity. All rights reserved.

Golf Participation Report for Europe 20164
Key Highlights 2015In early 2016, KPMG’s Golf Advisory Practice conducted a pan-European survey with local golf associations to better understand the state of golf participation and the supply of golf courses in 2015.
Based on our research, we have noted that there are a number of indicators demonstrating that the level of golf participation in Europe has started to stabilize since the decline caused by the economic downturn in and after 2008.
The following report provides insights and analysis into current demand and supply trends in the golf industry across Europe.
Distribution of registered golfers in Europe, 2015
Total number of registered golfers in Europe, 2015
Type of change in participation rates of registered golfers in Europe, 2015 (see methodology)
Total number of standard golf courses in Europe, 2015
Proportion of European population who actively played golf in 2015
State of participation of registered golfers in Europe, 2015
Male golfers
66%Female golfers
25%Junior golfers
9%
4,142,661Change since 2014
-0.3%Status
Stable-12,202 golfers since 20147,016
+16 golf courses since 2014
0.9%-0.1% since 2014
Countries with growth Countries with stability Countries with decline
30% 33%37%
Source: Local golf associations with KPMG elaboration
Golf Participation Report for Europe 20164
© 2016 KPMG Advisory Ltd., a Hungarian limited liability company and a member firm of the KPMG network of independent member firms affiliated with KPMG International Cooperative (“KPMG International”), a Swiss entity. All rights reserved.
Golf Participation Report for Europe 2016 5
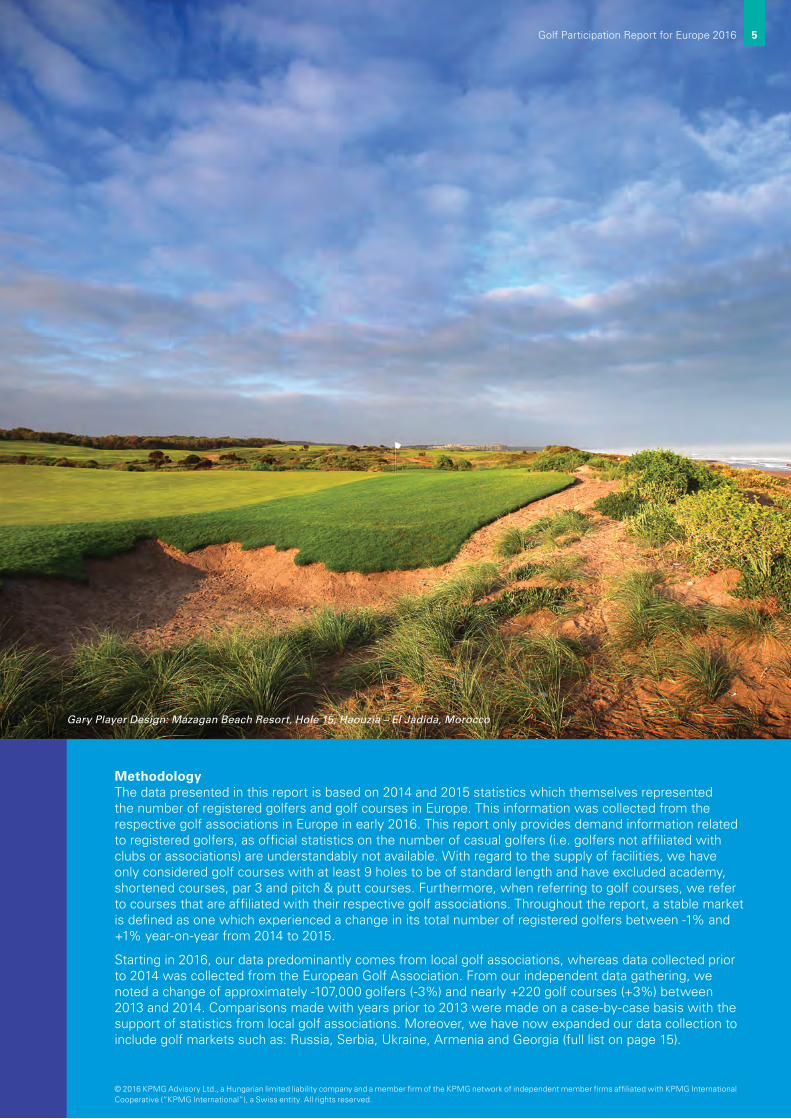
MethodologyThe data presented in this report is based on 2014 and 2015 statistics which themselves represented the number of registered golfers and golf courses in Europe. This information was collected from the respective golf associations in Europe in early 2016. This report only provides demand information related to registered golfers, as official statistics on the number of casual golfers (i.e. golfers not affiliated with clubs or associations) are understandably not available. With regard to the supply of facilities, we have only considered golf courses with at least 9 holes to be of standard length and have excluded academy, shortened courses, par 3 and pitch & putt courses. Furthermore, when referring to golf courses, we refer to courses that are affiliated with their respective golf associations. Throughout the report, a stable market is defined as one which experienced a change in its total number of registered golfers between -1% and +1% year-on-year from 2014 to 2015.
Starting in 2016, our data predominantly comes from local golf associations, whereas data collected prior to 2014 was collected from the European Golf Association. From our independent data gathering, we noted a change of approximately -107,000 golfers (-3%) and nearly +220 golf courses (+3%) between 2013 and 2014. Comparisons made with years prior to 2013 were made on a case-by-case basis with the support of statistics from local golf associations. Moreover, we have now expanded our data collection to include golf markets such as: Russia, Serbia, Ukraine, Armenia and Georgia (full list on page 15).
Gary Player Design: Mazagan Beach Resort, Hole 15, Haouzia – El Jadida, Morocco
Golf Participation Report for Europe 2016 5
© 2016 KPMG Advisory Ltd., a Hungarian limited liability company and a member firm of the KPMG network of independent member firms affiliated with KPMG International Cooperative (“KPMG International”), a Swiss entity. All rights reserved.

Golf Participation Report for Europe 20166
Europe’s leading golf markets in 2015In Europe, there are over 4.1 million registered golfers and nearly 7,000 standard length golf courses. The bulk of Europe’s supply and demand is situated in the most established golf markets, as demonstrated in the charts to the right. The top 10 markets host 85% of all registered golfers and 82% of all golf courses. England has the highest number of golfers and courses in Europe, accounting for 16% and 28% of European golf demand and supply respectively. Then follows Germany, which is home to 15% of all registered golfers, and 10% of all courses across Europe.
Registered golfers: Top 10 distribution by country in Europe, 2015
Golf courses: Top 10 distribution by country in Europe, 2015
England*
Germany
Sweden
France
Netherlands
Spain
Scotland
Ireland
Denmark
Finland
Other
England
Germany
France
Scotland
Sweden
Spain
Ireland
Netherlands
Italy
Denmark
Other
%
%
16
28
15
10
11
9
10
9
9
6
7
5
5
6
5
3
4
3
3
3
15
18
Source: Local golf associations with KPMG elaboration*Please note that demand analysis in England does not include non-registered golfers.
Source: Local golf associations with KPMG elaboration
© 2016 KPMG Advisory Ltd., a Hungarian limited liability company and a member firm of the KPMG network of independent member firms affiliated with KPMG International Cooperative (“KPMG International”), a Swiss entity. All rights reserved.

Golf Participation Report for Europe 2016 7
Golf participation rate in the top 10 European markets relative to the number of registered golfers, 2015
The chart to the right shows the participation of registered golfers as a percentage of a country’s total population across the top 10 golf markets in Europe. The five highest participation rates in this category (Sweden, Ireland, Scotland, Denmark and Finland) belong to countries with populations under 10 million and these represent 28% of the European golf market.
700,000
600,000
500,000
400,000
300,000
200,000
100,000
0
5.04.54.03.53.02.52.01.51.00.50
Swed
en
Irel
and
Sco
tland
Den
mar
k
Finl
and
Net
herla
nds
Eng
land
Ger
man
y
Fran
ce
Spa
in
%
Reg
iste
red
golfe
rs Participation rate
Number of registered golfers Participation rate
Source: Local golf associations with KPMG elaboration
Gary Player Design: Blair Atholl, Hole 6 – Johannesburg, Gauteng, South Africa
© 2016 KPMG Advisory Ltd., a Hungarian limited liability company and a member firm of the KPMG network of independent member firms affiliated with KPMG International Cooperative (“KPMG International”), a Swiss entity. All rights reserved.

Golf Participation Report for Europe 20168
Golf supply and demand trends in Europe Europe’s golf market experienced steady growth in demand and supply for 25 years until its peak, which occurred in 2009 during the global economic crisis. Prior to this, the average annual growth in the number of registered golfers was approximately 5% year-on-year, whereas supply grew by an annual average of 3% year-on-year.
Between 2009 and 2013, golf participation fell by 4%, whereas between 2014 and 2015 the trend stabilized to a very slight fall of -0.3%.
SupplyIn 2015 our research of the supply of golf courses across Europe identified an increase of 16 facilities, up 0.2% on 2014. Just as with today’s demand figures, these supply-side statistics suggest the start of stabilization in the European market. It should be noted that fluctuations in this supply figure are probably due to the number of affiliated golf courses opening, closing, or disaffiliating with their local golf associations.
In terms of supply, England currently remains the largest golf market, although in 2015, the English Golf Union reported a decrease of 6 courses. The Confederation of Golf in Ireland reported a decrease of 5 courses since 2014.
The leading growth markets in terms of supply are the Netherlands (+8), Slovakia (+4) and Latvia (+4). Scotland is currently stable in terms of registered golfers and supply, actually seeing the fewest golfers per golf course whilst still being in the top 10.
Development of golf in Europe, 1985 – 2015
5,0004,5004,0003,5003,0002,5002,0001,5001,000
5000
8,000
7,000
6,000
5,000
4,000
3,000
2,000
1,000
0
1984
1985
1986
1987
1988
1989
1990
1991
1992
1993
1994
1995
1996
1997
1998
1999
2000
2001
2002
2003
2004
2005
2006
2007
2008
2009
2010
2011
2012
2013
2014
2015
Reg
iste
red
golfe
rs, 0
00C
ourses
Number of registered golfers Golf courses
Sources: European Golf Association and local golf associations with KPMG elaborationNote: Please note that between 1985 – 2013, data was sourced from the European Golf Association. For the years 2014 and 2015,
local golf associations reported directly to KPMG. Please see our methodology on page 5 to learn more about the changed approach to data sourcing.
© 2016 KPMG Advisory Ltd., a Hungarian limited liability company and a member firm of the KPMG network of independent member firms affiliated with KPMG International Cooperative (“KPMG International”), a Swiss entity. All rights reserved.

Golf Participation Report for Europe 2016 9
Type of change in participation rates of registered golfers in Europe, 2015 (see methodology)
Countries with growth Countries with stability Countries with decline
30% 33%37%
Source: Local golf associations with KPMG elaboration
DemandAccording to our survey, Europe’s golf markets displayed positive signs of stability and growth in 2015. Approximately 30% of the European market experienced growth in their participation rates from the previous year. The other 37% of the market remained stable. When taking a closer look at Europe’s golf markets, as seen in the figure above, 67% of local golf associations indicated in 2015 that their level of participation had either stabilized or increased. The remaining 33% of European markets experienced some decline.
England and Ireland reported a decline of 2% and 3% in registered golfers, respectively. By contrast, golf participation in Sweden grew by nearly 5%.
According to the English Golf Union, golf in England contributes GBP 3 billion to the UK economy per year. For the first time in 10 years, as
their decline is beginning to stabilize, the Union has identified over 15 English counties which have recently experienced growth in registered golfers, especially amongst women and juniors. Furthermore, the English Golf Union, based on their weekly participation surveys, noticed an increase in the number of casual golfers for the first time in 6 years.
Based on information shared by local golf associations, golf membership continues to become less attractive to non-competitive golfers. Currently, golfers in Great Britain, Ireland and France, among other notable markets, feel no need to be registered to play and can continue to play golf as casual golfers on a greenfee basis. The Golf Union of Wales estimates that there are approximately twice the number of unregistered golfers as there are registered.
Based on our survey, declines in golf participation were not widely associated with the economic crisis in and after 2008, but they were often attributed to the actual technical difficulty of the game – an issue many local golf associations have already recognized.
Various local golf associations note declines in registered golfers within specific groups, for example golfers with handicaps above 32 and those who have been playing for less than 5 years. This group of newcomers, as described by local golf associations, tends to have reduced available time to practice and experiences greater difficulties when playing, causing them to be more likely to quit the sport.
Photo by: Aidan Bradley Murcar Links Golf Club, Hole 5 – Aberdeen, Scotland
Golf Participation Report for Europe 2016 9
© 2016 KPMG Advisory Ltd., a Hungarian limited liability company and a member firm of the KPMG network of independent member firms affiliated with KPMG International Cooperative (“KPMG International”), a Swiss entity. All rights reserved.

Golf Participation Report for Europe 201610
Market supply and demand:Golfers per golf course, 2015
The Netherlands and Sweden are the only European countries which have more than 1,000 golfers per golf course respectively; close behindare Switzerland and Finland with933 and 918 golfers per golf courserespectively. Wales and Iceland are the only mature markets in the ranking in terms of population per golf course to have a unique golf course available to fewer than 300 golfers.
*Liechtenstein, with a participation rate of 1.9%, was not included in this ranking as there is no golf course there.
Sources: Local golf associations, European Golf Association and Economist Intelligence Unit with KPMG elaboration
� More than 900golfers percourse
� Between 600and 900 golfersper course
� Between 300and 600 golfersper course
� Less than 300golfers percourse
� No golf courseor available data
� Mature ≥ 5%� Developed 1% – 5%� Growing 0.2% – 1%� Infant ≤ 0.2%� No golf course or
available data
Market demand:Participation rate, 2015
The highest golf participation rates in 2015 were, in order*: Iceland, Sweden, Ireland, Scotland, Denmark, Finland, the Netherlands, Norway, Wales and England.
Iceland, with a participation rate of 5%, is the only country with a mature marketstatus in this category. Although Germany is the second largest golf market in Europe (both in terms of number of golfers and courses), its golf participation rate is the third lowest in the top 10 European golf markets at 0.8%. The Czech Republic, Estonia, Slovakia and Slovenia are the only Central & Eastern European countries that are seeing participation rate growth.
� Mature �≤ 25,000� Developed 25,000 – 100,000� Growing 100,000 – 300,000� Infant �≥ 300,000 people� No golf course or
available data
Market supply:Population per golf course, 2015
The population per golf course figures provide an understanding of a golf course's potential latent demand. Mature golf markets tend to have fewer than 25,000 people per golf course. However, England, with the most golf courses in Europe, narrowly misses this category by just 3,000 people. Iceland and Scotland are the only European markets which have fewer than 10,000 people per golf course respectively.
Golf Participation Report for Europe 201610
© 2016 KPMG Advisory Ltd., a Hungarian limited liability company and a member firm of the KPMG network of independent member firms affiliated with KPMG International Cooperative (“KPMG International”), a Swiss entity. All rights reserved.

Golf Participation Report for Europe 2016 11
In 2015 adult male golfers accounted for approximately two-thirds (66%) of all registered golfers across Europe. Adult female and junior golfers accounted for 25% and 9%, respectively. England and Scotland are the only top 10-ranked markets whose shares f adult males golfers is over 70%. Compared to the classical golf markets in the UK, Ireland boasts the largest proportion of adult female and junior golfers (see figures at left).
Composition of golfers across Europe, in 2015
AlbaniaGeorgiaWalesAndorraEnglandScotlandArmeniaPortugalCyprusPolandMaltaUkraineLithuaniaLatviaNorwayMoldovaIrelandItalyBulgariaDenmarkAverageBelarusCroatia
HungarySwedenNetherlandsSpainFinlandEstoniaRussiaCzech RepublicIcelandBelgiumSwitzerlandLuxembourgGermanySloveniaAustriaLiechtensteinSerbiaGreeceMacedoniaSlovakiaAzerbajianTurkey 39
495255555556565758595959606161626263646465
65666666666868687070727273747576777880808080
94
1718
34101315
39353535
283331
2528
1930
2725
3226
20
25252529
1923
1918
222317
825
18161617
131416
1220
3
4433
14353230
5987
138
101511
208
1112
410
15
10995
159
1314
87
1120
28986
964
8
3
0%
20 40 60 80 100
65 25 10France
Adult male Adult female JuniorsSources: Local golf associations and European Golf Association with KPMG elaboration
© 2016 KPMG Advisory Ltd., a Hungarian limited liability company and a member firm of the KPMG network of independent member firms affiliated with KPMG International Cooperative (“KPMG International”), a Swiss entity. All rights reserved.

Golf Participation Report for Europe 201612
Austria, Slovenia, Germany, Slovakia and Switzerland are the leading countries in terms of adult female participation, with one-third or more of all golfers in these countries being women.
Top five markets in terms of proportion of adult female golfers (compared to all golfers in the country), 2015
Top five markets in terms of total number of adult femalegolfers, 2015
Top five markets in terms of the proportion of junior golfers (compared to all golfers in the country), 2015
Top five markets in terms of total number of junior golfers, 2015
Germany has nearly twice the number of adult female golfers as the Netherlands. However, within this top five category, Sweden has the highest number of adult female golfers relative to its population (population 9.8 million).
Austria
3334
353535
SloveniaGermanySlovakiaSwitzerland
0 10 20 30 40%
Turkey
1515
2037
44GreeceRussiaIcelandHungary
0 10 20 30 40%
50
GermanyNetherlandsSwedenFranceEngland 94,554
102,496117,886121,598
222,242
0 50,000 100,000 150,000 200,000 250,000
France
GermanySweden
40,596EnglandSpain 34,730
44,56345,398
41,233
0 50,000 75,00025,000
Source: Local golf associations with KPMG elaborationNote: We considered countries with at least 1,000 registered golfers.
Source: Local golf associations with KPMG elaboration
Source: Local golf associations with KPMG elaboration
Source: Local golf associations with KPMG elaborationNote: We considered countries with at least 1,000 registered golfers.
As in previous years, golf’s emerging markets still have the highest proportion of junior golfers.
Spain, Europe’s sixth largest golf market, is also Europe’s fifth largest junior golf market, surpassing the Netherlands by nearly 20,000 junior golfers.
Golf Participation Report for Europe 201612
© 2016 KPMG Advisory Ltd., a Hungarian limited liability company and a member firm of the KPMG network of independent member firms affiliated with KPMG International Cooperative (“KPMG International”), a Swiss entity. All rights reserved.

Golf Participation Report for Europe 2016 13
Growth initiatives for European golfBased on our survey results collected from local golf associations throughout Europe, we offer the following overview of how these associations are identifying and pursuing initiatives to boost golf in Europe.
Countries in Northern Europe have expressed positive changes in their numbers following a difficult year in 2014. Sweden and Finland both registered a better year in 2015, which can be atttributed in part to the targeting of higher handicap players and beginner groups. The Finnish Golf Union has developed a customer experience survey tool called “Players First”, which forwards instant feedback from players to operators in order to assist golf courses in adapting to client needs. In Norway, to address the trend of higher handicap players leaving the sport, the Norwegian Golf Federation has taken steps to encourage this group in order to retain their interest in the sport. Subsequently, the Federation is observing no loss in membership amongst those golfers whose handicaps have dropped below 26.
A number of countries, including France, are encouraging golf clubs to adjust and adapt their courses to the needs of modern golfers. For example, one initiative was to add additional tee markers for beginners and seniors to inspire easier and quicker play. Additionally, in France, as the Ryder Cup 2018 is fast approaching, the country is developing shorter courses (9 holes or fewer) to accommodate the growing demand for faster-paced golf. And in the spring of 2016, the English Golf Union
launched their own campaign, “Golf Express”, to encourage quick rounds of golf and competitions on courses of 9 holes or fewer.
In Ireland, the recently formed Confederation of Golf in Ireland has united the Irish Ladies Golf Union, the Golf Union of Ireland and the PGA, to form one governing body. Their mission includes, among other initiatives, improving the coordination of golf development and membership growth, and also to continue developing the “Women in Golf Programme”.
In 2014 the European Golf Course Owners Association (EGCOA) set out to better understand social trends affecting and influencing European golf and, as an upshot, developed a collaborative project called “Vision 20/20”. The project aims to develop new ideas for encouraging and retaining golfers, based on a study of the needs of players in the sport, focusing particularly on the “four F’s” – Flexibility, Fun, Friendship and Family.
A number of golf facilities appear to be taking such factors into consideration, currently championing Vision 20/20 by prioritizing and investing in the soft factors and social experiences which contribute to the effective retention and motivation of golfers. One recent successful initiative has been for golf professionals to promote group lessons over individual lessons as a means of encouraging social connections and a sense of belonging to the sport. According to the EGCOA, in the past, the main methods for attracting golfers were the promotion
of golf facilities and simplification of registration practices. Today, the focus is more on a sustainable model of building and retaining lasting connections between people and the sport.
With the introduction of golf at the 2016 Summer Olympic Games in Rio de Janeiro, the importance of junior development is now a buzz topic across European golf. Most (if not all) local golf associations have expressed that they are either at the starting or consolidation phases of revised junior development programs. In terms of junior competition, in 2016, Wales is aiming to provide juniors with appropriate competitive opportunities by introducing a junior golf tour. Other nations may well follow.
In Central & Eastern Europe, a popular way to help juniors to develop was the introduction of th Starting New at Golf (“SNAG”) program into school curricula whereby golf is taught at various levels. For example, the Czech Republic, Lithuania, and Serbia have all introduced this program into school to schools and now offer physical education teachers golf lessons to enable them to better instruct their pupils.
© 2016 KPMG Advisory Ltd., a Hungarian limited liability company and a member firm of the KPMG network of independent member firms affiliated with KPMG International Cooperative (“KPMG International”), a Swiss entity. All rights reserved.

Golf Participation Report for Europe 201614
As we have identified a good level of stability and growth in Europe, it is important to reflect upon the commendable golf development initiatives disclosed in our survey.
Limited personal free-time and the nature of the game, competing activities, and the sense of exclusivity in the sport can make it difficult to entice newcomers to register as members. Golf is in good hands with the hard work of both local golf associations and the sport’s stakeholders, who are showing a genuine interest in the growth of the game and building communities in the sport. Hopefully, what we have observed in some markets is a continuance of meaningful development in the sport as well as a boost to its reputation as a positive contributor, not least to the financial stability of clubs too.
Top four most common growth initiatives for 2016
Greater incentives for higher handicap players
Golf course adaptations
Improving the social experience
Junior development programs
Gary Player Design: The Cliffs at Mountain Park, Hole 7, Traveler’s Rest – South Carolina, USA
© 2016 KPMG Advisory Ltd., a Hungarian limited liability company and a member firm of the KPMG network of independent member firms affiliated with KPMG International Cooperative (“KPMG International”), a Swiss entity. All rights reserved.
Golf Participation Report for Europe 2016 15
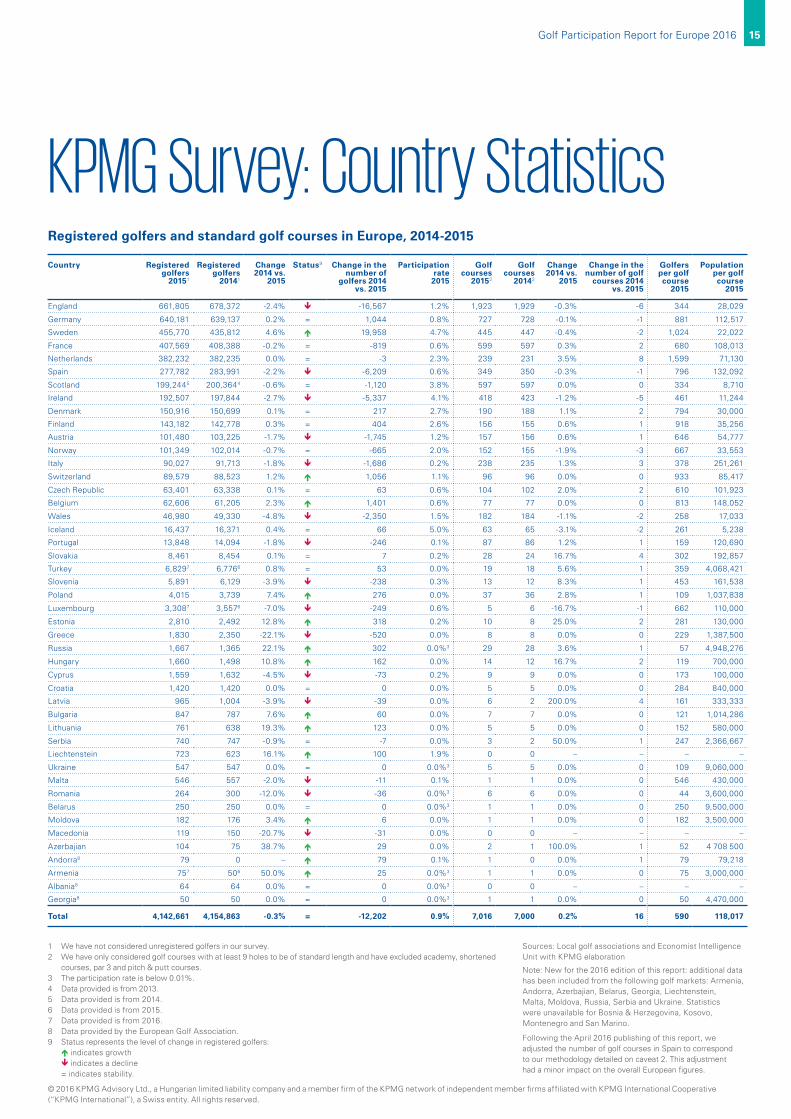
KPMG Survey: Country StatisticsRegistered golfers and standard golf courses in Europe, 2014-2015
Country Registered golfers
20151
Registered golfers
20141
Change 2014 vs.
2015
Status9 Change in the number of
golfers 2014 vs. 2015
Participation rate
2015
Golf courses
20152
Golf courses
20142
Change 2014 vs.
2015
Change in the number of golf
courses 2014 vs. 2015
Golfers per golf course
2015
Population per golf course
2015
England 661,805 678,372 -2.4% -16,567 1.2% 1,923 1,929 -0.3% -6 344 28,029
Germany 640,181 639,137 0.2% = 1,044 0.8% 727 728 -0.1% -1 881 112,517
Sweden 455,770 435,812 4.6% 19,958 4.7% 445 447 -0.4% -2 1,024 22,022
France 407,569 408,388 -0.2% = -819 0.6% 599 597 0.3% 2 680 108,013
Netherlands 382,232 382,235 0.0% = -3 2.3% 239 231 3.5% 8 1,599 71,130
Spain 277,782 283,991 -2.2% -6,209 0.6% 349 350 -0.3% -1 796 132,092
Scotland 199,2445 200,3644 -0.6% = -1,120 3.8% 597 597 0.0% 0 334 8,710
Ireland 192,507 197,844 -2.7% -5,337 4.1% 418 423 -1.2% -5 461 11,244
Denmark 150,916 150,699 0.1% = 217 2.7% 190 188 1.1% 2 794 30,000
Finland 143,182 142,778 0.3% = 404 2.6% 156 155 0.6% 1 918 35,256
Austria 101,480 103,225 -1.7% -1,745 1.2% 157 156 0.6% 1 646 54,777
Norway 101,349 102,014 -0.7% = -665 2.0% 152 155 -1.9% -3 667 33,553
Italy 90,027 91,713 -1.8% -1,686 0.2% 238 235 1.3% 3 378 251,261
Switzerland 89,579 88,523 1.2% 1,056 1.1% 96 96 0.0% 0 933 85,417
Czech Republic 63,401 63,338 0.1% = 63 0.6% 104 102 2.0% 2 610 101,923
Belgium 62,606 61,205 2.3% 1,401 0.6% 77 77 0.0% 0 813 148,052
Wales 46,980 49,330 -4.8% -2,350 1.5% 182 184 -1.1% -2 258 17,033
Iceland 16,437 16,371 0.4% = 66 5.0% 63 65 -3.1% -2 261 5,238
Portugal 13,848 14,094 -1.8% -246 0.1% 87 86 1.2% 1 159 120,690
Slovakia 8,461 8,454 0.1% = 7 0.2% 28 24 16.7% 4 302 192,857
Turkey 6,8297 6,7766 0.8% = 53 0.0% 19 18 5.6% 1 359 4,068,421
Slovenia 5,891 6,129 -3.9% -238 0.3% 13 12 8.3% 1 453 161,538
Poland 4,015 3,739 7.4% 276 0.0% 37 36 2.8% 1 109 1,037,838
Luxembourg 3,3087 3,5576 -7.0% -249 0.6% 5 6 -16.7% -1 662 110,000
Estonia 2,810 2,492 12.8% 318 0.2% 10 8 25.0% 2 281 130,000
Greece 1,830 2,350 -22.1% -520 0.0% 8 8 0.0% 0 229 1,387,500
Russia 1,667 1,365 22.1% 302 0.0%3 29 28 3.6% 1 57 4,948,276
Hungary 1,660 1,498 10.8% 162 0.0% 14 12 16.7% 2 119 700,000
Cyprus 1,559 1,632 -4.5% -73 0.2% 9 9 0.0% 0 173 100,000
Croatia 1,420 1,420 0.0% = 0 0.0% 5 5 0.0% 0 284 840,000
Latvia 965 1,004 -3.9% -39 0.0% 6 2 200.0% 4 161 333,333
Bulgaria 847 787 7.6% 60 0.0% 7 7 0.0% 0 121 1,014,286
Lithuania 761 638 19.3% 123 0.0% 5 5 0.0% 0 152 580,000
Serbia 740 747 -0.9% = -7 0.0% 3 2 50.0% 1 247 2,366,667
Liechtenstein 723 623 16.1% 100 1.9% 0 0 – – – –
Ukraine 547 547 0.0% = 0 0.0%3 5 5 0.0% 0 109 9,060,000
Malta 546 557 -2.0% -11 0.1% 1 1 0.0% 0 546 430,000
Romania 264 300 -12.0% -36 0.0%3 6 6 0.0% 0 44 3,600,000
Belarus 250 250 0.0% = 0 0.0%3 1 1 0.0% 0 250 9,500,000
Moldova 182 176 3.4% 6 0.0% 1 1 0.0% 0 182 3,500,000
Macedonia 119 150 -20.7% -31 0.0% 0 0 – – – –
Azerbajian 104 75 38.7% 29 0.0% 2 1 100.0% 1 52 4 708 500
Andorra8 79 0 – 79 0.1% 1 0 0.0% 1 79 79,218
Armenia 757 506 50.0% 25 0.0%3 1 1 0.0% 0 75 3,000,000
Albania8 64 64 0.0% = 0 0.0%3 0 0 – – – –
Georgia8 50 50 0.0% = 0 0.0%3 1 1 0.0% 0 50 4,470,000
Total 4,142,661 4,154,863 -0.3% = -12,202 0.9% 7,016 7,000 0.2% 16 590 118,017
1 We have not considered unregistered golfers in our survey.2 We have only considered golf courses with at least 9 holes to be of standard length and have excluded academy, shortened
courses, par 3 and pitch & putt courses.3 The participation rate is below 0.01%.4 Data provided is from 2013.5 Data provided is from 2014.6 Data provided is from 2015.7 Data provided is from 2016.8 Data provided by the European Golf Association.9 Status represents the level of change in registered golfers: indicates growth indicates a decline = indicates stability.
Sources: Local golf associations and Economist Intelligence Unit with KPMG elaboration
Note: New for the 2016 edition of this report: additional data has been included from the following golf markets: Armenia, Andorra, Azerbajian, Belarus, Georgia, Liechtenstein, Malta, Moldova, Russia, Serbia and Ukraine. Statistics were unavailable for Bosnia & Herzegovina, Kosovo, Montenegro and San Marino.
Following the April 2016 publishing of this report, we adjusted the number of golf courses in Spain to correspond to our methodology detailed on caveat 2. This adjustment had a minor impact on the overall European figures.
© 2016 KPMG Advisory Ltd., a Hungarian limited liability company and a member firm of the KPMG network of independent member firms affiliated with KPMG International Cooperative (“KPMG International”), a Swiss entity. All rights reserved.

Golf Participation Report for Europe 201616
KPMG Golf Advisory Practice in EMEAWho we are?
KPMG’s Golf Advisory Practice has in-depth know-how and experience of the business side of the golf industry.
Our experience across the golf resort industry is diverse and includes services to both existing and developing integrated golf resorts. We have a clear understanding of the impact that a golf course can bring to a resort or a residential community development.
Helping to maximize developers’ returns through the integration of golf, real estate and hospitality functions is one of our primary areas of focus.
In addition to the wide range of professional services we offer, our Practice is also involved in several other golf-related initiatives. We are the founder of the annual Golf Business Forum, the foremost golf industry conference in Europe, Middle East and Africa (EMEA). Moreover, we regularly produce high profile thought leadership content for the industry, including the Golf Benchmark Survey, one of the largest golf research projects in the world. As a result, we have accrued invaluable comparable data and information from the sector. The beneficiaries of such deep industry knowledge are our clients.
What can we do for you?
KPMG Golf Advisory Practice involvement in the golf and golf tourism industry sector includes the following services:
– Market and financial feasibility study – assessing project sites, locations and markets in order to provide comprehensive financial analysis to assess potential investment returns.
– Project conceptualization and investment planning – developing realistic and implementable conceptswith short, medium and long-term investment planning.
– Business plan – advising on the strategic direction for the realisation and delivery of project concepts from staffing to marketing and sales.
– Project management – managing and coordinating the project from inception through planning, up until the start of construction.
– Valuation service – preparing asset and business valuations.
– Transaction service – assisting in the sale of greenfield projects that are in the development phase as well as existing golf courses and resorts through the preparation of investment memoranda and the selection of potential buyers.
– Operational review – assessing existing facilities and market in order to provide strategies for profit enhancement.
– Supplier selection – assisting with the identification and selection of golf management companies, golf course architects and master planners.
– Other advisory services – economic impact assessment of large events and developments, strategic advisory to government bodies and regulators.
© 2016 KPMG Advisory Ltd., a Hungarian limited liability company and a member firm of the KPMG network of independent member firms affiliated with KPMG International Cooperative (“KPMG International”), a Swiss entity. All rights reserved.

Golf Participation Report for Europe 2016 17
Photo by: Aidan Bradley Old Head Golf Links, Hole 4 – Kinsale, Co. Cork, Ireland

The information contained herein is of a general nature and is not intended to address the circumstances of any particular individual or entity. Although we endeavour to provide accurate and timely information, there can be no guarantee that such information is accurate as of the date it is received or that it will continue to be accurate in the future. No one should act on such information without appropriate professional advice after a thorough examination of the particular situation.
The KPMG name and logo are registered trademarks or trademarks of KPMG International.
© 2016 KPMG Advisory Ltd., a Hungarian limited liability company and a member firm of the KPMG network of independent member firms affiliated with KPMG International Cooperative (“KPMG International”), a Swiss entity. All rights reserved.
Contact us
For further information about KPMG services, please contact:
KPMG Golf Advisory Practice in EMEA
Váci út 31. 1134. Budapest Hungary
Please note that all Golf Benchmark reports can be downloaded free of charge at golfbenchmark.com
Photos in this report were provided by Gary Player Design and Aidan Bradley
Cover Photo: Gary Player Design: Thracian Cliffs, Hole 8, Cape Kaliakra, Bulgaria
We are also grateful to all the contributors, including those mentioned in the body of this report.