
Goldman Sachs US Financial Services Conference 2013...
20
Goldman Sachs US Financial Services Conference 2013 IntercontinentalExchange (ICE) December 10, 2013
Transcript of Goldman Sachs US Financial Services Conference 2013...

Goldman Sachs
US Financial Services Conference 2013
IntercontinentalExchange (ICE) December 10, 2013

CAUTIONARY STATEMENT REGARDING FORWARD LOOKING STATEMENTS
This presentation contains “forward-looking statements” made pursuant to the safe harbor provisions of the Private Securities Litigation Reform Act of 1995. Statements regarding our
business that are not historical facts are forward-looking statements that involve risks, uncertainties and assumptions that are difficult to predict. These statements are not guarantees of future
performance and actual outcomes and results may differ materially from what is expressed or implied in any forward-looking statement. The factors that might affect our performance include,
but are not limited to: our business environment and industry trends; conditions in global financial markets; domestic and international economic conditions; volatility in commodity prices and
price volatility of financial contracts such as equity indexes and foreign exchange; our ability to realize the anticipated benefits of the NYSE Euronext acquisition within the expected time
frame, and successfully integrate NYSE Euronext‟s operations; our ability to separate Euronext and Liffe and spin off Euronext; changes in laws and regulations; increasing competition and
consolidation in our industry; our ability to identify and effectively pursue acquisitions and strategic alliances and successfully integrate the companies we acquire on a cost-effective basis; the
success of our clearing houses and our ability to minimize the risks associated with operating multiple clearing houses in multiple jurisdictions; our ability to comply with regulatory
requirements; the performance and reliability of our technology and third party service providers; technological developments, including ensuring that the technology we utilize is not
vulnerable to security risks; the accuracy of our cost estimates and expectations; our belief that cash flows will be sufficient to service our debt and fund our working capital needs and capital
expenditures for the foreseeable future; our ability to refinance our debt as planned; our ability to develop new products and services on a timely and cost-effective basis; leveraging our risk
management capabilities; maintaining existing market participants and attracting new ones; protecting our intellectual property rights; not violating the intellectual property rights of others;
potential adverse litigation results; our belief in our electronic platform and disaster recovery system technologies; and identification of trends and how they will impact our business. For a
discussion of such risks and uncertainties, which could cause actual results to differ from those contained in the forward-looking statements, see ICE‟s Securities and Exchange Commission
(SEC) filings, including, but not limited to, the risk factors in ICE‟s most recent Annual Report on Form 10-K for the year ended December 31, 2012, as filed with the SEC on February 6, 2013,
and the risk factors in NYSE Euronext‟s SEC filings and the joint proxy statement/prospectus of IntercontinentalExchange Group, Inc., as filed with the SEC on April 30, 2013. These filings
are also available in the Investors & Media section of our website. Although we believe that the expectations reflected in the forward-looking statements are reasonable, we cannot guarantee
future results, levels of activity, performance or achievements. We caution you not to place undue reliance on these forward-looking statements. Any forward-looking statement speaks only as
of the date on which such statement is made, and we undertake no obligation to update any forward-looking statement or statements to reflect events or circumstances after the date on
which such statement is made or to reflect the occurrence of an unanticipated event. New factors emerge from time to time, and it is not possible for management to predict all factors that
may affect our business and prospects. Further, management cannot assess the impact of each factor on the business or the extent to which any factor, or combination of factors, may cause
actual results to differ materially from those contained in any forward-looking statements.
GAAP AND NON-GAAP RESULTS
This presentation includes non-GAAP measures that exclude certain items the company does not consider reflective of our core business performance. We believe that the presentation of
these measures provides investors with greater transparency and supplemental data relating to our financial condition and results of operations. These non-GAAP measures should be
considered in context with our combined GAAP results. The reconciliation of Adjusted Net Income Attributable to ICE/NYSE Euronext to the equivalent GAAP results appear in the appendix
to this presentation and our past SEC filings and information posted on our website, which include an explanation of why we deem these non-GAAP measures meaningful. This presentation
is available in the Investors & Media section of our website at www.theice.com.
Safe Harbor
2

IntercontinentalExchange Group ICE is the leading network of regulated exchanges and clearing houses for the
global financial and commodity markets.
3

Strategic Opportunities
Capitalize on
Clearing Leadership
Driving greater operational and capital efficiencies for market participants
Well-positioned to serve regulatory mandates to clear swaps in US and EU
Leading global CDS clearing houses
Addition of 6th clearing house in Asia; reflects regionalization due to reg reform
Build on Strength in
Listings, Equities &
Equity Options
Build on NYSE leadership in global listings, with focus on technology and international
Leverage globally recognized unique DMM market model
Support greater market stability and confidence with prudent trading policies
Extend technology capabilities of leading equity options business
Futures Market
Expansion
Grow franchise for financial and commodities futures markets in US, EU and Asia
Global energy leader – hosts >50% of the world‟s oil futures trading
Premier interest rates complex across US, Europe; new product opportunities
Strategically positioned to enable migration of OTC markets on-exchange
OTC Opportunities
Remain
Leader in enhancing market transparency and standardization
Seamless transition of ~800 energy swaps to futures in 2012
Additional OTC market opportunities across rates, FX and equities
Deliver solutions for financial reform across SEF, SDR, clearing and data
Ability to transform markets and drive risk management
4

Diversified Across Growth Markets
(1) Does not reflect any adjustment for estimated transaction-related non-cash write-down of deferred revenue
(2) Other revenues include: NYSE Regulation, Market Connectivity, Co-location, SFTI and other technology services and miscellaneous revenue
Exchange-traded
Derivatives 44%
Market Data 13%
Cash Trading 10%
CDS 4%
Pro Forma Net Revenue Diversification
3Q13 LTM Pro Forma Net Revenues: $3.7 BN (1)
Technology Services & Other
17%
3Q13 LTM
Net
Revenues
Post-Euronext & Transition of NYXT Businesses
CDS 5%
3Q13 LTM
Net
Revenues
Financials
13%
Market
Data 13%
3Q13 LTM Pro Forma Net Revenues: $3.1 BN (1)
Listings
12%
Equity
Derivatives
5%
Commodities
33%
Exchange-
traded
Derivatives
51%
Listings
13%
Cash
Trading
6%
Other (2)
13%
Current Business Mix
5

0
500
1,000
1,500
2,000
2,500
3,000
3,500
4,000
2007 2008 2009 2010 2011 2012 NovYTD2013Energy Agriculture Financials
3Q13 futures revenues of $231M, -2% y/y
3Q13 ADV of 3.1MM, -1% y/y
o Energy ADV -2% y/y
o Ag ADV +5% y/y
o Fin ADV -1% y/y
ADV strength in Brent, Other Oil, Sugar and FX
3Q13 Rate Per Contract (RPC)
Total OI 92MM contracts at 11/29/13
o OI excluding power at 11/29/13 was 35MM contracts
vs. 36MM at 12/31/12, -3% from year end
Nov ADV of 3.4MM, +5% y/y
o Energy ADV +7% y/y
o Ag ADV +5% y/y
o Fin ADV -15% y/y
ICE Futures
Annual Futures & Options ADV
Energy* Ag Financial
3Q13 3Q12 3Q13 3Q12 3Q13 3Q12
$1.07 $1.11 $2.49 $2.40 $1.01 $1.00
** Smaller sized power contracts made up 96% of total vol in 3Q13 and 93% in 3Q12
NOTE: Figures may not foot due to rounding
*Cleared OTC energy contracts transitioned to futures contracts on Oct 15, 2012 and all prior periods have been adjusted to reflect these contracts as futures
Highlights -%y/y
(In 000) 3Q13 3Q12 y/y %
Total Futures & Options Volume 195,864 194,797 1%
ADV
ICE Brent 676 646 5%
ICE Gasoil 258 261 -1%
ICE Other Oil 267 202 32%
ICE Natural Gas 970 1,258 -23%
ICE Power** 468 304 54%
ICE Emissions & Other 31 41 -24%
ICE Sugar 146 133 9%
ICE Equity Index 105 116 -10%
Other Futures & Options 141 131 8%
Total Average Daily Volume 3,061 3,092 -1%
6
0
40
80
120
160
200
0
400
800
1,200
1,600
2008 2009 2010 2011 2012 Sept YTD2013ICE ADV Volatility
-
100
200
300
400
500
600
700
2008 2009 2010 2011 2012 Nov YTD2013
0
200
400
600
800
1,000
1,200
2008 2009 2010 2011 2012 Nov YTD2013
Global Oil Complex
ICE Brent ICE Gasoil ICE Other Oil
+9% y/y
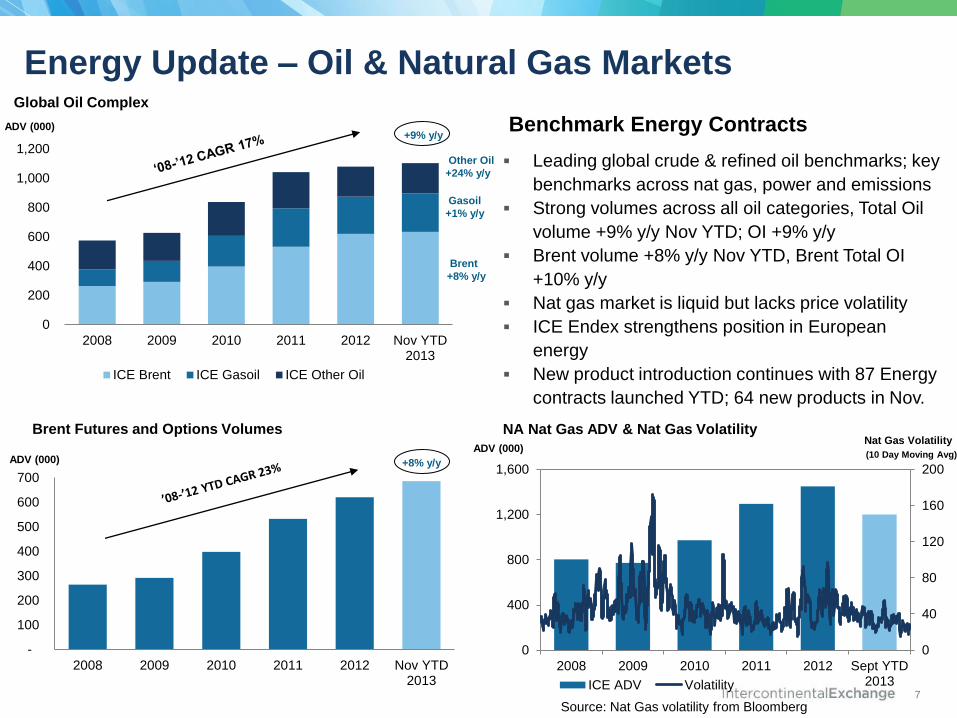
Energy Update – Oil & Natural Gas Markets
Benchmark Energy Contracts
Leading global crude & refined oil benchmarks; key
benchmarks across nat gas, power and emissions
Strong volumes across all oil categories, Total Oil
volume +9% y/y Nov YTD; OI +9% y/y
Brent volume +8% y/y Nov YTD, Brent Total OI
+10% y/y
Nat gas market is liquid but lacks price volatility
ICE Endex strengthens position in European
energy
New product introduction continues with 87 Energy
contracts launched YTD; 64 new products in Nov.
Other Oil
+24% y/y
Brent Futures and Options Volumes
ADV (000)
NA Nat Gas ADV & Nat Gas Volatility
ADV (000)
ADV (000)
Gasoil
+1% y/y
Brent
+8% y/y
Nat Gas Volatility (10 Day Moving Avg)
Source: Nat Gas volatility from Bloomberg
+8% y/y
7
0
50
100
150
200
250
2008 2009 2010 2011 2012 Nov YTD2013
-6% y/y
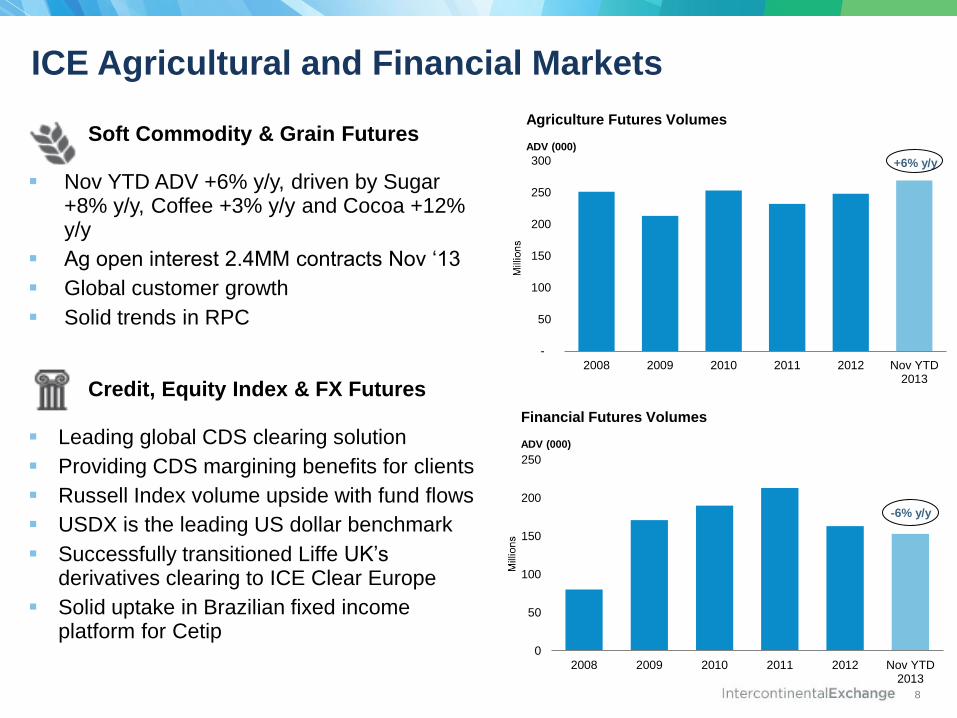
ICE Agricultural and Financial Markets
Soft Commodity & Grain Futures Nov YTD ADV +6% y/y, driven by Sugar
+8% y/y, Coffee +3% y/y and Cocoa +12% y/y
Ag open interest 2.4MM contracts Nov „13
Global customer growth
Solid trends in RPC
Credit, Equity Index & FX Futures Leading global CDS clearing solution
Providing CDS margining benefits for clients
Russell Index volume upside with fund flows
USDX is the leading US dollar benchmark
Successfully transitioned Liffe UK‟s derivatives clearing to ICE Clear Europe
Solid uptake in Brazilian fixed income platform for Cetip
-
50
100
150
200
250
300
2008 2009 2010 2011 2012 Nov YTD2013
+6% y/y
ADV (000)
Agriculture Futures Volumes
ADV (000)
Financial Futures Volumes
8

Credit Derivatives CDS Open Interest and Gross Notional Cleared 3Q13 CDS revenues of $38MM, +15 y/y
o $16MM from Creditex; -8% y/y, 58% electronic
o $22MM from CDS clearing, +40% y/y
Through Nov 29, $47T in CDS cleared, $1.5T OI;
over 400 clearable CDS instruments
o ICE Clear Credit leader in both dealer and buy-side
clearing with $3.6T cleared by clients to date, up
$2.1T from 6/30/13
Leading Global CDS Clearing Solution
o Most liquid CDS clearing platform across index,
single names and sovereign instruments
o ICE clears over 95% of the total cleared CDS
market
o EU client clearing successfully launched in Oct „13
o ICE Link connecting 800 clients – established
infrastructure for CDS workflow
o ICE Clear Credit providing clearing to all major SEFs
OI (Billions) Notional (Billions)
$31
$60 $67 $66
$60
2009 2010 2011
+26% y/y
CDS Clearing Revenue
2012 Sep YTD
2013
$
$5,000
$10,000
$15,000
$20,000
$25,000
$30,000
$35,000
$40,000
$45,000
$50,000
$
$200
$400
$600
$800
$1,000
$1,200
$1,400
$1,600
$1,800
1 31 61 91 121 151 181 211 241
Clearing Week Open Interest Gross Notional
9
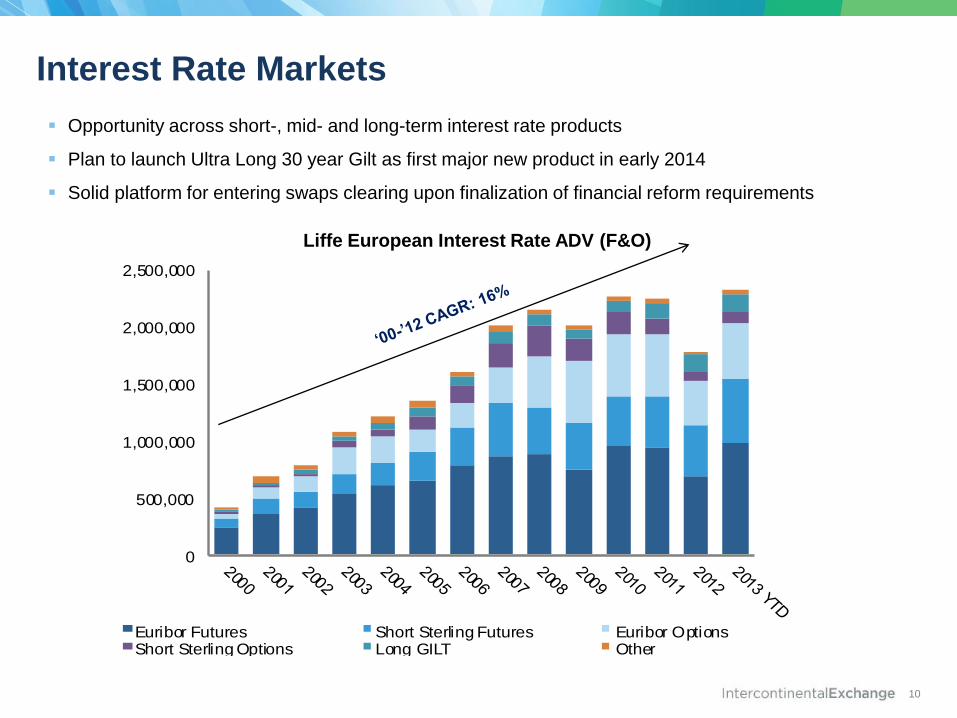
Interest Rate Markets
0
500,000
1,000,000
1,500,000
2,000,000
2,500,000
Euribor Futures Short Sterling Futures Euribor OptionsShort Sterling Options Long GILT Other
Opportunity across short-, mid- and long-term interest rate products
Plan to launch Ultra Long 30 year Gilt as first major new product in early 2014
Solid platform for entering swaps clearing upon finalization of financial reform requirements
Liffe European Interest Rate ADV (F&O)
10
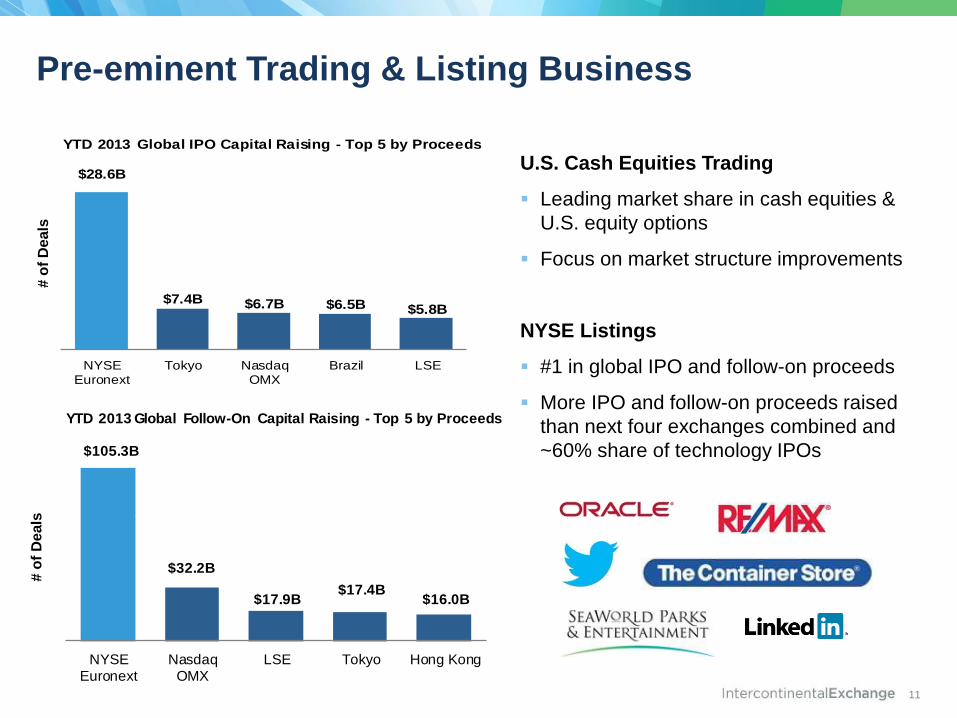
Pre-eminent Trading & Listing Business
$28.6B
$7.4B $6.7B $6.5B $5.8B
NYSEEuronext
Tokyo NasdaqOMX
Brazil LSE
YTD 2013 Global IPO Capital Raising - Top 5 by Proceeds
$105.3B
$32.2B
$17.9B $17.4B
$16.0B
NYSEEuronext
NasdaqOMX
LSE Tokyo Hong Kong
YTD 2013 Global Follow-On Capital Raising - Top 5 by Proceeds
# o
f D
eals
# o
f D
eals
72 20 51 6 33
U.S. Cash Equities Trading
Leading market share in cash equities &
U.S. equity options
Focus on market structure improvements
NYSE Listings
#1 in global IPO and follow-on proceeds
More IPO and follow-on proceeds raised
than next four exchanges combined and
~60% share of technology IPOs
11
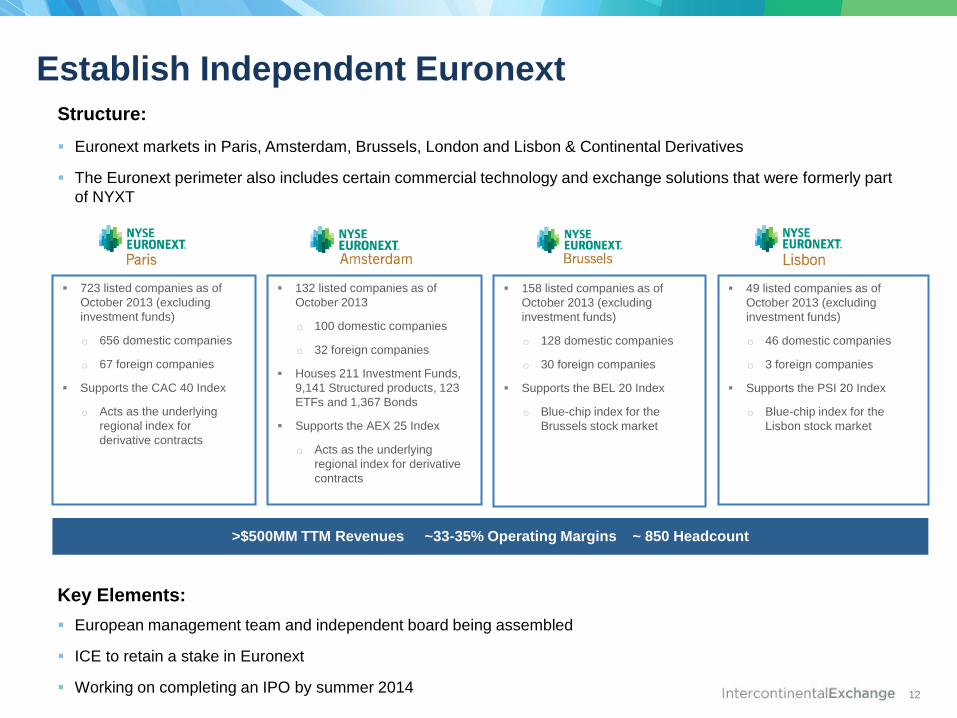
Establish Independent Euronext Structure:
Euronext markets in Paris, Amsterdam, Brussels, London and Lisbon & Continental Derivatives
The Euronext perimeter also includes certain commercial technology and exchange solutions that were formerly part
of NYXT
Key Elements:
European management team and independent board being assembled
ICE to retain a stake in Euronext
Working on completing an IPO by summer 2014
723 listed companies as of
October 2013 (excluding
investment funds)
o 656 domestic companies
o 67 foreign companies
Supports the CAC 40 Index
o Acts as the underlying
regional index for
derivative contracts
132 listed companies as of
October 2013
o 100 domestic companies
o 32 foreign companies
Houses 211 Investment Funds,
9,141 Structured products, 123
ETFs and 1,367 Bonds
Supports the AEX 25 Index
o Acts as the underlying
regional index for derivative
contracts
158 listed companies as of
October 2013 (excluding
investment funds)
o 128 domestic companies
o 30 foreign companies
Supports the BEL 20 Index
o Blue-chip index for the
Brussels stock market
49 listed companies as of
October 2013 (excluding
investment funds)
o 46 domestic companies
o 3 foreign companies
Supports the PSI 20 Index
o Blue-chip index for the
Lisbon stock market
>$500MM TTM Revenues ~33-35% Operating Margins ~ 850 Headcount
12

Optimize NYXT Portfolio
~$120MM Revenue¹ ~17% EBITDA margin ¹ ~ 600 Headcount
¹ 2014 Estimate; EBITDA margin is a non-GAAP measure and is calculated before corporate allocations.
Buy-side Platforms
NYFIX
Leading buy-side order and messaging delivery platform, 800 buy-side firms
11,000 order routing channels
Appia is the leading suite of FIX gateway technology products, deployed in over 1,000 firms in 35 countries
Metabit
Leading Japanese EMS and routing network for asset managers and hedge funds
Connectivity to 75 exchanges and 10 dark pools, 100+ individual clients, primarily Japanese firms
Market Data Software
Data Distribution
Over 200 low latency feed handlers normalizing raw exchange data
Full global coverage across asset classes including equities, derivatives, commodities and FX
SuperFeed product is a hosted, fully managed consolidated feed
SuperFeed aggregates data over 120 markets and delivered over the SFTI network
DART - market data entitlement and usage functionality
13
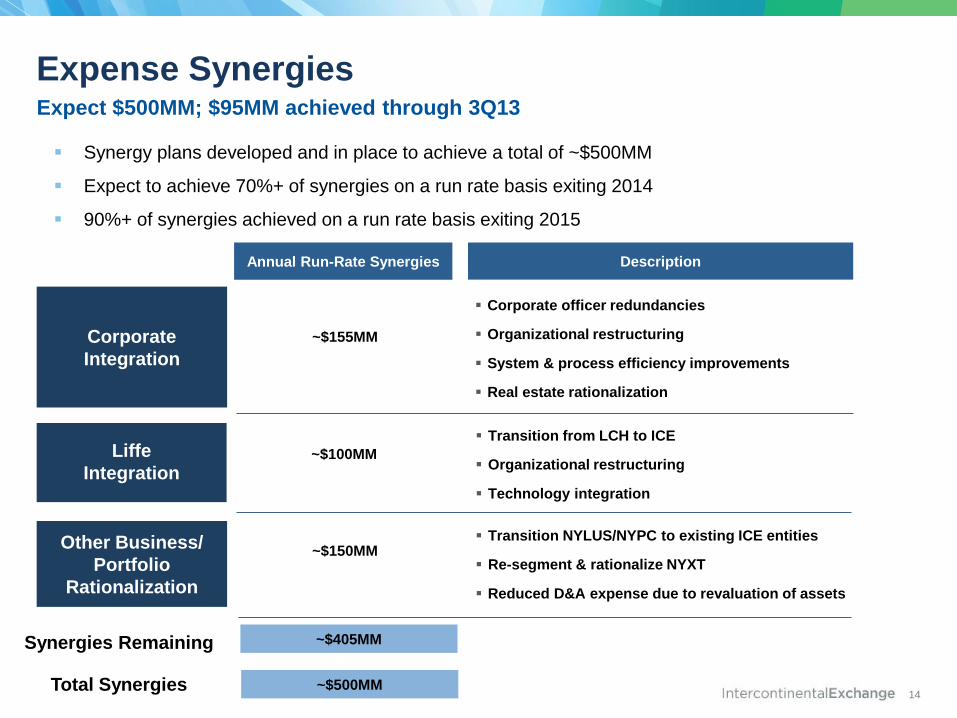
Expense Synergies Expect $500MM; $95MM achieved through 3Q13
Corporate
Integration
Liffe
Integration
Corporate officer redundancies
Organizational restructuring
System & process efficiency improvements
Real estate rationalization
Transition NYLUS/NYPC to existing ICE entities
Re-segment & rationalize NYXT
Reduced D&A expense due to revaluation of assets
Annual Run-Rate Synergies Description
~$155MM
~$100MM
~$405MM
Other Business/
Portfolio
Rationalization
Transition from LCH to ICE
Organizational restructuring
Technology integration
~$150MM
Synergy plans developed and in place to achieve a total of ~$500MM
Expect to achieve 70%+ of synergies on a run rate basis exiting 2014
90%+ of synergies achieved on a run rate basis exiting 2015
Total Synergies ~$500MM
Synergies Remaining
14
15
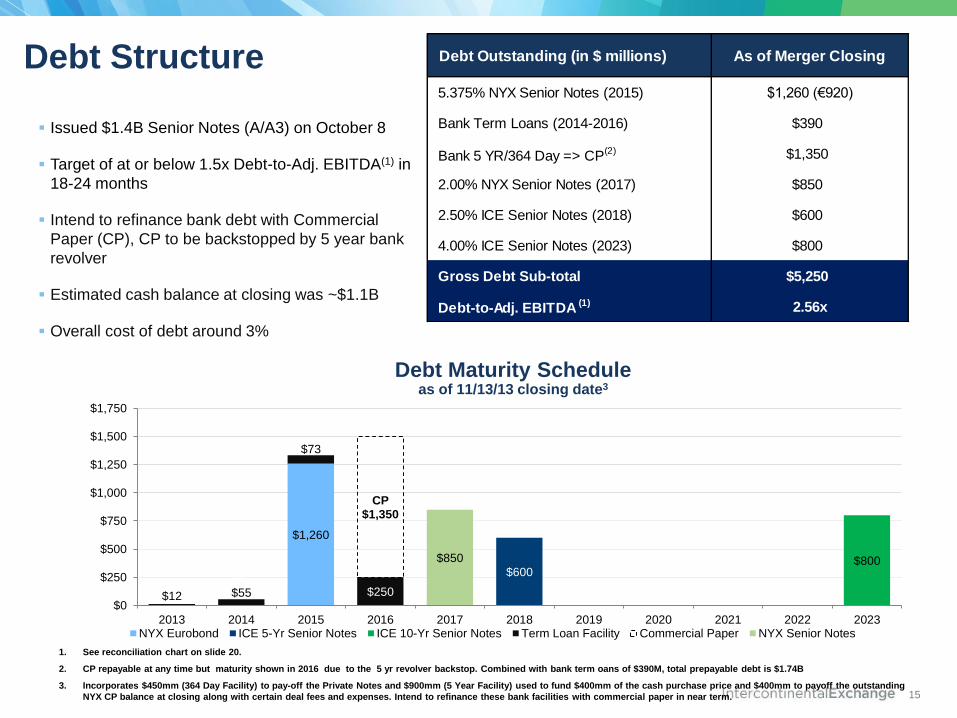
1. See reconciliation chart on slide 20.
2. CP repayable at any time but maturity shown in 2016 due to the 5 yr revolver backstop. Combined with bank term oans of $390M, total prepayable debt is $1.74B
3. Incorporates $450mm (364 Day Facility) to pay-off the Private Notes and $900mm (5 Year Facility) used to fund $400mm of the cash purchase price and $400mm to payoff the outstanding
NYX CP balance at closing along with certain deal fees and expenses. Intend to refinance these bank facilities with commercial paper in near term.
$1,260
$600 $800
$12 $55
$73
$250
CP $1,350
$850
$0
$250
$500
$750
$1,000
$1,250
$1,500
$1,750
2013 2014 2015 2016 2017 2018 2019 2020 2021 2022 2023NYX Eurobond ICE 5-Yr Senior Notes ICE 10-Yr Senior Notes Term Loan Facility Commercial Paper NYX Senior Notes
1.4
50
%
Debt Structure
Issued $1.4B Senior Notes (A/A3) on October 8
Target of at or below 1.5x Debt-to-Adj. EBITDA(1) in
18-24 months
Intend to refinance bank debt with Commercial
Paper (CP), CP to be backstopped by 5 year bank
revolver
Estimated cash balance at closing was ~$1.1B
Overall cost of debt around 3%
Debt Maturity Schedule as of 11/13/13 closing date3
Debt Outstanding (in $ millions) As of Merger Closing
5.375% NYX Senior Notes (2015) $1,260 (€920)
Bank Term Loans (2014-2016) $390
Bank 5 YR/364 Day => CP(2) $1,350
2.00% NYX Senior Notes (2017) $850
2.50% ICE Senior Notes (2018) $600
4.00% ICE Senior Notes (2023) $800
Gross Debt Sub-total $5,250
Debt-to-Adj. EBITDA (1) 2.56x
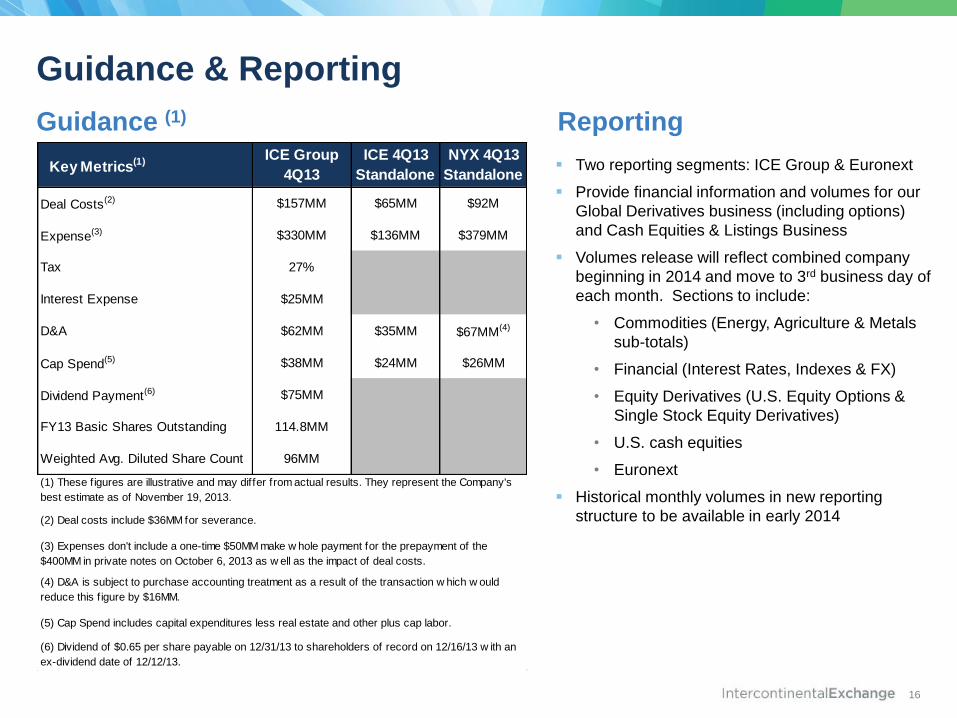
Guidance & Reporting
Two reporting segments: ICE Group & Euronext
Provide financial information and volumes for our
Global Derivatives business (including options)
and Cash Equities & Listings Business
Volumes release will reflect combined company
beginning in 2014 and move to 3rd business day of
each month. Sections to include:
• Commodities (Energy, Agriculture & Metals
sub-totals)
• Financial (Interest Rates, Indexes & FX)
• Equity Derivatives (U.S. Equity Options &
Single Stock Equity Derivatives)
• U.S. cash equities
• Euronext
Historical monthly volumes in new reporting
structure to be available in early 2014
Guidance (1) Reporting
16
Key Metrics(1) ICE Group
4Q13
ICE 4Q13
Standalone
NYX 4Q13
Standalone
Deal Costs(2) $157MM $65MM $92M
Expense(3) $330MM $136MM $379MM
Tax 27%
Interest Expense $25MM
D&A $62MM $35MM $67MM(4)
Cap Spend(5) $38MM $24MM $26MM
Dividend Payment(6) $75MM
FY13 Basic Shares Outstanding 114.8MM
Weighted Avg. Diluted Share Count 96MM
(6) Dividend of $0.65 per share payable on 12/31/13 to shareholders of record on 12/16/13 w ith an
ex-dividend date of 12/12/13.
(1) These figures are illustrative and may differ from actual results. They represent the Company's
best estimate as of November 19, 2013.
(4) D&A is subject to purchase accounting treatment as a result of the transaction w hich w ould
reduce this f igure by $16MM.
(5) Cap Spend includes capital expenditures less real estate and other plus cap labor.
(2) Deal costs include $36MM for severance.
(3) Expenses don't include a one-time $50MM make w hole payment for the prepayment of the
$400MM in private notes on October 6, 2013 as w ell as the impact of deal costs.

Key Milestones
11/13/13
Deal
Completion
Mid 2014
Euronext / Liffe;
Separation &
Euronext IPO
2014 2015
1H14
NYXT Optimization
& Liffe Integration
Continuing to invest for growth & to deliver ROIC above cost of capital
End of 2014
NYSE Liffe
Integration with
ICE Futures
2014: 20%+ Accretion
In 18-24 Months
Debt-to-EBITDA
< 1.5x
End of 2015
90%+ synergies
achieved on run
rate exiting 2015
End of 2014
70%+ synergies
achieved on run
rate exiting 2014
17

APPENDIX
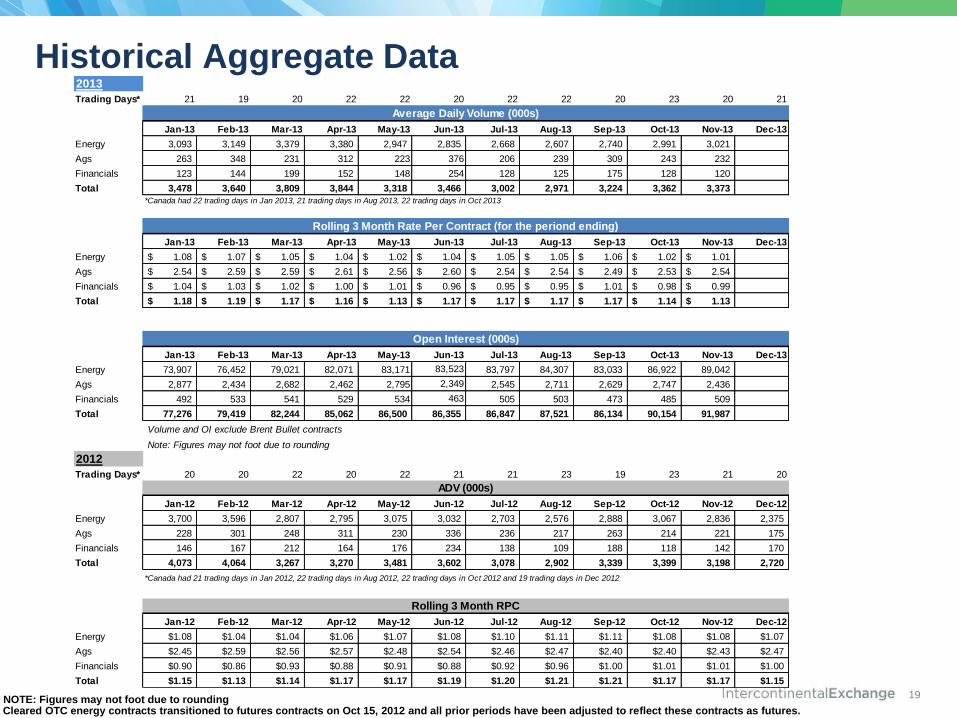
NOTE: Figures may not foot due to rounding
Historical Aggregate Data
Cleared OTC energy contracts transitioned to futures contracts on Oct 15, 2012 and all prior periods have been adjusted to reflect these contracts as futures.
2013
Trading Days* 21 19 20 22 22 20 22 22 20 23 20 21
Jan-13 Feb-13 Mar-13 Apr-13 May-13 Jun-13 Jul-13 Aug-13 Sep-13 Oct-13 Nov-13 Dec-13
Energy 3,093 3,149 3,379 3,380 2,947 2,835 2,668 2,607 2,740 2,991 3,021
Ags 263 348 231 312 223 376 206 239 309 243 232
Financials 123 144 199 152 148 254 128 125 175 128 120
Total 3,478 3,640 3,809 3,844 3,318 3,466 3,002 2,971 3,224 3,362 3,373
*Canada had 22 trading days in Jan 2013, 21 trading days in Aug 2013, 22 trading days in Oct 2013
Jan-13 Feb-13 Mar-13 Apr-13 May-13 Jun-13 Jul-13 Aug-13 Sep-13 Oct-13 Nov-13 Dec-13
Energy 1.08$ 1.07$ 1.05$ 1.04$ 1.02$ 1.04$ 1.05$ 1.05$ 1.06$ 1.02$ 1.01$
Ags 2.54$ 2.59$ 2.59$ 2.61$ 2.56$ 2.60$ 2.54$ 2.54$ 2.49$ 2.53$ 2.54$
Financials 1.04$ 1.03$ 1.02$ 1.00$ 1.01$ 0.96$ 0.95$ 0.95$ 1.01$ 0.98$ 0.99$
Total 1.18$ 1.19$ 1.17$ 1.16$ 1.13$ 1.17$ 1.17$ 1.17$ 1.17$ 1.14$ 1.13$
Jan-13 Feb-13 Mar-13 Apr-13 May-13 Jun-13 Jul-13 Aug-13 Sep-13 Oct-13 Nov-13 Dec-13
Energy 73,907 76,452 79,021 82,071 83,171 83,523 83,797 84,307 83,033 86,922 89,042
Ags 2,877 2,434 2,682 2,462 2,795 2,349 2,545 2,711 2,629 2,747 2,436
Financials 492 533 541 529 534 463 505 503 473 485 509
Total 77,276 79,419 82,244 85,062 86,500 86,355 86,847 87,521 86,134 90,154 91,987
Volume and OI exclude Brent Bullet contracts
Note: Figures may not foot due to rounding
2012
Trading Days* 20 20 22 20 22 21 21 23 19 23 21 20
Jan-12 Feb-12 Mar-12 Apr-12 May-12 Jun-12 Jul-12 Aug-12 Sep-12 Oct-12 Nov-12 Dec-12
Energy 3,700 3,596 2,807 2,795 3,075 3,032 2,703 2,576 2,888 3,067 2,836 2,375
Ags 228 301 248 311 230 336 236 217 263 214 221 175
Financials 146 167 212 164 176 234 138 109 188 118 142 170
Total 4,073 4,064 3,267 3,270 3,481 3,602 3,078 2,902 3,339 3,399 3,198 2,720
*Canada had 21 trading days in Jan 2012, 22 trading days in Aug 2012, 22 trading days in Oct 2012 and 19 trading days in Dec 2012
Jan-12 Feb-12 Mar-12 Apr-12 May-12 Jun-12 Jul-12 Aug-12 Sep-12 Oct-12 Nov-12 Dec-12
Energy $1.08 $1.04 $1.04 $1.06 $1.07 $1.08 $1.10 $1.11 $1.11 $1.08 $1.08 $1.07
Ags $2.45 $2.59 $2.56 $2.57 $2.48 $2.54 $2.46 $2.47 $2.40 $2.40 $2.43 $2.47
Financials $0.90 $0.86 $0.93 $0.88 $0.91 $0.88 $0.92 $0.96 $1.00 $1.01 $1.01 $1.00
Total $1.15 $1.13 $1.14 $1.17 $1.17 $1.19 $1.20 $1.21 $1.21 $1.17 $1.17 $1.15
Average Daily Volume (000s)
Rolling 3 Month Rate Per Contract (for the periond ending)
Open Interest (000s)
ADV (000s)
Rolling 3 Month RPC
19
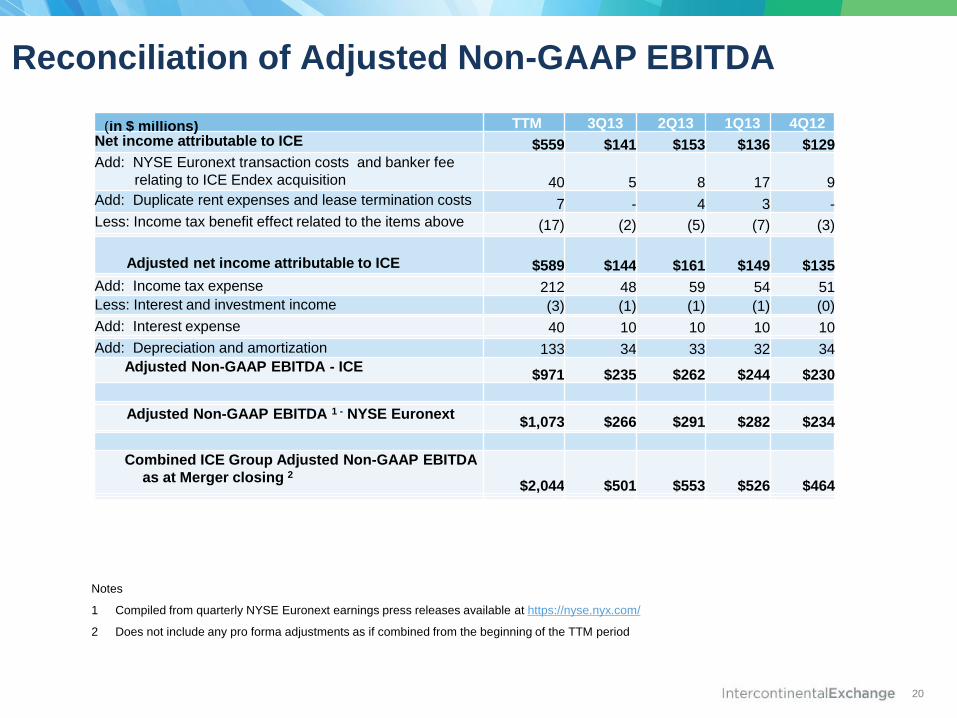
Reconciliation of Adjusted Non-GAAP EBITDA
(in $ millions) TTM 3Q13 2Q13 1Q13 4Q12
Net income attributable to ICE $559 $141 $153 $136 $129
Add: NYSE Euronext transaction costs and banker fee
relating to ICE Endex acquisition 40 5 8 17 9
Add: Duplicate rent expenses and lease termination costs 7 - 4 3 -
Less: Income tax benefit effect related to the items above (17) (2) (5) (7) (3)
Adjusted net income attributable to ICE $589 $144 $161 $149 $135 Add: Income tax expense 212 48 59 54 51
Less: Interest and investment income (3) (1) (1) (1) (0) Add: Interest expense 40 10 10 10 10 Add: Depreciation and amortization 133 34 33 32 34
Adjusted Non-GAAP EBITDA - ICE $971 $235 $262 $244 $230
Adjusted Non-GAAP EBITDA 1 - NYSE Euronext
$1,073 $266 $291 $282 $234
Combined ICE Group Adjusted Non-GAAP EBITDA
as at Merger closing 2 $2,044 $501 $553 $526 $464
Notes
1 Compiled from quarterly NYSE Euronext earnings press releases available at https://nyse.nyx.com/
2 Does not include any pro forma adjustments as if combined from the beginning of the TTM period
20


