Milton Johnson SVP and Controller Goldman Sachs 2004HCA Mark Kimbrough VP, Investor Relations.
1
GOLDMAN SACHS INVESTOR CONFERENCEEric Affeldt – President and CEO
Mark Burnett – COO
Frank Molina – VP, Investor Relations
June 1, 2015

2
CAUTIONARY STATEMENTS
Forward-Looking Statements
Certain statements in this presentation may be considered forward-looking statements. Forward-looking statements generally relate to future events or our future
financial or operating performance. In some cases, you can identify forward-looking statements by terminology such as “may”, “should”, “expect”, “intend”, “will”,
“estimate”, “anticipate”, “believe”, “predict”, “potential” or “continue”, or the negatives of these terms or variations of them or similar terminology or expressions
that relate to our expectations, strategy, plans or intentions. Such forward-looking statements are subject to risks, uncertainties, and other factors which could
cause actual results to differ materially from those expressed or implied by such forward looking statements.
These forward-looking statements are based upon estimates and assumptions that, while considered reasonable by the Company and its management, are
inherently uncertain. Factors that may cause actual results to differ materially from current expectations include, but are not limited to, various factors beyond
management's control adversely affecting discretionary spending, membership count and facility usage and the other risks, uncertainties and factors set forth in
the sections entitled “Risk Factors”, “Cautionary Statement Regarding Forward-Looking Statements” and “Management’s Discussion and Analysis of Financial
Condition and Results of Operations” in the Company's Annual Report on Form 10-K for the fiscal year ended December 30, 2014 and in its Quarterly Report on
Form 10-Q for the quarterly period ended March 24, 2015.
Nothing in this presentation should be regarded as a representation by any person that the forward-looking statements set forth herein will be achieved or that
any of the contemplated results of such forward-looking statements will be achieved. You should not place undue reliance on forward-looking statements, which
speak only as of the date they are made. The Company undertakes no duty to update these forward-looking statements.
Non-GAAP Financial Measures
In our presentation, we refer to certain non-GAAP financial measures. Please refer to the footnotes on each page of this presentation where non-GAAP financial
measures are presented or to the appendix found at the end of this presentation for a reconciliation of these measures to what we believe are the most directly
comparable GAAP measures.

3
Revenue Mix(3)
COMPANY OVERVIEW
Membership
Based
Business
46%
Dues
28%
Food &
Beverage
17%
Golf
Ops
9%
Other
(1) As of April 30, 2015
(2) As of March 24, 2015
(3) As of December 30, 2014; does not reflect a full year of Sequoia Golf
(4) Adjusted EBITDA is not calculated in accordance with accounting principles generally accepted in the U.S. (GAAP). See Appendix for a reconciliation to
the most comparable financial measure calculated in accordance with GAAP
(5) Free Cash Flow is a non-GAAP measure. See appendix for a reconciliation of Free Cash Flow to the most comparable financial measure calculated in
accordance with GAAP
Total Clubs(1)
209Clubs
160
49
Golf & Country
Clubs (GCC)
Business, Sports &
Alumni Clubs (BSA)
» Founded in 1957, ClubCorp has
grown from one club to a leading
owner-operator of private clubs
» 209 owned or operated locations
across 26 states, Washington D.C.,
Mexico and China(1)
» 180,000+ memberships, serving
over 430,000 members(2)
» 200 18-hole equivalents(1)
» Fiscal Year 2014 Results(3)
─ Revenue: $884.2 million
─ Adj. EBITDA: $196.5 million(4)
─ Free Cash Flow: $110.0 million(5)
1 Organic Growth
2 Reinvention
3 Acquisitions
Growth Strategies
3
4
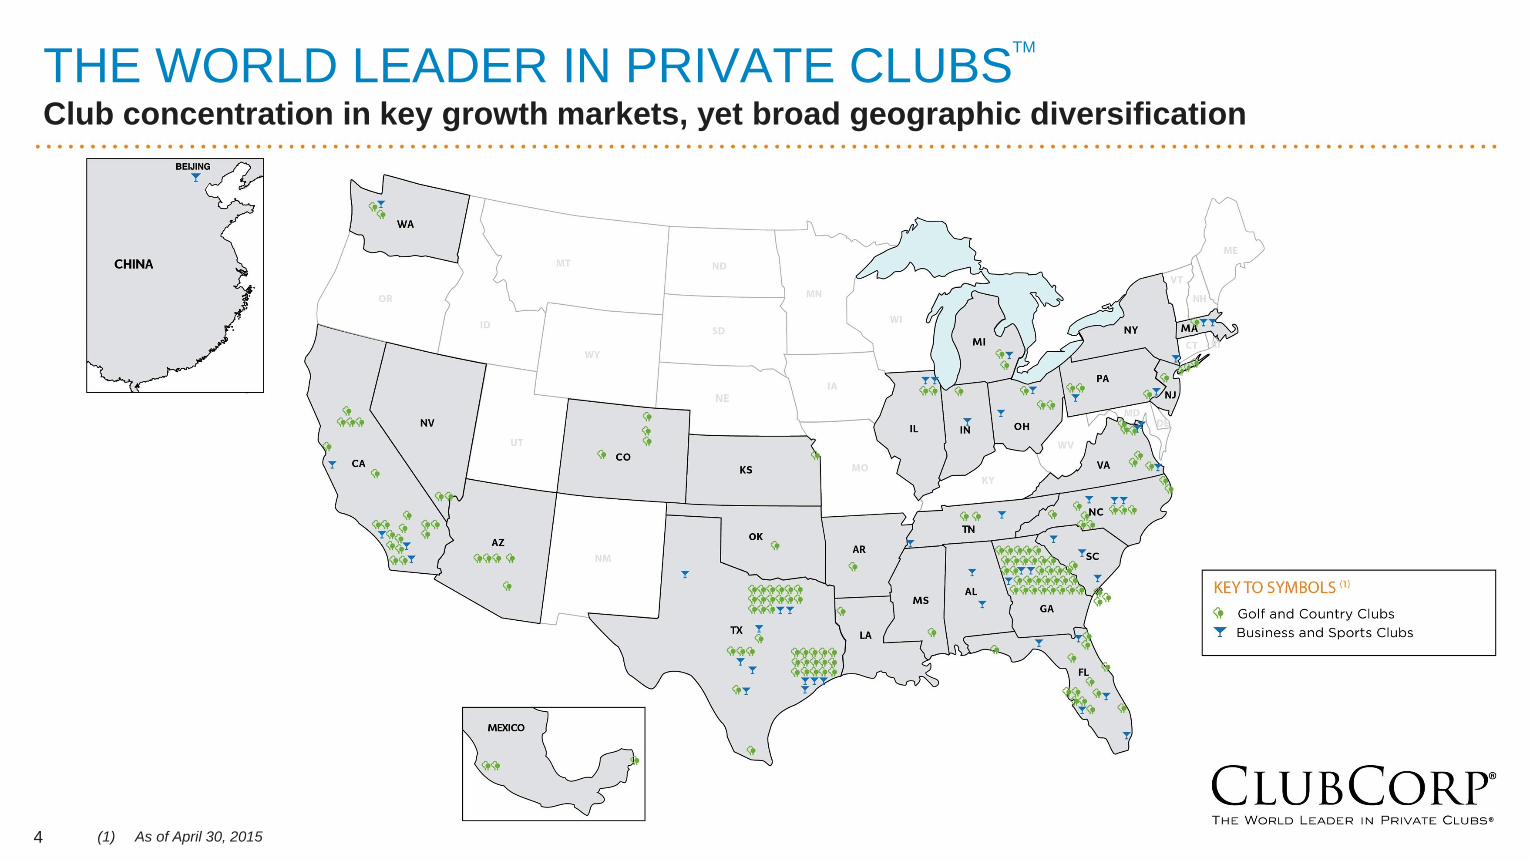
THE WORLD LEADER IN PRIVATE CLUBSClub concentration in key growth markets, yet broad geographic diversification
4 (1) As of April 30, 2015
TM

5
WE’RE IN THE MEMBERSHIP BUSINESSPredictable and stable dues-based membership business tied to mass affluent consumer
84,410 83,724 81,986 80,024 79,656 80,619 82,719 85,397
117,212
86% 86%
83% 83% 83%84% 84% 84% 84%
2006 2007 2008 2009 2010 2011 2012 2013 2014
GCC Membership Trends
Membership Counts Annual Retention Rate
79,383 73,160 67,032 63,967 62,953 62,046 61,405 63,474
77%73% 73%
76% 77% 77% 77% 77%
2007 2008 2009 2010 2011 2012 2013 2014
BSA Membership Trends
Membership Counts Annual Retention Rate
(1) Membership Count includes ~27,000 memberships added in the September 2014 acquisition of Sequoia Golf. Sequoia Golf excluded from Annual Retention Rate
(2) Source: Mosaic demographic analysis of 2014 GCC members within Buxton database
(1)
Resilient Membership Base(2)
» Targeting mass affluent demographic with
average annual household income in
excess of $150k with significant annual
discretionary income
─ Avg. Household income > $200k: 47%
─ Avg. Primary Home value > $750k: 49%
» Strong member retention plus meaningful
percentage of highly visible recurring
revenue makes our dues-based business
model resilient across economic cycles
» Additionally, proximity increases usage and
retention…these clubs are located in
Members’ communities

6
RESILIENT MEMBERSHIP BASETied to mass affluent consumer
A more resilient consumer…
» Targeting mass affluent demographic with average annual household income in excess of $150k with significant
annual discretionary income
» Strong member retention plus meaningful percentage of highly visible recurring revenue makes our dues-based
business model resilient across economic cycles
» Additionally, proximity increases usage and retention…these clubs are located in Members’ communities
21%
13%19%
47%
<$150k $150-175k $175-200k >$200
Average Household Income(1)
(GCC surrounding population demographics)
19% 16% 16%
49%
<$250k $250-500k $500-750k $750k+
Average Primary Home Value(1)
(GCC surrounding population demographics)
4%
30%
46%
20%
25-35 36-50 51-65 65+
Average Age(1)
(GCC surrounding population demographics)
(1) Source: Mosaic demographic analysis of 2014 GCC members within Buxton database.

7
EXECUTING OUR GROWTH STRATEGYUnderlying economics focused on increasing member spend and consolidating industry share
7
Superior Product &
Member Experience
Reinvention
O.N.E. offering
Increase Member Spend
Strategic Acquisitions
Local Market Cluster
Continued Consolidation of
the Industry

8
EXECUTING THREE PRONGED GROWTH STRATEGYUnderlying economics focused on increasing member spend and consolidating industry share
Organic
Growth
O.N.E. (Optimal Network Experiences) provides participating members 50% off á la carte dining at their home club(1),
access to and preferred rates at ClubCorp owned clubs within 50 mile radius, and 2 free rounds of golf per golf &
country club and 2 free meals per business club, per month(1) at ClubCorp owned clubs outside 50 mile radius
Participating members also receive access, special offerings or discounts to more than 300 private and public
facilities and over 1,000 alliance partner locations(2)
Reinvention
Fragmented nature and abundance of member-owned and individually-owned golf courses at compelling
valuations presents roll-up opportunities
Over $337 million spent to acquire 63 golf and country clubs in 2014 and 2015(4)
Our exceptional platform positions us to be a consolidator of the industry
Acquisitions
(1) Some restrictions apply
(2) As of April 30, 2015
(3) Does not include acquisitions and amount subject to change
(4) Includes Sequoia Golf properties owned or operated as of September 30, 2014. Purchase price of $265.0 million before adjustment for cash received of $5.6
million and customary closing adjustments
Significant ROI opportunities within our existing portfolio through modernizing clubs to be more relevant to today’s
members as well as appeal to broader target customers
Over $480 million total capital invested from fiscal year 2007 to fiscal year 2014
Expect to invest approximately $48-53 million of capital in 2015(3)
9
THE CLUBCORP ADVANTAGEThe ClubCorp Network…delivers a superior and differentiated value proposition
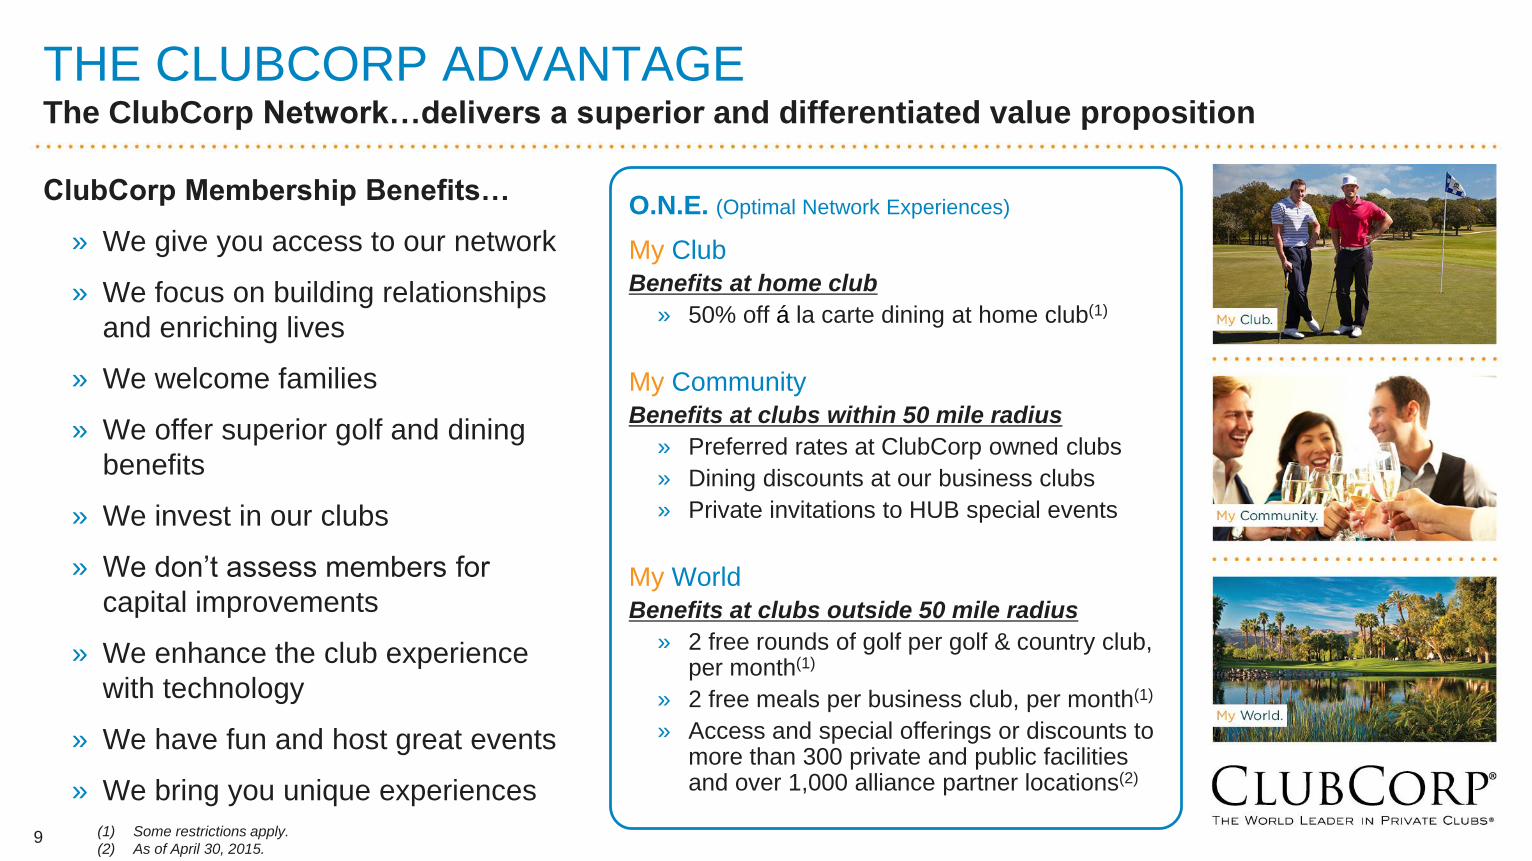
ClubCorp Membership Benefits…
» We give you access to our network
» We focus on building relationships
and enriching lives
» We welcome families
» We offer superior golf and dining
benefits
» We invest in our clubs
» We don’t assess members for
capital improvements
» We enhance the club experience
with technology
» We have fun and host great events
» We bring you unique experiences
9
O.N.E. (Optimal Network Experiences)
My Club
Benefits at home club
» 50% off á la carte dining at home club(1)
My Community
Benefits at clubs within 50 mile radius
» Preferred rates at ClubCorp owned clubs
» Dining discounts at our business clubs
» Private invitations to HUB special events
My World
Benefits at clubs outside 50 mile radius
» 2 free rounds of golf per golf & country club, per month(1)
» 2 free meals per business club, per month(1)
» Access and special offerings or discounts to more than 300 private and public facilities and over 1,000 alliance partner locations(2)
(1) Some restrictions apply.
(2) As of April 30, 2015.
10
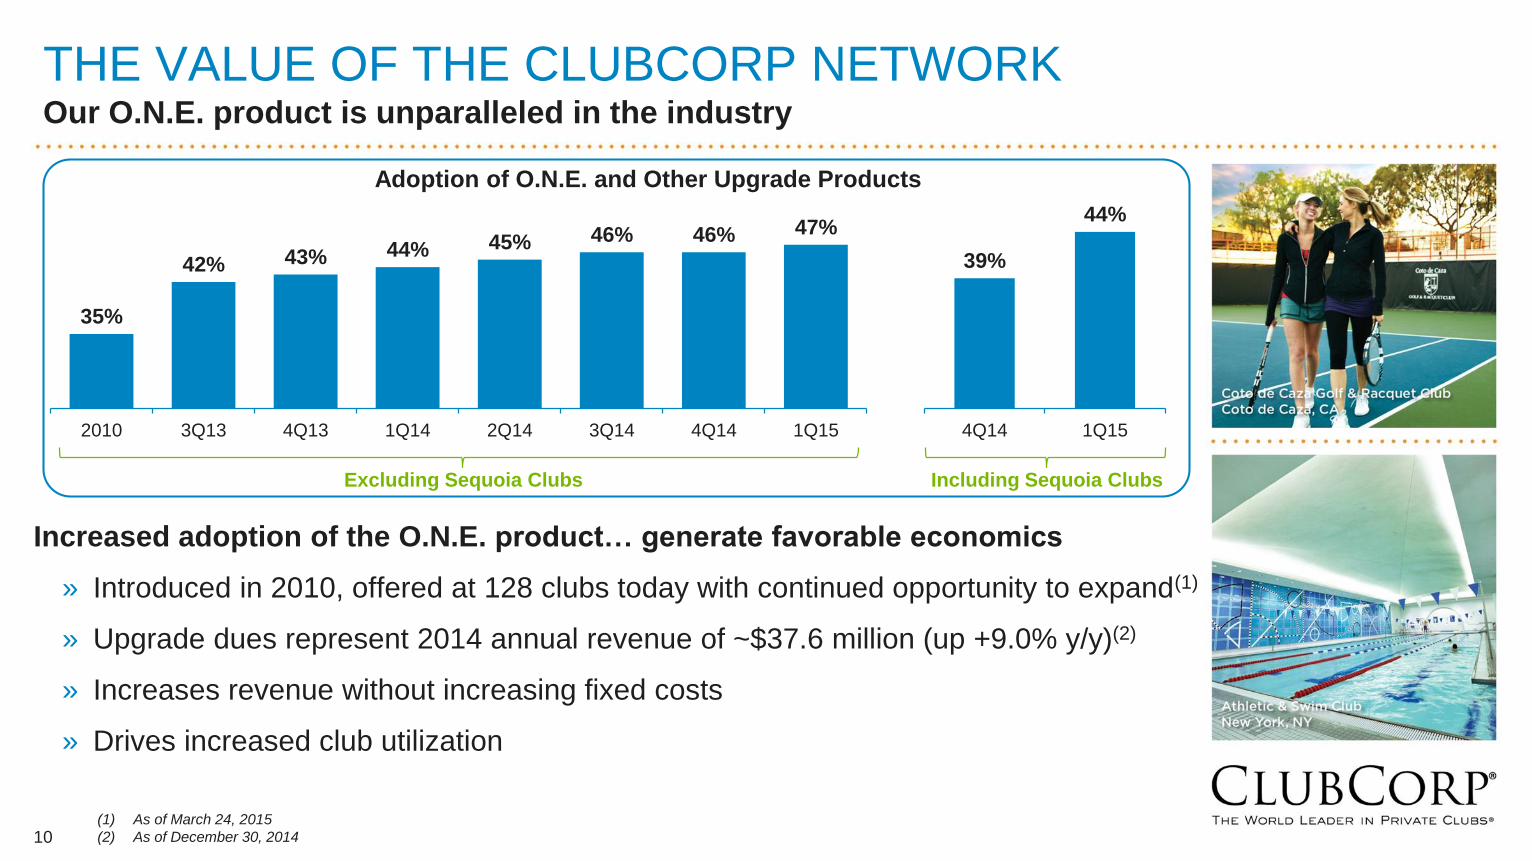
THE VALUE OF THE CLUBCORP NETWORKOur O.N.E. product is unparalleled in the industry
Increased adoption of the O.N.E. product… generate favorable economics
» Introduced in 2010, offered at 128 clubs today with continued opportunity to expand(1)
» Upgrade dues represent 2014 annual revenue of ~$37.6 million (up +9.0% y/y)(2)
» Increases revenue without increasing fixed costs
» Drives increased club utilization
10
35%
42% 43% 44% 45% 46% 46% 47%
2010 3Q13 4Q13 1Q14 2Q14 3Q14 4Q14 1Q15
(1) As of March 24, 2015
(2) As of December 30, 2014
39%
44%
4Q14 1Q15
Adoption of O.N.E. and Other Upgrade Products
Excluding Sequoia Clubs Including Sequoia Clubs

11
REINVENTION ELEMENTSReinventing and / or adding amenities that did not previously exist at the club
11

12
Invested ~$3.8M from mid-2012 to 2014.
Experienced +7.3% increased membership count, +14.6% increased revenue.(1)
GLENEAGLES COUNTRY CLUB (Plano, TX)
Dated, undersized bar
Integrated, modern, private experienceEnhanced fitness facilities
12 (1) Comparison reflects percentage change from pre-construction revenue and membership count in 2012 compared to fiscal year end 2014.

13
CITY CLUB LOS ANGELES (Los Angeles, CA)
Formal, stuffy, traditional
Modern dining, take advantage of viewWarm entry lobby
13 (1) Comparison reflects percentage change from pre-construction revenue and membership count in 2012 compared to fiscal year end 2014.
Invested ~$6.7M, net of landlord provided capital, from mid-2012 to 2014.
Experienced +17.8% increased membership count, +28.7% increased revenue.(1)

14
ACQUISITION OPPORTUNITIESClubCorp is the United States’ largest owner-operator in a highly fragmented industry
Private golf and country clubs in the U.S. …
» ~3,900 private clubs, of which ~16% have a corporate owner(1)
» ClubCorp is ~2-5x its next three largest private club competitors(1)
» In total, ClubCorp owns or operates 160 golf and country clubs(1)
» Acquisition pipeline remains robust
4618
3
MYCC1
135
189
109
MYCC122
1 Club 2 - 5 6 - 24 25 - 100 > 100
Owners of 1 or More Private Clubsand Number of Clubs They Represent(1)
Entities Clubs
3,300+
(1) Source: National Golf Foundation data for 2014. MYCC data as of April 30, 201514
15
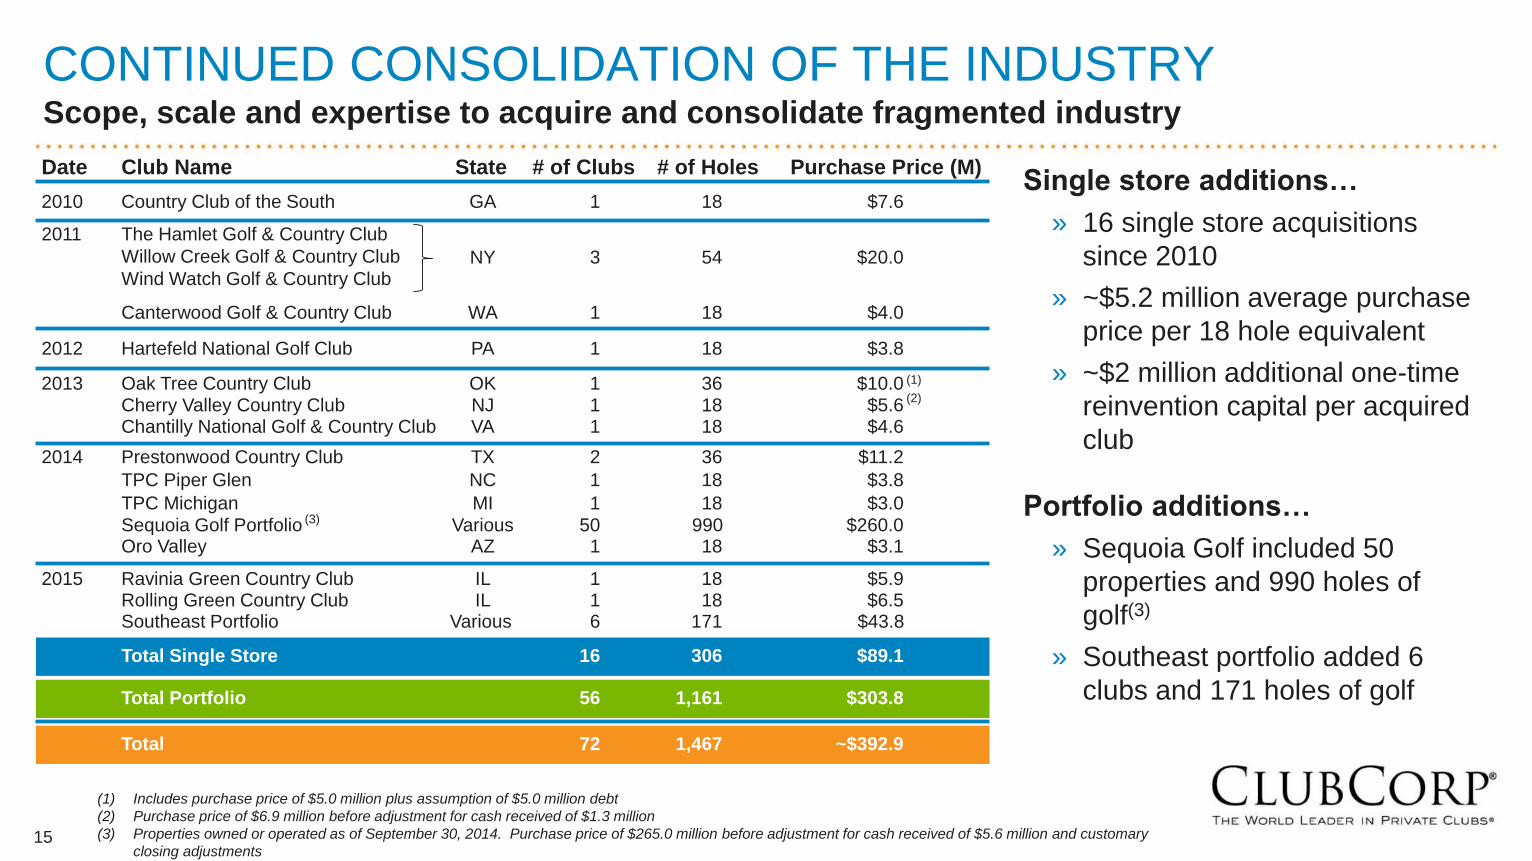
CONTINUED CONSOLIDATION OF THE INDUSTRYScope, scale and expertise to acquire and consolidate fragmented industry
Single store additions…
» 16 single store acquisitions
since 2010
» ~$5.2 million average purchase
price per 18 hole equivalent
» ~$2 million additional one-time
reinvention capital per acquired
club
Portfolio additions…
» Sequoia Golf included 50
properties and 990 holes of
golf(3)
» Southeast portfolio added 6
clubs and 171 holes of golf
Date Club Name State Purchase Price (M)# of Clubs # of Holes
2010 Country Club of the South GA $7.61 18
2011 The Hamlet Golf & Country Club
Willow Creek Golf & Country Club
Wind Watch Golf & Country ClubNY $20.03 54
Canterwood Golf & Country Club WA $4.01 18
2012 Hartefeld National Golf Club PA $3.81 18
Chantilly National Golf & Country Club VA $4.61 18
TPC Piper Glen NC $3.81 18
TPC Michigan MI $3.01 18
Total Single Store $89.116 306
Prestonwood Country Club TX $11.222014 36
Oro Valley AZ $3.11 18Sequoia Golf Portfolio Various $260.050 990
Total Portfolio $303.856 1,161
2013 Oak Tree Country Club OK $10.01 36 (1)
Cherry Valley Country Club NJ $5.61 18(2)
(1) Includes purchase price of $5.0 million plus assumption of $5.0 million debt
(2) Purchase price of $6.9 million before adjustment for cash received of $1.3 million
(3) Properties owned or operated as of September 30, 2014. Purchase price of $265.0 million before adjustment for cash received of $5.6 million and customary
closing adjustments
Total ~$392.972 1,467
Ravinia Green Country Club IL $5.912015 18Rolling Green Country Club IL $6.51 18Southeast Portfolio Various $43.86 171
(3)
16
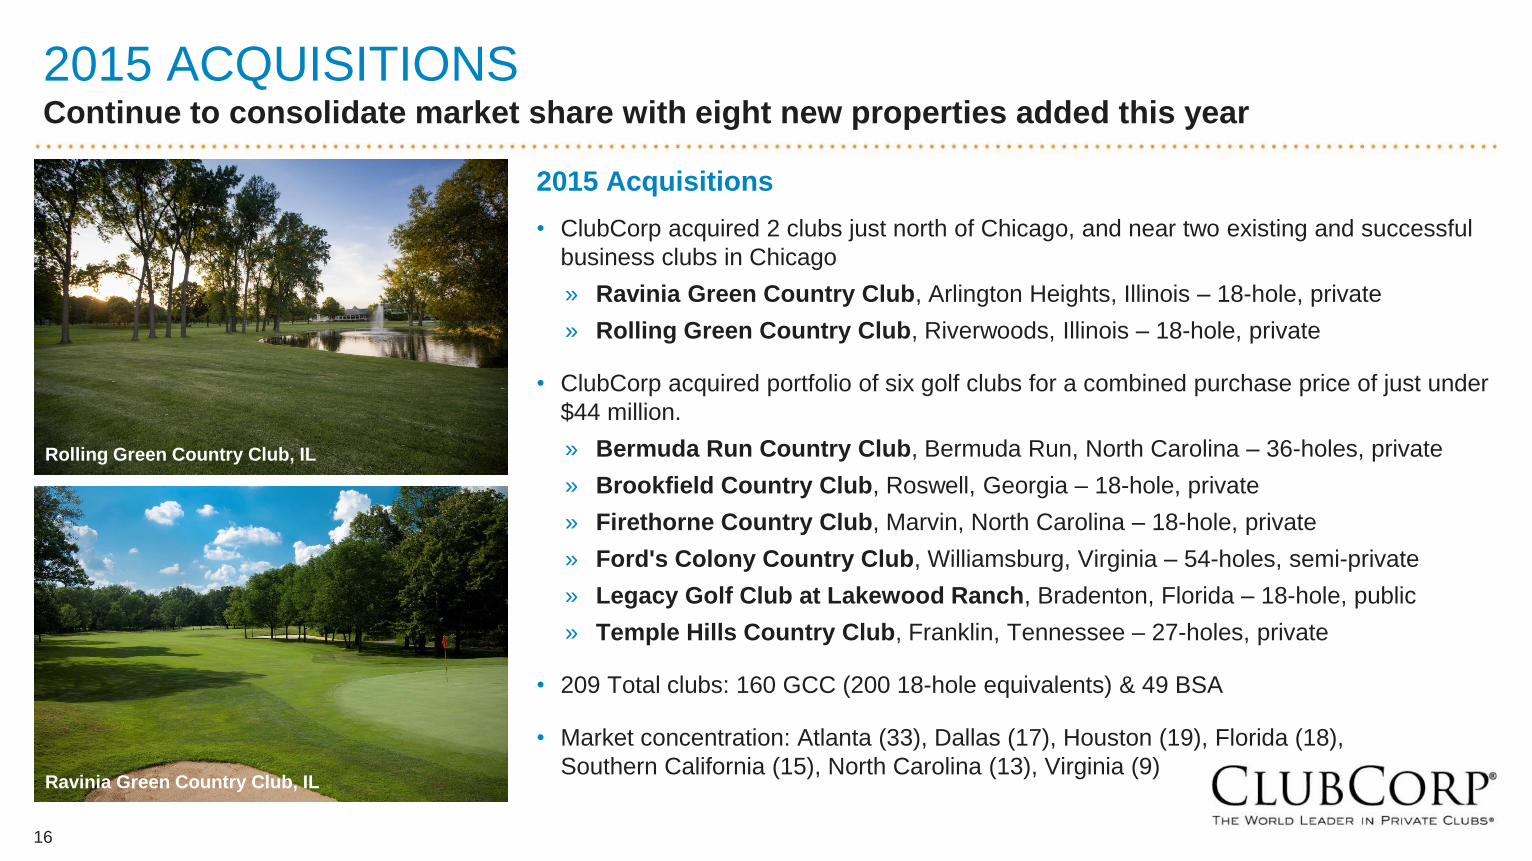
2015 ACQUISITIONS Continue to consolidate market share with eight new properties added this year
Rolling Green Country Club, IL
Ravinia Green Country Club, IL
2015 Acquisitions
• ClubCorp acquired 2 clubs just north of Chicago, and near two existing and successful
business clubs in Chicago
» Ravinia Green Country Club, Arlington Heights, Illinois – 18-hole, private
» Rolling Green Country Club, Riverwoods, Illinois – 18-hole, private
• ClubCorp acquired portfolio of six golf clubs for a combined purchase price of just under
$44 million.
» Bermuda Run Country Club, Bermuda Run, North Carolina – 36-holes, private
» Brookfield Country Club, Roswell, Georgia – 18-hole, private
» Firethorne Country Club, Marvin, North Carolina – 18-hole, private
» Ford's Colony Country Club, Williamsburg, Virginia – 54-holes, semi-private
» Legacy Golf Club at Lakewood Ranch, Bradenton, Florida – 18-hole, public
» Temple Hills Country Club, Franklin, Tennessee – 27-holes, private
• 209 Total clubs: 160 GCC (200 18-hole equivalents) & 49 BSA
• Market concentration: Atlanta (33), Dallas (17), Houston (19), Florida (18),
Southern California (15), North Carolina (13), Virginia (9)
17
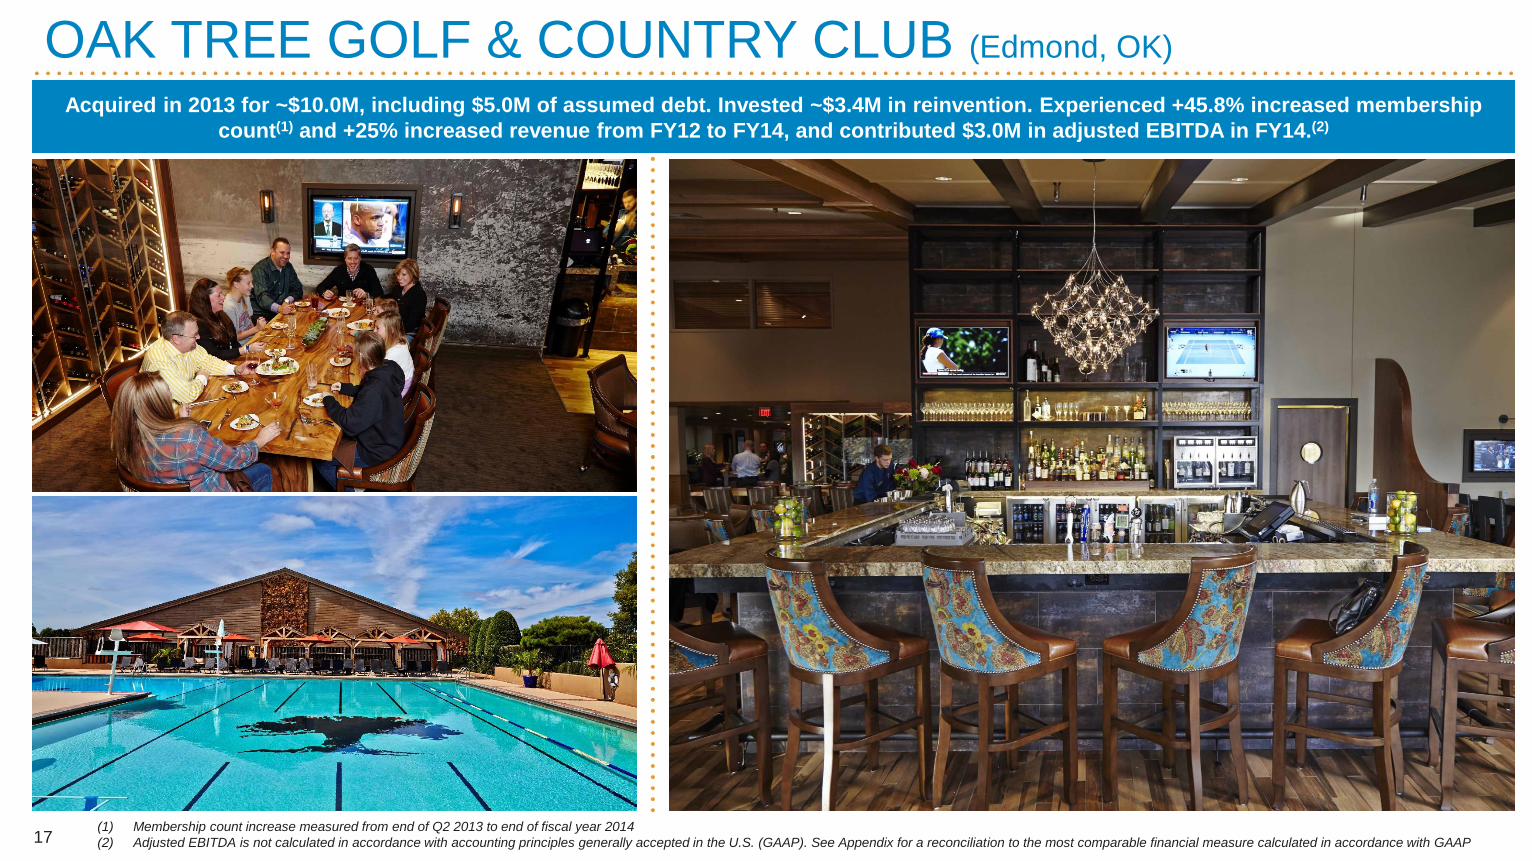
OAK TREE GOLF & COUNTRY CLUB (Edmond, OK)
(1) Membership count increase measured from end of Q2 2013 to end of fiscal year 2014
(2) Adjusted EBITDA is not calculated in accordance with accounting principles generally accepted in the U.S. (GAAP). See Appendix for a reconciliation to the most comparable financial measure calculated in accordance with GAAP
Acquired in 2013 for ~$10.0M, including $5.0M of assumed debt. Invested ~$3.4M in reinvention. Experienced +45.8% increased membership
count(1) and +25% increased revenue from FY12 to FY14, and contributed $3.0M in adjusted EBITDA in FY14.(2)
18
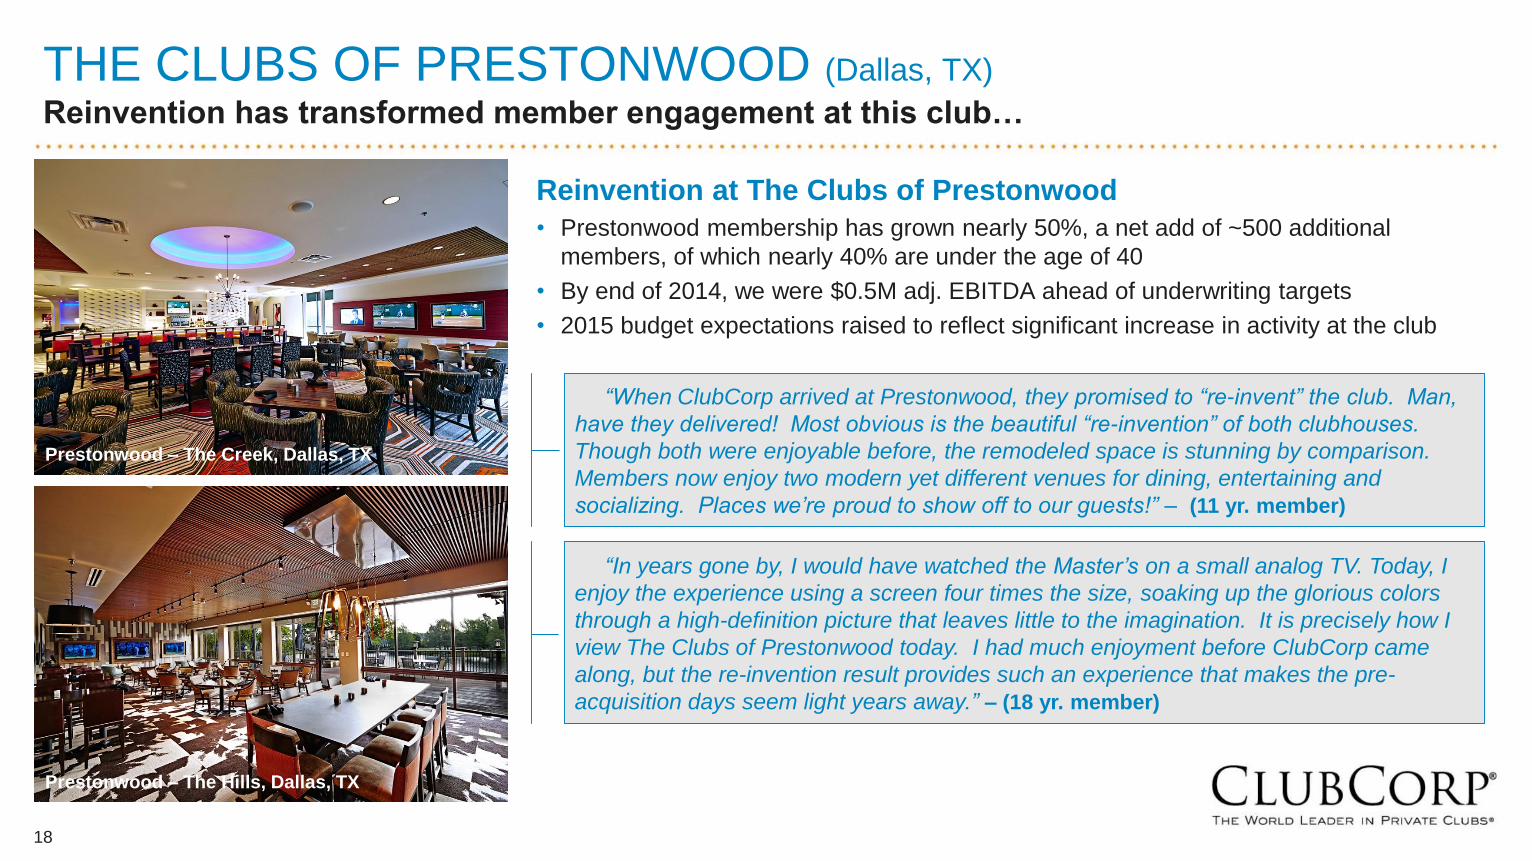
THE CLUBS OF PRESTONWOOD (Dallas, TX)
Reinvention has transformed member engagement at this club…
Prestonwood – The Creek, Dallas, TX
Prestonwood – The Hills, Dallas, TX
“When ClubCorp arrived at Prestonwood, they promised to “re-invent” the club. Man,
have they delivered! Most obvious is the beautiful “re-invention” of both clubhouses.
Though both were enjoyable before, the remodeled space is stunning by comparison.
Members now enjoy two modern yet different venues for dining, entertaining and
socializing. Places we’re proud to show off to our guests!” – (11 yr. member)
Reinvention at The Clubs of Prestonwood
• Prestonwood membership has grown nearly 50%, a net add of ~500 additional
members, of which nearly 40% are under the age of 40
• By end of 2014, we were $0.5M adj. EBITDA ahead of underwriting targets
• 2015 budget expectations raised to reflect significant increase in activity at the club
“In years gone by, I would have watched the Master’s on a small analog TV. Today, I
enjoy the experience using a screen four times the size, soaking up the glorious colors
through a high-definition picture that leaves little to the imagination. It is precisely how I
view The Clubs of Prestonwood today. I had much enjoyment before ClubCorp came
along, but the re-invention result provides such an experience that makes the pre-
acquisition days seem light years away.” – (18 yr. member)

19
1Q15 PERFORMANCEContinue to execute our three-pronged growth strategy
• By offering our members a superior product and exceptional member experience,
we consistently increase member spend, consolidate market share, and drive
long-term shareholder value
• We delivered record first quarter results:
» 1Q15 revenue +22% to $202 million
» 1Q15 adjusted EBITDA +21% to $39 million
• Positive membership growth at both same store clubs, and new or acquired clubs
• Controlled expenses delivering margin expansion across same store clubs
• At Sequoia, most of our projected cost synergies have been fully realized
• Members at recently acquired clubs have gravitated toward our O.N.E. offering, such
that ~44% of our members were enrolled in O.N.E. or similar upgrade offerings
• Added eight new clubs to our portfolio … we now operate 160 golf & country clubs
(GCC), or 200 18-hole equivalents, plus 49 business, sports & alumni clubs (BSA)
19

20
STRONG OPERATING PERFORMANCEProven operating track record with attractive FCF generation
$688 $720 $755$815
$884 $921
2010 2011 2012 2013(53wks)
2014 1Q15LTM
$150 $157 $166 $177$196 $203
21.8% 21.8%22.0%
21.7%
22.2% 22.1%
2010 2011 2012 2013(53wks)
2014 1Q15LTM
20
(1) Adjusted EBITDA is a non-GAAP measure. See Appendix for reconciliation to the most comparable financial measure calculated in accordance with GAAP. Orange line represents Adjusted EBITDA
margin, defined as Adjusted EBITDA divided by Revenue
(2) Same store memberships excludes managed clubs; total memberships includes same store and acquired clubs, but excludes memberships at managed clubs
(3) Free Cash Flow is not calculated in accordance with accounting principles generally accepted in the U.S. ("GAAP"). A reconciliation of Free Cash Flow to the most comparable financial measure
calculated in accordance with GAAP can be found in the appendix of this presentation
Revenue$ millions
CAGR +7.1% Adj. EBITDA(1)
$ millions
CAGR +7.4%
$83.0$87.5
$99.5
$110.0 $112.1
1Q14LTM
2Q14LTM
3Q14LTM
4Q14LTM
1Q15LTM
Levered FCF(3)
$ millions
138,664 139,863 139,664
169,601
1Q14Same-store
1Q15Same-store
1Q14Total
1Q15Total
Memberships(2)
21.4%
0.9%

21
GOLF & COUNTRY CLUBS (GCC)Solid growth across all key operating metrics
$532 $556$586
$628$695
$726
2010 2011 2012 2013(53wks)
2014 1Q15 LTM
48% Dues
23% F&B
22% Golf Ops
7% Other
$726M
Revenue(1)
$ millions
CAGR +7.6% LTM Revenue Mix(1)
$151 $156$168
$180$203 $212
28.4% 28.1%28.8% 28.7% 29.3% 29.2%
2010 2011 2012 2013(53wks)
2014 1Q15 LTM
Adj. EBITDA(1)(2)
$ millions
CAGR +8.3% Memberships(3)
1.2%
32.8%
(1) As of March 24, 2015.
(2) Adjusted EBITDA is a non-GAAP measure. See Appendix for a reconciliation to the most comparable financial measure calculated in accordance with GAAP.
Orange line represents Adjusted EBITDA margin, defined as Adjusted EBITDA divided by Revenue.
(3) Same store memberships excludes managed clubs; total memberships includes same store and acquired clubs, but excludes managed clubs as of March 24, 2015.
83,975 85,009 84,975
112,874
1Q14Same-store
1Q15Same-store
1Q14Total
1Q15Total

22
BUSINESS, SPORTS & ALUMNI CLUBS (BSA)Moderate revenue growth and improving profitability
$168$172
$174
$180$184
$186
2010 2011 2012 2013(53wks)
2014 1Q15 LTM
$30.3$32.5
$34.1 $34.4 $35.2 $36.318.0%18.9%
19.6%19.1% 19.2% 19.5%
2010 2011 2012 2013(53wks)
2014 1Q15 LTM
42% Dues
51% F&B
7% Other
$186M
Revenue(1)
$ millions
Adj. EBITDA(1)(2)
$ millions
LTM Revenue Mix(1)
Memberships(3)
0.3%
3.7%
CAGR +2.4%
CAGR +4.3%
(1) As of March 24, 2015.
(2) Adjusted EBITDA is a non-GAAP measure. See Appendix for a reconciliation to the most comparable financial measure calculated in accordance with GAAP.
Orange line represents Adjusted EBITDA margin, defined as Adjusted EBITDA divided by Revenue.
(3) Same store memberships excludes managed clubs; total memberships includes same store and acquired clubs, but excludes managed clubs as of March 24, 2015.
54,689 54,854 54,689
56,727
1Q14Same-store
1Q15Same-store
1Q14Total
1Q15Total

23
FY14 CAPEXContinued investment in business …
1Q15 Capital Expenditures
• 1Q15 maintenance capex $9.6 million
• 1Q15 expansion capital:
» ROI capital $11.3 million
» Acquisition capital $15.2 million
(i.e., $5.9M for Ravinia Green, $6.4M for Rolling Green, and $3M escrow for six-club portfolio acquisition)
2015 Capital Expenditures
• Remaining in 2015, we anticipate investing ~$38 million on maintenance capex
• Remaining in 2015, we anticipate investing ~$37-42 million on reinvention capital to reinvent and renovate approximately 30+ clubs, including 13 same-store clubs, several clubs from the Sequoia Golf acquisition, and many of our recently acquired single-store clubs
$24.9 $25.1 $16.7 $23.8 $29.1 $9.6
$18.0 $22.8 $37.5$35.7
$43.5
$11.3
2010 2011 2012 2013 2014 1Q15
Maintenance Capex ROI Capex
Capital Expenditures$ millions

24
FY14 FREE CASH FLOWAttractive FCF generation …
$76.8$83.0
$87.5
$99.5
$110.0 $112.1
4Q13LTM
1Q14LTM
2Q14LTM
3Q14LTM
4Q14LTM
1Q15LTM
Free Cash Flow
• +35% y/y increase in LTM levered FCF
• 1Q15 interest expense(2) was $10.3 million
• 1Q15 cash tax expense was $0.2 million
• Paid ~$8.4 million in dividends on January 15, 2015, and the Company currently pays annual dividends of $0.52/share
Liquidity & Capital Structure
• As of March 24, 2015, cash and cash equivalents and total liquidity of $175.3 million. Subsequent to Q1, the Company borrowed $41.0 million on the revolving credit facility, reducing total liquidity to ~$134 million
• As of March 24, 2015, ClubCorp had one term loan of approximately $900 million at L+350 basis points with a 1% LIBOR floor, and revolving credit borrowings of $6.0 million
• As of March 24, 2015, Sr. Secured Leverage Ratio was 4.3x
Levered FCF(1)
$ millions
(1) Free Cash Flow is not calculated in accordance with accounting principles generally accepted in the U.S. ("GAAP"). A reconciliation of Free Cash Flow to the most
comparable financial measure calculated in accordance with GAAP can be found in the appendix of this presentation.
(2) Interest on long-term debt excludes accretion of discount on member deposits, amortization of debt issuance costs, amortization of term loan discount and interest on
notes payable related to certain realty interests which we define as “Non-Core Development Entities”.

25
CAPITAL STRUCTUREStrong balance sheet
Capitalization ($ millions, except share price)
Capitalization March 24, 2015
Common Shares 64.6
Share Price @ 5/21/2015 $22.36
Total Equity Capitalization $1,444
Term Loan $901
Revolver 6
Mortgage Notes 37
Other Debt 2
Capital Leases 34
Total Funded Debt(1) $980
Less Cash Equivalents (73)
Net Debt $907
Total Capitalization $2,351
Non-controlling interest 10
Total Enterprise Value $2,361
Capital structure and liquidity…
» Term loan of ~$900 million priced at L+325 bps with 1% LIBOR floor(2); matures on July 24, 2020
» Senior Secured Leverage Ratio was 4.3x at the end of 1Q15
» Senior Secured Leverage Ratio Covenant of 5.00 : 1.00
» Ample liquidity for future acquisitions
─ Revolver of $135 million with ~$62 million of availability(3)
─ Cash: $72.5 million(4)
(1) Total Funded Debt excludes $12 million of notes payable related to certain non-core development entities and a $3 million discount on term loan
(2) As of May 28, 2015
(3) As of April 30, 2015
(4) As of March 24, 2015
26
INVESTMENT HIGHLIGHTS
Predictable dues-based membership business with growing base
Solid organic growth…tied to mass affluent consumer
Attractive returns on expansion capital, particularly from reinvention
Scope, scale and expertise to acquire and consolidate fragmented industry
Upside from recent acquisitions, including Sequoia Golf
Proven operating track record with attractive FCF generation(1)
26 (1) Free Cash Flow (FCF) is a non-GAAP measure. See appendix for a reconciliation of Free Cash Flow to the most comparable financial measure calculated in
accordance with GAAP.

27
APPENDIX

28
NET INCOME TO ADJUSTED EBITDARECONCILIATION OF NON-GAAP MEASURES TO CLOSEST GAAP MEASURE
(1) Includes non-cash impairment charges related to property and equipment and intangible assets, loss on disposals of assets (including property and equipment disposed of in connection with renovations) and net loss or income from discontinued operations and divested
clubs that do not quality as discontinued operations.(2) Includes (gain) loss on extinguishment of debt calculated in accordance with GAAP. (3) Includes non-cash items related to purchase accounting associated with the acquisition of ClubCorp, Inc. ("CCI") in 2006 by affiliates
of KSL and expense recognized for our long-term incentive plan related to fiscal years 2011 through 2013. (4) Represents adjustments permitted by the credit agreement governing ClubCorp's secured credit facilities including cash distributions from equity method investments
less equity in earnings recognized for said investments, income or loss attributable to non-controlling equity interests of continuing operations, franchise taxes, adjustments to accruals for unclaimed property settlements, acquisition costs, debt amendment costs, equity offering
costs, other charges incurred in connection with the ClubCorp Formation (as defined in our Annual Report on Form 10-K filed with the SEC on March 12, 2015) and management fees, termination fee and expenses paid to an affiliate of KSL. (5) Includes equity-based
compensation expense, calculated in accordance with GAAP, related to awards held by certain employees, executives and directors. (6) Represents estimated deferred revenue using current membership life estimates related to initiation payments that would have been
recognized in the applicable period but for the application of purchase accounting in connection with the acquisition of CCI in 2006 and the acquisition of Sequoia Golf on September 30, 2014.
LTM
FY10 FY11 FY12 FY13 FY14 1Q15
Net income (loss) 252,663$ (35,622)$ (26,992)$ (40,680)$ 13,329$ 12,841$
Interest expense 61,236 84,746 89,369 83,669 65,209 65,614
Income tax expense (benefit) 57,107 (16,421) (7,528) 1,681 (41,469) (45,521)
Interest and investment income (714) (138) (1,212) (345) (2,585) (2,587)
Depreciation and amortization 91,700 93,035 78,286 72,073 80,792 87,159
EBITDA 461,992$ 125,600$ 131,923$ 116,398$ 115,276$ 117,506$
Impairments, disposition of assets and income (loss) from discontinued
operations and divested clubs(1) 12,119 10,880 26,351 14,214 12,452 13,716
(Gain) loss on extinguishment of debt(2) (334,423) - - 16,856 31,498 31,498
Non-cash adjustments(3) (1,881) (37) 1,865 3,929 2,007 2,008
Other adjustments(4) 2,920 15,574 3,237 10,134 25,315 27,630
Equity-based compensation(5) - - - 14,217 4,303 4,573
Acquisition adjustment(6) 9,274 5,006 2,560 1,306 5,644 6,425
Adjusted EBITDA 150,001$ 157,023$ 165,936$ 177,054$ 196,495$ 203,356$
Adjusted EBITDA by Segment:
Golf and Country Clubs 151,148$ 156,001$ 168,491$ 180,208$ 203,415$ 212,065$
Business, Sports and Alumni Clubs 30,253 32,523 34,105 34,350 35,160 36,307
Other (31,400) (31,501) (36,660) (37,504) (42,080) (45,016)
Adjusted EBITDA 150,001$ 157,023$ 165,936$ 177,054$ 196,495$ 203,356$

29
CALCULATION OF FREE CASH FLOWRECONCILIATION OF NON-GAAP MEASURES TO CLOSEST GAAP MEASURE
(1) See the Adjusted EBITDA reconciliation in the preceding slide.
(2) Interest on long-term debt excludes accretion of discount on member deposits, amortization of debt issuance costs, amortization of term loan discount and interest on notes payable related to certain realty interests which we define as “Non-Core
Development Entities”.
4Q13 1Q14 2Q14 3Q14 4Q14 1Q15
LTM LTM LTM LTM LTM LTM
Adjusted EBITDA (1) 177,054$ 179,345$ 183,355$ 187,255$ 196,495$ 203,356$
LESS:
Interest expense and principal amortization on long-term debt (2) 61,317 56,660 51,776 44,370 40,912 41,142
Cash paid for income taxes 3,187 3,192 4,162 2,796 2,723 2,683
Maintenance capital expenditures 23,831 24,279 27,730 28,162 29,067 32,507
Capital lease principal & interest expense 11,885 12,190 12,197 12,436 13,799 14,938
Free Cash Flow 76,834$ 83,024$ 87,490$ 99,491$ 109,994$ 112,086$
(1)

30