Gold, Platinum and Diamond placer deposits in …of gold grains can be used to provide an estimate...
35
Special Report 89 Gold, Platinum and Diamond Placer Deposits in Alluvial Gravels, Whitecourt, Alberta
Transcript of Gold, Platinum and Diamond placer deposits in …of gold grains can be used to provide an estimate...

Special Report 89
Gold, Platinum and Diamond Placer Deposits in Alluvial Gravels, Whitecourt, Alberta

Special Report 89
Gold, Platinum and Diamond Placer Deposits in Alluvial Gravels, Whitecourt, Alberta
G.G. Mudaliar1, J.P. Richards1 and D.R Eccles2 1 Department of Earth & Atmospheric Sciences, University of Alberta 2 Alberta Geological Survey
May 2007

EUB/AGS Special Report 89 (May 2007) • ii
©Her Majesty the Queen in Right of Alberta, 2007 ISBN 0-7785-3851-6 The Alberta Geological Survey and its employees and contractors make no warranty, guarantee or representation, express or implied, or assume any legal liability regarding the correctness, accuracy, completeness, or reliability of this publication. Any digital data and software supplied with this publication are subject to the licence conditions (specified in 'Licence Agreement for Digital Products'"). The data are supplied on the understanding that they are for the sole use of the licensee, and will not be redistributed in any form, in whole or in part, to third parties. Any references to proprietary software in the documentation, and/or any use of proprietary data formats in this release does not constitute endorsement by the Alberta Geological Survey of any manufacturer's product.
This product is an EUB/AGS Special Report; the information is provided as received from the author and has had minimal editing for conformity to EUB/AGS standards.
When using information from this publication in other publications or presentations, due acknowledgment should be given to the Alberta Geological Survey/Alberta Energy and Utilities Board. The following reference format is recommended:
Mudaliar, G.G., Richards, J.P. and Eccles, D.R. (2007): Gold, platinum and diamond placer deposits in alluvial gravels, Whitecourt, Alberta; Alberta Energy and Utilities Board, EUB/AGS, SPE 089, 24 p.
Author addresses: Geoffrey G. Mudaliar Department of Earth and Atmospheric Sciences Earth Sciences Building University of Alberta Edmonton, Alberta Canada, T6G 2E3 E-mail: [email protected] Jeremy P. Richards Department of Earth and Atmospheric Sciences Earth Sciences Building University of Alberta Edmonton, Alberta Canada, T6G 2E3 (780) 492-3430 E-mail: [email protected] Published May 2007 by: Alberta Energy and Utilities Board Alberta Geological Survey 4th Floor, Twin Atria Building 4999 – 98th Avenue Edmonton, Alberta T6B 2X3 Tel: (780) 422-1927 Fax: (780) 422-1918 Website: www.ags.gov.ab.ca

EUB/AGS Special Report 89 (May 2007) • iii
Contents
Contents ......................................................................................................................................................iii Acknowledgments .......................................................................................................................................v Abstract.......................................................................................................................................................vi 1 Introduction.................................................................................................................................................1 2 Background.................................................................................................................................................1 3 Geological History .......................................................................................................................................2 4 Analytical Procedures .................................................................................................................................5
4.1 Electron Microprobe Analysis (EMPA) .....................................................................................................5 4.2. Scanning Electron Microscopy (SEM).....................................................................................................5
5. Results .......................................................................................................................................................8 5.1 Mineralogy............................................................................................................................................8 5.2 Placer Gold and Platinum.....................................................................................................................12
5.2.1 Grain Morphology and Classification...........................................................................................13 5.2.2 Morphology of Gold Grains from Whitecourt ................................................................................14 5.2.3 Morphology of Platinum Grains ..................................................................................................15 5.2.4 Rimming of Gold Grains ............................................................................................................18 5.2.5 Gold Alloys with Copper and Silver .............................................................................................18 5.2.6 Micro-Inclusions in Gold Grains..................................................................................................20
5.3 Native Lead Pseudomorphs of Organic Material .....................................................................................21 5.4 Diamonds and Garnet ..........................................................................................................................22
6 Discussion ...............................................................................................................................................22 6.1 Distance Transported...........................................................................................................................22 6.2 Possible Sources of Placer Minerals .....................................................................................................24
7 Conclusions ..............................................................................................................................................26 8 References ................................................................................................................................................26 Tables Table 1. Weight per cent of alloys in gold grains as determined by electron microprobe analysis. ............. 6 Table 2. Weight percentages of almandine garnet as determined by electron microprobe analysis............. 7 Table 3. The Empirical Shape Classification System of mineral grains from Knight et al. (1999)............ 14 Figures Figure 1. The municipality of Whitecourt, Alberta, is located directly south of the study area. Major river
systems (Athabasca and McLeod rivers) supplying sediment to the area are highlighted................... 3 Figure 2. Stratigraphy of the central plains region Edmonton Group (Srivastava, 1994, reproduced with
permission by the Review of Palaeobotany and Palynology). ............................................................. 4 Figure 3. A colour-shifted image of the nonmetallic epoxy resin sample (RE1-NM) under EMPA
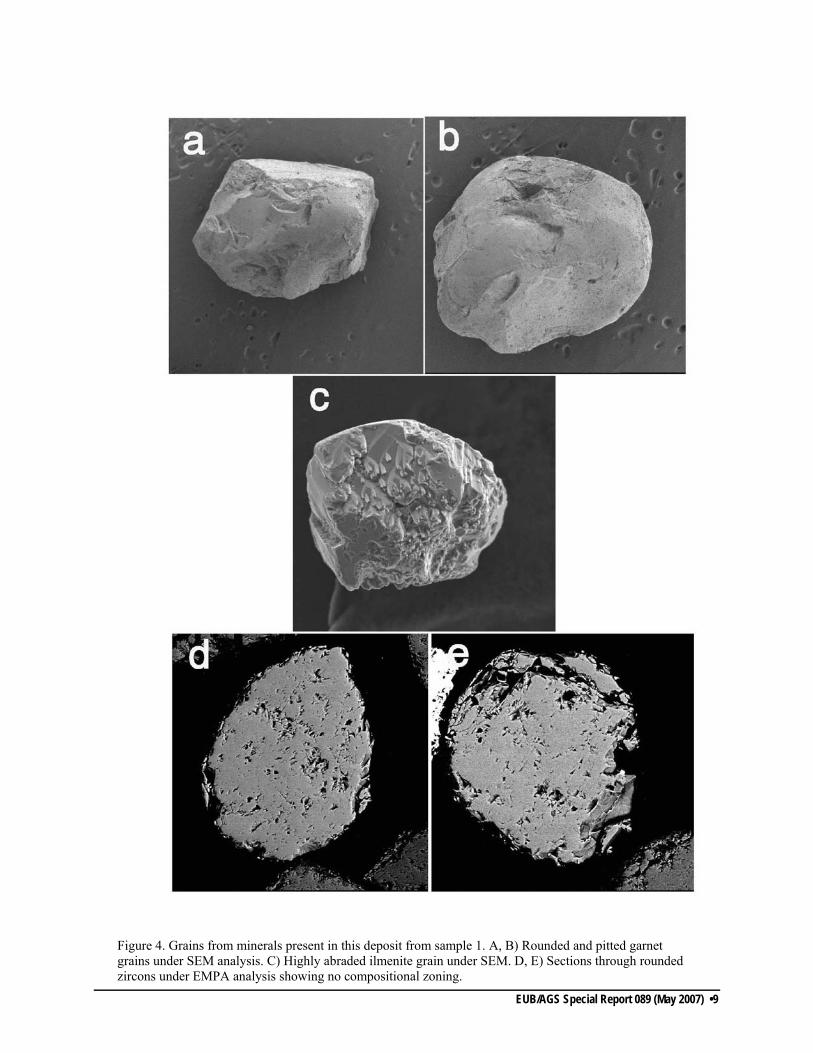
analysis. ................................................................................................................................................ 8 Figure 4. Grains from minerals present in this deposit from sample 1. A, B) Rounded and pitted garnet
grains under SEM analysis. C) Highly abraded ilmenite grain under SEM. D, E) Sections through rounded zircons under EMPA analysis showing no compositional zoning. ........................................ 9
Figure 5. Epoxy resin mounts taken under reflective microscopy; they display the majority of grains within the samples. A) Scattered occurrences of smaller gold, magnetite/ilmenite, zircon and monazite grains next to a larger piece of copper wire. B, C) The same assortment of mineral grains, this time surrounding large almandine grains. D) A section through a folded and unfolded gold grain. E) Gold caught in the surface of an iron-oxide grain, most likely magnetite. ......................... 10

EUB/AGS Special Report 89 (May 2007) • iv
Figure 6. SEM images of pyrite and zircon within sample 2. A) Rhombic pyrite cube with sharp features and edges showing only slight wear. B) Rounded pyrite grain with some relict cubic features. C) Zircon with some preserved crystal faces and slightly rounded edges, likely of metamorphic origin. D, E) Heavily abraded zircon with elongate, prismatic habits, likely of magmatic origin. ............... 11
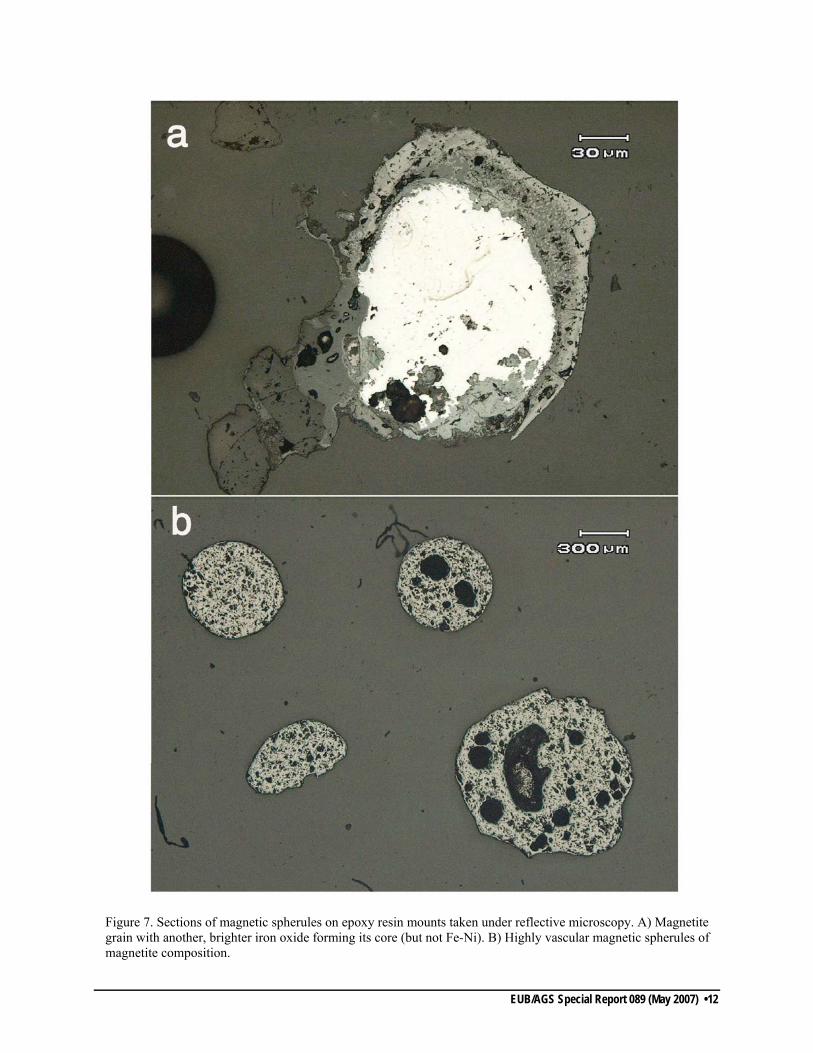
Figure 7. Sections of magnetic spherules on epoxy resin mounts taken under reflective microscopy. A) Magnetite grain with another, brighter iron oxide forming its core (but not Fe-Ni). B) Highly vascular magnetic spherules of magnetite composition. .................................................................... 12
Figure 8. Gold grains and their textures from sample RE1-NM. A) Flattened gold grain morphology. B) Average gold grain morphology. C) Folded gold grain. D) Grooves and gouging in gold grain surface. E) Etch pits on surface of gold grain. F) Crevasse-resembling cavity on the surface of gold grain.................................................................................................................................................... 15
Figure 9. SEM photographs of the contrasting gold grains in sample 2. A) A much larger, thicker 'nuggety' appearing gold grain. B) A 1.3 mm thick gold grain with smaller grains of quartz and zircons. C) Thick gold grain with an appearance similar to that of A). D) A highly folded and hammered gold grain. E) A small 0.35 mm gold grain alongside smaller gold grains, zircon and monazite. F) Highly deformed and flattened gold grain enclosing a grain of monazite. ................... 16
Figure 10. SEM photographs of platinum grains from sample 2. A, B, C) Platinum with similar morphologies to gold. D) A highly deformed, flattened and folded platinum grain with a relatively irregular form. .................................................................................................................................... 17
Figure 11. Evidence of supergene mineralization revealed in SEM imaging and reflective microscopy. A) SEM image showing gold with iron staining showing up as darker patches. B) SEM image of a gold grain with cerussite overgrowths and some minor inclusions of platinum. C, D) Lead dendrite section viewed under reflective microscopy and displaying extensive tarnishing of the silvery surface, which occurs only hours after polishing. E) Typical sharp and discontinuous rimming found in gold grains of this sample as revealed by EMPA analysis. Bright areas indicate gold refinement............................................................................................................................................................. 19
Figure 12. Ternary Au-(Ag x 10)-(Cu x 100) plot showing compositions of gold grains from Whitecourt placers, and the compositional ranges of placer gold from various source deposit types (from Townley et al., 2003). The composition of gold from mesothermal deposits likely overlaps the porphyry gold field (B. Townley, pers. comm., 2007)....................................................................... 20
Figure 13. SEM photographs of the typical ‘inclusions’ within the gold grains of these samples. A) A gold grain with small particles of quartz scattered across the surface. B) Small quartz grain on the surface of a gold grain appearing white in contrast to the darker gold. C) Quartz imbedded into the surface of a gold grain. D) Monazite on the surface of a gold grain. ............................................................. 21
Figure 14. Roundness versus flatness and flatness versus distance curves as proposed by Knight et al. (1999). Reproduced with permission by Economic Geology. ........................................................... 23

EUB/AGS Special Report 89 (May 2007) • v
Acknowledgments
We thank Terry and Wayne Kozak for contributing the samples used in this study and providing an opportunity to conduct this research. The historical background of the study has benefited by the works of Art Sweet (Geological Survey of Canada), who conducted palynological research to constrain the age of sediments and coal at the base of, and intercalated within, the Whitecourt gravels. Grant Ferguson assisted with preparation of the figures. Finally, we thank the Review of Palaeobotany and Palynology, and Economic Geology for granting permission to reproduce copyrighted material (Figures 2 and 14, and Table 3 in our study).

EUB/AGS Special Report 89 (May 2007) • vi
Abstract
Placer gold, platinum and rare diamonds have been found in gravel deposits on the northern outskirts of Whitecourt, north-central Alberta. These deposits are currently being worked for their cobble and gravel components, but test circuits have been set up to recover heavy minerals from the gravel washings. These minerals are recovered by various density-sensitive methods, such as a jig concentrator, shaking table, spiral concentrator and Knelson concentrator. Quartz, almandine garnet, magnetite, ilmenite, hematite, gold, zircon and monazite were the main minerals identified in these concentrates during this study, along with minor amounts of platinum, pyrite, dolomite, calcite, cerussite, lead, rutile, chromite and barite. Rare diamonds recovered from other samples were also shown to us, but not recovered from the samples used in this study. A scanning electron microscope was used to determine the general morphological features of the heavy mineral grains, such as the degree of rounding, flattening and etching. These observations provided a qualitative measure of the degree of transport of grains and their environment of transport and deposition. Gold grains ranged in size between 0.1 and 1.5 mm. Quantitative analyses of mineral grains were conducted with an electron microprobe. The fineness of the gold ranged between 550 and 790 in the cores of grains, but sharply defined rims had a much higher fineness of 940–980, with <0.1 wt. % Cu. These gold-grain compositions, as well as a number of the accompanying mineral constituents, indicate the gold is likely of epithermal, or possibly mesothermal, origin. Knight et al. (1999) have detailed a method whereby the flatness (ratio of length and breadth to thickness) of gold grains can be used to provide an estimate of the transport distance. The flatness ratio of grains from this study ranges between 40% and 50%, which suggests quite close derivation from as little as 3 to 8 km away. Viable sources of alluvial placer gold in Western Canada have yet to be identified. Similarly, the lack of diamond indicator minerals in this deposits provides no clues as to the source(s) of the diamonds.

EUB/AGS Special Report 089 (May 2007) •1
1 Introduction The association of platinum with placer gold was first reported from the North Saskatchewan River near Edmonton, Alberta, in 1893. Since this time, the lure of gold and platinum, in conjunction with the potential for alluvial diamonds given the 1990s discovery of diamondiferous kimberlites in northern Alberta, has prompted a small but steadfast scattering of river and land-based (sand and gravel) precious metal operations throughout Alberta (e.g., Edwards, 1990; Eccles et al., 2005). However, the primary source(s) of these minerals is unknown. Many of these alluvial deposits near population centres are worked commercially for sand and gravel, and some operators extract small amounts of gold during washing of the product (similar operations have been reported from the European Union; Viladevall et al., 2006). One such case occurs near Whitecourt, Alberta, where alluvial deposits are worked for materials ranging from sand through cobble-sized aggregate (Peterson, 1980). Recently, one of the Whitecourt pit operators, Gila River Mining Inc., has turned its attention to the additional potential of the heavy mineral component of these deposits, which can readily be separated from the lighter aggregate materials with a jig and then further processed. In addition to large amounts of iron oxides and garnet, gold, rare platinum, and very rare diamonds have been extracted from this heavy mineral fraction at the pit of interest in this study (T. Kozak, pers. comm., 2005).
2 Background Gold deposits commonly occur either as primary lode deposits in the bedrock, or as surficial placer deposits resulting from erosional reworking of bedrock sources. Lode gold deposits are formed by the flow of hydrothermal fluids, and commonly take the form of veins, stockworks, pipes and breccias, typically containing associated tungsten, arsenic and tin (Johnson and McQueen, 2001; Garnett and Basett, 2005). Placer deposits are formed by selective concentration of the heavy mineral components (i.e., minerals with specific gravity greater than that of quartz = 2.65) of eroded bedrock deposits within river systems and shorelines. To survive the erosional environment, these minerals must also be durable and chemically inert, such that sulphide minerals (which are commonly soft and readily oxidized) are rarely preserved. The minerals of prime economic importance in placers are gold, diamond, platinum, cassiterite, rutile, zircon, monazite, quartz, garnet, ilmenite and magnetite. Placer deposits are quite variable in size, ranging from 10s to 1000s of metres in width, and with pay streaks of 1 to 10s of metres thickness, typically occurring immediately above bedrock (Garnett and Basett, 2005). Historically, placer deposits have been responsible for 34% of diamond and 69% of gold production worldwide (Sutherland, 1985), as well as major sources of other minerals, such as platinum group elements (PGEs) and cassiterite (Garnett and Basett, 2005). Much of this gold, with the exception of the giant Witwatersrand deposits in South Africa (argued by some to be paleoplacer deposits, but hydrothermal deposits by others; see review by Muntean et al., 2004) has been retrieved from preglacial gravels by washing operations (Godfrey, 1985). Many classic gold rushes, such as the Klondike, focused on especially rich placer deposits in active river systems, but these deposits are small by modern mining standards, and environmental concerns now restrict extraction from many rivers. Low concentrations of heavy minerals in gravel deposits are generally overlooked by modern gravel pit operators, and precious minerals are therefore not recovered during aggregate processing. The value of placer minerals recovered from such operations accounts for only ~1% of today’s gold production. The focus of large-scale placer mining is for diamonds, zircon and rutile/ilmenite (exploited for titanium; Garnett and Basett, 2005). Primary gold deposits are found to occur in many different settings all over the world. The main deposit types occur in Precambrian shields, Paleozoic fold belts and Mesozoic or Quaternary volcanic arcs (Meju, 2002). Each type of occurrence involves an associated suite of heavy ore minerals, which, if preserved

EUB/AGS Special Report 089 (May 2007) •2
along with the gold in placers, can provide an indication of the type of primary deposit that sourced the placers. Placer deposits may be classified according to their age, size, means of formation, dominant mineralogy, physical and chemical characteristics, and geomorphological form (Garnett and Basett, 2005). The most commonly used classification scheme is based on deposit geomorphology that includes residual, eluvial, stream/alluvial, eolian, glacial stream and beach placers (Garnett and Basett, 2005). Sutherland (1985) used three primary variables that influence landforms to describe the processes inherent in placer formation: tectonic regime, composition of the substrate and climate – the latter being the strongest control on geomorphological processes. A fourth factor proposed by Garnett et al. (2005) in placer formation is that of changes in relative sea level. In Canada, the three main sources of bedrock gold are the Precambrian Shield, Paleozoic mineralization within old mountain chains and Mesozoic and Cenozoic mountain chains (Sutherland et al., 1985). Placer deposits formed from old mountain ranges are typically Mesozoic and early Tertiary worldwide, whereas, placers formed from younger mountain ranges are typically Quaternary.
3 Geological History This study focuses on a gravel quarry on the northern outskirts of Whitecourt, Alberta, which is located 160 km northwest of Edmonton in the central plains area of Alberta (Figure 1). The quarry is owned by ELP Construction Services Ltd. with Gila River Mining Inc. acting as quarry contractor. The gravel deposit has been divided into three benches for mining purposes, which mimic the terraces of the alluvial deposit itself. These terraces were left along the original valley sides as the river cut down to lower levels (Garnett and Basett, 2005). The first, uppermost bench is located 45 m above bedrock, which is observed at the bottom of the third, lowermost bench. While Gila River Mining Inc.’s primary interest has been cobble and gravel mining, they operate a self-designed heavy mineral jig, samples from which form the basis of this report. The stratigraphy of the area is shown in Figure 2. Regionally, the Tertiary Paskapoo and Late Cretaceous Battle, Whitemud and Wapiti formations form the bedrock for the Whitecourt gravel deposits, which are typically composed of weakly lithified sandstones and siltstones (Peterson, 1980; Hamilton et al., 1999). In this region of Canada, the Cretaceous and Tertiary periods were dominated by humid tropical conditions in mid to high latitudinal regions (Vail et al., 1977; Sutherland, 1985), which Garnett et al. (2005) suggested to be optimum conditions for maximum chemical weathering (whereas colder climates induce predominantly physical weathering). This chemical weathering could result in removal by dissolution of up to 40% of the bedrock before mechanical processes even came into effect, which would tend to concentrate resistant minerals. Sutherland (1985) noted that alternations between humid and arid climates, believed to occur at this time, would be favourable for a combination of deep chemical weathering, alternating with erosion of degraded bedrock and physical transport of heavy minerals, resulting in the formation of extensive placer deposits. The close of the Maastrichtian marked a drastic regression of the seas because of early mountain building (Srivastava, 1994). In particular, the Alberta Ocean had retreated from most of North America by the late Cretaceous, and remained only as local bodies of freshwater (Tyrell, 1915; Srivastava, 1994). Garnett et al. (2005) noted that many gold placers form in association with uplift and erosion of plutonic arcs caused by plate-boundary reorganization. Such a scenario likely applies in this region, with placer deposits forming in response to early uplift of the Cordillera. Locally, palynological work by Art Sweet (pers. comm., 2006) has determined that displaced (trenched or bulldozed) bedrock at the base of the gravel pit is latest Maastrichtian, equivalent to the Battle and/or

EUB/AGS Special Report 089 (May 2007) •3
Figure 1. The municipality of Whitecourt, Alberta, is located directly south of the study area. Major river systems (Athabasca and McLeod rivers) supplying sediment to the area are highlighted.

EUB/AGS Special Report 089 (May 2007) •4
Lower Scollard formations. In addition, palynological interpretation on coal fragments from the second bench suggest latest early Paleocene, possibly equivalent to the Upper Scollard. Preliminary observations at the gravel pit correlate with general descriptions of unconsolidated alluvium derived from the Scollard Formation, which consist predominantly of cobble-sized, well-rounded quartzite with fine to medium-coarse sand composing the matrix. Gravel lags are separated by layers of fine-grained and pebbly material representing periods of flooding. Channel deposits display classic fining-upward profiles, although they are generally only weakly to moderately sorted. This weak sorting is likely the result of turbulent flow, with high degrees of turbulence typically marked by a lack of sorting of any kind, even by density, such as in the alluvial braided river systems (Burton and Fralick, 2003). In summary, although it is difficult to identify the exact age of the gravel deposits because they are likely derived from multi-generational sources (D. Edwards, pers. comm., 2007), it is reasonable to assume the gravels are equivalent to the Scollard formations of late Upper Cretaceous.
Figure 2. Stratigraphy of the central plains region Edmonton Group (Srivastava, 1994, reproduced with permission by the Review of Palaeobotany and Palynology).

EUB/AGS Special Report 089 (May 2007) •5
4 Analytical Procedures A combination of electron microprobe analysis (EMPA) and scanning electron microscope (SEM) analysis was used to document the major and minor element compositions and the morphologies of the main constituents of the heavy mineral concentrates supplied by Gila River Mining. The shapes and grain sizes of placer minerals indicate of how far the material travelled from its source, and the composition of the minerals help identify the nature of that source. Fifteen samples of heavy mineral concentrate were provided by Gila River Mining Inc. These samples had undergone several steps of processing, including separation by screening of the gravel and cobble component, followed by –5/16-inch screening. The undersized fraction was then passed over a jig, followed by a –1/8-inch screening. The final undersized fraction was subsequently passed over a shaking table, and then a spiral concentrator, to form a heavy mineral concentrate of black sand and garnet, in which gold and other precious metals were concentrated. The overflow from the shaking table was then run through a Knelson concentrator whose discharge chute was coated in grease to catch any diamonds that could not be collected in the Knelson. This multi-step process was essential for the recovery of significant concentrations of the rare minerals, whereas a simple sluice box method would result in loss of an unknown amount of precious minerals (Godfrey, 1985). In particular, Godfrey (1985) and Morton et al. (1993) noted that a large degree of the fine-grained ‘flour’ gold (>100 grit, 0.1 to 0.5 mm), which is prominent in the Alberta gravel deposits, is lost during processing even when using more advanced techniques. The samples were further processed in a lab by using a hand magnet to remove the bulk of magnetic minerals (mainly iron oxides and tramp metal). Representative splits of these samples were mounted in epoxy resin blocks and polished for inspection by reflected light microscopy, SEM and EMPA. A selection of grains of particular compositional or textural interest (e.g., habit, overgrowths, folding, etc.) were hand picked and mounted on specimen stubs with conductive carbon tape for SEM analysis.
4.1 Electron Microprobe Analysis (EMPA) An initial qualitative analysis using energy dispersive spectroscopy of all polished sample blocks was conducted to establish homogeneity within the sample and for quick identification of the mineral population. This was followed by quantitative analysis by wavelength dispersive spectroscopy of the primary minerals of interest; namely, gold, garnets and magnetite/ilmenite; platinum was also sought by EMPA but not detected. Analyses were conducted using a JEOL JXA-8900R electron microprobe at the University of Alberta. The conditions used for these analyses were an accelerating voltage of 20 kV and a beam current of 100 nA. Counting times were 20.0 seconds on peak and 10.0 seconds on each background. The standards used for gold analysis were pure metals and diopside for silica. The standards used for analysis of garnets and ilmenite/magnetite were natural Smithsonian mineral standards (Jarosewich, 2002). The results of the quantitative analyses are listed in Tables 1 and 2. Elemental concentrations were calculated using φ (Pz) corrections (Armstrong, 1995). 4.2. Scanning Electron Microscopy (SEM) Scanning electron microscopy was used primarily to image the gold, zircon and some garnet grains to characterize their micromorphology, but the analytical capabilities of the SEM were also used to detect small amounts of platinum in some samples. For these purposes, a group of the most representative grains were handpicked, with the aid of a binocular microscope, and mounted individually or in small groups on stubs. Gold samples were coated with chrome (15 Å thicknesses) and other minerals with gold (150 Å). Initial photographs were taken using an accelerating voltage of 5 kV with detailed images taken under an

EUB/AGS Special Report 089 (May 2007) •6
Table 1. Weight per cent of alloys in gold grains as determined by electron microprobe analysis.
Number
Silicon Dioxide (SiO2)
Silver (Ag)
Gold (Au)
Copper(Cu) Total Comment
1 0.04 29.54 68.96 0.00 98.54 RE1-NM Au-Ag 1-1 2 0.02 29.29 70.60 0.01 99.92 RE1-NM Au-Ag 1-2 3 0.28 29.28 69.40 0.00 98.96 RE1-NM Au-Ag 1-3 4 0.02 14.54 87.41 0.00 101.97 RE1-NM Au-Ag 2-1 5 0.04 14.62 87.04 0.00 101.70 RE1-NM Au-Ag 2-2 6 0.03 14.33 87.52 0.01 101.89 RE1-NM Au-Ag 2-3 7 0.22 0.68 104.05 0.01 104.95 RE1-NM Au-Ag 2-rim 8 0.06 0.10 103.18 0.08 103.42 RE1-NM Au-Ag 2-rim 9 0.03 0.09 103.12 0.19 103.43 RE1-NM Au-Ag 2-rim 10 0.02 3.17 102.01 0.05 105.24 RE1-NM Au-Ag 2-rim 11 0.03 2.12 102.46 0.15 104.76 RE1-NM Au-Ag 3-gold-1 12 0.02 2.10 101.59 0.17 103.88 RE1-NM Au-Ag 3-gold-2 13 0.04 1.74 101.76 0.11 103.64 RE1-NM Au-Ag 3-gold-3 14 0.02 16.62 86.13 0.04 102.81 RE1-NM Au-Ag 4-3031-med 15 0.02 16.84 86.32 0.01 103.19 RE1-NM Au-Ag 4-3031-med 16 0.03 15.50 86.83 0.00 102.36 RE1-NM Au-Ag 4-3031-med 17 0.09 12.68 91.70 0.02 104.49 RE1-NM Au-Ag 4-3031-dark 18 0.44 19.65 81.28 0.03 101.40 RE1-NM Au-Ag 4-3031-dark 19 6.17 5.87 87.44 0.02 99.50 RE1-NM Au-Ag 4-3031-light 20 0.03 6.35 97.68 0.02 104.08 RE1-NM Au-Ag 4-3031-light 21 0.02 6.42 97.22 0.09 103.75 RE1-NM Au-Ag 4-3031-light 22 0.03 6.48 98.54 0.04 105.09 RE1-NM Au-Ag 4-3031-light 23 0.03 15.84 88.56 0.01 104.43 RE1-NM Au-Ag 5-3032-core (dark) 24 0.02 22.93 80.04 0.00 102.99 RE1-NM Au-Ag 5-3032-core (dark) 25 0.04 21.82 79.29 0.00 101.15 RE1-NM Au-Ag 5-3032-core (dark) 26 0.04 0.33 105.11 0.02 105.50 RE1-NM Au-Ag 5-3032-rim (light) 27 0.03 0.39 106.79 0.04 107.25 RE1-NM Au-Ag 5-3032-rim (light) 28 0.07 0.63 97.80 0.02 98.52 RE1-NM Au-Ag 5-3032-rim (light) 29 0.15 0.28 104.94 0.02 105.39 RE1-NM Au-Ag 5-3032-rim (light) 30 0.02 26.17 75.99 0.00 102.18 RE1-NM Au-Ag 5-3032-2nd grain dark 31 0.02 29.67 72.65 0.00 102.34 RE1-NM Au-Ag 5-3032-2nd grain dark 32 0.19 23.25 78.07 0.00 101.51 RE1-NM Au-Ag 5-3032-2nd grain dark 33 0.06 0.54 79.65 0.00 80.25 RE1-NM Au-Ag 5-3032-2nd grain rim 34 0.02 1.59 104.07 0.07 105.75 RE1-NM Au-Ag 6-1 35 0.03 2.11 102.97 0.10 105.21 RE1-NM Au-Ag 6-2 36 0.03 15.85 87.38 0.04 103.29 RE1-NM Au-Ag 7-1 37 0.01 20.43 81.71 0.02 102.18 RE1-NM Au-Ag 7-2 38 0.01 19.84 82.37 0.00 102.22 RE1-NM Au-Ag 7-3 39 0.04 0.99 102.58 0.09 103.70 RE1-NM Au-Ag 8-1 40 0.04 1.20 103.10 0.09 104.43 RE1-NM Au-Ag 8-2 41 0.04 2.06 102.83 0.14 105.07 RE1-NM Au-Ag 8-3 42 0.04 1.99 100.54 0.16 102.73 RE1-NM Au-Ag 8-4 43 0.03 2.09 101.90 0.13 104.15 RE1-NM Au-Ag 8-5
Minimum 0.01 0.00 0.00 0.00 80.25 Maximum 39.32 29.67 106.79 0.19 107.25 Average 16.56 6.03 51.85 0.03 101.82 Sigma 18.82 9.26 46.53 0.05 3.15

EUB/AGS Special Report 089 (May 2007) •7
Table 2. Weight percentages of almandine garnet as determined by electron microprobe analysis. Number TiO2 Na2O P2O5 SiO2 NiO Cr2O3 MgO CaO Al2O3 FeO K2O MnO Total Comment
1 0.02 0.00 0.04 39.32 0.00 0.09 10.51 1.31 23.19 24.74 0.00 0.47 99.68 GM1NM Gar1-1 2 0.04 0.03 0.08 39.04 0.00 0.08 10.61 1.32 23.33 25.31 0.00 0.44 100.28 GM1NM Gar1-2 3 0.03 0.02 0.07 39.15 0.00 0.10 10.79 1.41 23.41 24.97 0.00 0.42 100.37 GM1NM Gar1-3 4 0.03 0.00 0.06 39.11 0.00 0.07 10.84 1.37 23.46 26.15 0.00 0.44 101.52 GM1NM Gar1-4 5 0.07 0.02 0.00 37.52 0.02 0.02 2.16 6.51 22.18 31.90 0.00 1.34 101.74 GM1NM Gar2-1 6 0.10 0.01 0.01 37.17 0.00 0.04 2.16 6.72 22.14 31.75 0.00 1.05 101.15 GM1NM Gar2-2 7 0.06 0.00 0.00 37.30 0.00 0.02 2.53 6.64 22.14 32.02 0.00 0.75 101.46 GM1NM Gar2-3 8 0.01 0.02 0.00 36.97 0.00 0.01 3.25 2.75 22.22 35.79 0.00 0.23 101.26 GM1NM Gar3-1 9 0.00 0.02 0.00 37.22 0.00 0.01 3.19 2.66 22.32 35.78 0.00 0.21 101.41 GM1NM Gar3-2 10 0.03 0.01 0.00 36.68 0.01 0.01 3.39 2.14 22.10 36.26 0.00 0.18 100.80 GM1NM Gar3-3 11 0.00 0.02 0.01 38.97 0.00 0.05 9.75 1.47 23.21 27.68 0.00 0.53 101.69 GM1NM Gar4-1 12 0.02 0.00 0.01 38.80 0.00 0.06 9.56 1.69 23.15 27.73 0.00 0.54 101.56 GM1NM Gar4-2 13 0.01 0.01 0.03 38.88 0.01 0.07 9.58 1.57 23.17 27.67 0.00 0.54 101.55 GM1NM Gar4-3 14 0.05 0.01 0.04 37.76 0.01 0.11 7.49 1.86 22.60 30.77 0.00 0.42 101.11 GM1NM Gar5-1 15 0.04 0.02 0.04 37.93 0.00 0.06 7.52 1.86 22.59 30.43 0.01 0.39 100.89 GM1NM Gar5-2 16 0.07 0.00 0.02 37.84 0.00 0.09 7.50 1.85 22.54 30.24 0.00 0.44 100.59 GM1NM Gar5-3 17 0.09 0.03 0.01 37.11 0.00 0.00 2.42 4.66 22.30 34.50 0.00 0.42 101.54 GM1NM Gar6-1 18 0.05 0.02 0.02 37.27 0.00 0.00 2.42 4.41 22.17 34.46 0.00 0.57 101.39 GM1NM Gar6-2 19 0.07 0.02 0.03 37.47 0.01 0.00 2.49 4.34 22.86 34.43 0.00 0.44 102.17 GM1NM Gar6-3 20 0.05 0.00 0.02 38.69 0.01 0.04 11.78 1.33 23.36 25.27 0.00 0.23 100.78 GM1NM Gar7-1 21 0.03 0.00 0.00 38.59 0.01 0.08 11.67 1.28 23.12 25.12 0.00 0.22 100.12 GM1NM Gar7-2 22 0.02 0.02 0.03 38.59 0.00 0.06 11.71 1.23 23.14 25.14 0.00 0.24 100.17 GM1NM Gar7-3 23 0.27 0.03 0.00 36.62 0.01 0.04 4.21 2.55 22.38 33.88 0.00 0.64 100.63 GM1NM Gar8-1 24 0.00 0.00 0.00 37.66 0.01 0.00 4.63 2.54 22.71 33.60 0.00 0.68 101.83 GM1NM Gar8-2 25 0.02 0.00 0.00 37.69 0.01 0.00 4.69 2.48 22.43 33.51 0.00 0.67 101.50 GM1NM Gar8-3 26 0.08 0.02 0.02 36.83 0.00 0.00 2.18 7.33 21.14 31.69 0.01 1.04 100.35 GM1NM Gar9-1 27 0.06 0.03 0.03 37.04 0.01 0.01 2.23 7.23 21.26 31.56 0.00 1.06 100.52 GM1NM Gar9-2 28 0.04 0.00 0.00 36.70 0.01 0.00 2.18 7.06 21.12 31.62 0.01 1.08 99.83 GM1NM Gar9-3 29 0.05 0.01 0.07 38.14 0.00 0.07 9.62 2.31 22.64 26.70 0.00 0.48 100.09 GM1NM Gar10 core to rim 30 0.03 0.04 0.00 38.18 0.01 0.09 9.51 2.27 22.67 26.64 0.00 0.46 99.89 GM1NM Gar10 core to rim 31 0.04 0.00 0.02 38.31 0.00 0.02 9.45 2.24 22.66 26.97 0.00 0.50 100.22 GM1NM Gar10 core to rim 32 0.03 0.00 0.03 37.92 0.00 0.07 7.68 2.20 22.77 29.31 0.00 0.53 100.54 GM1NM Gar10 core to rim 33 0.05 0.02 0.01 37.42 0.00 0.01 6.59 2.14 22.48 30.75 0.00 0.65 100.12 GM1NM Gar10 core to rim

EUB/AGS Special Report 089 (May 2007) •8
accelerating voltage of 20 kV. The instrument used was a JEOL JSM 6301 FXV at the University of Alberta.
5. Results 5.1 Mineralogy The mineral suite of the Whitecourt gravel concentrate samples, as determined from visual inspection, reflected light microscopy and EMPA analysis, was quartz, almandine garnet, magnetite, ilmenite, hematite, gold, zircon and monazite, in decreasing abundance, respectively. Rarer occurrences of platinum, pyrite, dolomite, calcite, cerussite, lead, rutile, chromite and barite were also observed. SEM and backscattered secondary electron images of some of the mineral fractions are shown in Figures 3 and 4, and reflected light photomicrographs are shown in Figure 5. Most nonmetallic mineral grains in these deposits display abundant abrasional features, such as rounding, pitting, grooves and cavities. The only exceptions were zircons and rare pyrite recovered from a later sample from the same deposit, where equant, elongate zircon grains and pyrite cubes is observed (Figure 6). Of note was the appearance of numerous, small magnetic spherules within these samples composed primarily of magnetite and hematite, which have also been reported from many other placers in Alberta (Figure 7). These magnetic spherules have been inferred to be of extraterrestrial origin and to be the relict portions of melted meteoroids (Bi, 1993; Bi and Morton, 1995). These authors found rare spherules with Ni-rich cores, but no such cores were observed in the samples analyzed here.
Figure 3. A colour-shifted image of the non-metallic epoxy resin sample (RE1-NM) under EMPA analysis.
EUB/AGS Special Report 089 (May 2007) •9
Figure 4. Grains from minerals present in this deposit from sample 1. A, B) Rounded and pitted garnet grains under SEM analysis. C) Highly abraded ilmenite grain under SEM. D, E) Sections through rounded zircons under EMPA analysis showing no compositional zoning.

EUB/AGS Special Report 089 (May 2007) •10
Figure 5. Epoxy resin mounts taken under reflective microscopy; they display the majority of grains within the samples. A) Scattered occurrences of smaller gold, magnetite/ilmenite, zircon and monazite grains next to a larger piece of copper wire. B, C) The same assortment of mineral grains, this time surrounding large almandine grains. D) A section through a folded and unfolded gold grain. E) Gold caught in the surface of an iron oxide grain, most likely magnetite.

EUB/AGS Special Report 089 (May 2007) •11
Figure 6. SEM images of pyrite and zircon within sample 2. A) Rhombic pyrite cube with sharp features and edges showing only slight wear. B) Rounded pyrite grain with some relict cubic features. C) Zircon with some preserved crystal faces and slightly rounded edges, likely of metamorphic origin. D, E) Heavily abraded zircon with elongate, prismatic habits, likely of magmatic origin.
EUB/AGS Special Report 089 (May 2007) •12
Figure 7. Sections of magnetic spherules on epoxy resin mounts taken under reflective microscopy. A) Magnetite grain with another, brighter iron oxide forming its core (but not Fe-Ni). B) Highly vascular magnetic spherules of magnetite composition.
EUB/AGS Special Report 089 (May 2007) •13
5.2 Placer Gold and Platinum 5.2.1 Grain Morphology and Classification Gold grains, once released by erosion from their bedrock source, undergo physical attrition and deformation to a degree proportional to the distance of transport. Pure gold is a highly malleable mineral, and can therefore form many contrasting physical characteristics dependant on the original style of mineralization, the mode and distance of transportation, and any subsequent weathering. Measurements of the roundness, degree of bending, and flatness of grains can be made to constrain the source-type of gold and transportation distances (Knight et al., 1999; Lange and Gignoux, 1999; Patyk-Kara et al., 2001; McClenaghan, 2005). Grain morphology is typically described by four factors: flatness, roundness, shape on its preferred lying side, and surface texture (which describes only the surface and not the shape of the grain itself). Primary gold typically occurs as platy or elongate, square to rectangular, but very irregular shapes, and displays sharp contours and edges (Knight et al., 1999; Townley et al., 2003; McClenaghan, 2005; Nakagawa et al., 2005). As well, primary gold commonly displays flat, regular textures (in contrast to the etched and pitted textures shown by extensively travelled grains), and growth zoning may be discernable. As grains undergo secondary processes, rounding of their edges and smoothing of protrusions is observed, as well as an increase of flattening (with rounding occurring more rapidly than flattening for poorly rounded grains, and vice versa for well-rounded grains). As well, etch pits and striations begin to develop, and with increasing degrees of corrosion, these become large cavities that pock mark the smooth surface textures. It has been found that gold grains within 50 m of their source preserve a near identical shape to their primary equivalents (Townley et al., 2003). Secondary grains typically become elongated, even forming triangular shapes, within 50 to 300 m, and begin to show development of pits. Farther than 300 m from the source, the majority of primary features may have vanished altogether (Nakagawa et al., 2005). McClenaghan (2005) further subdivided the gold classification scheme into pristine, modified and reshaped grains, with pristine gold referring to primary gold grains, modified gold being a transitory state whereby some original textures are preserved, and reshaped being grains completely lacking original surface textures, and being indicative of appreciable transport. Most gold grains within the Whitecourt deposit adhere to the latter type and show extreme flattening and rounding, and extensive etching and gouging of surface features (Figures 3 to 5), although there are some occurrences of modified grains within the second gold sample. Knight et al. (1999) used a numerical table method, the Empirical Shape Classification System (ESCS), for distinctive classification of particular grain shapes and textures. Variation in shape during transport results from either hammering or abrasion, whereby hammering is significant in flattening and rounding, and abrasion appears to be the leading factor in rounding. Flattening of grains, a common feature of grains having undergone appreciable transport, is a consequence of the soft, malleable nature of gold. During transport, these gold grains collide with other rocks and harder minerals, resulting in a progressive increase in flattening as a function of distance from source (Knight et al., 1999; Townley et al., 2003). This flattening aspect is quantified by the equation:
(L+b) / 2t, where L is the length of the grain, b is the breadth, and t is thickness (Townley et al., 2003). It is noted that grain flatness in a given deposit may be somewhat variable, because larger grains (1–2 mm) tend to incur a larger degree of flattening than smaller grains (Knight et al., 1999). Although gold grain morphology has been determined to vary in a relatively consistent manner, minor discrepancies may occur due to armouring of gold by hostrock minerals, variations in original

EUB/AGS Special Report 089 (May 2007) •14
morphology of the primary grains, and secondary alteration in the weathering environment (Surour et al., 2003; McClenaghan, 2005). Despite these occasional inconsistencies, many studies have shown these changes in morphology are reliable indicators of the distance of transport and their environment (Knight et al., 1999; Townley et al., 2003). 5.2.2 Morphology of Gold Grains from Whitecourt Gold grains from the Whitecourt gravel deposit were examined in two separate samples taken from roughly the same location. The grains from sample 1 were typically very consistent. These grains displayed a high degree of rounding and flattening, typically ranged around 0.6 mm in size, and were extensively etched and gouged, in some cases to the extent of forming cavities. As well, these grains were extensively deformed, with folding and hammering of grains clearly evident and representative of the reshaped classification of gold grains with an ESCS number of approximately 160 (Figure 8). Gold grains from sample 2 were slightly more variable and showed a wider range of sizes from 0.1 to 1.5 mm (Figure 9). The small to intermediate-sized grains were similar to grains from sample 1, but the larger grains (≥0.8 mm) were thicker and displayed angular features, almost appearing to resemble ‘nuggets.’ These grains showed less intense abrasional features, such as grooves, etching and pitting, than in sample 1. Euhedral pyrite and equant zircons were recovered from this sample, which together imply the coarser grain fraction of the heavy minerals was derived from a closer source than the majority of the smaller grains.
Equant Elongate Complex Branched
B)
Shilo
Corey
Thickness of a flat- tened sphere (1 mm dia.)
Approximate Flatness Limits
0
1
1mm
3
0.35
0.3mm
6
0.2
0.15mm
A)
Angular
Irregular
Round
900
500
600
700
300
400
100
200
Thick Intermediate Thin
Flatness
Example
Rou
ndne
ss
Table 3. The Empirical Shape Classification System of mineral grains from Knight et al. (1999): A) flatness and roundness are used to form nine shape classes, each labeled by a 3-digit number; B) four particle outlines (as the particle lies on its preferred side), each labeled with a 2-digit number. Reproduced with permission by Economic Geology.

EUB/AGS Special Report 089 (May 2007) •15
Figure 8. Gold grains and their textures from sample RE1-NM. A) Flattened gold grain morphology. B) Average gold grain morphology. C) Folded gold grain. D) Grooves and gouging in gold grain surface. E) Etch pits on surface of gold grain. F) Crevasse-resembling cavity on the surface of gold grain.

EUB/AGS Special Report 089 (May 2007) •16
Figure 9. SEM photographs of the contrasting gold grains in sample 2. A) A much larger, thicker 'nuggety'-appearing gold grain. B) A 1.3 mm thick gold grain with smaller grains of quartz and zircons. C) Thick gold grain with an appearance similar to that of A). D) A highly folded and hammered gold grain. E) A small 0.35 mm gold grain alongside smaller gold grains, zircon and monazite. F) Highly deformed and flattened gold grain enclosing a grain of monazite.
EUB/AGS Special Report 089 (May 2007) •17
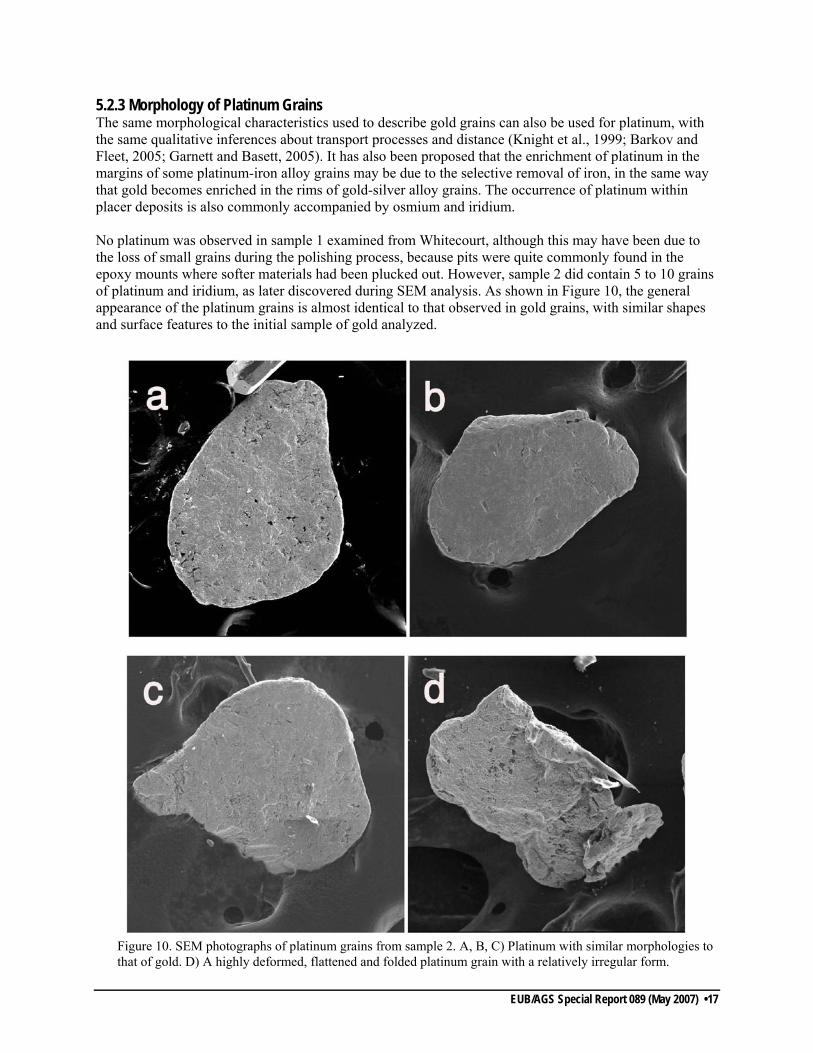
5.2.3 Morphology of Platinum Grains The same morphological characteristics used to describe gold grains can also be used for platinum, with the same qualitative inferences about transport processes and distance (Knight et al., 1999; Barkov and Fleet, 2005; Garnett and Basett, 2005). It has also been proposed that the enrichment of platinum in the margins of some platinum-iron alloy grains may be due to the selective removal of iron, in the same way that gold becomes enriched in the rims of gold-silver alloy grains. The occurrence of platinum within placer deposits is also commonly accompanied by osmium and iridium. No platinum was observed in sample 1 examined from Whitecourt, although this may have been due to the loss of small grains during the polishing process, because pits were quite commonly found in the epoxy mounts where softer materials had been plucked out. However, sample 2 did contain 5 to 10 grains of platinum and iridium, as later discovered during SEM analysis. As shown in Figure 10, the general appearance of the platinum grains is almost identical to that observed in gold grains, with similar shapes and surface features to the initial sample of gold analyzed.
Figure 10. SEM photographs of platinum grains from sample 2. A, B, C) Platinum with similar morphologies to that of gold. D) A highly deformed, flattened and folded platinum grain with a relatively irregular form.

EUB/AGS Special Report 089 (May 2007) •18
5.2.4 Rimming of Gold Grains It is common for gold in placer deposits, especially those quite far from their sources, to exhibit rims of purer gold 1–20 micrometres thick (Morton et al., 1993; Patyk-Kara et al., 2001; Mortensen et al., 2004). This rimming is the result of the different solubilities of gold and silver in the low temperature-weathering environment, which leads to preferential dissolution of silver leaving a purer gold residue (Townley et al., 2003; Nakagawa et al., 2005). The rims of higher purity gold are also referred to as being of high fineness, where fineness is calculated based upon the following equation:
1000 * wt. % Au / (wt. % Au + wt. % Ag). An alternative mechanism for the formation of gold-rich rims and grains is preferential reprecipitation of gold dissolved during the weathering process (Johnson and McQueen, 2001). As attested to by Nakagawa et al. (2005), the former process results in a concomitant decrease in grain size, whereas in the latter case there is an increase, with a progressive enrichment in gold toward the rims in both cases. The extensive degree of etching in the Whitecourt grains indicates they underwent significant chemical corrosion in the weathering environment. The absence of any lateritic clay or other mineral inclusions within these pits and cavities suggests this chemical weathering occurred postdepositionally, as opposed to premobilization, as indicated in the study of gold from the Attapadi Valley of southern India by Nakagawa et al. (2005). Quantitative SEM and EMPA analyses of gold grains from Whitecourt indicate negligible silver content in the rims (high fineness, between 940 and 980). Significant gold in the cores, which approach the composition of electrum, may indicate significant postdepositional gold enrichment (Table 1). These gold grains do not appear to display any evidence of in-situ growth, such as increase in grain size or colloform, mounded or euhedrally terminated (crystalline) growth, and thus the rimming is likely the result of preferential extraction during postdepositional weathering, a conclusion also supported by the extensive etching observed. Evidence for postdepositional supergene processes in these samples is provided by red, ferric iron-oxide staining on the surface of some grains, as well as rare overgrowths of cerussite containing minor platinum constituents (Figure 11).
5.2.5 Gold Alloys with Copper and Silver In addition to silver, other elements that form solid solutions with gold are copper, iron, mercury, bismuth, palladium and tellurium (Chapman et al., 2002; Townley et al, 2003; Mortensen et al, 2004; Nakagawa et al., 2005). The nature of elements found in solid solution with gold, and their relative abundances, typically signify the different hydrothermal fluid environments and deposit types, and can therefore provide an indication of source type for placer gold grains. Townley et al. (2003) attempted to characterize the composition of gold derived from three different sources: epithermal gold, porphyry gold and porphyry copper-gold deposits; their compositional ranges are shown in Figure 12. Gold grains derived from epithermal gold deposits are low in copper (usually <0.1 wt. %), and typically higher in silver (up to 5.0 wt. %). Gold-rich copper porphyries tend to produce gold relatively high in copper (0.3–0.8 wt. %), and from <1.0 to 6.0 wt. % gold. Gold porphyries tend to resemble epithermal deposits with the exception that they tend to be slightly more concentrated in copper (0.0–0.2 wt. %) and gold (1.5–8.0 wt. %). This suggests a useful discrimination tool for exploration of bedrock gold deposits from placer gold chemistry, but this method has not yet been extensively tested.

EUB/AGS Special Report 089 (May 2007) •19
Figure 11. Evidence of supergene mineralization revealed in SEM imaging and reflective micrscopy. A) SEM image showing gold with iron staining showing up as darker patches. B) SEM image of a gold grain with cerussite overgrowths and some minor inclusions of platinum. C, D) Lead dendrite section viewed under reflective microscopy and displaying extensive tarnishing of the silvery surface, which occurs only hours after polishing. E) Typical sharp and discontinuous rimming found in gold grains of this sample as revealed by EMPA analysis. Bright areas indicate gold refinement.

EUB/AGS Special Report 089 (May 2007) •20
Lange et al. (1999) alternatively proposed that pluton-hosted or slate-hosted gold deposits would likely host very high fineness gold, such as in the Ninemile Valley, Montana, where primary fineness varied from 913 to 991. Gold of this type is commonly associated with tungsten, bismuth, tellurium, molybdenum, arsenic and tin, and typically occurs as micrometre-sized grains. Electron microprobe analyses of gold grains from this study showed they were principally a solid solution of gold and silver, with near negligible (typically <0.1 wt. %) copper. Gold grain cores range in fineness from 550 to 790. 5.2.6 Micro-Inclusions in Gold Grains Native gold grains commonly contain micro-inclusions of other minerals with which they were intergrown in the primary deposit. Identification of such inclusions can provide useful indicators of the type and geological environment of the original bedrock mineralization (Chapman et al., 2002). However, these inclusions are typically very small, and may be lost during mechanical working of the gold grains. In addition, if multiple bedrock sources have supplied detrital gold, the inclusion suite may represent a mixture from these sources. Nevertheless, where found, inclusions can provide important clues and constraints on the nature of the primary source. In this study, microscopic grains of quartz and other minerals were commonly found adhering to the surfaces of gold grains. However, most of these grains appear to have been embedded within the surface or trapped in cavities of the gold grains during weathering and transport, rather than being primary
Figure 12. Ternary Au-(Ag x 10)-(Cu x 100) plot showing compositions of gold grains from Whitecourt placers, and the compositional ranges of placer gold from various source deposit types (from Townley et al., 2003). The composition of gold from mesothermal deposits likely overlaps the porphyry gold field (B. Townley, pers. comm., 2007).

EUB/AGS Special Report 089 (May 2007) •21
inclusions (Figure 13). The lack of unequivocally primary micro-inclusions in these samples limits our ability to determine the nature of the gold source, but does provide some constraints on transport distance, as discussed below. 5.3 Native Lead Pseudomorphs of Organic Material Another interesting postdepositional feature observed in these samples was the occurrence of twig or root-shaped pieces of metal, which on analysis turned out to be made of pure lead. The ‘lead roots’ are large (approximately 1.2 cm in length), have a dendritic dull grey appearance and tarnish from bright silver to dull brown in epoxy mounts. These structures were probably formed by the replacement of tree roots and
Figure 13. SEM photographs of the typical 'inclusions' within the gold grains of these samples. A) A gold grain with small particles of quartz scattered across the surface. B) Small quartz grain on the surface of a gold grain appearing white in contrast to the darker gold. C) Quartz imbedded into the surface of a gold grain. D) Monazite on the surface of a gold grain.

EUB/AGS Special Report 089 (May 2007) •22
other organic matter during supergene processes. Similar occurrences of lead pseudomorphs of organic matter have been reported in very few other placer deposits, such as the Langban placer deposit in Sweden (indicated at www.webmineral.com). Examples of these phenomena are shown in Figure 11c, d.
5.4 Diamonds and Garnet Abundant pale purple to pink garnet were apparent in the concentrates shown to us at the gravel site. We analyzed 10 garnet grains by electron microprobe to test the potential for high Cr and/or high Cr-low Ca garnet suggestive of diamondiferous kimberlite. The results showed the selected garnets were all of almandine composition (Table 2), and therefore, indicative of a metamorphic source, not a potential diamond source. Rare diamonds reportedly recovered from the gravel pit were also shown to us, but none was recovered from the samples used in this study. 6 Discussion The typical accessory phases found in placer deposits are hard, dense and chemically inert minerals, such as garnet, zircon, ilmenite, rutile, magnetite and monazite, with the opaque fraction commonly referred to as black sand (Johnson and McQueen, 2001; Garnett and Basett, 2005). High concentrations of these minerals in placer deposits indicate extensive chemical weathering and transportation of sediment, resulting in comminution and loss of lighter, softer, more reactive rock-forming minerals. Placer mineral assemblages have also been used in many studies as an aid in determining the nature of the original hostrocks from which the minerals were sourced (e.g., Patyk-Kara et al., 2001). 6.1 Distance Transported Knight et al. (1999) investigated the change in morphology of grains with increasing transport distances, noting how features such as rim thickness, rim percentage, flatness, roundness and Shilo shape factor changed both individually and in relation to each other. They found that the most reliable indicator of distance transported was the flattening index of the grains, although the degree of roundness and rimming also yield moderately good correlations (Figure 14). The outline shape of grains was found to be too variable, because primary grains show a wide variety of initial shapes. Within distances of 3 km to 5 km, the relationship between flatness or roundness and distance yielded mixed results because large initial changes were occurring within this interval. However, good correlations were observed for distances greater than approximately 5 km, permitting reliable estimates to be made with accuracies of ±0.3 km to ±0.5 km (Figure 14). The morphology and rimming characteristics of gold grains from the Whitecourt gravel deposit appear to support the conclusion that the majority of grains are well travelled. The grains generally have very high degrees of rounding and flattening, typical chemical weathering effects, such as etching and pitting, and sharp contrasts in fineness of rims relative to their cores. These are the features expected of well-travelled grains. This suggestion is supported by the abundance and form (rounded, abraded, chipped) of other durable minerals in the deposit, such as quartz, almandine garnet, magnetite, ilmenite, zircon and monazite. The majority of inclusions found within the gold are of microscopic quartz, but these are likely merely grains clinging to or mechanically embedded in the surface, and not primary mineral inclusions in the gold (Lange and Gignoux, 1999; Chapman et al., 2002). The lack of authentic micro-inclusions in these samples is an additional indication that the gold grains have undergone appreciable transport. It is frequently found that inclusions are removed, via hammering and abrasion, after only a few kilometres of transport. Hence, we can conclude that, with the exception of some grains in sample two, the placer gold is not near its bedrock source(s).

EUB/AGS Special Report 089 (May 2007) •23
0 2 4 6 8 10
Flatness (%)
0
1
2
3
Dis
tanc
e (k
m)
0 2 4 6 8 10
Roundness (%)
0
2
4
6
8
10
Flat
ness
(%)
x Gold from recent stream White channel
Altered - part of gold Unaltered - part of gold Altered – all gold Weakly altered – all gold Unaltered – all gold
Figure 14. Roundness versus flatness and flatness versus distance curves as proposed by Knight et al. (1999). Reproduced with permission by Economic Geology.
EUB/AGS Special Report 089 (May 2007) •24
The high degree of transport shown by most gold grains within this deposit might mean the chemical composition of the cores of grains is not completely representative of its source. However, Knight et al. (1999) and Chapman et al. (2002) have discussed that, despite common evidence of alteration, the composition of the lode source and the alluvial site are likely relatively homogeneous. The large variability in micro-morphology may be because of
• armouring of gold during transport with differential periods of liberation from their host (Townley et al., 2003);
• a change in flow regime resulting in temporal changes in the distance of sediment transport; or • multiple sources of origin, particularly in the case of well-travelled sediment (Surour et al., 2003;
Garnett and Basett, 2005). A multiple source scenario is the most likely factor because a few cubes of pyrite and prismatic zircons were found co-existing with very rounded and strongly abraded garnets, zircons, quartz and gold in sample two. These pyrite cubes indicate there must be some local sourcing of at least part of the ore minerals found, as they would not survive over any significant transport distance Using the relationship between flatness and distance of travel (Knight et al., 1999), grains from sample 1 fall within 40%–50% flatness range and corresponds to a transport distance of approximately 3 km to 8 km. However, accurate estimation of the degree of flattening requires proper orientation of the mineral grains so that profiles can be observed. This was not done systematically, so the thickness of flat-lying grains could not be accurately measured. Furthermore, there is significant scatter in the initial data used by Knight et al. (1999). Hence, these results should be used with caution, and transport distances could vary substantially from the estimate made here. Sample 2 contained additional, less flattened grains, which were not used in the above transport distance estimate. These grains were likely not derived from the same source as are the majority of the other grains, and their morphologies suggest very close derivation, within the range of least accuracy in the flatness–distance curve.
6.2 Possible Sources of Placer Minerals Two river systems, the McLeod and Athabasca rivers, may have been the source of the gold placers in the Whitecourt gravels. Halferdahl (1965) conducted a survey of gold mineralization in Alberta drainage basins and found gold could be recovered from both river systems. However, there was typically a much higher concentration of gold from sites along the McLeod than the Athabasca River (0.015–15.54 mg Au/cu yd in the McLeod versus 0–1.26 mg Au/cu yd in the Athabasca). The large amount of gold in the Whitecourt placers suggests they were deposited from the McLeod River. However, this interpretation assumes the gold source and transport environment have not changed since deposition to when the study was conducted. It also assumes the same source of gold has been eroded continuously over this time, and was not completely eroded (as was the case of the Ninemile placer in Montana; Lange and Gignoux, 1999). Climate and tectonic regime factors could play a role in changing the degree of weathering and transportation, and even altering drainage patterns over time. Despite these complications, Godfrey (1985) suggested there are strong correlations between many placer deposits and their nearby modern river systems, but he also noted it is unlikely there is a single source of derivation for gold in many Alberta placers. Possible sources include reworked glacial sediments, other preglacial river deposits, and Tertiary or Cretaceous bedrock. Garnett et al. (2005) indicated that multiple, frequent pulses of sedimentation are observed in many placer deposits around the world. These pulses are from changes in various factors, such as climate or base-level changes. This suggests that placer deposits are commonly multigenerational, which may account for some discrepancies between different samples from the same general locations. As well, most deposits around the world exhibit a high degree of reworking, which

EUB/AGS Special Report 089 (May 2007) •25
result in the further concentration of older deposits, and an increase in grade from oldest to youngest, respectively (Patyk-Kara et al., 2001; Garnett and Basett, 2005). The platinum observed within this deposit is likely from the same area as the gold. This conclusion is based upon the similarity and degree of processing experienced by both gold and platinum during transport. Similar findings have been documented in the Fort MacKay placer in northeastern Alberta (Ballantyne and Harris, 1997). Platinum and gold flakes from this area show similar sizes and textures, and therefore, likely share the same origin and transport history. The primary sources of gold and platinum in placers throughout Alberta and Montana (e.g., the Ninemile placer; Lange and Gignoux, 1999), have remained elusive despite extensive exploration. Morton et al. (1993) noted originally these deposits had been the result of reworking of glacial gold having been transported from the eastern Precambrian Shield area, but that more recent work indicates that veins of Lower Cambrian origin containing high grades of gold occur close to the Committee’s Punchbowl area of the central Canadian Cordillera. The erosion of this deposit occurred during the early Cretaceous, with subsequent continued erosion and deposition occurring within ancient river drainage systems (Morton et al., 1993). Alternatively, Godfrey (1985) noted the Clark Range, a district of Precambrian Purcell Series granitoid plutons in southwestern Alberta, could have sourced some of the gold mineralization in Alberta. The sources of platinum group elements in placer deposits are typically mafic to ultramafic rocks, with the co-occurrence of gold and platinum in placers being globally rare (Ballantyne and Harris, 1997). The platinum contained in the Alberta placers is of interest because the only likely source is an Alaskan-type intrusion near the Tulameen River (Morton et al., 1993). Morton et al. (1993) noted that the Tulameen River would not serve as possible source today because of obstruction by the Front Ranges; however, this river could have flowed into Alberta during the early stages of Cordillera buildup. Similarly, sediment supply to the Scollard Formation might be derived from events associated with the Laramide Orogeny (Srivastava, 1994). The lack of plausible sources within the current catchment area has led many to conclude the source of gold and platinum is from outside the Western Canada Sedimentary Basin, though Ballantyne and Harris (1997) have mentioned these minerals may have been derived from intrabasinal sources, such as lamproites and kimberlites, the Cretaceous Shaftesbury Formation, and Devonian carbonates in northern Alberta. The mineralogical and morphological features of the heavy minerals in this deposit suggest that the primary source may have been a low-sulphidation epithermal gold deposit. This conclusion is based upon a number of factors. In the classification scheme of Townley et al. (2003), the gold alloy compositions from this study fall within the gold-rich corner of the diagram where both epithermal gold and gold-rich copper porphyry systems converge. The accompanying mineral suite of electrum, quartz, barite, as well as rare pyrite (the only sulphide mineral observed), is representative of the typical suite of minerals in epithermal deposits. Metamorphic sources might be discounted by the predominance of elongate, sharp-edged crystals of zircons of likely igneous derivation (Figure 6; Patyk-Kara et al., 2001), compared with the more equant crystals with many vicinal faces and relatively rounded edges that characterize metamorphic zircons. However, abundant almandine garnets in the heavy mineral fractions suggest an important contribution from metamorphic rocks to the sediments. Although Townley et al.’s (2003) compilation does not include mesothermal gold deposits, B. Townley (pers. comm., 2007) suggests that gold from such deposits would likely overlap with the porphyry gold field, in which several of the Whitecourt samples plot. Therefore, a mesothermal origin for some or all of this gold cannot be ruled out.

EUB/AGS Special Report 089 (May 2007) •26
7 Conclusions The morphology of gold grains from the Whitecourt gravels is fairly uniform, with the majority of the grains displaying prominent features, such as striations, etching, rounding and flattening, together indicating significant transport distances (perhaps in excess of 3 to 8 km). However, one sample included populations of less flattened gold grains, and prismatic grains of pyrite and zircon; these grains may have been derived separately from a closer source. The source of gold mineralization is interpreted to be most likely of low-sulphidation epithermal derivation. This interpretation, while not conclusive, is based upon the chemistry of gold-grain cores and the accompanying mineral suite within these samples. It is also possible that multiple sources contributed to these deposits and a mesothermal origin for some or all of this gold cannot be ruled out. The primary source of placer minerals in Alberta remains a mystery. This is mainly due to the lack of known potential sources within the sedimentary basin itself, as well as barriers to transport from sources outside the immediate area. Despite this enigma, most evidence indicates the gold and platinum were derived from the Rocky Mountains area, and could likely have been eroded from Mesozoic and early Tertiary primary deposits during the early stages of Cordillera formation (before the mountains became a significant barrier to flow). 8 References Armstrong, J.T. (1995): A package of correction programs for the quantitative electron microbeam x-ray
analysis of thick polished materials, thin films, and particles; Microbeam Analysis, v. 4, p. 177–200.
Ball, S. (1998c): Assessment report, metallic and industrial mineral assessment report for the geological, geophysical, and geochemical on the Rich Claim Block; Kennecott Canada Exploration Inc., Alberta Energy and Utilities Board, EUB/AGS Assessment File 19970009, 10 p.
Ballantyne, S.B. and Harris, D.C. (1997): Alluvial platinum-group minerals and gold in Alberta: results from the “orientation studies project” and their significance to exploration; Geological Survey of Canada, Bulletin 500, p. 279–329.
Barkov, A.Y. and Fleet, M.E. (2005): Platinum-group minerals from five placer deposits in British Columbia, Canada; The Canadian Mineralogist, v. 43, p. 1687–1710.
Bi, D. (1993): Platinum-group metals and extraterrestrial spherules in Pleistocene sediments in Alberta, Canada; M.A. thesis, University of Alberta, 115 p.
Bi, D. and Morton, R.D. (1995): Magnetic spherules from recent fluvial sediments in Alberta, Canada: characteristics and possible origins; Canadian Journal of Earth Science, v. 32, p. 351–358.
Burton, J.P. and Fralick, P (2003): Depositional placer accumulation in coarse-grained alluvial braided river systems; Economic Geology, v. 98, p. 985–1001.
Chapman, R., Leake B. and Styles M. (2002): Microchemical characterization of alluvial gold grains as an explorational tool; British Geological Survey, v. 35, no. 2, p. 53–65.
Eccles, D. R. (2005): There’s Diamonds in Them There Alluvium!; in Rock chips, Alberta Energy and Utilities Board, EUB/AGS quarterly newsletter, winter 2005, p. 1–12.
Edwards, W.A.D. (1990): Placer gold occurrences in Alberta; Alberta Research Council, Alberta Geological Survey, Open File Report 1990-09, 14 p.
Garnett, R.H.T. and Basett, N.C. (2005): Placer deposits; Economic Geology, 100th Anniversary Volume, p. 812–843.
EUB/AGS Special Report 089 (May 2007) •27
Godfrey, J.D. (1985): Gold; unpublished report, Alberta Research Council, Alberta Geological Survey, 21 p.
Halferdahl, L.B. (1965): The occurrence of gold in Alberta Rivers; Alberta Research Council, Open File Report 1965-11, 23 p.
Hamilton, W.N., Price, M.C. and Langenberg, C.W. (1999): Geological map of Alberta; Alberta Energy and Utilities Board, EUB/AGS Map 236, scale 1:1 000 000.
Jarosewich, E. (2002): Smithsonian microbeam standards; Journal of Research of the National Institute of Standards and Technology, v. 107(6), p. 681–685.
Johnson, C.B. and McQueen, K.G. (2001): The nature of gold-bearing paleochannel sediments in the Gidji area north of Kalgoorlie, Western Australia; Quaternary International, v. 82, p. 51–62.
Knight, J.B., Morison, S.R. and Mortensen, J.K. (1999): The relationship between placer gold particle shape, rimming, and distance of fluvial transport as exemplified by gold from the Klondike District, Yukon Territory, Canada; Economic Geology, v. 94, p. 635–648.
Lange, I.M. and Gignoux, T. (1999): Distribution, characteristics, and genesis of high fineness gold placers, Ninemile Valley, central-western Montana; Economic Geology, v. 94, p. 375–386.
McClenaghan, M.B. (2005): Indicator mineral methods in mineral exploration; Geological Society of London, v. 5, p. 233–245.
Meju, M.A. (2002): Geoelectromagnetic exploration for natural resources: models, case studies and challenges; Surveys in Geophysics, v. 23, p. 133–205.
Mortensen, J.K., Chapman, R., LeBarge, W. and Jackson, L. (2004): Application of placer and lode gold geochemistry to gold exploration in western Yukon; Yukon Exploration and Geology 2004, p. 205–212.
Morton, R.D., Bi, D. and Mussieux, R. (1993): Gold and platinum group element placer deposits of the North Saskatchewan River, Edmonton: field tip guidebook; Geological Association of Canada, p. 1–11.
Muntean, J.L., Frimmel, H.E., Phillips, N., Law, J. and Myers, R. (2005): Controversies on the origin of world-class gold deposits, Part II: Witwatersrand gold deposits; Society of Economic Geologists Newsletter, January 2005, no. 60, p. 7, 12–19.
Nakagawa, M., Santosh, M., Nambiar, C.G. and Matsubara, C. (2005): Morphology and chemistry of placer gold from Attapadi Valley, southern India; Gondwana Research, v. 8, no. 2, p. 213–222.
Outridge, P.M., Doherty, W. and Gregoire, D.C. (1998): Determination of trace elemental signatures in placer gold by laser ablation-inductively coupled plasma-mass spectrometry as a potential aid for gold exploration; Journal of Geochemical Exploration, v. 60, p. 229–240.
Patyk-Kara, N.G., Gorelikova, N.V., Bardeeva, E.G. and Shevelev, A.G. (2001): Mineralogy of placers: modern approaches and solutions; Lithology and Mineral Resources, v. 36, no. 5, p. 393–405.
Peterson, B.N. (1980): Sand and gravel resources of the St. Paul and Bonnyville areas, Alberta; Alberta Research Council, Alberta Geological Survey, Open File Report 1980-04, 35 p.
Surour, A.A., El-Kammar, A.A., Arafa, E.H. and Korany, H.M. (2003): Dahab stream sediments, southeastern Sinai, Egypt: a potential source of gold, magnetite and zircon; Journal of Geochemical Exploration, v. 77, p. 25–43.
Srivastava, S.K. (1994): Palynology of the Cretaceous-Tertiary boundary in the Scollard Formation of Alberta, Canada and global KTB events; Review of Palaeobotany and Palynology, v. 83, p. 137–158.

EUB/AGS Special Report 089 (May 2007) •28
Sutherland, D.G. (1985): Geomorphological controls on the distribution of placer deposits; Journal of Geological Society of London, v. 142, p. 727–737.
Townley, B.K, Herail, G., Maksaev, V., Palacios, C., de Parseval, P., Sepulveda, F., Orellana, R., Rivas, P. and Ulloa, C. (2003): Gold grain morphology and composition as an exploration tool: application to gold exploration in covered areas; Geological Society of London, v. 3, p. 29–38.
Tyrrel, J.B. (1915): Gold on the North Saskatchewan River; Bulletin of the Canadian Mining Institute – Annual Meeting, Toronto, March, 1915, p. 160–173.
Vail, P.R., Mitchum, Jr., R.M. and Thompson, III., S. (1977): Seismic stratigraphy and global changes of sea level, part 4: global cycles of relative changes of sea level; American Association of Petroleum Geologists, no. 26, p. 83–97.
Viladevall, M., Pacheco, J.A. and Cadena, J.L. (2006): Sand and gravel plants as potential sources of gold production in the European Union; Applied Earth Science, v. 115, p. 94–102.