Godrej Consumer - result...
13
Edelweiss Research is also available on www.edelresearch.com, Bloomberg EDEL <GO>, Thomson First Call, Reuters and Factset. Edelweiss Securities Limited Godrej Consumer’s (GCPL) Q2FY13 revenue came in line with our estimate, though profit was lower than expectation on back of higher costs (up 223 bps YoY). Key positives include: (1) 20% YoY growth in household insecticides (HI) category (1.5x of category growth); (2) hair colour growth at 10% YoY (5% YoY in Q1FY13; likely to step up due to crème launch); and (3) 32% organic growth in international businesses. Despite gross margin expansion of 19bps YoY, EBITDA margin was lower due to increase in staff costs, ASP and other costs by 149bps, 38bps and 54bps, YoY, respectively. We expect margin to improve in coming quarters due to correction in palm oil prices. Maintain ‘BUY’ on dips. This report also contains Q2FY13 conference call highlights. Household insecticides, soaps continue to grow ahead of market GCPL’s domestic business grew at a healthy 19% YoY to ~INR9.1bn. Household insecticides posted 20% plus YoY growth and personal wash grew at 24% YoY (volume growth at 6%, ahead of category volume growth). The quarter witnessed re‐launch of Cinthol range (entered shower gels category in addition to soaps, talc and deo) and feel & launch of crème based hair colour and Goodknight Advanced Colour Play. CSD, which accounts for 1% of sales, remained flat YoY. International business continues to be robust International sales posted an organic growth of 32% YoY on back of strong 37% YoY surge in Indonesia and organic growth in Africa in high teens. LatAm and Europe posted robust performance with 92% and 29% YoY sales growth, respectively. In Q2FY13 GCPL launched HIT one push aerosol in Indonesia, Goodknight aerosol and coil in Nigeria and “Touch of Silver” (shampoo and conditioner) and “Aapri” (skin care range) in Europe. Outlook and valuations: Bright; maintain ‘BUY’ We like GCPL’s aggression in developing categories via new launches and cross pollination of products across geographies. At CMP, the stock is trading at 34.6x and 28.6x on FY13E and FY14E EPS, respectively. We maintain ‘BUY’ and rate it ‘Sector Outperformer’ on a relative return basis. RESULT UPDATE GODREJ CONSUMER Galloping on the growth trail EDELWEISS 4D RATINGS Absolute Rating BUY Rating Relative to Sector Outperformer Risk Rating Relative to Sector High Sector Relative to Market Underweight MARKET DATA (R: GOCP.BO, B: GCPL IN) CMP : INR 725 Target Price : INR 762 52‐week range (INR) : 745 / 368 Share in issue (mn) : 340.3 M cap (INR bn/USD mn) : 247/ 4,583 Avg. Daily Vol.BSE/NSE(‘000) : 304.5 SHARE HOLDING PATTERN (%) Current Q1FY13 Q4FY12 Promoters * 63.8 64.0 64.0 MF's, FI's & BK’s 1.2 1.0 1.8 FII's 27.4 27.2 25.3 others 7.6 7.8 9.0 * Promoters pledged shares (% of share in issue) : Nil PRICE PERFORMANCE (%) Stock Nifty EW Consumer Goods Index 1 month 6.7 (0.4) 4.9 3 months 14.6 9.0 13.5 12 months 74.7 8.4 45.0 Abneesh Roy +91 22 6620 3141 [email protected] Hemang Gandhi +91 22 6620 3148 [email protected] Pooja Lath +91 22 6620 3075 [email protected] India Equity Research| Consumer Goods November 2, 2012 Financials Year to March Q2FY13 Q2FY12 % Change Q1FY13 % Change FY12 FY13E FY14E Net rev. (INR mn) 16,003 11,911 34.4 13,921 15.0 48,662 63,228 76,668 EBITDA (INR mn) 2,490 2,118 17.5 2,023 23.1 8,554 11,002 13,340 Profit (INR mn) 1,669 1,450 15.1 1,481 12.7 5,266 7,118 8,632 Diluted EPS (INR) 4.7 3.9 18.6 3.8 22.1 15.5 20.9 25.4 Diluted P/E(x) 46.8 34.6 28.6 EV/EBITDA (x) 30.3 23.9 19.7 ROAE (%) 22.1 21.5 22.5
Transcript of Godrej Consumer - result...
Edelweiss Research is also available on www.edelresearch.com, Bloomberg EDEL <GO>, Thomson First Call, Reuters and Factset. Edelweiss Securities Limited
Godrej Consumer’s (GCPL) Q2FY13 revenue came in line with our estimate, though profit was lower than expectation on back of higher costs (up 223 bps YoY). Key positives include: (1) 20% YoY growth in household insecticides (HI) category (1.5x of category growth); (2) hair colour growth at 10% YoY (5% YoY in Q1FY13; likely to step up due to crème launch); and (3) 32% organic growth in international businesses. Despite gross margin expansion of 19bps YoY, EBITDA margin was lower due to increase in staff costs, ASP and other costs by 149bps, 38bps and 54bps, YoY, respectively. We expect margin to improve in coming quarters due to correction in palm oil prices. Maintain ‘BUY’ on dips.
This report also contains Q2FY13 conference call highlights. Household insecticides, soaps continue to grow ahead of market
GCPL’s domestic business grew at a healthy 19% YoY to ~INR9.1bn. Household insecticides posted 20% plus YoY growth and personal wash grew at 24% YoY (volume growth at 6%, ahead of category volume growth). The quarter witnessed re‐launch of Cinthol range (entered shower gels category in addition to soaps, talc and deo) and feel & launch of crème based hair colour and Goodknight Advanced Colour Play. CSD, which accounts for 1% of sales, remained flat YoY.
International business continues to be robust International sales posted an organic growth of 32% YoY on back of strong 37% YoY surge in Indonesia and organic growth in Africa in high teens. LatAm and Europe posted robust performance with 92% and 29% YoY sales growth, respectively. In Q2FY13 GCPL launched HIT one push aerosol in Indonesia, Goodknight aerosol and coil in Nigeria and “Touch of Silver” (shampoo and conditioner) and “Aapri” (skin care range) in Europe. Outlook and valuations: Bright; maintain ‘BUY’
We like GCPL’s aggression in developing categories via new launches and cross pollination of products across geographies. At CMP, the stock is trading at 34.6x and 28.6x on FY13E and FY14E EPS, respectively. We maintain ‘BUY’ and rate it ‘Sector Outperformer’ on a relative return basis.
RESULT UPDATE
GODREJ CONSUMERGalloping on the growth trail
EDELWEISS 4D RATINGS
Absolute Rating BUY
Rating Relative to Sector Outperformer
Risk Rating Relative to Sector High
Sector Relative to Market Underweight
MARKET DATA (R: GOCP.BO, B: GCPL IN)
CMP : INR 725
Target Price : INR 762
52‐week range (INR) : 745 / 368
Share in issue (mn) : 340.3
M cap (INR bn/USD mn) : 247/ 4,583
Avg. Daily Vol.BSE/NSE(‘000) : 304.5
SHARE HOLDING PATTERN (%)
Current Q1FY13 Q4FY12
Promoters *
63.8 64.0 64.0
MF's, FI's & BK’s 1.2 1.0 1.8
FII's 27.4 27.2 25.3
others 7.6 7.8 9.0 * Promoters pledged shares (% of share in issue)
: Nil
PRICE PERFORMANCE (%)
Stock Nifty
EW Consumer Goods Index
1 month 6.7 (0.4) 4.9
3 months 14.6 9.0 13.5
12 months 74.7 8.4 45.0
Abneesh Roy +91 22 6620 3141 [email protected] Hemang Gandhi +91 22 6620 3148 [email protected] Pooja Lath +91 22 6620 3075 [email protected]
India Equity Research| Consumer Goods
November 2, 2012
Financials
Year to March Q2FY13 Q2FY12 % Change Q1FY13 % Change FY12 FY13E FY14E
Net rev. (INR mn) 16,003 11,911 34.4 13,921 15.0 48,662 63,228 76,668
EBITDA (INR mn) 2,490 2,118 17.5 2,023 23.1 8,554 11,002 13,340
Profit (INR mn) 1,669 1,450 15.1 1,481 12.7 5,266 7,118 8,632
Diluted EPS (INR) 4.7 3.9 18.6 3.8 22.1 15.5 20.9 25.4
Diluted P/E (x) 46.8 34.6 28.6
EV/EBITDA (x) 30.3 23.9 19.7
ROAE (%) 22.1 21.5 22.5
Consumer Goods
2 Edelweiss Securities Limited
Conference call: Key takeaways
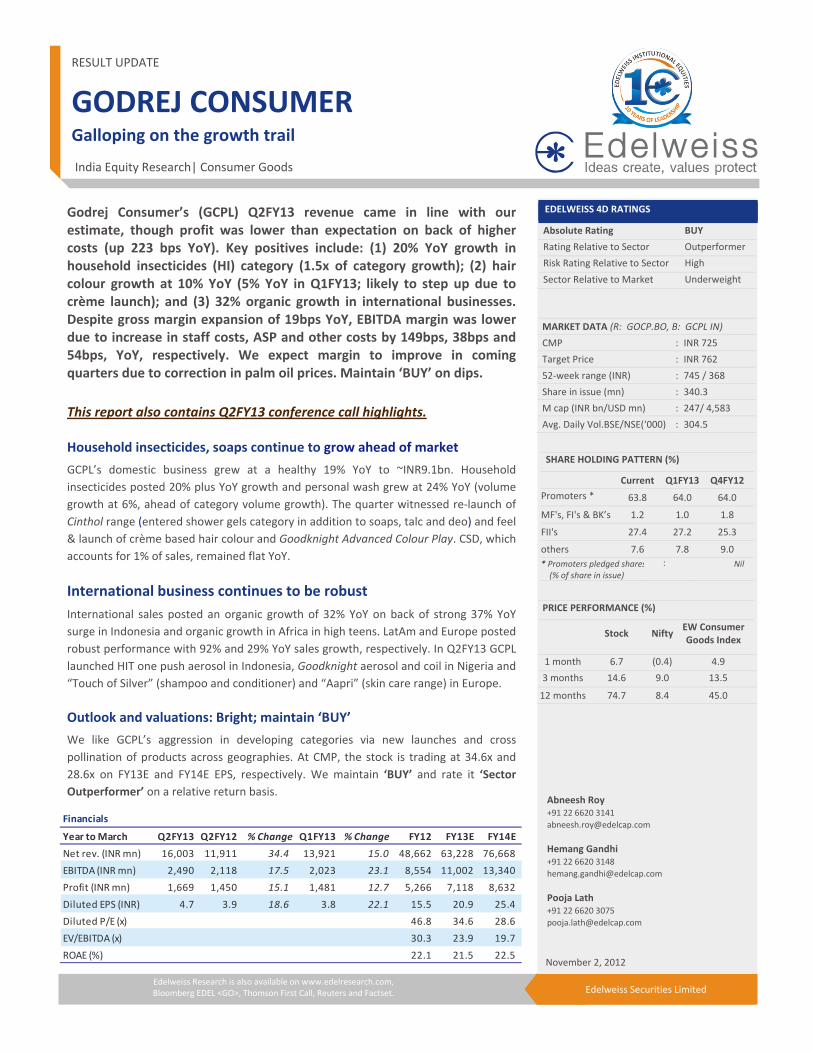
Soaps business in India: GCPL’s sales jumped 24% YoY in Q2FY13, with volume growth of 6% YoY (slightly ahead of industry; lower largely due to high base effect; Cinthol impact is not reflected in volumes. Thus we expect better volumes in coming quarters). Gross margin expanded YoY on back of efficient commodity buying and cost saving initiatives and could improve further. Godrej No.1 Rosewater and Almonds soap is gaining good traction owing to its aggressive marketing initiative. The company re‐launched its Cinthol brand with entry into new category of shower gels in addition to soaps, talc and deo; promoted as “Alive is Awesome”, specially targeting the Indian youth. The unified portfolio is available in five variants for all categories‐‐energy, play, intense, splash and original. Each variant has been assigned a specific colour. Earlier the brand was a mix of sub‐popular (40%) and premium (60%). This has now been taken to 100% premium offering in terms of both quality and pricing. The gap between premium and sub‐popular was 20% which has been done away with now. Thus, brands like Lux, Breeze, Santoor and Hamam are no longer a competition for Cinthol. The company is confident of achieving success with its new premium positioning. Hair colour business in India: Growth was back on track at 10% YoY (against 5% YoY in Q1FY13). In a bid to strengthen its roots in the hair colour business, GCPL entered the crèmes hair colour segment (already market leader in powder and mehendi segment). The product is available in two forms—sachet (priced at INR30; no competitor at this price point in this format) and hair colouring kit (priced at INR59). We believe, venturing into a new hair colour segment will help the company improve its market leadership in the category through market share gain from competitors, upgradation of consumers from powders to cream and growth from attraction of first time users. The product has done well; demand has been more than supply. Margins of crème segment are lower compared to powder. Household insecticides: Sales surged by a strong 20% YoY in Q2FY13 (post nine consecutive quarters of 25%+ YoY growth; largely volume led); growing at 1.5x the category, aided by innovative marketing initiatives and distribution synergies. GCPL continues to gain and enjoy market leadership across all three formats of coils, aerosols and electrics. Post the merger of GHPL with GCPL, the former is benefitting from distribution synergies of GCPL which is strong in North India (GHPL in South). GCPL launched ‘Goodknight Advanced colour play’. Debt: GCPL’s net debt position as on September 30, 2012, is INR11.4bn (lower on sequential basis from INR15bn due to expansion of Darling business in Kenya funded entirely by debt). Cost pressure: In Q2FY13, though COGS pressure reduced 19bps YoY, staff costs, ASP and other costs increased 149bps, 38bps and 54bps YoY, respectively. Other costs increased due to higher sales promotion (largely domestic) while staff cost increase was due to expansion in Africa (Darling phase II which is man power intensive) and Chile (South America has high cost structure). CSD impact: Canteen store sales contribute only 1% to total sales, which remained flat YoY. Minority interest: Was significantly down QoQ as Q1FY13 had backward area benefit resulting in higher profits which flowed down to minority interest (INR213mn in Q1FY13 vs INR83mn in Q2FY13).
Godrej Consumer
3 Edelweiss Securities Limited
International businesses
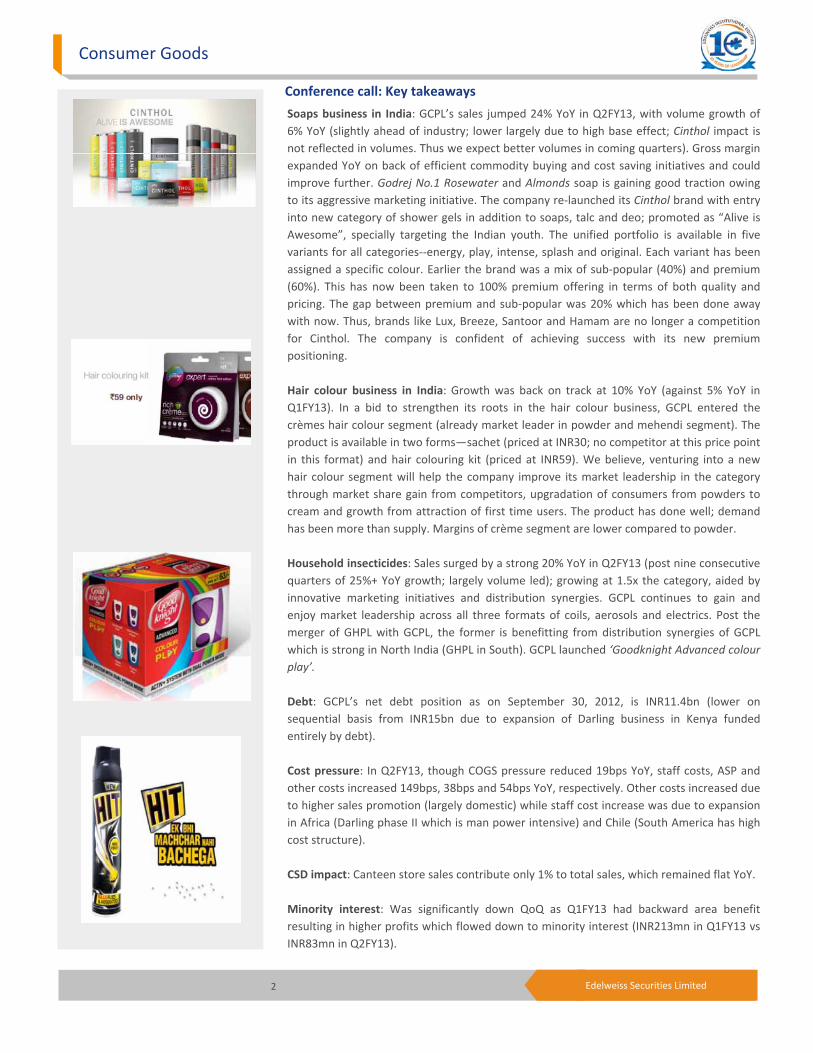
International sales grew 32% YoY organically, on back of strong performance across all major geographies. Asia excluding India (Megasari): This subsidiary contributed 45% to international sales. Sales were at INR3.16bn, up 37% YoY. EBITDA margin was at 19% before payment of technical fees to GCPL, up 140bps YoY. The company gained market share with highest market share in HIT aerosol and Stella aerosol. HIT magic paper continued to post high growth and gained 8‐9% market share. The company launched HIT one push aerosol in Q2FY13. Africa (Rapidol, Kinky, Tura and Darling Group): This business contributes 24% to international revenue; with organic growth in high teens. Sales were at INR1.63bn. EBITDA margin stood at 16.0%, up 850bps; margins are likely to be in 17‐19% range. Phase II of Darling acquisition will be consolidated from Q3FY13 (two months of consolidation). Rapidol grew strongly led by growth in Renew hair colours, doubling its market share and became the third largest brand in volume terms. In Q2FY13 the company launched Goodknight aerosol and coil in Nigeria where the overall household insecticide market is ~INR5bn with share of aerosol and coil being 55% and 30%, respectively; key competitors in the market include SC Johnson, Rambo (local player) and some competition from Chinese imports. Latin America (Issue and Argencos businesses): Latin America contributes 18% to international revenue. Sales at INR1.27bn grew 76% YoY. EBITDA margin stood at 4%, expanded 140bps YoY. Chilean business integration is well on track. UK: UK contributes 12% to international business revenue. Revenue stood at INR680mn, up 29% YoY. EBDITA margin was at 9%, down 100bps YoY. Q1FY13 also saw launch of new range of shampoo and conditioner under “Touch of Silver” and skin care range under “Aapri”.
Outlook and valuations: Bright; maintain ‘BUY’
We like GCPL’s aggression in developing categories via new launches and cross pollination of products across geographies. We are revising our sales assumptions upwards primarily due to expansion in Kenya business (Darling phase II) and growth from new launches (both domestic and international). We also expect correction in palm oil to benefit gross margin in coming quarters. Hence we tweak our EPS upwards by 3% for both FY13 and FY14 to INR20.9 and 25.4 respectively. Assigning a higher multiple of 30x (as against 28x earlier) we arrive at target price of INR762. At CMP, the stock is trading at 34.6x and 28.6x on FY13E and FY14E EPS, respectively. We maintain ‘BUY’ and rate it ‘Sector Outperformer’ on a relative return basis.
Consumer Goods
4 Edelweiss Securities Limited
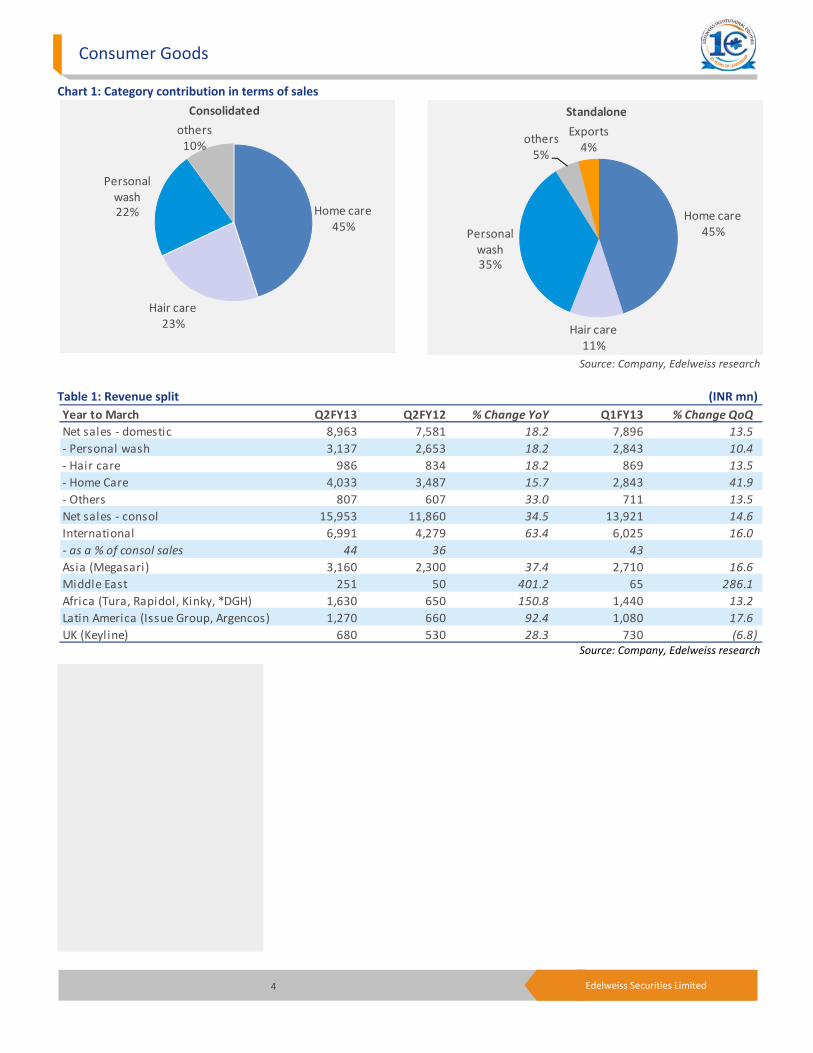
Chart 1: Category contribution in terms of sales
Source: Company, Edelweiss research
Table 1: Revenue split (INR mn)
Source: Company, Edelweiss research
Home care45%
Hair care23%
Personal wash22%
others10%
Consolidated
Year to March Q2FY13 Q2FY12 % Change YoY Q1FY13 % Change QoQNet sales ‐ domestic 8,963 7,581 18.2 7,896 13.5‐ Personal wash 3,137 2,653 18.2 2,843 10.4‐ Hair care 986 834 18.2 869 13.5‐ Home Care 4,033 3,487 15.7 2,843 41.9‐ Others 807 607 33.0 711 13.5Net sales ‐ consol 15,953 11,860 34.5 13,921 14.6International 6,991 4,279 63.4 6,025 16.0‐ as a % of consol sales 44 36 43 Asia (Megasari) 3,160 2,300 37.4 2,710 16.6Middle East 251 50 401.2 65 286.1Africa (Tura, Rapidol, Kinky, *DGH) 1,630 650 150.8 1,440 13.2Latin America (Issue Group, Argencos) 1,270 660 92.4 1,080 17.6UK (Keyline) 680 530 28.3 730 (6.8)
Home care45%
Hair care11%
Personal wash35%
others5%
Exports4%
Standalone
Godrej Consumer
5 Edelweiss Securities Limited
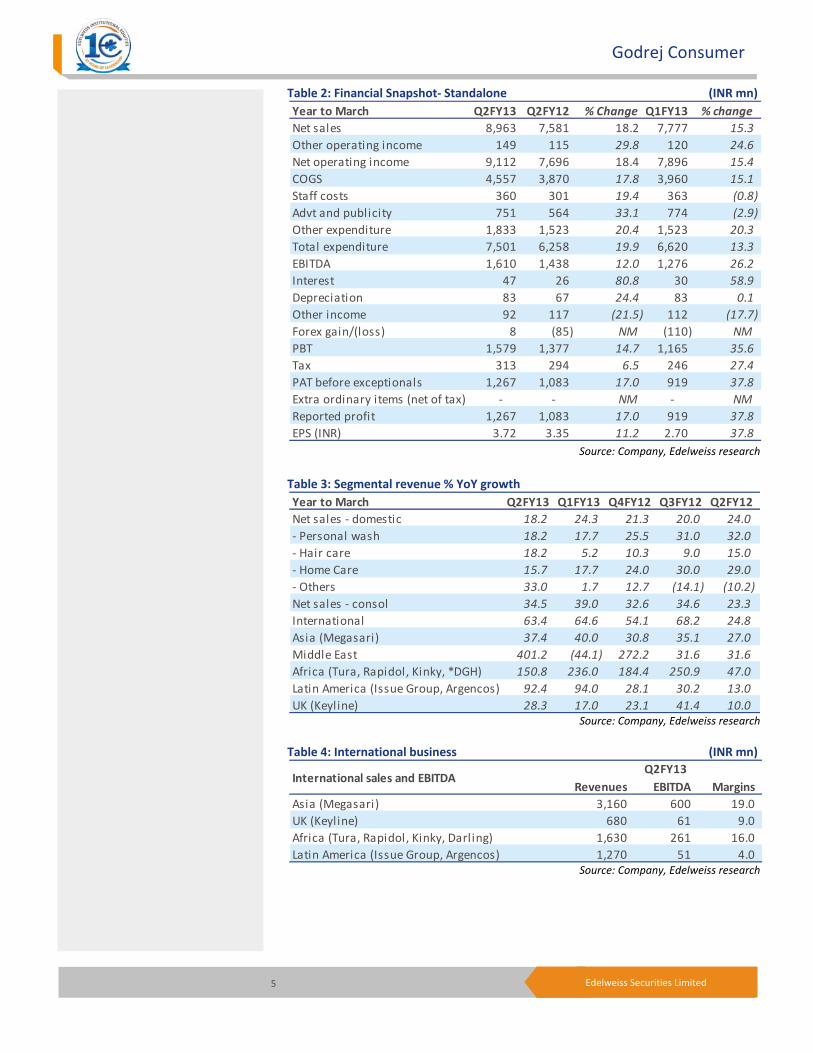
Table 2: Financial Snapshot‐ Standalone (INR mn)
Source: Company, Edelweiss research
Table 3: Segmental revenue % YoY growth
Source: Company, Edelweiss research
Table 4: International business (INR mn)
Source: Company, Edelweiss research
Year to March Q2FY13 Q2FY12 % Change Q1FY13 % changeNet sales 8,963 7,581 18.2 7,777 15.3 Other operating income 149 115 29.8 120 24.6 Net operating income 9,112 7,696 18.4 7,896 15.4 COGS 4,557 3,870 17.8 3,960 15.1 Staff costs 360 301 19.4 363 (0.8) Advt and publicity 751 564 33.1 774 (2.9) Other expenditure 1,833 1,523 20.4 1,523 20.3 Total expenditure 7,501 6,258 19.9 6,620 13.3 EBITDA 1,610 1,438 12.0 1,276 26.2 Interest 47 26 80.8 30 58.9 Depreciation 83 67 24.4 83 0.1 Other income 92 117 (21.5) 112 (17.7) Forex gain/(loss) 8 (85) NM (110) NMPBT 1,579 1,377 14.7 1,165 35.6 Tax 313 294 6.5 246 27.4 PAT before exceptionals 1,267 1,083 17.0 919 37.8 Extra ordinary items (net of tax) ‐ ‐ NM ‐ NMReported profit 1,267 1,083 17.0 919 37.8 EPS (INR) 3.72 3.35 11.2 2.70 37.8
Year to March Q2FY13 Q1FY13 Q4FY12 Q3FY12 Q2FY12Net sales ‐ domestic 18.2 24.3 21.3 20.0 24.0‐ Personal wash 18.2 17.7 25.5 31.0 32.0‐ Hair care 18.2 5.2 10.3 9.0 15.0‐ Home Care 15.7 17.7 24.0 30.0 29.0‐ Others 33.0 1.7 12.7 (14.1) (10.2)Net sales ‐ consol 34.5 39.0 32.6 34.6 23.3International 63.4 64.6 54.1 68.2 24.8Asia (Megasari) 37.4 40.0 30.8 35.1 27.0Middle East 401.2 (44.1) 272.2 31.6 31.6Africa (Tura, Rapidol, Kinky, *DGH) 150.8 236.0 184.4 250.9 47.0Latin America (Issue Group, Argencos) 92.4 94.0 28.1 30.2 13.0UK (Keyline) 28.3 17.0 23.1 41.4 10.0
Revenues EBITDA MarginsAsia (Megasari) 3,160 600 19.0UK (Keyline) 680 61 9.0Africa (Tura, Rapidol, Kinky, Darling) 1,630 261 16.0Latin America (Issue Group, Argencos) 1,270 51 4.0
International sales and EBITDAQ2FY13
Consumer Goods
6 Edelweiss Securities Limited
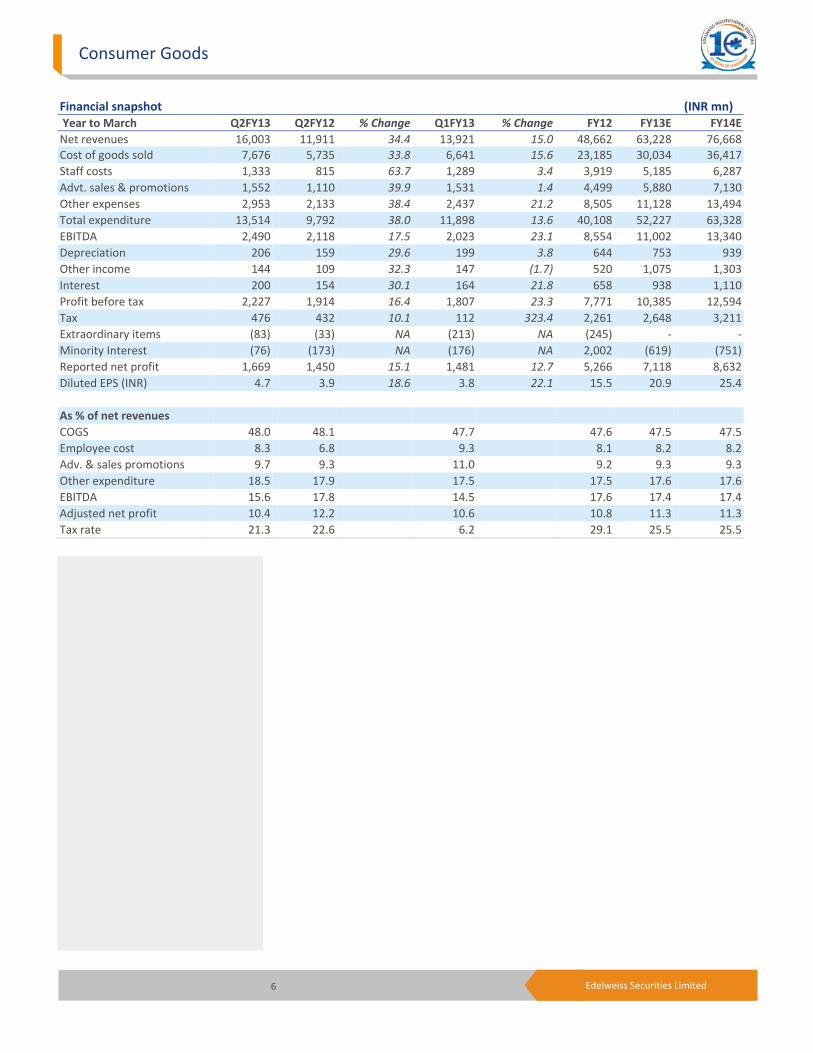
Financial snapshot (INR mn) Year to March Q2FY13 Q2FY12 % Change Q1FY13 % Change FY12 FY13E FY14E Net revenues 16,003 11,911 34.4 13,921 15.0 48,662 63,228 76,668 Cost of goods sold 7,676 5,735 33.8 6,641 15.6 23,185 30,034 36,417 Staff costs 1,333 815 63.7 1,289 3.4 3,919 5,185 6,287 Advt. sales & promotions 1,552 1,110 39.9 1,531 1.4 4,499 5,880 7,130 Other expenses 2,953 2,133 38.4 2,437 21.2 8,505 11,128 13,494 Total expenditure 13,514 9,792 38.0 11,898 13.6 40,108 52,227 63,328 EBITDA 2,490 2,118 17.5 2,023 23.1 8,554 11,002 13,340 Depreciation 206 159 29.6 199 3.8 644 753 939 Other income 144 109 32.3 147 (1.7) 520 1,075 1,303 Interest 200 154 30.1 164 21.8 658 938 1,110 Profit before tax 2,227 1,914 16.4 1,807 23.3 7,771 10,385 12,594 Tax 476 432 10.1 112 323.4 2,261 2,648 3,211 Extraordinary items (83) (33) NA (213) NA (245) ‐ ‐Minority Interest (76) (173) NA (176) NA 2,002 (619) (751) Reported net profit 1,669 1,450 15.1 1,481 12.7 5,266 7,118 8,632 Diluted EPS (INR) 4.7 3.9 18.6 3.8 22.1 15.5 20.9 25.4 As % of net revenues COGS 48.0 48.1 47.7 47.6 47.5 47.5 Employee cost 8.3 6.8 9.3 8.1 8.2 8.2 Adv. & sales promotions 9.7 9.3 11.0 9.2 9.3 9.3 Other expenditure 18.5 17.9 17.5 17.5 17.6 17.6 EBITDA 15.6 17.8 14.5 17.6 17.4 17.4 Adjusted net profit 10.4 12.2 10.6 10.8 11.3 11.3 Tax rate 21.3 22.6 6.2 29.1 25.5 25.5
Godrej Consumer
7 Edelweiss Securities Limited
Company Description GCPL is a major player in the toilet soap and hair colour categories in the Indian FMCG market. It is a leader in the hair colour category and has a vast product range across various price points. Major brands include Godrej Hair Dye (liquid and powder), Godrej Kesh Kala oil and Nupur hair dyes in the lower end and Renew and Coloursoft in the higher segment. It has also entered the crème hair colouring segment recently. It is the second‐largest toilet soap marketer after Hindustan Unilever (HUL) with a ~12% market share and primary brands such as Godrej No. 1, Cinthol and FairGlow. In 2012, GCPL completed the acquisition of 51% stake in Godrej Sara Lee Limited which had several leading brands such as GoodKnight, JET, HIT, Brylcreem and KIWI. Godrej Sara Lee’s portfolio offers significant synergies to GCPL’s portfolio and all the brands are performing well. To expand its geographical presence, GCPL had made few acquisitions in the past few years. In FY06, it acquired Keyline brands in the UK with brands such as Cuticura and Erasmic. In FY07, it took over Rapidol, a South African company with presence across ten countries in Africa. Recently it acquired Kinky, one of the leaders in the South African hair business for South African Rand 265 mn. Kinky offers a variety of products viz. hair braids, hair pieces, wigs and wefted pieces. Tura and Megasari are among recent purchases that would boost its presence in Africa and Indonesia respectively. Its recent acquisition of 51% stake in Darling Group Holding, leader in hair extension in Africa, would further strength its position in Africa. It also entered Chile, with acquisition of 60% stake in Cosmetica Nacional.
Investment Theme GCPL boasts of a patented technology for PHDs that has helped it drive usage of hair colours at the lower end of the market. The company also provides high‐quality value‐for‐money soaps which helped it garner larger market share. GCPL’s aggressive stance to take its operations to the international platform has resulted in several acquisitions in past three years. The company can be expected to benefit from its new ventures, increasing consumer spending and inorganic growth going forward.
Key Risks A slowdown in rural demand due to lower government spending or a monsoon failure could impact GCPL’s revenues significantly. Some of the recent international acquisitions are still at the integration stage. GCPL needs to successfully integrate these businesses to prove its execution capabilities. Depreciating INR can yield to rise in cost of dollar denominated debt. GCPL’s ability to gain market share in its soap segment could be adversely affected by the aggression of HUL, ITC, Wipro, etc. The entry of players such as L’oreal and Schwarzkopf has put pressure on GCPL’s hair colour business because of which it has been losing market share at the top end of the market. Entry of local players in lower end could worsen the situation.
8 Edelweiss Securities Limited
Consumer Goods
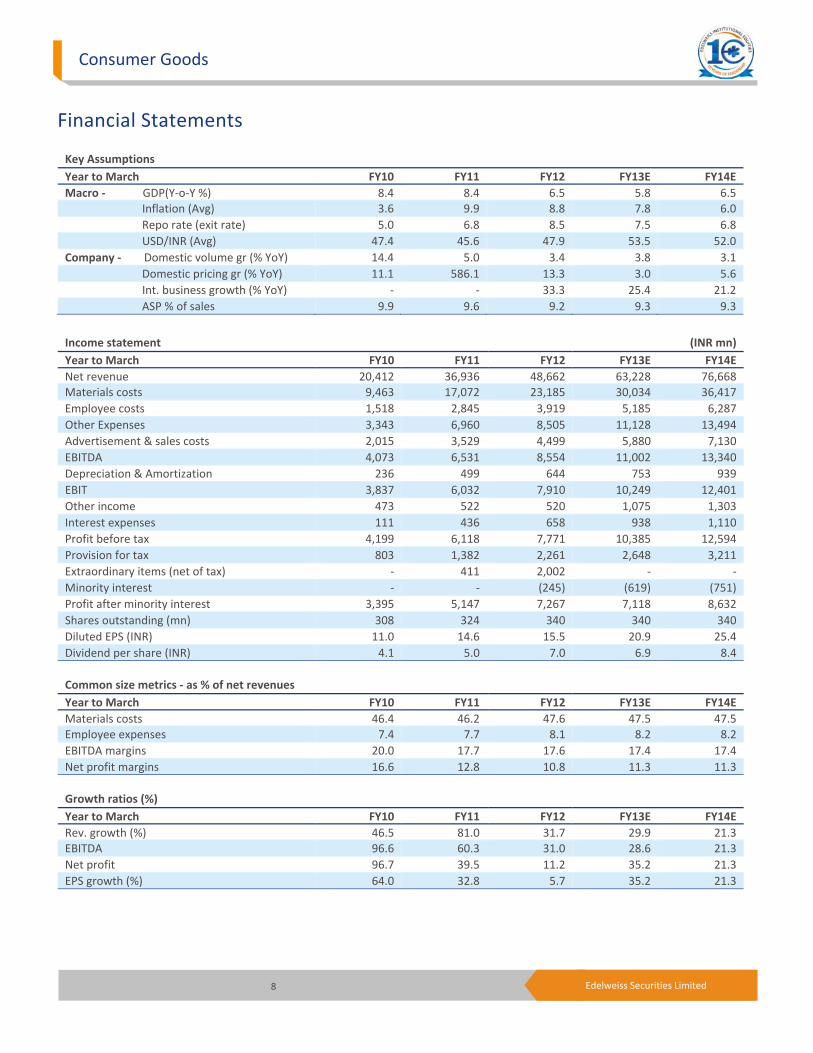
Financial Statements
Key Assumptions Year to March FY10 FY11 FY12 FY13E FY14EMacro ‐ GDP(Y‐o‐Y %) 8.4 8.4 6.5 5.8 6.5 Inflation (Avg) 3.6 9.9 8.8 7.8 6.0 Repo rate (exit rate) 5.0 6.8 8.5 7.5 6.8 USD/INR (Avg) 47.4 45.6 47.9 53.5 52.0 Company ‐ Domestic volume gr (% YoY) 14.4 5.0 3.4 3.8 3.1 Domestic pricing gr (% YoY) 11.1 586.1 13.3 3.0 5.6 Int. business growth (% YoY) ‐ ‐ 33.3 25.4 21.2 ASP % of sales 9.9 9.6 9.2 9.3 9.3
Income statement (INR mn) Year to March FY10 FY11 FY12 FY13E FY14ENet revenue 20,412 36,936 48,662 63,228 76,668Materials costs 9,463 17,072 23,185 30,034 36,417 Employee costs 1,518 2,845 3,919 5,185 6,287 Other Expenses 3,343 6,960 8,505 11,128 13,494 Advertisement & sales costs 2,015 3,529 4,499 5,880 7,130 EBITDA 4,073 6,531 8,554 11,002 13,340 Depreciation & Amortization 236 499 644 753 939 EBIT 3,837 6,032 7,910 10,249 12,401 Other income 473 522 520 1,075 1,303 Interest expenses 111 436 658 938 1,110 Profit before tax 4,199 6,118 7,771 10,385 12,594 Provision for tax 803 1,382 2,261 2,648 3,211 Extraordinary items (net of tax) ‐ 411 2,002 ‐ ‐ Minority interest ‐ ‐ (245) (619) (751) Profit after minority interest 3,395 5,147 7,267 7,118 8,632 Shares outstanding (mn) 308 324 340 340 340 Diluted EPS (INR) 11.0 14.6 15.5 20.9 25.4 Dividend per share (INR) 4.1 5.0 7.0 6.9 8.4
Common size metrics ‐ as % of net revenues Year to March FY10 FY11 FY12 FY13E FY14EMaterials costs 46.4 46.2 47.6 47.5 47.5Employee expenses 7.4 7.7 8.1 8.2 8.2 EBITDA margins 20.0 17.7 17.6 17.4 17.4 Net profit margins 16.6 12.8 10.8 11.3 11.3
Growth ratios (%) Year to March FY10 FY11 FY12 FY13E FY14ERev. growth (%) 46.5 81.0 31.7 29.9 21.3EBITDA 96.6 60.3 31.0 28.6 21.3 Net profit 96.7 39.5 11.2 35.2 21.3 EPS growth (%) 64.0 32.8 5.7 35.2 21.3
9 Edelweiss Securities Limited
Godrej Consumer
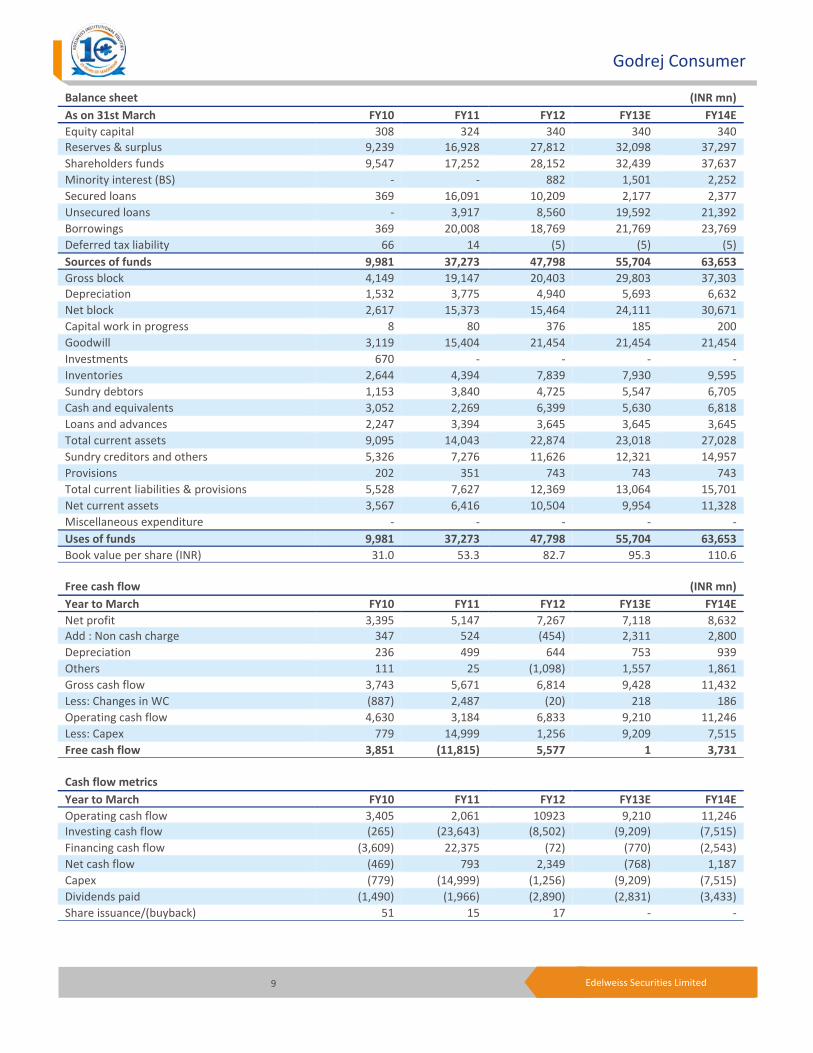
Balance sheet (INR mn) As on 31st March FY10 FY11 FY12 FY13E FY14EEquity capital 308 324 340 340 340Reserves & surplus 9,239 16,928 27,812 32,098 37,297 Shareholders funds 9,547 17,252 28,152 32,439 37,637 Minority interest (BS) ‐ ‐ 882 1,501 2,252 Secured loans 369 16,091 10,209 2,177 2,377 Unsecured loans ‐ 3,917 8,560 19,592 21,392 Borrowings 369 20,008 18,769 21,769 23,769 Deferred tax liability 66 14 (5) (5) (5) Sources of funds 9,981 37,273 47,798 55,704 63,653Gross block 4,149 19,147 20,403 29,803 37,303Depreciation 1,532 3,775 4,940 5,693 6,632 Net block 2,617 15,373 15,464 24,111 30,671 Capital work in progress 8 80 376 185 200 Goodwill 3,119 15,404 21,454 21,454 21,454 Investments 670 ‐ ‐ ‐ ‐ Inventories 2,644 4,394 7,839 7,930 9,595 Sundry debtors 1,153 3,840 4,725 5,547 6,705 Cash and equivalents 3,052 2,269 6,399 5,630 6,818 Loans and advances 2,247 3,394 3,645 3,645 3,645 Total current assets 9,095 14,043 22,874 23,018 27,028 Sundry creditors and others 5,326 7,276 11,626 12,321 14,957 Provisions 202 351 743 743 743 Total current liabilities & provisions 5,528 7,627 12,369 13,064 15,701 Net current assets 3,567 6,416 10,504 9,954 11,328 Miscellaneous expenditure ‐ ‐ ‐ ‐ ‐ Uses of funds 9,981 37,273 47,798 55,704 63,653Book value per share (INR) 31.0 53.3 82.7 95.3 110.6
Free cash flow (INR mn) Year to March FY10 FY11 FY12 FY13E FY14ENet profit 3,395 5,147 7,267 7,118 8,632Add : Non cash charge 347 524 (454) 2,311 2,800 Depreciation 236 499 644 753 939 Others 111 25 (1,098) 1,557 1,861 Gross cash flow 3,743 5,671 6,814 9,428 11,432 Less: Changes in WC (887) 2,487 (20) 218 186 Operating cash flow 4,630 3,184 6,833 9,210 11,246 Less: Capex 779 14,999 1,256 9,209 7,515 Free cash flow 3,851 (11,815) 5,577 1 3,731
Cash flow metrics Year to March FY10 FY11 FY12 FY13E FY14EOperating cash flow 3,405 2,061 10923 9,210 11,246Investing cash flow (265) (23,643) (8,502) (9,209) (7,515) Financing cash flow (3,609) 22,375 (72) (770) (2,543) Net cash flow (469) 793 2,349 (768) 1,187 Capex (779) (14,999) (1,256) (9,209) (7,515) Dividends paid (1,490) (1,966) (2,890) (2,831) (3,433) Share issuance/(buyback) 51 15 17 ‐ ‐
10 Edelweiss Securities Limited
Consumer Goods
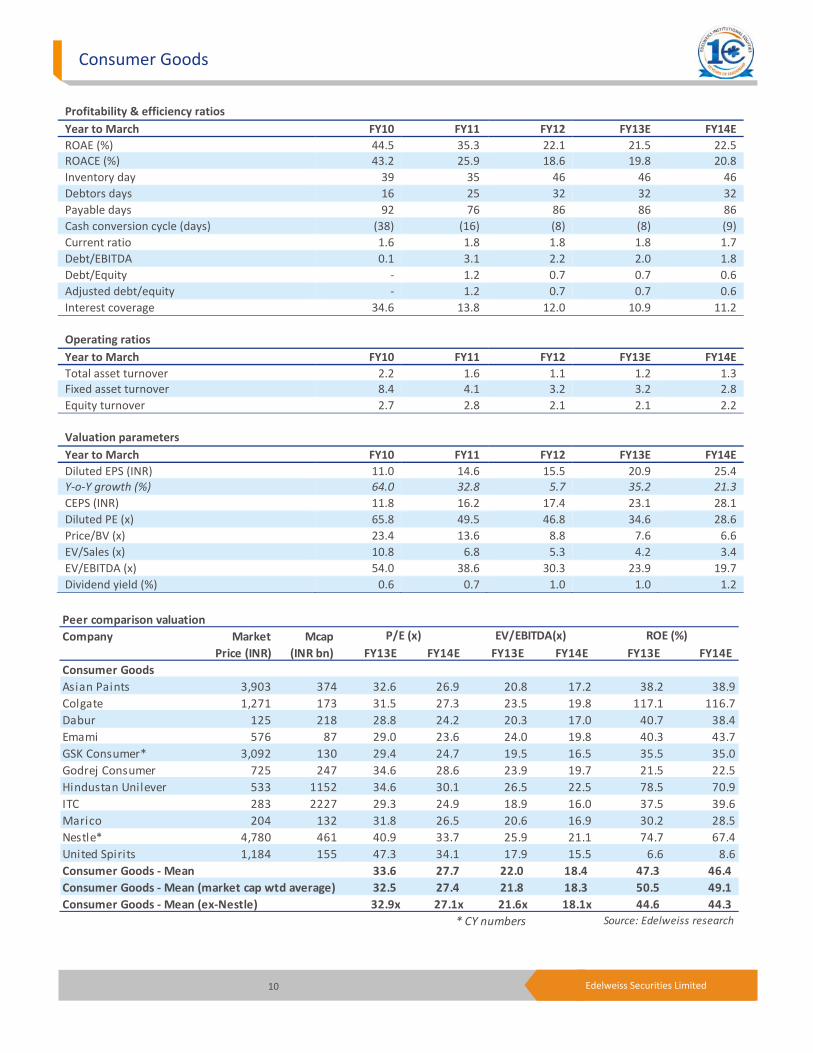
Profitability & efficiency ratios Year to March FY10 FY11 FY12 FY13E FY14EROAE (%) 44.5 35.3 22.1 21.5 22.5ROACE (%) 43.2 25.9 18.6 19.8 20.8 Inventory day 39 35 46 46 46 Debtors days 16 25 32 32 32 Payable days 92 76 86 86 86 Cash conversion cycle (days) (38) (16) (8) (8) (9) Current ratio 1.6 1.8 1.8 1.8 1.7 Debt/EBITDA 0.1 3.1 2.2 2.0 1.8 Debt/Equity ‐ 1.2 0.7 0.7 0.6 Adjusted debt/equity ‐ 1.2 0.7 0.7 0.6 Interest coverage 34.6 13.8 12.0 10.9 11.2
Operating ratios Year to March FY10 FY11 FY12 FY13E FY14ETotal asset turnover 2.2 1.6 1.1 1.2 1.3Fixed asset turnover 8.4 4.1 3.2 3.2 2.8 Equity turnover 2.7 2.8 2.1 2.1 2.2
Valuation parameters Year to March FY10 FY11 FY12 FY13E FY14EDiluted EPS (INR) 11.0 14.6 15.5 20.9 25.4Y‐o‐Y growth (%) 64.0 32.8 5.7 35.2 21.3 CEPS (INR) 11.8 16.2 17.4 23.1 28.1 Diluted PE (x) 65.8 49.5 46.8 34.6 28.6 Price/BV (x) 23.4 13.6 8.8 7.6 6.6 EV/Sales (x) 10.8 6.8 5.3 4.2 3.4 EV/EBITDA (x) 54.0 38.6 30.3 23.9 19.7 Dividend yield (%) 0.6 0.7 1.0 1.0 1.2
Peer comparison valuationCompany Market Mcap
Price (INR) (INR bn) FY13E FY14E FY13E FY14E FY13E FY14EConsumer GoodsAsian Paints 3,903 374 32.6 26.9 20.8 17.2 38.2 38.9Colgate 1,271 173 31.5 27.3 23.5 19.8 117.1 116.7Dabur 125 218 28.8 24.2 20.3 17.0 40.7 38.4Emami 576 87 29.0 23.6 24.0 19.8 40.3 43.7GSK Consumer* 3,092 130 29.4 24.7 19.5 16.5 35.5 35.0Godrej Consumer 725 247 34.6 28.6 23.9 19.7 21.5 22.5Hindustan Unilever 533 1152 34.6 30.1 26.5 22.5 78.5 70.9ITC 283 2227 29.3 24.9 18.9 16.0 37.5 39.6Marico 204 132 31.8 26.5 20.6 16.9 30.2 28.5Nestle* 4,780 461 40.9 33.7 25.9 21.1 74.7 67.4United Spirits 1,184 155 47.3 34.1 17.9 15.5 6.6 8.6Consumer Goods ‐ Mean 33.6 27.7 22.0 18.4 47.3 46.4 Consumer Goods ‐ Mean (market cap wtd average) 32.5 27.4 21.8 18.3 50.5 49.1 Consumer Goods ‐ Mean (ex‐Nestle) 32.9x 27.1x 21.6x 18.1x 44.6 44.3
* CY numbers Source: Edelweiss research
P/E (x) EV/EBITDA(x) ROE (%)
11 Edelweiss Securities Limited
Company Absolute
reco
Relative
reco
Relative
risk
Company Absolute
reco
Relative
reco
Relative
Risk
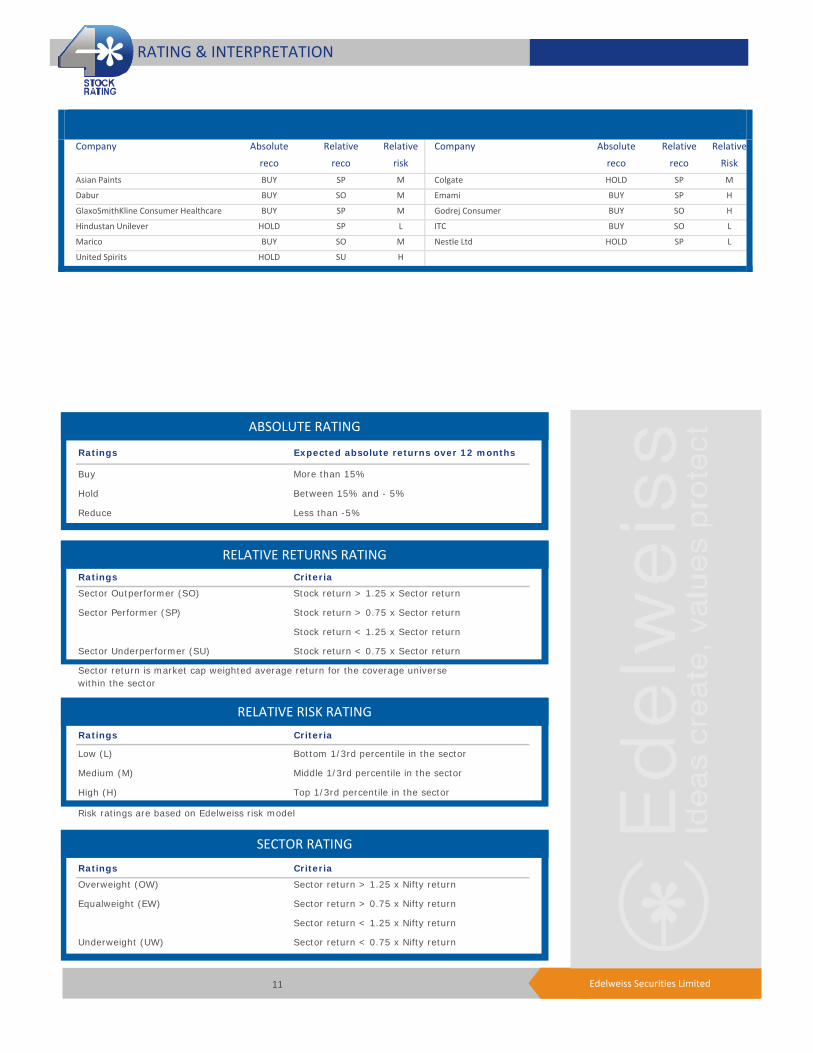
Asian Paints BUY SP M Colgate HOLD SP M
Dabur BUY SO M Emami BUY SP H
GlaxoSmithKline Consumer Healthcare BUY SP M Godrej Consumer BUY SO H
Hindustan Unilever HOLD SP L ITC BUY SO L
Marico BUY SO M Nestle Ltd HOLD SP L
United Spirits HOLD SU H
RATING & INTERPRETATION
ABSOLUTE RATING
Ratings Expected absolute returns over 12 months
Buy More than 15%
Hold Between 15% and - 5%
Reduce Less than -5%
RELATIVE RETURNS RATING
Ratings Criteria
Sector Outperformer (SO) Stock return > 1.25 x Sector return
Sector Performer (SP) Stock return > 0.75 x Sector return
Stock return < 1.25 x Sector return
Sector Underperformer (SU) Stock return < 0.75 x Sector return
Sector return is market cap weighted average return for the coverage universe within the sector
RELATIVE RISK RATING
Ratings Criteria
Low (L) Bottom 1/3rd percentile in the sector
Medium (M) Middle 1/3rd percentile in the sector
High (H) Top 1/3rd percentile in the sector
Risk ratings are based on Edelweiss risk model
SECTOR RATING
Ratings Criteria
Overweight (OW) Sector return > 1.25 x Nifty return
Equalweight (EW) Sector return > 0.75 x Nifty return
Sector return < 1.25 x Nifty return
Underweight (UW) Sector return < 0.75 x Nifty return
12 Edelweiss Securities Limited
Consumer Goods
Edelweiss Securities Limited, Edelweiss House, off C.S.T. Road, Kalina, Mumbai – 400 098. Board: (91‐22) 4009 4400, Email: [email protected]
Vikas Khemani Head Institutional Equities [email protected] +91 22 2286 4206
Nischal Maheshwari Co‐Head Institutional Equities & Head Research [email protected] +91 22 4063 5476
Nirav Sheth Head Sales [email protected] +91 22 4040 7499
Coverage group(s) of stocks by primary analyst(s): Consumer Goods Asian Paints, Colgate, Dabur, Godrej Consumer , Emami, Hindustan Unilever, ITC, Marico, Nestle Ltd, GlaxoSmithKline Consumer Healthcare, United Spirits
Distribution of Ratings / Market Cap
Edelweiss Research Coverage Universe
Rating Distribution* 113 53 19 186* 1 stocks under review
Market Cap (INR) 114 58 14
Date Company Title Price (INR) Recos
Recent Research
02‐Nov‐12 Marico Packing a punch; Result Update
204 Buy
02‐Nov‐12 GSK Consumer
Margin BOOST; Result Update
3,020 Buy
30‐Oct‐12 ColgatePalmolive
Bites more into the toothpaste market; Result Update
1,237 Hold
> 50bn Between 10bn and 50 bn < 10bn
Buy Hold Reduce Total
Rating Interpretation
Buy appreciate more than 15% over a 12‐month period
Hold appreciate up to 15% over a 12‐month period
Reduce depreciate more than 5% over a 12‐month period
Rating Expected to
13 Edelweiss Securities Limited
Godrej Consumer
Access the entire repository of Edelweiss Research on www.edelresearch.com
DISCLAIMERGeneral Disclaimer:
This document has been prepared by Edelweiss Securities Limited (Edelweiss). Edelweiss, its holding company and associate companies are a full service, integrated investment banking, portfolio management and brokerage group. Our research analysts and sales persons provide important input into our investment banking activities. This document does not constitute an offer or solicitation for the purchase or sale of any financial instrument or as an official confirmation of any transaction. The information contained herein is from publicly available data or other sources believed to be reliable, but we do not represent that it is accurate or complete and it should not be relied on as such. Edelweiss or any of its affiliates/ group companies shall not be in any way responsible for any loss or damage that may arise to any person from any inadvertent error in the information contained in this report. This document is provided for assistance only and is not intended to be and must not alone be taken as the basis for an investment decision. The user assumes the entire risk of any use made of this information. Each recipient of this document should make such investigation as it deems necessary to arrive at an independent evaluation of an investment in the securities of companies referred to in this document (including the merits and risks involved), and should consult his own advisors to determine the merits and risks of such investment. The investment discussed or views expressed may not be suitable for all investors. We and our affiliates, group companies, officers, directors, and employees may: (a) from time to time, have long or short positions in, and buy or sell the securities thereof, of company (ies) mentioned herein or (b) be engaged in any other transaction involving such securities and earn brokerage or other compensation or act as advisor or lender/borrower to such company (ies) or have other potential conflict of interest with respect to any recommendation and related information and opinions. This information is strictly confidential and is being furnished to you solely for your information. This information should not be reproduced or redistributed or passed on directly or indirectly in any form to any other person or published, copied, in whole or in part, for any purpose. This report is not directed or intended for distribution to, or use by, any person or entity who is a citizen or resident of or located in any locality, state, country or other jurisdiction, where such distribution, publication, availability or use would be contrary to law, regulation or which would subject Edelweiss and affiliates/ group companies to any registration or licensing requirements within such jurisdiction. The distribution of this document in certain jurisdictions may be restricted by law, and persons in whose possession this document comes, should inform themselves about and observe, any such restrictions. The information given in this document is as of the date of this report and there can be no assurance that future results or events will be consistent with this information. This information is subject to change without any prior notice. Edelweiss reserves the right to make modifications and alterations to this statement as may be required from time to time. However, Edelweiss is under no obligation to update or keep the information current. Nevertheless, Edelweiss is committed to providing independent and transparent recommendation to its client and would be happy to provide any information in response to specific client queries. Neither Edelweiss nor any of its affiliates, group companies, directors, employees, agents or representatives shall be liable for any damages whether direct, indirect, special or consequential including lost revenue or lost profits that may arise from or in connection with the use of the information. Past performance is not necessarily a guide to future performance. The disclosures of interest statements incorporated in this document are provided solely to enhance the transparency and should not be treated as endorsement of the views expressed in the report. Edelweiss Securities Limited generally prohibits its analysts, persons reporting to analysts and their dependents from maintaining a financial interest in the securities or derivatives of any companies that the analysts cover. The information provided in these documents remains, unless otherwise stated, the copyright of Edelweiss. All layout, design, original artwork, concepts and other Intellectual Properties, remains the property and copyright Edelweiss and may not be used in any form or for any purpose whatsoever by any party without the express written permission of the copyright holders. Edelweiss might be engaged or may seek to do business with companies covered in its research. As a result, investors should be aware that the firm may have a conflict of interest that could affect the objectivity of this report. Investors should take informed decision and use this document for assistance only and must not alone be taken as the basis for their investment decision. Analyst Certification:
The analyst for this report certifies that all of the views expressed in this report accurately reflect his or her personal views about the subject company or companies and its or their securities, and no part of his or her compensation was, is or will be, directly or indirectly related to specific recommendations or views expressed in this report. Analyst holding in the stock: No. Additional Disclaimer for U.S. Persons
This research report is a product of Edelweiss Securities Limited, which is the employer of the research analyst(s) who has prepared the research report. The research analyst(s) preparing the research report is/are resident outside the United States (U.S.) and are not associated persons of any U.S. regulated broker‐dealer and therefore the analyst(s) is/are not subject to supervision by a U.S. broker‐dealer, and is/are not required to satisfy the regulatory licensing requirements of FINRA or required to otherwise comply with U.S. rules or regulations regarding, among other things, communications with a subject company, public appearances and trading securities held by a research analyst account.
This report is intended for distribution by Edelweiss Securities Limited only to "Major Institutional Investors" as defined by Rule 15a‐6(b)(4) of the U.S. Securities and Exchange Act, 1934 (the Exchange Act) and interpretations thereof by U.S. Securities and Exchange Commission (SEC) in reliance on Rule 15a 6(a)(2). If the recipient of this report is not a Major Institutional Investor as specified above, then it should not act upon this report and return the same to the sender. Further, this report may not be copied, duplicated and/or transmitted onward to any U.S. person, which is not the Major Institutional Investor.
In reliance on the exemption from registration provided by Rule 15a‐6 of the Exchange Act and interpretations thereof by the SEC in order to conduct certain business with Major Institutional Investors, Edelweiss Securities Limited has entered into an agreement with a U.S. registered broker‐dealer, Marco Polo Securities Inc. ("Marco Polo").
Transactions in securities discussed in this research report should be effected through Marco Polo or another U.S. registered broker dealer.
Copyright 2009 Edelweiss Research (Edelweiss Securities Ltd). All rights reserved


![Update on Cinthol Deostick launch [Company Update]](https://static.fdocuments.net/doc/165x107/56d6bcda1a28ab30168bbaac/update-on-cinthol-deostick-launch-company-update.jpg)