Goal THREE SuStainable enerGy · 2016-09-14 · Goal THREE SuStainable enerGy. fi ... • promote...
34
GOAL THREE SUSTAINABLE ENERGY
Transcript of Goal THREE SuStainable enerGy · 2016-09-14 · Goal THREE SuStainable enerGy. fi ... • promote...

2013 | Science Policy and PeoPle Victoria: State of the environment | PART B: GOAL NumBeR - TiTLe - iNSeRTeD AFTeR ALTeRATiONS
348
Goal THREE SuStainable enerGy

349
SUSTAINABLE ENERGY 350
3 A Modern Energy System for Victoria 350
Proposition 350
Context 350
3.1 A Change is Needed 351
RECoMMENdATIoN 17 352
3.2 Attributes of a Modern Energy System 353
3.2.1 Economically constructive 353
3.2.2 Emissions reduced 359
3.2.3 Energy-efficient 360
3.2.4 Empowering consumers 362
3.2.5 Equitable access 368
3.3 Transition is Complex but Necessary 370
3.3.1 What are others doing? 370
3.3.2 Carbon budgets: part of the change 373
3.4 Is a Modern (renewable) Energy System possible in Victoria? 378
3.5 A ‘Process’ for a Plan 380
RECoMMENdATIoN 18 381
References 590
DetaileD CHaPter Goal THREE

350
2013 | Science Policy and PeoPle Victoria: State of tHe environment | PART B: GoAL THREE SUSTAINABLE ENERGY
Goal THREE SuStainable enerGy
3 a Modern energy System for Victoria
Proposition
International and national responses to increases in energy costs and climate change are creating compelling pressures for the traditional energy sector to adjust its business model. Future energy supply will need to have lower greenhouse gas emissions in order to meet the challenges posed by climate change. The falling cost of renewables and the move to decentralised power generation add to the complexity of sustaining traditional energy business models. An opportunity exists for a system-wide reconsideration of how energy, in particular electricity, is supplied and used in Victoria.
ContextThe reconsideration needs to be integrated process, led by government, involving the business and community sectors, resulting in a Modern Energy System (MES) for Victoria. The transition to an MES needs to be characterised by regulatory certainty and policy alignment.
Public funds are needed to support this transition, and they should be allocated and managed as investments in the future prosperity of Victoria, ultimately adding to gross state product. The efforts of government need to be supported by, and leveraged against, the efforts of the community and business sectors.
Solar Trailer Sunraysia TAFE Mildura

349
3.1 a Change is neededIn the briefing ‘Distributed energy: Disrupting the Utility Business Model’ the following observation is made:
‘Utilityexecutivesaroundtheworldarewatchingtheriseofdistributedenergy systemsandtryingtodeterminethebestwaystoreacttothischallengetotheir
traditionalbusinesses.Theriseofdistributedenergy(DE)–smallerpower-generationsystemsforhomes,businessesandcommunities–isaresponsetoenvironmentalconcerns,risingpowerpricesandregulatorypressuresandincentives.’
B. Hannes and M. Abbott M, Bain & Company*
This analysis concludes that the growth of distributed energy will force change on utilities’ business models, noting that some of their most profitable customers will reduce their regular power consumption from the central grid in favour of locally produced power. Interestingly, the brief observes that the most profitable customers may still depend on the central grid for their emergency or peak use and as a consequence of this the energy utilities will have to maintain their costly infrastructure and power-generating capabilities even as revenues from consumption decline. In many markets, energy utilities are working with regulators to adapt to this structural change by promoting a pricing model based more on connectivity and capacity, and less on usage.
Alongside this change in the traditional energy utility model, investment in
renewable energy is growing. Since 2004, globally, it has increased six-fold.
Annual growth in investment (6%) is outstripping the growth rate of the global
economy (3.5–4%).2 Our major trading partners and competitors are engaged.
We will need a developed workforce capacity along the right policy settings. Australia is ranked only 17th among the G20 countries for preparedness to compete in a low-carbon economy.13
* Source: bain.com/Images/BAIN_BRIEF_distributed_energy_disrupting_the_utility_business_model.pdf.
350
2013 | Science Policy and PeoPle Victoria: State of tHe environment | PART B: GoAL THREE SUSTAINABLE ENERGY
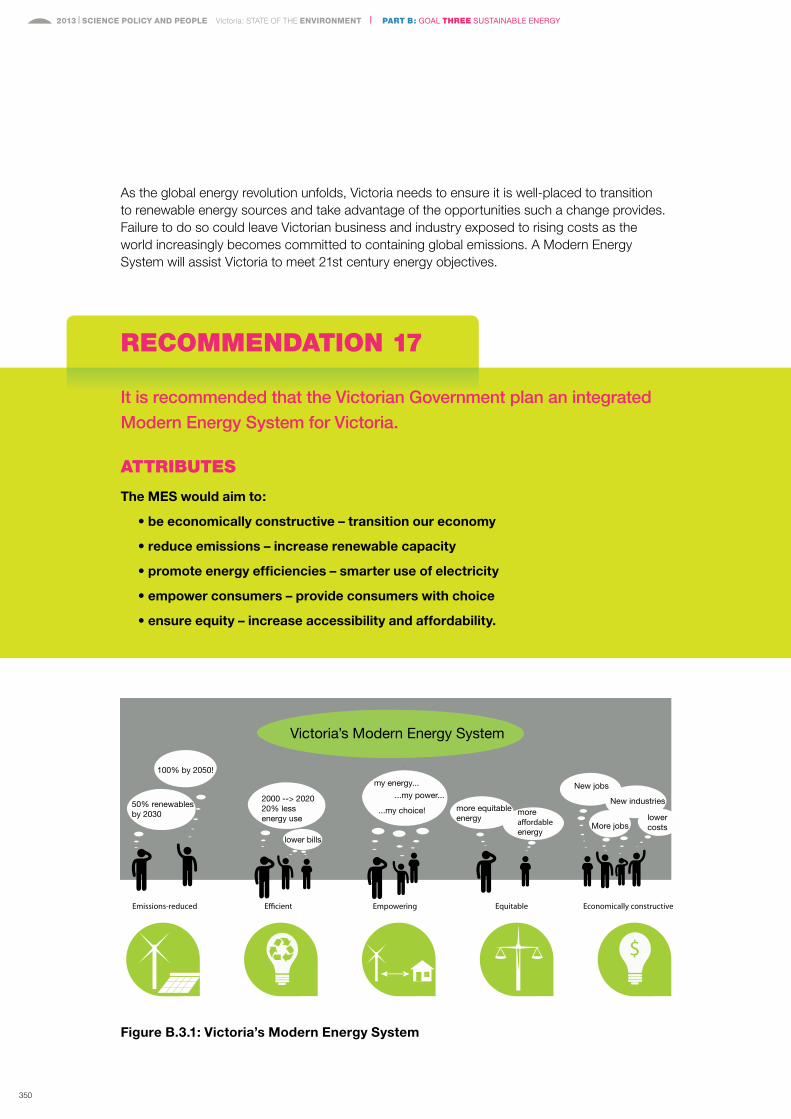
As the global energy revolution unfolds, Victoria needs to ensure it is well-placed to transition to renewable energy sources and take advantage of the opportunities such a change provides. Failure to do so could leave Victorian business and industry exposed to rising costs as the world increasingly becomes committed to containing global emissions. A Modern Energy System will assist Victoria to meet 21st century energy objectives.
FigureB.3.1:Victoria’sModernEnergySystem
REcommEndATion 17
It is recommended that the Victorian Government plan an integrated Modern Energy System for Victoria.
ATTRiBuTEs
TheMESwouldaimto:
•beeconomicallyconstructive–transitionoureconomy
•reduceemissions–increaserenewablecapacity
•promoteenergyefficiencies–smarteruseofelectricity
•empowerconsumers–provideconsumerswithchoice
•ensureequity–increaseaccessibilityandaffordability.

349
3.2 attributes of a Modern energy System3.2.1 EconomicallyconstructiveThe Modern Energy System (MES) described here represents a major component of a transition in the economy towards a better Victoria. For this to happen, the MES must be economically constructive. Federal government emissions policies will be important, providing market signals for investment.
The International Energy Agency (IEA) has identified four policies that could combine to achieve 80% of the emissions reductions required globally to keep us on track to stay below 2°C of warming.14 These can be implemented at no net economic cost by:
• introducing energy efficiency measures, particularly in relation to the operation of buildings
• limiting use of the least efficient coal-fired power stations
• reducing methane emissions from upstream oil and gas production
• phasing out fossil fuel subsidies.
In 2012, the Australian Bureau of Resource and Energy Economics (BREE)
projected that, by 2030, renewable energy sources such as wind and solar
photovoltaics will be cheaper to build than coal or gas-fired power stations.15
Since then, analysis by Bloomberg New Energy Finance found that this price point had already been reached.16 This means that any increases in energy demand could be met most economically through renewable energy. Even without carbon pricing, new wind energy capacity can be built 14% cheaper than coal.
Whatisrenewableenergy?3
Renewable energy is energy that can be obtained from natural resources that can be constantly replenished. Renewable energy technologies include technologies that use – or enable the use of – one or more renewable energy sources. Types of renewable energy technologies include:
• bioenergy
• geothermal energy
• hydropower
• hybrid
• ocean energy
• solar energy
• wind energy.
Renewable energy technologies also include those that:
• store energy generated using renewable energy
• predict renewable energy supply
• assist in the delivery of energy generated using renewable energy technologies to energy consumers.

350
2013 | Science Policy and PeoPle Victoria: State of tHe environment | PART B: GoAL THREE SUSTAINABLE ENERGY
Transition to a MES should lead to positive economic outcomes for Victoria. New manufacturing capacity can be created and regional centres can expect to be stimulated with additional jobs through more geographically diverse sources of energy. Higher-value manufacturing capacity and opportunities in research and development can be established.
As global efforts towards clean energy advance, our coal-dependent energy sector risks becoming an economic liability.13 Large structural changes might be necessary, but these can be harnessed to support economic development.
Proactive steps to reduce the ‘carbon exposure’ of local industries will arguably provide a competitive advantage.17 A rising demand for carbon-efficient products is expected, associated with the rising costs of using carbon-intensive energy and it is clear that businesses that use more renewable energy will have opportunities to reduce costs, improve geographic efficiencies and boost sales.
Transition to a MES is an opportunity for cost savings for business as well as significant employment opportunities, especially throughout regional Victoria. As is the case for all triple-bottom-line outcomes, the economic constructiveness of the transition to a MES should be determined over the long term – not within one or two electoral cycles.
BoostingjobsandstimulatingtheeconomyDuring the 2012 calendar year the contribution of renewable energy to Australia’s electricity supply broke 10% for the first time this century, producing more than 13% of the total – powering the equivalent of almost 4.2 million homes.12
There are extensive wind and solar resources across the state, and these resources ought to be exploited to maximise future state prosperity.
opportunity
The construction and maintenance of renewable energy facilities can be expected to create many jobs and stimulate the economy. This is especially in rural Victoria where the better opportunities for using wind and solar energy are found.
FigureB.3.2:Solarcostsandcapacity

349
Improvements in local skills are also expected. A recent senate inquiry into
the social and economic impacts of rural wind farms was told that wind farm
developers can source around 80% of employees from local communities.19
For example, a 50 MW wind farm can be expected to create around 160 local
jobs, with flow-on effects to the economy supporting a total of over 500 jobs
within the state.18
A recent joint report from the Australian Council of Trade Unions and the Australian Conservation Foundation reported that, across Australia, a concerted push towards the deployment of renewable energy would result in the creation of more than twice as many new jobs, compared to the business-as-usual growth scenario.20
CaseStudy:EconomicBenefitsofaWindFarmtotheLocalEconomy18
• Construction of a 50 MW wind farm provides a gross value added of some $50 million to a state and contributes up to 0.21 per cent to gross state product depending on the size of the state economy.
• Construction of a 50 MW wind farm is estimated to contribute up to 2.6 per cent to gross regional product depending on the size of the regional economy.
• Construction could lead to potential local personal expenditure of $25,000 per person per annum. If, for example, a wind farm had an average construction workforce of some 35 over a two-year construction period then the expenditure in the region would be some $875,000 in total per annum on accommodation, food and other services.
• The same wind farm could employ between five and six full-time-equivalent staff for operations and maintenance with a potential ongoing expenditure of $125,000–150,000 per annum.
• In addition, a 50 MW wind farm project is likely to provide up to $250,000 in payments to farmers and an ongoing community contribution that could be some $80,000 per annum for the life of the project.
• This expenditure is likely to be a minimum as wind farm developers’ policies of sourcing suppliers and services locally as far as possible also mean that transport, plant hire and materials such as crushed rock, cement, sand and gravel are likely to be provided from local sources.

350
2013 | Science Policy and PeoPle Victoria: State of tHe environment | PART B: GoAL THREE SUSTAINABLE ENERGY
WindturbineinstallationIn August 2011, the Victorian Government passed Amendment VC82 to the Victorian Planning Provisions.
This amendment prohibited the construction of wind turbines in a range of areas, including tourist areas such as the Great Ocean Road and ‘locations that feature a high degree of amenity’. Turbines cannot be erected within 2 km of a house without the written consent of the home owner (clause 52.32-3 State Planning Policy Framework; see also departmental policy and planning guidelines).21
The Explanatory Memorandum states that the amendment promotes ‘positive environmental, social and economic effects by facilitating a more balanced assessment of the impacts of a wind energy facility against these factors’.22
This change of policy and the new regulatory regime are critiqued as having the following impacts:
• Discouraging the shift to a low-carbon economy by entrenching existing forms of power generation.23
• Making it more difficult and more expensive to reduce our greenhouse gas emissions.24
• Arguably it will drive up the cost of electricity, because wind projects required for the RET will be built in areas with poorer wind resources, resulting in less return and higher cost.
• Damaging investment in Victoria, as energy companies are unwilling to take chances with such restrictive regulations.25, 26
• Many proposals for new wind farms in Victoria have been withdrawn.27
• Lost investment has been estimated at $4 billion and 3,000 jobs (figures calculated by Clean Energy Council).
• Turbine component manufacturers now going out of business or relocating interstate, depleting the skill base.28
The development of a Modern Energy System would provide the opportunity to reconsider the continued longer-term utility of such provisions.
Wonthaggi turbine

349
CaseStudy:MacarthurWindFarm*The 420 MW Macarthur Wind Farm is currently the largest of its kind in the southern hemisphere and is jointly owned by AGL Energy Limited (AGL) and Malakoff Corporation Berhad. It represents an investment of approximately $1 billion. It is located approximately 16 km east of the township of Macarthur in Western Victoria.
Construction of the Macarthur Wind Farm took approximately 2.5 years and it has been fully operational since late January 2013. It has the capacity to generate enough clean, green energy to power the equivalent of approximately 220,000 average Victorian households per year and also save approximately 1.5 million tonnes of greenhouse gases per year.
During the development and construction of the wind farm, the total number of jobs (including flow-on employment) was estimated at 875 from the region, 2,490 from Victoria and 2,782 from Australia. Eighteen local residents from south-west Victoria also make up the majority of the permanent site team responsible for the ongoing maintenance and operations of the Macarthur Wind Farm.
Macarthur Wind Farm
Source Google Images
CostsavingsforbusinessesIndustry is a major contributor to Victoria’s GHG emissions.29 Analysis by ClimateWorks Australia has found that, nationally, practical energy efficiency measures in industry could reduce energy consumption by 11%, at a financial saving of over $3 billion.30
Most of these savings relate to the use of natural gas. Barriers to the uptake of these energy efficiency measures include:
• lack of access to finance
• insufficient awareness of skills
• operational risks
• regulatory barriers
• supply chain barriers.
* www.agl.com.au/about-agl/how-we-source-energy/renewable-energy/macarthur-wind-farm.

350
2013 | Science Policy and PeoPle Victoria: State of tHe environment | PART B: GoAL THREE SUSTAINABLE ENERGY
EnvironmentandresourceefficiencyplansThe Victorian EPA has managed a program designed to help overcome some of these barriers. Large energy users were assisted to create Environment and Resource Efficiency Plans addressing water, waste and energy. The EREPs program has been terminated ahead of schedule due to overlap with federal reporting requirements, even though the state scheme contains some additional advantages.
Under the program, changes to processes that had payback times under three years were required to be carried out.
Acrossthe254participatingcommercialandindustrialsites,theprogramidentifiedcostsavingsof$90millionandemissionsreductionsofjustunder1%ofthestate’stotal,theequivalenttotaking180,000carsofftheroadeachyear.32
Energy efficiency of buildings
Retro-fitting existing buildings to become more energy-efficient is a straightforward way to reduce costs to business. (Approximately a quarter of Australia’s emissions come from use of buildings.46 This includes heating and cooling of our houses and use of electrical appliances.)
Buildings greater than 2,000 square metres (i.e. commercial office buildings), are governed by the new national Commercial Building Disclosure program. Designed to require disclosure of information about the energy efficiency of office space to potential occupants of that space, the program relies on measurements of efficiency provided under the National Australian Built Environment Rating System (NABERS). At the state level, Sustainability Victoria manages the ResourceSmart Commercial Buildings program.
In Victoria, government buildings (including school and tertiary education facilities, prisons, hospitals, sporting facilities, etc.) are eligible for the Greener Government Buildings program.33 This program is designed to help achieve both resource and cost savings. The program is projected to reduce the GHG emissions of government operations by 20% by 2020 while simultaneously saving $1 billion.34
Buildings in the City of Melbourne alone, dominated by commercial office space, account for almost 50% of the state’s total office buildings emissions. Much of this building stock is smaller than the 2,000 square metre threshold for the Commercial Buildings Disclosure program and the federal Green Building Fund.
Australian Catholic University windpower, Victoria Parade
349
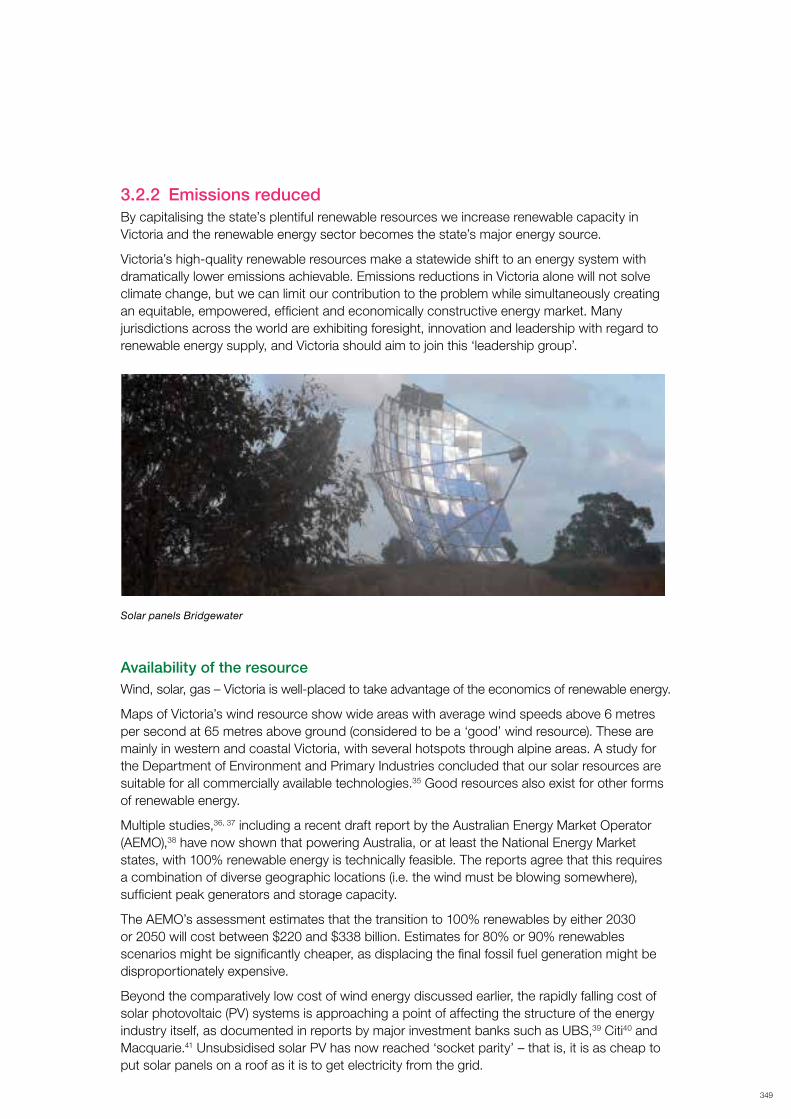
3.2.2 EmissionsreducedBy capitalising the state’s plentiful renewable resources we increase renewable capacity in Victoria and the renewable energy sector becomes the state’s major energy source.
Victoria’s high-quality renewable resources make a statewide shift to an energy system with dramatically lower emissions achievable. Emissions reductions in Victoria alone will not solve climate change, but we can limit our contribution to the problem while simultaneously creating an equitable, empowered, efficient and economically constructive energy market. Many jurisdictions across the world are exhibiting foresight, innovation and leadership with regard to renewable energy supply, and Victoria should aim to join this ‘leadership group’.
Solar panels Bridgewater
AvailabilityoftheresourceWind, solar, gas – Victoria is well-placed to take advantage of the economics of renewable energy.
Maps of Victoria’s wind resource show wide areas with average wind speeds above 6 metres per second at 65 metres above ground (considered to be a ‘good’ wind resource). These are mainly in western and coastal Victoria, with several hotspots through alpine areas. A study for the Department of Environment and Primary Industries concluded that our solar resources are suitable for all commercially available technologies.35 Good resources also exist for other forms of renewable energy.
Multiple studies,36, 37 including a recent draft report by the Australian Energy Market Operator (AEMO),38 have now shown that powering Australia, or at least the National Energy Market states, with 100% renewable energy is technically feasible. The reports agree that this requires a combination of diverse geographic locations (i.e. the wind must be blowing somewhere), sufficient peak generators and storage capacity.
The AEMO’s assessment estimates that the transition to 100% renewables by either 2030 or 2050 will cost between $220 and $338 billion. Estimates for 80% or 90% renewables scenarios might be significantly cheaper, as displacing the final fossil fuel generation might be disproportionately expensive.
Beyond the comparatively low cost of wind energy discussed earlier, the rapidly falling cost of solar photovoltaic (PV) systems is approaching a point of affecting the structure of the energy industry itself, as documented in reports by major investment banks such as UBS,39 Citi40 and Macquarie.41 Unsubsidised solar PV has now reached ‘socket parity’ – that is, it is as cheap to put solar panels on a roof as it is to get electricity from the grid.

350
2013 | Science Policy and PeoPle Victoria: State of tHe environment | PART B: GoAL THREE SUSTAINABLE ENERGY
* Commissioner for Environmental Sustainability, Foundation Paper one Climate Change
** www.esaa.com.au/Library/PageContentFiles/2c52db90-6475-4a3a-9fbd-959753d57267/120629_Where_are_electricity_sector_emission_heading.pdf
The Citi report also projects that solar PV will reach parity with baseload gas by 2017 – a significant development given AEMO projections that no additional generation capacity will be required to meet demand in Victoria until 2018–19.27 The continued technical development of renewables and their market penetration may mean that in Victoria gas will be used to provide peak generation capacity rather than be relied upon as the only alternative for baseload capacity.40
Policy alignment and integration across sectors will be required to enable a smooth transition to this lower-emissions system of electricity supply.
Divisionofresponsibilities
The Federal Government carries increasing responsibility for emissions reductions.
Despite this, there is still an important role for state governments. This includes:
• setting a strategic direction for energy policy
• providing information to facilitate the transition
• enacting planning regulations to boost the deployment of renewables
• creating incentives for deployment and uptake of renewables.
The Victorian Auditor-General has reported that the growth in Victoria’s ‘capacity to generate renewable energy is not on track to meet future targets’.43 As noted, the development of a Modern Energy System should include considerations of policy alignment and regulatory certainty and in that way work to ameliorate concerns such as those expressed by the Victorian Auditor-General.
3.2.3 Energy-efficientEnergy efficiency is the smarter use of energy. Emissions are reduced, costs are reduced and capital expenditure is deferred. Wide ranging and cost-effective efficiency measures will lead to lower electricity bills for consumers. Through better system planning and load control, peak demand can be significantly reduced, resulting in further cost savings.
Electricity consumption per person in Victoria has increased almost five-fold
since the 1960s.* Generation of electricity alone is responsible for 53% of all
Victoria’s greenhouse gas emissions.29
A Modern Energy System should make the most efficient use of the resources that are available, through changes to both the way we consume energy and the way we supply energy.
Efficiency helps address the affordability of energy by avoiding the need for investment in more energy supply infrastructure through reducing peak demand, and reducing the amount of electricity each efficient consumer needs to buy. This offsets electricity price increases, which are primarily a result of upgrading the capacity of the grid to meet electricity demand on a small number of hot days.44, 45
It should be noted, however, that reductions in electricity consumption need to be assessed cautiously. Reductions that are the result of efficiencies or avoidance of wasteful use are encouraged, however, reductions that come from decreased economic activity such as the closure of businesses or less consumer demand due to cost require attention.**

349
EnergySaverIncentiveThe primary State Government program to support improvements in energy efficiency at the residential and small business level is the Victorian Energy Efficiency Target, marketed as the Energy Saver Incentive (ESI).
The ESI aims to make energy efficiency measures more affordable for homes and businesses, by effectively subsidising for consumers a list of approved activities (such as buying energy-efficient appliances). The funds to support the program come from a levy on electricity consumers, proportionate with their use: the more electricity you use, the more you contribute to the program.
Data for the ESI projects it to achieve up to 7–8% reductions from business-as-usual by 2015 (approx. 3,400 GWh per year).47
A key improvement that could be made to the scheme is the reintroduction of the residential ceiling insulation. Insulation remains one of the most effective ways of reducing household energy consumption.
The ESI is complemented by a national framework on Greenhouse and Energy Minimum Standards (GEMS), which sets minimum energy efficiency and efficiency labelling standards for a wide range of appliances, including white goods, air-conditioners, televisions and light globes. Further, steps have been taken to create a national energy efficiency scheme comparable to the Victorian ESI.48
ExistinghomesThe Victorian Government has committed to raising all existing housing stock to a 5-star average energy efficiency.49 It has been estimated that improving an average 2-star house to a 5-star standard would save 32% of the total household energy consumption.50
A report by the ‘One Million Homes’ coalition of organisations focused on raising the energy efficiency of the 700,000 homes in Victoria that are currently eligible to receive concessions. It found that spending approximately $3,000 per house to raise these homes from an average of two stars to five stars would save $600 million over 10 years through reduced need for financial support through the concessions budget.50
While much can be done to improve the physical efficiency of buildings, the way we use our buildings can play a major role in total energy consumption.62
NewhomesHouses have been calculated to use approximately 60% of total household energy for heating and cooling.50 Much of this demand could be more effectively addressed both through superior building design, including better materials and insulation, and through smarter planning procedures, such as site orientation and street layout. These are cheaper solutions than using more energy, but for take-up to be encouraged such options also need to be the easier solution.
Since 2004, all new homes in Victoria have been required to meet a 5-star energy efficiency rating. In 2011, this was upgraded to 6 stars. Data over that period shows that household daily energy consumption in two- or three-year-old houses is markedly lower than that for houses over 10 years old (i.e. before the introduction of the 5-star standards).51
Energy use by buildings is a function not only of their efficiency (measured by energy per square metre), but also their total size.52 Gains from rising energy efficiency in/as a function of the shell of a house have been at least partly cancelled out by the rising size of the average new home, which in Australia is the largest in the world,52 as well as by energy-inefficient appliances that are used in many homes.

350
2013 | Science Policy and PeoPle Victoria: State of tHe environment | PART B: GoAL THREE SUSTAINABLE ENERGY
Emissions associated with the actual construction phase and the manufacture of building materials can account for up to 45% of total emissions over 50 years of a house’s operation.53 Modelling has shown that if housing stock is to be consistent with the strong emissions reductions targets required to mitigate climate change, houses ought to be built to a 9-star standard – assuming no significant reduction in house size.52
It follows that policy on housing must address total energy consumption as well as efficiency per square metre. Post-occupancy energy performance assessments, as currently take place for commercial buildings, would help develop an understanding of exactly how much energy a house consumes. Disclosure of a house’s performance as a whole, not per unit area, could help create a price signal for more energy-efficient houses.
Demandmanagement–settingtheregulatoryframework
Peak demand – typically on hot summer afternoons – is an important issue to
address because it is a major driver of investment in the electricity network. The
regulatory framework is the jurisdiction of the Commonwealth.
A recent Senate committee heard that significant amounts of money, perhaps as much as $16 billion,44 have been spent building the infrastructure needed to cope with peak demand that only occurs on a handful of days each year.54, 55 There is a strong argument that this expenditure could have been largely avoided through greater regulatory emphasis on reducing demand.44
The Senate committee agreed that ‘The current regulatory framework not only permits but incentivises inefficient over-investment in network infrastructure.’44 This echoed an earlier report published by the Department of Climate Change and Energy Efficiency.57 Regulations through the NEM that encourage reductions in demand (‘demand management’) have the potential to reduce emissions and provide cost savings.
Further developments to help reduce emissions would include rule changes that allow the Australian Energy Regulator to require distributors to make greater use of demand management. Only 5% of the Demand Management Incentive Allowance for 2011 was used by Victorian distributors,58 which demonstrates that even within the allowed budget for demand management there is significant scope for more concerted efforts.
A key recommendation from the Australian Energy Market Commission’s ‘Power of Choice’ report was to task AEMO with developing a rule change proposal that would allow for demand-side participation in the wholesale market – potentially creating a situation where third parties can be paid the wholesale spot price for reducing demand.59 At times of peak demand, when spot prices can reach $12,000/MWh (compared to a more typical $50/MWh), this provides a strong financial incentive for reducing consumption.
3.2.4 EmpoweringconsumersThe Modern Energy System should allow Victorians much more control over their energy use and provide consumers with choice. Through improved access to information and data, consumers are able to make better decisions about their energy use. Through reduced costs of domestic-scale renewables and battery storage, households are able to become more self-sufficient, and community groups are able to establish medium-scale generation capacity with local economic benefits.

349
As electricity networks developed through the 20th century, households mostly lost control of the energy they received. Distant, centralised, state-owned power stations became the dominant source of supply. Privatisation of the networks and retail competition in the late 20th century introduced some choice for consumers, but the real empowerment is just beginning.
Victoria’s Modern Energy System will support individuals through better provision of information such as usage data and will support households by facilitating distributed generation and models of community ownership.
The report by the Climate Commission, The Critical Decade: Australia’s Future – Solar Energy,60 provides an overview of the rapidly changing solar industry, including international developments and opportunities for Australia to better utilise and benefit from solar resources in the future. Solar photovoltaic (PV) systems have become more and more affordable. As prices have fallen, ordinary Australians have been quietly driving a solar revolution. Some of the key findings include:
• For Australian households the price of an average solar PV system has fallen to the point where solar is now competitive in some areas with daytime electricity prices.
• The cost of buying a solar PV system today is less than a quarter of the price a decade ago.
• Over 1 million rooftop solar PV systems have been installed in Australia, up from over 8,000 in 2007. About 2.6 million people, 11% of our population, now use the sun for their electricity needs.
• Queensland had the largest number of solar PV installations of any state, followed by New South Wales and Victoria. Australian households in outer metropolitan suburbs with high concentrations of home mortgages have a higher proportion of rooftops with solar PV than other suburbs.
FigureB.3.3:PVinsallationsinAustralia
Source aeMo 2012 australian Government
Sources AEMo, 2012a, Australian Government Solar Cities, 2012. ACT Government, 2013, CEC, 2013a Verve Energy, 2013 and data CER, 2013a, c, d. www.climatecommission.gov.au

350
2013 | Science Policy and PeoPle Victoria: State of tHe environment | PART B: GoAL THREE SUSTAINABLE ENERGY
CaseStudy:Thesuburbapowerstationofthefuture?
Suburbia energy
The suburban sprawl surrounding the world’s cities could become the power provider for energy-hungry city centres, according to a university research report.
A team of researchers headed by Professor Hugh Byrd from the UK’s University of Lincoln has revealed that far from suburban areas creating an energy drain, the increased adoption of rooftop solar photovoltaic (PV) panels on suburban roofs and an increase in use of electric vehicles (EVs), would give the outer suburbs the ability to harness excess energy for use in the city.
The‘TransformingCities’researchfoundthatlow-densitysuburbanhousinghasthepotentialtocaptureupto10timesmoreenergythancity-based,energy-hungrycommercialstructures.
‘This study challenges conventional thinking that suburbia is energy-inefficient, a belief that has become enshrined in architectural policy. In fact, our results reverse the argument for a compact city based on transport energy use, and completely change the current perception of urban sprawl,’ said Professor Byrd.
‘While a compact city may be more efficient for internal combustion engine vehicles, a dispersed city is more efficient when distributed generation of electricity by photovoltaic installations is the main energy source and electric vehicles are the principal mode of transport.‘
‘However, if this energy contribution is to be effective, controls of new suburban development may be needed that require the installation of photovoltaic roofing, along with smart meters and appropriate charging facilities for vehicles. City planners will need to make the changes necessary to control suburban development,’ he said.
Professor Byrd said rather than rebuilding cities, an embrace of smart technologies combined with dispersed suburban areas allows us the opportunity to power cities in a cost-effective way as well as reducing our needs on fossil fuels.
‘It is more a case of building for the future – when the climate will be warmer, harvesting solar energy will be cheaper than the grid and emerging technologies will replace the internal combustion engine. Particularly for city centre travel where longevity isn’t an issue, electric vehicles will become increasingly more attractive as their price drops with mass production and the cost of fuel continues to rise,’ said Professor Byrd.61

349
Regulation is needed to support such a transition as the Californian Case Study shows.
CaseStudy:Lancaster,Californialeadingwithsolarregulation*The Lancaster, California City Council unanimously approved changes to the city’s zoning code that require housing developers to install solar with every new home they build.
This is the latest piece in what Republican Mayor R. Rex Parris described at the City Council meeting as a plan to make Lancaster ‘the solar capital of the universe.’
Lancaster’s now official Residential Zones Update specifies, along with a range of green building provisions, that new single family homes meet minimum solar system requirements in the same way that they must meet minimum parking space requirements.
‘Thepurposeofthesolarenergysystemstandards,’itreads,‘istoencourageinvestmentinsolarenergyonallparcelsinthecity,whileprovidingguidelinesfortheinstallationofthosesystemsthatareconsistentwiththearchitecturalandbuildingstandardsoftheCity.’Itisfurtherintended‘toprovidestandardsandproceduresforbuildersofnewhomestoinstallsolarenergysystemsinanefforttoachievegreaterusageofalternativeenergy.’
Residential homes on lots of 7,000 square feet or more must have a solar system of 1.0 Kw to 1.5 Kw. Rural residential homes of up to 100,000 square feet must have a system of at least 1.5 Kw. The standards spell out simple, commonsense rules for both roof-mounted and ground-mounted systems. They also deal with some interesting issues:
• A builder’s model home must show the kind of solar system the builder will offer.
• Builders of subdivisions will be able to aggregate the houses’ requirements. If 10 houses in a subdivision each have a one-Kw requirement, the builder can install a single ten-Kw system, two five-Kw systems or four 2.5-Kw systems.
• If a housing tract is built in phases, each phase must meet the requirement.
• Multi-family developments can meet the requirement with a rooftop system, or a system on a support or shade structure.
• Finally, and importantly, builders ‘may choose to meet the solar energy generation requirement off-site by providing evidence of purchasing solar energy credits from another solar-generating development located within the City.’
Lancaster, with a population of 150,000, built approximately 200 new homes in 2012 and is on track to build at least as many – and therefore 200 more Kws of rooftop solar – this year, the mayor told GTM. But, at the height of the financial expansion in 2007, Lancaster added 2,800 new homes, which would be 2.8 megawatts of residential rooftop solar.
To turn his city into ‘a place the solar industry comes to innovate,’ Mayor Parris has led the City Council to:
• create the California Clean Energy Authority, which has brought in utility-scale solar developers like Silverado Power and a pipeline of 700 megawatts of large-scale solar within the city’s boundaries
* www.greentechmedia.com/articles/read/Lancaster-CA-Becomes-First-US-City-to-Require-Solar
350
2013 | Science Policy and PeoPle Victoria: State of tHe environment | PART B: GoAL THREE SUSTAINABLE ENERGY
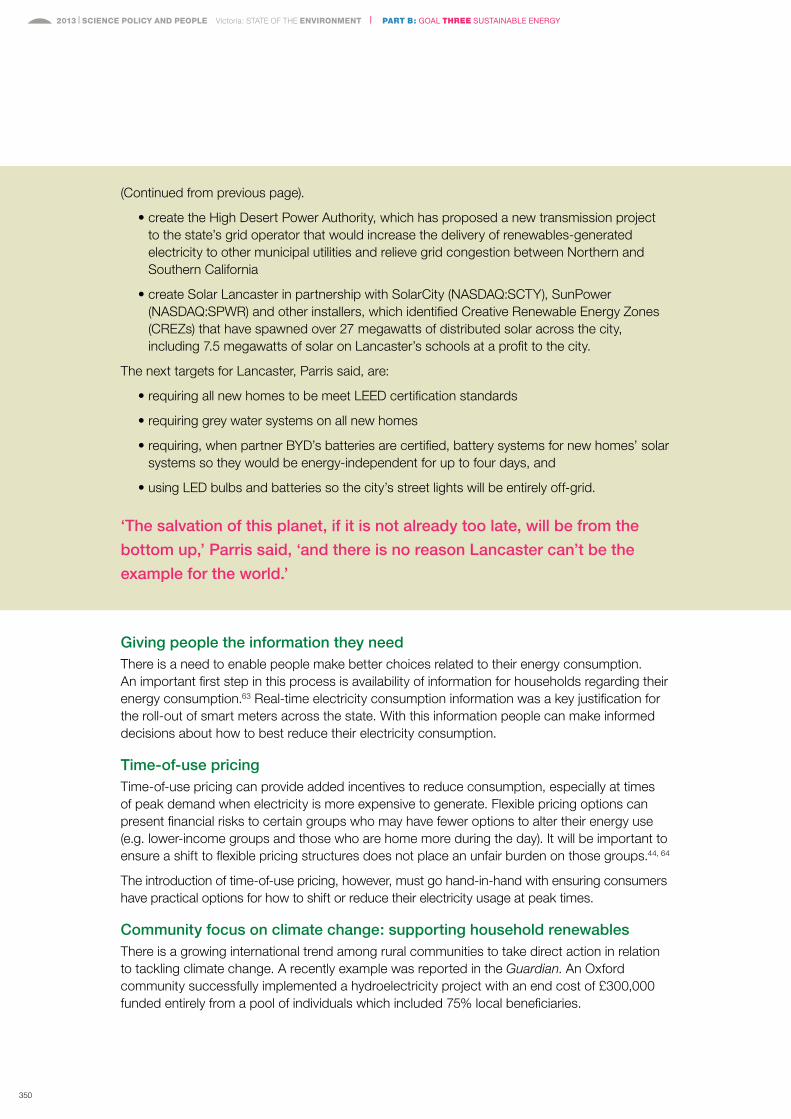
(Continued from previous page).
• create the High Desert Power Authority, which has proposed a new transmission project to the state’s grid operator that would increase the delivery of renewables-generated electricity to other municipal utilities and relieve grid congestion between Northern and Southern California
• create Solar Lancaster in partnership with SolarCity (NASDAQ:SCTY), SunPower (NASDAQ:SPWR) and other installers, which identified Creative Renewable Energy Zones (CREZs) that have spawned over 27 megawatts of distributed solar across the city, including 7.5 megawatts of solar on Lancaster’s schools at a profit to the city.
The next targets for Lancaster, Parris said, are:
• requiring all new homes to be meet LEED certification standards
• requiring grey water systems on all new homes
• requiring, when partner BYD’s batteries are certified, battery systems for new homes’ solar systems so they would be energy-independent for up to four days, and
• using LED bulbs and batteries so the city’s street lights will be entirely off-grid.
‘Thesalvationofthisplanet,ifitisnotalreadytoolate,willbefromthebottomup,’Parrissaid,‘andthereisnoreasonLancastercan’tbetheexamplefortheworld.’
GivingpeopletheinformationtheyneedThere is a need to enable people make better choices related to their energy consumption. An important first step in this process is availability of information for households regarding their energy consumption.63 Real-time electricity consumption information was a key justification for the roll-out of smart meters across the state. With this information people can make informed decisions about how to best reduce their electricity consumption.
Time-of-usepricingTime-of-use pricing can provide added incentives to reduce consumption, especially at times of peak demand when electricity is more expensive to generate. Flexible pricing options can present financial risks to certain groups who may have fewer options to alter their energy use (e.g. lower-income groups and those who are home more during the day). It will be important to ensure a shift to flexible pricing structures does not place an unfair burden on those groups.44, 64
The introduction of time-of-use pricing, however, must go hand-in-hand with ensuring consumers have practical options for how to shift or reduce their electricity usage at peak times.
Communityfocusonclimatechange:supportinghouseholdrenewablesThere is a growing international trend among rural communities to take direct action in relation to tackling climate change. A recently example was reported in the Guardian. An Oxford community successfully implemented a hydroelectricity project with an end cost of £300,000 funded entirely from a pool of individuals which included 75% local beneficiaries.

349
Community-driven sustainability projects are becoming more common in the
Northern Hemisphere in countries including Germany, Canada and the Netherlands,
generating significant energy by and for the local stakeholders who fund them.
In fact, Germany had 670 energy cooperatives operating or in development in 2011, with a key feature of all being that over 90% of the project was funded by local, individual investors.65
While in Australia, it appears that solar is the people’s choice, wind projects like Hepburn Wind show real leadership and community involvement. (see 3.5 for more information).
CaseStudy:AVictorianexemplar,HepburnWindAn example of local action on climate change is Australia’s first community owned renewable energy project, Hepburn Wind, located at Leonards Hill, 100 km north-west of Melbourne. The following time line illustrates the community’s commitment to long-term planning:
• 2004 – first meeting held at the town hall to discuss the proposal
• 2007 – planning permit for two wind turbines was secured
• 22 June 2011 – the turbines first generated electricity
• 5 November 2011 – Hepburn Wind had its official launch
The residents of Leonards Hill drew funding from grants and the contributions of individuals’ own savings. The entire project was estimated to cost $13.5 million, and the breakdown was thus:
• Capital from members and applicants – $9,640,225
• Sustainability Victoria RESF grant – $975,000
• Regional Development Victoria RIDF grant – $750,000
• Bendigo and Adelaide Bank loan (10 years, not fully drawn) – $3,100,000
• A debt guarantee from Embark Australia – $1,000,000.66
Hepburn Wind has proved such a huge success that the money raising activity that provided the initial project is being regenerated by locals to support a diverse range of activities. This arm, called, SHARE (Sustainable Hepburn Association – Renewing the Earth), aims to develop collaborations to support youth and local issues and also make a difference to their local environment, which includes harvesting and purchasing locally grown produce.
Climate change researchers from Japan visited the rural Victorian town to study the work done in Leonards Hill with the hope that Hepburn Wind’s success could be replicated within a Japanese cultural context.
The overseas scientists were particularly impressed with the careful and close communication maintained with local stakeholders, which helped to overcome an initial lack of understanding and support among the community. Hepburn Wind organisers also explained how they dealt with anti-wind protestors, emphasising professional, open communication with the wider public, all the while being supported by clear, scientific reasoning.
Ultimately, the trend towards community-led renewable energy projects demonstrates that action on climate change is not only possible, but successful at a local level. Furthermore, it demonstrates that individuals want to make real changes and understand the long-term cost benefits. SHARE is an example where community collaboration can start with green electricity and evolve into projects that can address wider environmental and social issues in the region.

350
2013 | Science Policy and PeoPle Victoria: State of tHe environment | PART B: GoAL THREE SUSTAINABLE ENERGY
FigureB.3.5:ThesolarchoiceinAustralia
Source Cer 2013
3.2.5 EquitableaccessWith the significant changes to the electricity sector that will be driven by both global economic trends and government policy, it is crucial that the interests of all Victorians are considered in the transition to a Modern Energy System, it should increase accessibility and affordability. This includes ensuring that efficiency initiatives and household-scale renewables are available to low-income and other disadvantaged groups.
Solar panels WestWyck Brunswick
AccesstogridOne of the primary barriers preventing the uptake of renewable energy in Victoria is a regulatory regime that remains tailored to traditional centralised generation processes. The current framework fails to recognise and accommodate the proliferation of distributed generation technology.44 Contrasted with traditional centralised generation, distributed (or embedded) generation involves a higher number of smaller scale energy production units. It typically involves small- to medium-scale renewables such as solar PV and wind, but can also include co- and tri-generation and small gas turbines.
There is currently no automatic right for distributed generators to connect to
the grid, and connecting to the grid remains at the discretion of the individual
utility companies.

349
A recent review by the Department of Climate Change and Energy Efficiency found that several regulatory requirements currently inhibit connection to the grid, including obtaining approval from network service providers and distributors, compliance with technical standards and registration charges payable by larger embedded generators for connection.57
Nonetheless, Victorian households are leaders in the uptake of solar, and the breakdown of suburbs provided at Figure 3.14 indicates that our outer suburbs are installing solar PV at faster rates than inner-city dwellers.
FigureB.3.6:LeadingpostcodesforinstalledSolarPV

350
2013 | Science Policy and PeoPle Victoria: State of tHe environment | PART B: GoAL THREE SUSTAINABLE ENERGY
3.3 transition is Complex but necessary3.3.1 Whatareothersdoing?Countries that account for 90% of the global economy have emissions reductions commitments, including China and India, and they are implementing policies and funding programs to achieve these reductions. These countries are also positioning themselves as renewable technology leaders as they see the benefits to their economies.
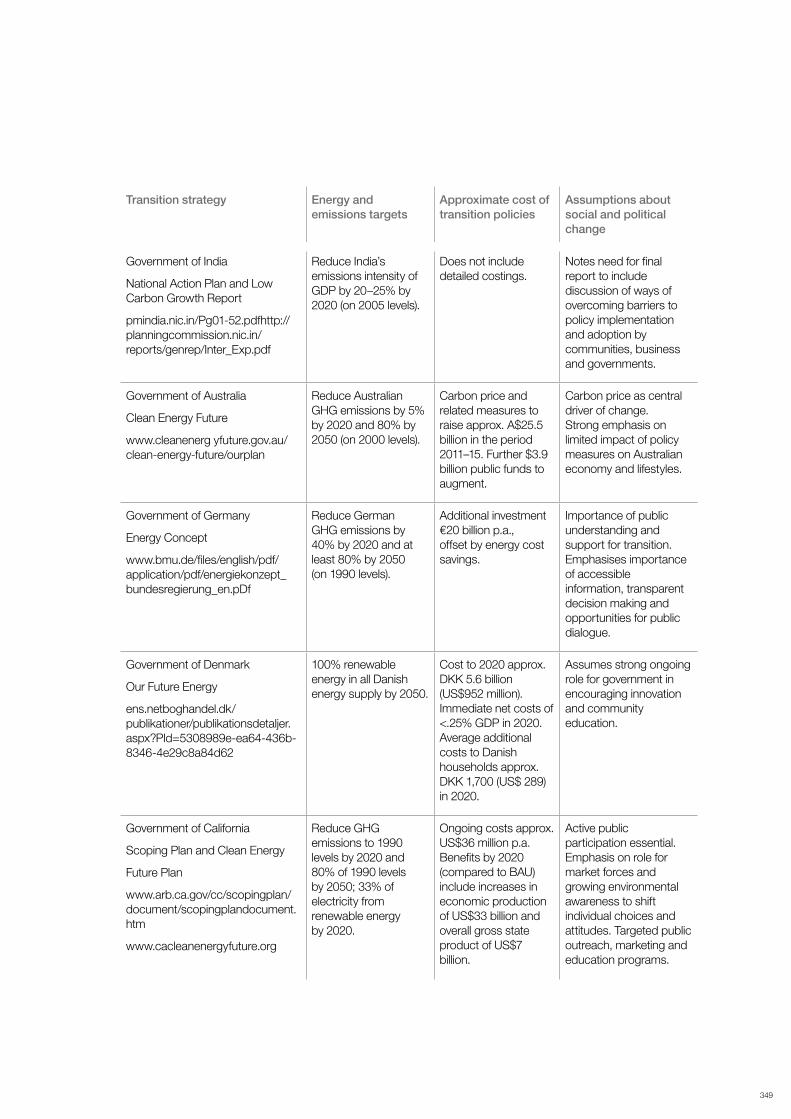
FigureB.3.7:Large-scaleeconomicdecarbonisationstrategies4
Overview of targets, costings and assumptions about social and political change
Transitionstrategy Energyandemissionstargets
Approximatecostoftransitionpolicies
Assumptionsaboutsocialandpoliticalchange
European Commission
Low Carbon Roadmap
eurlex.europa.eu/LexUriServ/LexUriServ.do?uri=COM:2011:0112: FIN:EN:PDF
Reduce EU GHG emissions by 20% by 2020 and 80–95% by 2050 (on 1990 levels).
Approx. €270 billion p.a. over 40 years (1.5% of EU GDP p.a. above 2009 investment levels). Savings between €175–320 billion p.a. (not incl. savings on social costs).
Political and social change drivers not covered in detail. Notes importance of policy innovation, public education and behaviour change.
Government of the United Kingdom
Carbon Plan
www.decc.gov.uk/en/content/cms/tackling/carbon_plan/carbon_plan.aspx
Reduce UK GHG emissions by 34% by 2020 and 80% by 2050 (on 1990 levels).
Total net present cost over lifetime of policies in past carbon budget periods approx £9 billion. Average cost 0.4% of UK GDP p.a. in period 2008–22 and 0.6% of UK GDP per year over 2023–27.
Importance of UK Government, industry and citizens ‘pulling in the same direction’ in order to achieve low carbon transition.
Government of South Korea
Green Growth Strategy
www.greengrowth.go.kr/english/en_main/index.do
Reduce Korean GHG emissions by 30% below projected 2020 levels (equivalent to 4% reduction on 2005 levels).
Total investment announced as part of Five-Year Plan (2009–13) US$83.6 billion.
Emphasis on education and raising public awareness about need for lifestyle change needed to support green growth.
Government of People’s Republic of China
12th Five-Year Plan and Climate Change White Paper
cbi.typepad.com/china_direct/2011/05/chinas-twelfth-fivenew-plan-the-fullenglish-version.html
www.gov.cn/english/official/2011-11/22/content_2000272.htm
Reduce Chinese CO2 emissions per unit of GDP by 40–45% by 2020 (on 2005 levels).
Total investment (public and private) in ‘new energy’ of approx RMB5 trillion (US$760 billion) over next 10 years.
Assumption of strong, ongoing role for coordinated government planning and intervention, consistent with overall Chinese economic and political governance arrangements.
349
Transitionstrategy Energyandemissionstargets
Approximatecostoftransitionpolicies
Assumptionsaboutsocialandpoliticalchange
Government of India
National Action Plan and Low Carbon Growth Report
pmindia.nic.in/Pg01-52.pdfhttp://planningcommission.nic.in/reports/genrep/Inter_Exp.pdf
Reduce India’s emissions intensity of GDP by 20–25% by 2020 (on 2005 levels).
Does not include detailed costings.
Notes need for final report to include discussion of ways of overcoming barriers to policy implementation and adoption by communities, business and governments.
Government of Australia
Clean Energy Future
www.cleanenerg yfuture.gov.au/clean-energy-future/ourplan
Reduce Australian GHG emissions by 5% by 2020 and 80% by 2050 (on 2000 levels).
Carbon price and related measures to raise approx. A$25.5 billion in the period 2011–15. Further $3.9 billion public funds to augment.
Carbon price as central driver of change. Strong emphasis on limited impact of policy measures on Australian economy and lifestyles.
Government of Germany
Energy Concept
www.bmu.de/files/english/pdf/application/pdf/energiekonzept_bundesregierung_en.pDf
Reduce German GHG emissions by 40% by 2020 and at least 80% by 2050 (on 1990 levels).
Additional investment €20 billion p.a., offset by energy cost savings.
Importance of public understanding and support for transition. Emphasises importance of accessible information, transparent decision making and opportunities for public dialogue.
Government of Denmark
Our Future Energy
ens.netboghandel.dk/publikationer/publikationsdetaljer.aspx?PId=5308989e-ea64-436b-8346-4e29c8a84d62
100% renewable energy in all Danish energy supply by 2050.
Cost to 2020 approx. DKK 5.6 billion (US$952 million). Immediate net costs of <.25% GDP in 2020. Average additional costs to Danish households approx. DKK 1,700 (US$ 289) in 2020.
Assumes strong ongoing role for government in encouraging innovation and community education.
Government of California
Scoping Plan and Clean Energy
Future Plan
www.arb.ca.gov/cc/scopingplan/document/scopingplandocument.htm
www.cacleanenergyfuture.org
Reduce GHG emissions to 1990 levels by 2020 and 80% of 1990 levels by 2050; 33% of electricity from renewable energy by 2020.
Ongoing costs approx. US$36 million p.a. Benefits by 2020 (compared to BAU) include increases in economic production of US$33 billion and overall gross state product of US$7 billion.
Active public participation essential. Emphasis on role for market forces and growing environmental awareness to shift individual choices and attitudes. Targeted public outreach, marketing and education programs.

350
2013 | Science Policy and PeoPle Victoria: State of tHe environment | PART B: GoAL THREE SUSTAINABLE ENERGY
CaseStudy:TheEUCovenantofMayors:SustainableEnergyActionPlans*In March 2007 the European Union’s leaders endorsed an integrated approach to climate and energy policy that aims to combat climate change and increase the EU’s energy security while strengthening its competitiveness. To start this process, the EU Heads of State and Government set a series of demanding climate and energy targets to be met by 2020, known as the ‘20–20–20’ targets. These are:
• a reduction in EU greenhouse gas emissions of at least 20% below 1990 levels
• 20% of EU energy consumption to come from renewable resources
• 20% reduction in primary energy use compared with projected levels, to be achieved by improving energy efficiency.
The Covenant of Mayors is the mainstream European movement involving local and regional authorities in the fight against climate change. It is based on a voluntary commitment by signatories to meet and exceed the EU 20% CO2 reduction objective through increased energy efficiency and development of renewable energy sources.
Localgovernmentsareseentoplayacrucialroleinmitigatingtheeffectsofclimatechange,allthemoresowhenconsideringthat80%ofenergyconsumptionandCO2emissionsisassociatedwithurbanactivity.
Actions speak for themselves
Covenant signatories represent cities, from small villages to major metropolitan areas such as London or Paris, which are committed to implement sustainable energy policies to meet and exceed the EU 20% CO2 reduction objective.
Notably the signatories undertake to prepare a baseline emissions inventory, which is a quantification of the amount of CO2 emitted due to energy consumption within a given period of time – the recommended base year being 1990. It allows the identification of the principal sources of CO2 emissions and their respective reduction potentials and requires the submission, within the year following their signature, of a Sustainable Energy Action Plan (SEAP). This is the key document in which the covenant signatory outlines how it intends to reach its CO2 reduction target by 2020. It defines the activities and measures set up to achieve the targets, together with time frames and assigned responsibilities. Covenant signatories are free to choose the format of their SEAP, as long as it is in line with the general principles set out in the covenant SEAP guidelines outlining the key actions they plan to undertake.
Beyond energy savings, the results of the actions of the signatories include:
• creation of skilled and stable jobs, not subject to delocalisation
• healthier environments and quality of life
• enhanced economic competitiveness
• greater energy independence.
These actions serve as examples for others to follow, through referring to the ‘Benchmarks of Excellence’, which are relevant examples of initiatives that covenant signatories, coordinators and supporters feel particularly proud of, and moreover endorse as useful actions for other local authorities, provinces, regions or networks to replicate.
* www.eumayors.eu/about/covenant-of-mayors_en.html

349
3.3.2Carbonbudgets:partofthechange‘Carbon budgets’ are playing a role in shifting the status quo. These budgets are based on the idea that if we understand how the planet will warm in response to certain concentrations of greenhouse gases in the atmosphere, then we can determine how much can be emitted to limit warming to a given level.
Current estimates are that, globally, approximately 1,000 billion tonnes of CO2-e can be emitted between 2000 and 2050 to make it likely that warming will be limited to 2°C above pre-industrial levels5 – thought to be the threshold between dangerous climate change and very dangerous climate change.6 In the 13 years since 2000, we have already consumed 40% of this budget.2
To meet the 2°C target, the International Energy Agency has calculated that only one-third of proven fossil fuel reserves can be burnt before 2050.7 Investment analysts are now looking at the effect this ‘unburnable carbon’ might have on the value of existing assets and on the ability to finance new fossil fuel operations.8, 9, 10
Wastedcapitalandstrandedassets
‘Smartinvestorscanseethatinvestingincompaniesthatrelysolelyorheavilyonconstantlyreplenishingreservesoffossilfuelsisbecomingaveryriskydecision.Thereportraisesseriousquestionsastotheabilityofthefinancialsystemtoactonindustry-widelongtermrisk,sincecurrentlytheonlymeasureofriskisperformanceagainstindustrybenchmarks.’
Professor Lord Stern7
Unburnable Carbon 2013: Wasted Capital and Stranded Asset1 a research report from Carbon Tracker and the Grantham Institute calls for regulators, governments and investors to re-evaluate energy business models against carbon budgets to prevent a $6 trillion carbon bubble in the next decade.
The report revealed that fossil fuel reserves already far exceed the carbon budget to avoid global warming of 2°C, but in spite of this, $674 billion was spent in 2012 to find and develop new potentially stranded assets.
Between 60–80% of coal, oil and gas reserves of publicly listed companies are
‘unburnable’ if the world is to have a chance of not exceeding global warming
of 2°C.
• The total coal, oil and gas reserves listed on the world’s stock exchanges equals 762GtCO2 – approximately a quarter of the world’s total reserves.
• If the same proportion is applied to the global carbon budgets to have an 80% chance of limiting global warming to 2°C, their allocation of the carbon budget is between 125GtCO2 and 225GtCO2, illustrating the scale of ‘unburnable carbon’. However companies in the coal, oil and gas sectors are seeking to develop further resources that could double the level of potential CO2 on the world’s stock exchanges to 1,541 billion tonnes.

350
2013 | Science Policy and PeoPle Victoria: State of tHe environment | PART B: GoAL THREE SUSTAINABLE ENERGY
Figure 3.2 shows that even a less ambitious target of 3°C would still apply significant constraints on our use of fossil fuel reserves.
FigureB.3.8:Listedfossilfuelreserves
The research indicates that globally, coal reserves are centred in Pacific and Eastern regions, while oil is predominant in Northern and Western regions of the world.
FigureB.3.9:Globalcoalreserves

349
The report notes that company valuation and credit ratings methodologies do not typically inform investors about their exposure to these stranded assets, despite these reserves supporting share value of $4 trillion in 2012 and servicing $1.27 trillion in outstanding corporate debt over the same period.
A challenge to these methodologies is recommended.
• To avoid systemic risks such as climate change, investors will have to demand to go beyond the traditional definition of risk as underperforming the benchmark.
• The rebalancing and redistribution of funds if required to protect shareholders’ interest and prevent wasted capital, the scale of which can be seen in Figure 3.4. Greater understanding of the uncertainty and risk around fossil fuels can help the redistribution of these funds towards alternatives more attractive.
The report makes a number of recommendations for action by governments, financial intermediaries, institutional investors and citizens to manage this risk.
FigureB.3.10:Recommendationsforgovernments
UnburnableCarbon:Australia’sCarbonBubbleFollowing the Carbon Tracker’s Unburnable Carbon 2013 global analysis, the Climate Institute assessed the risks facing the Australian coal, oil and gas sectors.11
Its report, Unburnable Carbon: Australia’s Carbon Bubble report reveals that Australia’s coal reserves are already more than double their market share of the precautionary global carbon budget for coal. Nevertheless, Australian listed companies spent an estimated A$6 billion on finding and developing more coal reserves.

350
2013 | Science Policy and PeoPle Victoria: State of tHe environment | PART B: GoAL THREE SUSTAINABLE ENERGY
Australia’scoalbudgetThe Climate Institute’s report finds that Australia contributes approximately 56GtCO2 of fossil fuel reserves. Australian fossil fuel production has a particularly high exposure to coal reserves, which make up 51GtCO2 of this total.
FigureB.3.11:Australiancoalandglobalbudgets
Coal resources are those coal stocks yet to be developed and with at least a
50% chance to be made economically viable. This gives an indication of what
companies are trying to bring online.
Australia’s total coal resources equal 300GtCO2, so applying a conservative estimate that only 50%of this will be proven (150GtCO2) reveals total holdings that take up 75% of the precautionary, lower limit global budget for coal.
Australian coal reserves 51GtCO2
Expected Australian coal resources 150GtCO2
2oC (80% probability) lower limit global budget = 200GtCO2
2oC (80% probability) upper limit global budget = 360GtCO2
Australian coal against global coal budgets

349
Australia’sexposuretointernationalmarketsThe report noted that:
• Although the ASX 200 (Australian Securities Exchange) has a disproportionately high exposure to Australian coal in a carbon-constrained future, 61% of this coal is listed on international stock exchanges. This leaves Australian coal highly vulnerable to the behaviour and decisions in which they have no say at all.
And the report further explained:
• The UK has as much Australian coal listed on it as the ASX, and recently pressure has been rising on the Financial Policy Committee to mitigate the risk these ‘sub-prime’ fossil fuel assets pose to economic stability.
• Australia’s coal is exported for a total value of A$48 billion, but most of its key export markets are implementing significant climate regulations.
FigureB.3.12:ClimatepolicyinAustralia’sexportmarkets
As the comparison to global coal budgets illustrate, Australia will have a vast oversupply of coal assets in a carbon-constrained world, therefore running the risk of being left with significant stranded assets.
Metallurgical coal export destinations (Mt). 2012
Thermal coal export destinations (Mt). 2012
Japan 69.73 40.20
Taiwan 17.52 4.51
India 29.30
EU 0.0417.63
Brazil 2.34
Strong effort
Moderate effort
Some effort
No effort
No effort estimate
No target
No data
China 28.46 9.84
Korea 28.85 8.86
33
Metallurgical coal export destinations (Mt). 2012
Thermal coal export destinations (Mt). 2012
Japan 69.73 40.20
Taiwan 17.52 4.51
India 29.30
EU 0.0417.63
Brazil 2.34
Strong effort
Moderate effort
Some effort
No effort
No effort estimate
No target
No data
China 28.46 9.84
Korea 28.85 8.86
33
Climate policy measures in Australia’scoal export markets

350
2013 | Science Policy and PeoPle Victoria: State of tHe environment | PART B: GoAL THREE SUSTAINABLE ENERGY
3.4 is a Modern (renewable) energy System possible in Victoria?Against this background of national and sub-national policy settings and industry engagement, along with science and advance investment risk profiles: The question is: Could100%ofVictoria’senergyneedsbemetbyrenewablesourcesatsometimeinthefuture?
This is the question the Department of Environment and Primary Industries of Victoria asked, and the following are the results of an independent assessment undertaken by consultants SKM.
OurfindingsshowthatVictoriahasmorethansufficientuseablerenewableresources,bothonanabsolutebasisandonan‘energyuseperperson’basis,toconceivablymeetallourenergyneedsfromrenewablesources.Thefigurebelowshowsthecomparisonbetweenuseablerenewableenergyresourcesandconsumptionlevelsnowandprojectedin2030.
FigureB3.13:UseablerenewableenergyresourcesandenergyconsumptioninVictoria
TheoreticalPJ/y
UsablePJ/y TheoreticalGWh/y
UsableGWh/y
Wind 15,930 5,631 4,425,115 1,564,118
Solar 32,781 2,515 9,105,794 698,656
Geothermal >>271 181 >>75,369 50,141
Hydro 57 3 15,000 934
Biomass >>57 33 >>15,863 9,294
Wave >>27 27 >>7,438 7,438
Tidal >>0.1 0.1 >>39 39
TOTAL >>49,121 8,390 >>13,644,618 2,330,619
Wind and solar energy resource potentials make up the bulk of the useable energy amounts. Accepting very high levels of either or both of these technologies would require:
• acceptance of the cost of these technologies relative to alternative sources (economic trade-offs)
• acceptance of the environmental impacts of these technologies, such as the impacts upon flora and fauna, relative to the impacts of alternatives
• acceptance of the social impacts such as visual impacts and changed employment patterns relative to alternatives.
These are clearly issues for consideration. However, they should not be considered in isolation, nor should they be seen as insurmountable. Technological advances, changes in international policy and world markets require a change in policy settings.

349
Figure B.3.14 shows the areas of Victoria with the greatest useable renewable energy potential. The renewable resources shown here reflect all the resource types considered, but are dominated by wind and solar resources. The areas with the greatest resources tend to be in the east and west of the state rather than near the main consumption centres in the Melbourne–Geelong area.
FigureB.3.14:RenewableenergypotentialforVictoria–LGAadministrativeboundariesandcoastalzonesrenewableenergypotentialperLGA
The SKM report states that ‘Because of the extent of Victoria’s renewable energy resource, Victoria can dream of a future where all its energy needs are met by renewable energy sources.’ But, it also notes that a commitment to follow a complete renewable energy pathway would almost certainly require an economic commitment of such a significant scale that it would impact on the achievement of many other of society’s economic needs and goals.
We now face a period of history where not making strategic economic decisions
of a transformational scale would in fact be a failure that results in our goals and
aspirations being denied and our prosperity challenged.
No Data
1.0 - 3.5 PJ/y
3.6 - 10.1 PJ/y
10.2 - 26.9 PJ/y
27.0 - 52.3 PJ/y
52.4 - 85.9 PJ/y
86.0 - 134.8 PJ/y
134.9 - 172.7 PJ/y
172.8 - 253.4 PJ/y
253.5 - 330.5 PJ/y
330.6 - 517.1 PJ/y
Victorian State Boundary
Renewable Energy Potential Per LGA Boundary and Coastal Zone
350
2013 | Science Policy and PeoPle Victoria: State of tHe environment | PART B: GoAL THREE SUSTAINABLE ENERGY
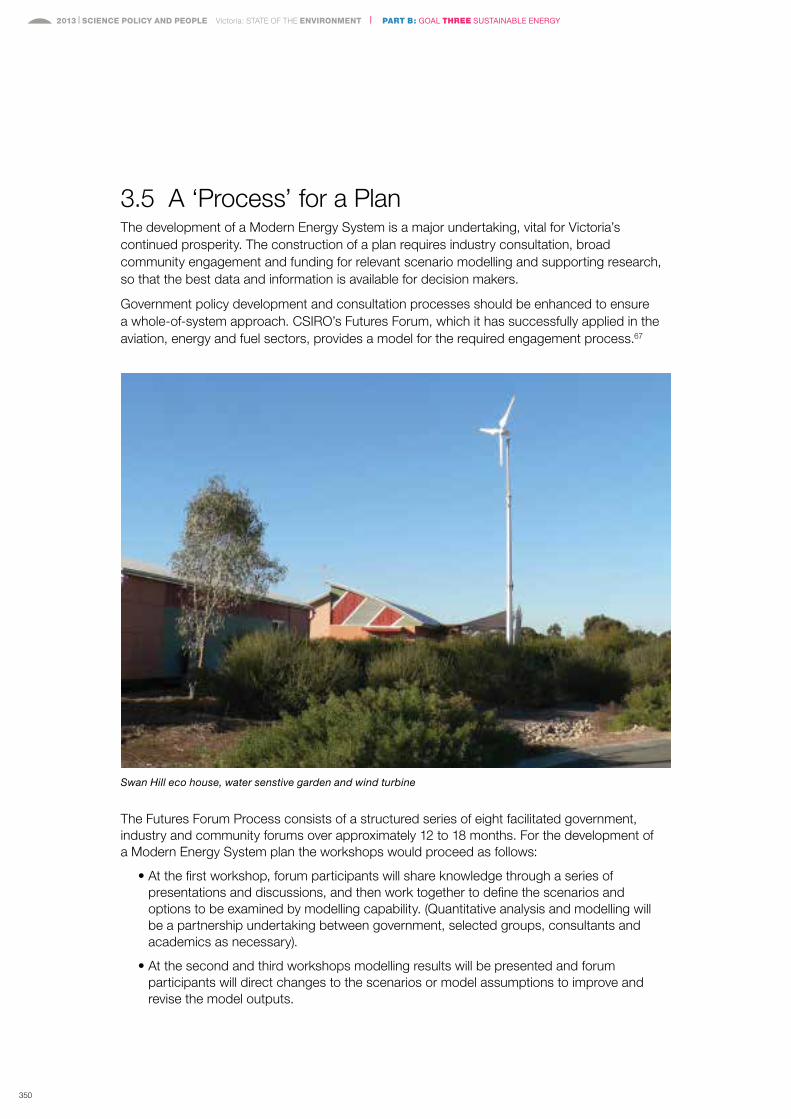
3.5 a ‘Process’ for a PlanThe development of a Modern Energy System is a major undertaking, vital for Victoria’s continued prosperity. The construction of a plan requires industry consultation, broad community engagement and funding for relevant scenario modelling and supporting research, so that the best data and information is available for decision makers.
Government policy development and consultation processes should be enhanced to ensure a whole-of-system approach. CSIRO’s Futures Forum, which it has successfully applied in the aviation, energy and fuel sectors, provides a model for the required engagement process.67
Swan Hill eco house, water senstive garden and wind turbine
The Futures Forum Process consists of a structured series of eight facilitated government, industry and community forums over approximately 12 to 18 months. For the development of a Modern Energy System plan the workshops would proceed as follows:
• At the first workshop, forum participants will share knowledge through a series of presentations and discussions, and then work together to define the scenarios and options to be examined by modelling capability. (Quantitative analysis and modelling will be a partnership undertaking between government, selected groups, consultants and academics as necessary).
• At the second and third workshops modelling results will be presented and forum participants will direct changes to the scenarios or model assumptions to improve and revise the model outputs.

349
• At the fourth and fifth workshops participants will provide a collective view of the challenges, opportunities and potential solutions (including policy and regulation options) for a Modern Energy Plan System sector that have been identified during group discussions and in the modelling outputs.
• In the remaining workshops forum participants will provide input to a the draft plan for a Modern Energy System that has been developed by the government project secretariat to capture and communicate the forum’s findings.
The CSIRO forum process does not seek to arrive at a consensus on specific recommendations for government policy or investment.
The draft plan can be used by the Victorian Government for consideration and decision. Depending on the issues raised and the suggested actions for development, the government might consider deferring decisions and using the draft plan as a basis for broad community consultation via a traditional ‘green’ and ‘white’ paper process.
CSIRO’s Futures Forums are used in the delivery of large, multi-stakeholder industry roadmap projects. The development needed for Victoria to have a Modern Energy System will require an ‘industry roadmap’.
Reflecting CSIRO’s process the Victorian Government should coordinate the project and provide support for a steering committee that includes representatives from across industry and community sectors. The process needs to be supported by actively engaging the sector, with a high level of consultation with all participants throughout. CSIRO sets out core roles and responsibilities of participants and the general functioning of the steering committee in a participant agreement to ensure clarity.
The CSIRO Futures Forum method is recommended, as it accommodates the complexity of issues and provides for:
• the balance of interests across sectors
• a whole-of-system evaluation
• the use of scenarios
• a comprehensive analytical framework.
REcommEndATion 18
It is recommended that the Victorian Government use the CSIRO’s Futures Forum model to develop a plan for a Modern Energy System.
ATTRiBuTEs
AppliedtothedevelopmentofaModernEnergySystemtheFuturesForummodelwoulddeliveraplanwhichincludesthefollowing:
•anagreedviewofthevariousoptionstobeconsidered
•identificationofregulatorybarriers,risks,benefitsandtrade-offs
•anactionagendarequiredtomovethoseoptionsforwardtowardsidentificationoftherolesofeachstakeholderinachievingthatgoal.